

Abstract
Aim
To examine the responsiveness and minimal important change (MIC) of two gait performance measures, the Functional Mobility Scale (FMS) and the Gillette Functional Assessment Questionnaire walking scale (FAQ), in a paediatric inpatient setting.
Method
Sixty‐four children and adolescents with a motor disorder, including cerebral palsy, traumatic brain injury, or stroke (25 females, 39 males; mean age [SD] 12y 6mo [3y 2mo], range 6–18y 6mo), were recruited. Physiotherapists scored the FMS and FAQ at the start and end of active gait rehabilitation. Change scores were compared with changes in gait capacity tests, the walking item of the Functional Independence Measure for Children, and a global rating scale (GRS) on the physiotherapists’ perceived change of the child's functional mobility. The GRS was also used to define the MIC.
Results
Change scores of the FMS and FAQ correlated between 0.35 and 0.49 with those of the capacity tests, 0.54 to 0.76 with the Functional Independence Measure for Children walking item change scores, and 0.57 to 0.76 with the GRS. The MIC values for the FMS and FAQ were 0.5 and 1.5 respectively.
Interpretation
FMS and FAQ can illustrate change in inpatient gait performance of children and adolescents with motor disorders. An improvement of one level in the FMS and two levels in the FAQ is considered as a clinically meaningful change.
What this paper adds
The Functional Mobility Scale (FMS) can detect change in children's inpatient gait performance.
The Gillette Functional Assessment Questionnaire walking scale (FAQ) can also detect change in children's inpatient gait performance.
A one‐level improvement in the FMS is clinically relevant.
A two‐level improvement in the FAQ is clinically relevant.
This article's abstract has been translated into Spanish and Portuguese.
Follow the links from the abstract to view the translations.
This article is commented on by Stout on page 629 of this issue.
Resumen
Medición del cambio en el desempeño de la marcha en niños con trastornos motores: evaluación de la Escala de Movilidad Funcional y el Cuestionario de Evaluación Funcional de Gillette
Objetivo
Examinar la sensibilidad y el cambio mínimo significativo de dos mediciones de desempeño de la marcha, la Escala de Movilidad Funcional (FMS) y el Cuestionario de Evaluación Funcional de Gillette (FAQ), en una población de pacientes pediátricos hospitalizados.
Método
Se reclutaron sesenta y cuatro niños y adolescentes con algún trastorno motor, incluyendo parálisis cerebral, lesión cerebral traumática o accidente cerebrovascular (25 mujeres, 39 varones; edad promedio [DE] 12a 6m [3a 2m], rango 6a – 18a 6m). Fisioterapeutas aplicaron las escalas FMS y FAQ al principio y final del proceso de rehabilitación activa de la marcha. Los puntajes de cambio fueron comparados con los cambios en pruebas de capacidad de marcha, el ítem de marcha de la escala WeeFIM (Functional Independence Measure for Children) y una escala global de calificación (EGC) sobre la percepción del fisioterapeuta del cambio en la movilidad funcional del niño. La EGC se utilizó, además, para definir el cambio mínimo significativo.
Resultados
Los puntajes de cambio de la FMS y el FAQ tuvieron una correlación de 0,35 a 0,49 con lo de la prueba de capacidad de marcha, 0,54 a 0,76 con el ítem de marcha de la escala WeeFIM, y 0,57 a 0,76 con la EGC. El cambio mínimo significativo para la FMS y el FAQ fueron 0,5 y 1,5, respectivamente.
Interpretación
La FMS y el FAQ permiten observar cambios en el desempeño de la marcha de pacientes pediátricos y adolescentes hospitalizados con trastornos motores. Un cambio positivo de un nivel en la FMS y de dos niveles en el FAQ se considera un cambio clínicamente significativo.
Resumo
Mensurando mudança no desempenho da marcha em crianças com desordens motoras: avaliando a Escala de Mobilidade Funcional a escala da marcha do Questionário de Avaliação Funcional Gillette
Objetivo
Examinar a responsividade e mínima mudança importante (MMI) de tduas medidas do desempenho da marcha, a Escala de mobilidade funcional (FMS), e a escala da marcha do Questionário de Avaliação Funcional Gillette (FAQ), em uma unidade de internação pediátrica.
Método
Sessenta e quatro crianças e adolescentes com uma desordem motora, incluindo paralisia cerebral, lesão cerebral traumática, ou acidente vascular encefálico (25 do sexo feminino, 39 do sexo masculino; média de idade [DP] 12a 6m [3a 2m], variação 6a–18a 6m), foram recrutadas. Fisioterapeutas pontuaram a FMS e FAQ no início e final da reabilitação ativa da marcha. Mudanças nos escores foram comparadas com mudanças nos testes de capacidade da marcha, no item de marcha da Medida de Independência Funcional para crianças, e uma Escala Global de Pontuação (EGP) sobre as mudanças percebidas pelos fisioterapeutas na mobilidade funcional da criança. A EGP também foi usada para determinar a MMI.
Resultados
Os escores de mudança da FMS e FAQ correlacionaram entre 0,35 e 0,49 com os dos testes de capacidade, 0,54 a 0,76 com a mudaça de escores no item de marcha da medida de Independência Funcional para crianças, e 0,57 a 0,76 com a EGP. A MMI para FMS e FAQ foi 0,5 e 1,5, respectivamente.
Interpretação
FMS e FAQ podem ilustrar mudanças no desempenho da marcha em crianças e adolescentes com desordens motoras que se encontram internados. Uma melhora de um nível na FMS e dois níveis na FAQ é considerada mudança clinicamente significativa.
Abbreviations
- FAQ
Gillette Functional Assessment Questionnaire walking scale
- FMS
Functional Mobility Scale
- GRS
Global rating scale
- MIC
Minimal important change
- ROC
Receiver operating characteristic
Clinicians and researchers rely on various outcome instruments when they evaluate the effects of interventions that aim at improving walking abilities in children with motor disorders. With regard to the International Classification of Functioning, Disability and Health for Children and Youth, most of these instruments can be linked to the body function domain or the capacity level of the activity domain.1, 2 Capacity describes what a child can do in a standardized controlled environment.3 Although walking capacity has an impact on walking performance (i.e. how a child actually moves in their environment in daily life), environmental and personal factors seem to play an even more important role and are valuable to integrate in constructs measuring walking ability.4 Within this perspective, walking performance is defined as how children actually move around in their current environment in everyday life.3
The Functional Mobility Scale (FMS) and the Gillette Functional Assessment Questionnaire walking scale (FAQ) are examples of the few tools that assess walking ability on a performance level. The FMS describes the level of a child's functional mobility in everyday life over 5m, 50m, and 500m, representing the home, school, and community settings respectively.5 For each distance, an ordinal rating from 1 to 6 is assigned depending on the amount of assistance required for the child's mobility. It is usually administered by a clinician in a semi‐structured interview using child‐report or parent‐report.5
The FAQ assesses the level of a child's functional mobility on an ordinal scale by describing various levels of mobility differing in environment, terrains, or obstacles.6 The scale ranges from 1 (the child cannot take any steps at all) to 10 (the child walks, runs, and climbs on level and uneven terrain without difficulty).6 It is a parent‐report or self‐report measure to identify the child's usual level of function. Both the FMS and the FAQ are easy to use and require no specific assessor training.7
To accurately measure and interpret a child's performance in clinical practice and research, assessments should be sufficiently valid, reliable, and responsive. The COnsensus‐based Standards for the selection of health Measurement INstruments group defined responsiveness as ‘the ability of an instrument to detect change over time in the construct to be measured’.8 Another relevant aspect is the degree to which one can assign qualitative meaning to scores or change scores: in other words, the interpretability of instruments.9 Minimal important change (MIC) is one aspect of interpretability and is defined as ‘the smallest change in score in the construct to be measured which patients perceive as important’.8 For this, change scores are related to a clinically meaningful reference (i.e. an anchor‐based approach) from a patient's or clinician's perspective. It is important that the anchor reflects the construct that the target instrument aims to measure.9
The FMS correlated moderately to very strongly (r s=0.58–0.89) with other gait measures in inpatient and outpatient settings.5, 10 Interrater agreement was substantial to almost perfect in ambulatory children with motor disorders.5, 11, 12 Furthermore, FMS scores obtained by parent interview and direct observation agreed substantially,13 and it seems to be responsive in an outpatient setting.5, 6, 11, 12, 13, 14
The FAQ showed almost perfect intrarater and interrater reliability as well as content and concurrent validity compared with other measures of gait function in children with various motor disorders.6 It has been used as an outcome measure after various interventions.15, 16 However, we are unaware of studies focusing on the evaluation of the responsiveness of the FAQ in a psychometric study design in outpatients or inpatients.
Thus, our aim was to investigate responsiveness of the FMS and FAQ in children and adolescents with motor disorders in an inpatient neurorehabilitation setting by examining the correlations between changes over time in FMS and FAQ scores with changes over time in standard functional and capacity measures. We formulated the following four hypotheses a priori, as follows. (1) Correlations between the change scores of the FMS and FAQ and the change scores of the comparator tests are positive and moderate to strong, with Spearman's correlation coefficients (r s) at least 0.4. (2) Correlations between a global rating scale (GRS) quantifying the therapists’ perceived change of the children's functional mobility in everyday life and the change scores of the FMS and FAQ are stronger than the correlations between the GRS and the change scores of the capacity measures. (3) The values of the area under the receiver operating characteristic (ROC) curves between the dichotomized GRS (no change versus change [improvement]) and the FMS and FAQ are at least 0.7. This threshold would indicate that the measures could discriminate between children whose walking performance remained unchanged versus those who changed (improved). (4) The change scores of the FMS and FAQ in children who had received surgery are larger than in non‐operated children.
Further, we determined the MIC of the FMS and FAQ by relating the change scores of the two measures to the treating physiotherapists’ perceived change of the children's functional mobility.
Method
Study design and setting
This prospective longitudinal psychometric study used a construct and criterion approach to evaluate responsiveness and an anchor‐based approach to assess the MIC of two gait performance measures. Measurements were performed at the Rehabilitation Center Affoltern am Albis of the Children's University Hospital Zurich, Switzerland. The centre provides inpatient and outpatient treatment for children and adolescents with predominantly congenital and acquired neurological disorders. The most frequent reasons for admission to the centre are postsurgical treatment and improving independence in everyday life activities. The study was approved by the Ethics Committee Zurich and registered on ClinicalTrials.gov (NCT02237222).
Participants
Children and adolescents were eligible for the study if they (1) were between 6 years and 18 years 11 months of age; (2) had an acquired or congenital motor diagnosis, such as stroke, traumatic brain injury, or cerebral palsy; (3) were inpatients at the rehabilitation centre; and (4) their rehabilitation programme contained therapy sessions in which they actively trained their gait function. Therapists reported children who met these inclusion criteria. These children and their parents subsequently received oral and written study information by a research assistant and were consecutively recruited between April 2014 and January 2016, provided that at least one parent understood German well. Signed informed consent and assent by the legal guardian and the child was given. Adhering to the criteria provided by the COnsensus‐based Standards for the selection of health Measurement INstruments (COSMIN) guidelines, we aimed for a sample size of at least 50.17 In total, 64 children and adolescents (25 females, 39 males; mean age [SD] 12y 6mo [3y 2mo], range 6–18y 6mo), were recruited.
Measures
For the FMS, we substituted the home (5m), school (50m), and community (500m) settings11 into mobility within the patient room, within the rehabilitation centre (between ward, therapies, and inpatient school), and outside the rehabilitation centre.
For the FAQ, we considered the children's functional mobility within the rehabilitation centre (levels 1–5) or outside the rehabilitation centre (levels 6–10).6
The 6‐Minute Walking Test investigates functional capacity.18 Limited to moderate evidence exists for its convergent validity with various body function parameters in children with chronic conditions. Its test–retest reliability in children with cerebral palsy is almost perfect,2, 19, 20 while evidence for its responsiveness is limited and only available for children with Duchenne muscular dystrophy.20
The 10‐Metre Walking Test evaluates self‐selected or maximal gait speed over a short distance.21 Relative test–retest reliability of the 10‐Metre Walking Test is high in children with neurological gait disorders.2, 19
The Gross Motor Function Measure‐88 is a standardized tool for measuring gross motor function in children with motor disabilities.22 The 24 ordinal‐scale items of the dimension E assess walking, running, and jumping abilities. The psychometric properties of the total Gross Motor Function Measure‐88 are well explored, especially in children with cerebral palsy.23 Evidence for the psychometric properties of the single dimensions is mostly unknown. Timed walking tests and the Gross Motor Function Measure Dimension E were mainly performed in children for whom these tests were clinically indicated as part of their inpatient rehabilitation programme.
The Functional Independence Measure for Children assesses a child's level of independence during various activities of daily living on the performance level (Uniform Data System for Medical Rehabilitation, Buffalo, NY, USA). The items are scored on a 7‐point ordinal scale. Intraclass correlation coefficients of the locomotion subscale are 0.94 to 0.97 for intrarater and 0.73 to 0.85 for interrater reliability, and correlations with mobility domains of other functional measures are strong.24, 25 We used only the walking item of the locomotion subscale.
A 5‐point GRS (much worse, somewhat worse, unchanged, somewhat better, much better), specifically designed for this study, was used as an anchor, quantifying the physiotherapists’ perceived change of the children's functional mobility by asking, ‘compared to the beginning of active gait rehabilitation, how has the child's functional mobility in everyday life changed in your opinion?’.
Study procedure
We used the German versions of both questionnaires, which had been approved by the authors of the original English versions. Details about the translation procedure and results on their reliability and validity are reported elsewhere.10, 12
Data on patients’ age, sex, diagnosis, and length of rehabilitation stay were collected from their electronic medical records. Measurements took place at two time points: T 0 at the start and T 1 at the end of the active gait rehabilitation programme. This period usually varies from 4 weeks to 6 months.
The physiotherapist who was mainly responsible for the therapy of the child completed the FMS and the FAQ at T 0 and T 1, and the GRS at T 1. As the therapists had no previous experience with the FMS or FAQ, they received brief protocolled instructions beforehand. To ensure that the therapists filled in the forms accurately and adhered to the standardized instructions, an independent research fellow (CA‐R) performed a standardized interview. Both instructions and interview were based on the directives found on the questionnaires. To reduce risk of bias, physiotherapists and the research fellow were unaware of the other test results and did not have access to T 0 ratings when scoring FMS, FAQ, and GRS at T 1. Details about the implementation of the other tests are outlined in Table SI (online supporting information).
Statistical analysis
Descriptive statistics are presented for relevant characteristics of the study population and outcome measures. We summarize continuously distributed data by the median (25th–75th centiles). SPSS version 24.0 (IBM SPSS Statistics, Armonk, NY, USA) was used for statistical analyses. We treated each FMS distance as a separate measure.
For hypotheses 1 and 2, we calculated Spearman's correlation coefficients and 95% confidence intervals employing bootstrapping, i.e. random sampling with replacement (bias corrected and accelerated method with 1000 samples), to quantify the relationship between the change scores of the FMS and FAQ, the comparator measures, and the GRS.26 We were interested in changes of the construct ‘walking capacity’ rather than in changes of each single capacity measure. Therefore, we averaged these correlations by transforming each of them into Fisher's z‐scores, summarized and averaged these scores, and finally transferred the averaged z‐scores back into a correlation coefficient.10 We interpreted values from 0 to 0.19 as very weak, 0.2 to 0.39 as weak, 0.4 to 0.59 as moderate, 0.6 to 0.79 as strong, and 0.8 and higher as very strong.27
To test hypothesis 3, we performed non‐parametric ROC curve analyses between the dichotomized GRS and the FMS and FAQ.28 We considered a value of the area under the ROC curves of at least 0.7 as appropriate to demonstrate the ability of the FMS and FAQ to discriminate between children who had improved and those who had not improved according to the therapists’ ratings on the GRS.29 For hypothesis 4, we used a Mann–Whitney U test to quantify the differences between the two groups and set the statistical level of significance for a two‐tailed test at α=0.05.
We calculated the Youden index (sensitivity + specificity − 1) for all points of the ROC curve and selected the maximum value of this index as the optimal cut‐off point for the MIC of the tools.29 Missing data were not replaced.
Results
The active gait rehabilitation period of the 64 participants (6–18y 6mo) lasted on average 46 days (SD 41.9d) and varied between 14 days and 295 days. Further characteristics of the study population and information on the measurements are presented in Table 1.
Table 1.
Characteristics of the study population (n=64)
| Median age (IQR) (y:mo) | 12:10 (4:11) |
| Sex (n) | |
| Female | 25 |
| Male | 39 |
| Diagnoses (n) | |
| Cerebral palsy | 35 |
| GMFCS level I | 7 |
| GMFCS level II | 10 |
| GMFCS level III | 12 |
| GMFCS level IV | 6 |
| TBI | 8 |
| Genetic disorders | 5 |
| Stroke | 5 |
| Encephalitis | 3 |
| Other | 8 |
| Surgery before rehabilitation (n) | |
| No | 43 |
| Median age (IQR) (y:mo) | 12:10 (5:4) |
| Yes | 21 |
| Median age (IQR) (y:mo) | 13:5 (4:7) |
| Missing dataa | |
| FMS 5m | — |
| FMS 50m | 2 |
| FMS 500m | 4 |
| FAQ | — |
| Score distribution of comparator tests; median (IQR) | |
| 10MWTss (m/s) | |
| T 0: | 0.59 (0.67) |
| T 1: | 0.76 (0.59) |
| 10MWTm (m/s) | |
| T 0: | 0.91 (0.76) |
| T 1: | 1.1 (0.9) |
| 6MinWT (m) | |
| T 0: | 221 (271) |
| T 1: | 307 (259) |
| GMFM E (%) | |
| T 0: | 47 (65) |
| T 1: | 56 (75) |
| WeeFIM walking | |
| T 0: | 5 (4) |
| T 1: | 6 (1) |
| Time range of measurements (d) | |
| T 0: median (IQR) | 3 (4) |
| T 1: median (IQR) | 2 (3) |
Missing data can be attributed to children who did not cover these distances in any form at the time of data collection. IQR, interquartile range; GMFCS, Gross Motor Function Classification System; TBI, traumatic brain injury; FMS, Functional Mobility Scale; FAQ, Gillette Functional Assessment Questionnaire walking scale; 10MWTss/m, 10‐Metre Walking Test self‐selected/maximal speed; T 0, start of active gait rehabilitation; T 1, end of active gait rehabilitation; 6MinWT, 6‐Minute Walking Test; GMFM E, Gross Motor Function Measure Dimension E; WeeFIM walking, Functional Independence Measure for Children walking item.
The functional abilities of the participants differed widely and ranged over the whole spectrum of the FMS and FAQ (Fig. 1). Thus, not all children were able to perform all capacity tests and/or at both time points (Table 1).
Figure 1.
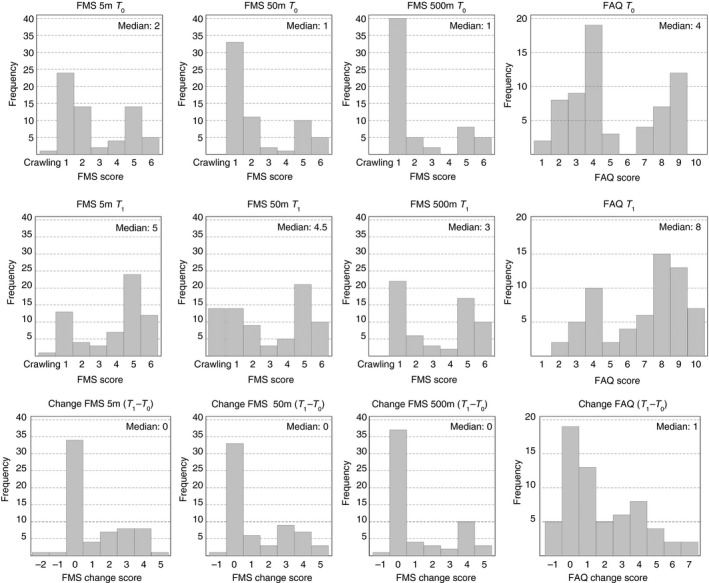
Frequency distributions of the Functional Mobility Scale (FMS) 5m, 50m, and 500m and the Gillette Functional Assessment Questionnaire walking scale (FAQ). T 0, start of active gait rehabilitation; T 1, end of active gait rehabilitation.
Change scores varied largely from −2 to 5 for the FMS and from −1 to 7 for the FAQ (Fig. 1).
Correlations between the change scores of the FMS and FAQ and the change scores of the comparator tests were all positive. The values of r s for the comparisons with change scores of the averaged capacity tests were 0.39, 0.49, and 0.40 for the FMS 5m, 50m, and 500m respectively and 0.35 for the FAQ, while those with the Functional Independence Measure for Children walking item change scores ranged from 0.54 to 0.76 (Table 2a).
Table 2.
Spearman's correlations (95% confidence intervals) between (a) the change scores of the Functional Mobility Scale (FMS), the Gillette Functional Assessment Questionnaire walking scale (FAQ), and other gait measures and (b) the global rating scale (GRS) of the therapists’ perceived change and the change scores of gait measures
| (a) Correlations between change scores of the FMS and FAQ and those of the comparator tests | ||||||
|---|---|---|---|---|---|---|
| ΔCapacity tests | Δ10MWTss | Δ10MWTm | Δ6MinWT | ΔGMFM E | ΔWeeFIM walking | |
| ΔFMS 5m | 0.39 (−0.06 to 0.72) | 0.20 (−0.45 to 0.72) | 0.47 (0.14 to 0.73) | 0.50 (0.18 to 0.75) | 0.37 (−0.08 to 0.68) | 0.54 (0.28 to 0.74) |
| n | 23 | 19 | 20 | 23 | 53 | |
| ΔFMS 50m | 0.49 (0.06 to 0.77) | 0.38 (−0.02 to 0.68) | 0.70 (0.43 to 0.85) | 0.36 (−0.14 to 0.71) | 0.45 (−0.16 to 0.79) | 0.73 (0.58 to 0.85) |
| n | 23 | 19 | 20 | 23 | 52 | |
| ΔFMS 500m | 0.40 (−0.15 to 0.77) | 0.40 (−0.08 to 0.73) | 0.35 (−0.37 to 0.77) | 0.41 (0.00 to 0.75) | 0.45 (−0.13 to 0.80) | 0.61 (0.39 to 0.79) |
| n | 22 | 19 | 20 | 23 | 50 | |
| ΔFAQ | 0.35 (−0.10 to 0.70) | 0.19 (−0.34 to 0.64) | 0.42 (−0.09 to 0.75) | 0.44 (0.08 to 0.72) | 0.36 (−0.06 to 0.68) | 0.76 (0.62 to 0.84) |
| n | 23 | 19 | 20 | 23 | 53 | |
| (b) Correlations between the GRS and change scores of the gait measures | |||||
|---|---|---|---|---|---|
| Performance measures | ΔFMS 5m | ΔFMS 50m | ΔFMS 500m | ΔFAQ | ΔWeeFIM Walking |
| 0.57 (0.36 to 0.73) | 0.67 (0.48 to 0.83) | 0.64 (0.47 to 0.76) | 0.67 (0.51 to 0.79) | 0.63 (0.43 to 0.79) | |
| n | 63 | 59 | 59 | 63 | 52 |
| Capacity measures | ΔCapacity tests | Δ10MWTss | Δ10MWTm | Δ6MinWT | ΔGMFM E |
| 0.36 (−0.13 to 0.71) | 0.45 (0.02 to 0.73) | 0.09 (−0.48 to 0.61) | 0.45 (0.04 to 0.74) | 0.43 (−0.06 to 0.74) | |
| n | 23 | 19 | 20 | 23 | |
Δ, change score; 10MWTss/m, 10‐Metre Walking Test self‐selected/maximal speed; 6MinWT, 6‐Minute Walking Test; GMFM E, Gross Motor Function Measure Dimension E; WeeFIM walking, Functional Independence Measure for Children walking item.
Correlations between the GRS and the change scores of the FMS and FAQ were moderate to strong and ranged from 0.57 to 0.76, while the GRS correlated weakly with the change scores of the averaged capacity tests (r s=0.36; Table 2b).
The ROC curve analyses between the dichotomized GRS (unchanged versus somewhat better/much better) and the FMS and FAQ change scores revealed values for the area under the ROC curves above the a priori defined threshold of 0.7 (FMS 5m, 50m, 500m, and FAQ: 0.79, 0.75, 0.76, and 0.80 respectively; see Fig. S1, online supporting information). No child was rated as somewhat worse/much worse on the GRS, although six children partly deteriorated in FMS or FAQ scores.
The median change scores in the non‐operated children were 0 for the FMS and 1 for the FAQ. In the postsurgical children, the median change scores were 3, 3, and 2 for the FMS 5m, 50m, and 500m respectively and 3 for the FAQ (Fig. 2). The differences were statistically significant for all change scores between the two groups (FMS 5m, 50m, 500m, and FAQ: z=−3.55, z=−3.78, z=−2.82, and z=−3.01 respectively; see Fig. 2).
Figure 2.

Comparison of change scores between children who had received surgery or not before undergoing rehabilitation. FMS, Functional Mobility Scale; FAQ, Gillette Functional Assessment Questionnaire walking scale; horizontal line, median; box, interquartile range; whiskers, ±1.5× interquartile range; small circle, mild outlier (more than 1.5× interquartile range); star, extreme outlier (more than 3× interquartile range).
The maximum value of the Youden index resulted in an optimal cut‐off point of 0.5 for each distance of the FMS and 1.5 for the FAQ. Thus, in practice, children have to improve at least one level on the FMS 5m, 50m, and 500m and two levels on the FAQ to achieve the MIC.
Discussion
We investigated the responsiveness of the FMS and FAQ on a construct‐based (correlations) and a criterion‐based (ROC curves) method with preset hypotheses in children and adolescents with motor disorders in an inpatient neurorehabilitation setting. Further, we calculated the MIC using an anchor‐based approach for the two measures.
Our results for the correlation strengths with the averaged capacity change scores only partly confirmed hypothesis 1, as only the FMS 50m and 500m reached the expected level of 0.4, whereas the correlations were lower for the FMS 5m and FAQ. These results were not in line with previous research in outpatients, which showed strong (positive) correlations between changes in FMS scores and changes in outcomes of other measures of functional activity assessed with questionnaires (r s=0.75–0.83) and activity monitors (r s=0.78–0.89).5
The stronger correlations of the FMS and FAQ with the change score of the Functional Independence Measure for Children walking item in our study may reflect that these measures all rate change in performance in everyday situations within the rehabilitation setting, while the capacity measures required the children to perform changes on their maximal level within a standardized test situation.
As information on the responsiveness of the clinically often‐used gait comparator measures is largely missing, we designed a GRS to estimate therapists’ perceived change of the children's functional mobility in parallel. Because the reliability of this GRS is unknown, we used it within a construct and criterion approach.9 Correlations between the GRS and the change scores of the FMS and FAQ were all moderate to strong, showing that the FMS and FAQ could adequately reflect the therapists’ judgements about the children's functional change in everyday life mobility during inpatient rehabilitation. As the correlation between the GRS and the change score of the averaged capacity tests was only weak, hypothesis 2 was confirmed. We could also confirm hypothesis 3, in which we used the GRS as the external criterion of the children's change in functional mobility. The values of the area under the ROC curves ranged between 0.75 and 0.80 and showed that both FMS and FAQ could be used to discriminate between children whose walking performance remained unchanged and those who improved.
We additionally compared the mean changes of the FMS and FAQ in subgroups of children who had undergone orthopaedic surgery and the other children, because the first group was expected to improve more than the other one. The first rating took place when children just started active gait rehabilitation and were allowed to start loading their legs after orthopaedic surgery. Because of this low initial level of walking ability, we expected the postsurgical children to improve more distinctly than the others. Despite the fact that the non‐surgical group also comprised children with acute acquired injuries whom we expected to undergo large improvements due to spontaneous neurological recovery in combination with the rehabilitation programme, we could confirm hypothesis 4. Also, a previous study on the FMS in the outpatient setting demonstrated longitudinal changes in the outcomes of the scale in children who had received orthopaedic multilevel surgery.5
It is important to notice that the potential of improvement largely depends on a child's basic motor abilities. Using Rasch analysis, Stout et al. provided a common scale for different classification systems and outcome measures of physical functioning. With that, they illustrated the probability of successfully performing tasks of different difficulty levels depending on an individual's present motor abilities.30 Consequently, a child with a score of 1 for the FMS 5m, 50m, and 500m at T 0 will have more space for improvement than a child entering rehabilitation with a score of 6. In our study, 38% of the children had a score of 1 over all three distances of the FMS (which decreased to 20% at the second measurement time point). Although this could be interpreted as a floor effect, it is not of interest so long as the measure is used to evaluate functional mobility for a child's walking ability.9 A ceiling effect was not an issue, as only 8% of the children had an initial score of 6 (compared with 17% at the end). For possible floor and ceiling effects of the FAQ, only 3% and 0% of the children had initially the lowest and highest possible scores respectively.
So far, responsiveness has only been evaluated for the FMS.5, 14 The correlations in our study were lower than previously reported. A reason may be that the other studies took place in the outpatient setting, exclusively looked at children after surgery, and used other comparator instruments. However, we were not able to test this assumption because in our study the sample sizes of specific subgroups were too small to calculate reliable correlations.
The MIC values indicate a 1‐point (FMS) and 2‐point (FAQ) increase to be clinically meaningful. These values seem logical from a contextual point, as each level of the FMS signifies the (in)dependence on/from another type of walking device, while the FAQ levels vary unevenly in terms of distance, environment, mobility, and independence. However, as both measures are ordinal‐scaled, the MIC may be different for children on the lower and higher ends of the scales. Our reported MIC of 2 for the FAQ is consistent with the overlapping item difficulty levels for the FAQ levels 5 and below and level 6 derived by Rasch analysis.30 Considering the results of the Rasch analysis, an MIC of 1 might be more likely for children classified in FAQ level 7 and higher at T 0. To address these potential differences over the whole range of the scales, thus enabling an estimation of the MIC for individual patients, larger samples of patients would be necessary to allow a differentiation between various motor ability subgroups.
Methodological considerations
The FMS distances represent children's usual surroundings (home, school, and community), which we had to substitute for the inpatient setting. However, previous research on the interrater reliability between health professionals, who measured inpatient everyday life mobility, and parents, who rated their child's mobility in the usual environments, provides evidence that our adaptations made for the inpatient setting seem to correspond well to the home setting.12 In line with the recommendations of de Vet et al.,9 we used an anchor‐based approach to assess the MIC, as this includes a definition of what is considered minimally important. Of course, the rating of the parents or even children could be considered most relevant in the context of MIC. However, because of the inpatient setting (parents are not present throughout the day; for most children it would be difficult to remember the initial situation), the GRS was rated by the therapists. For the same reasons, the therapists scored the FMS and FAQ, in contrast to the measures’ original test administration, which involved child‐report or parent‐report. The fact that the GRS was rated by the treating therapist could have resulted in a slight overestimation of the perceived change. Although we had to dichotomize the GRS ratings for the ROC analysis at an arbitrarily chosen cut‐off point, analyses showed that the MICs would not change with another selected cut‐off level. Unfortunately, we could not compare the MIC with the smallest detectable change, as the latter is still unknown for both measures.
Although we exceeded the targeted sample size of 50, the samples were smaller for the analyses with the capacity tests and the subgroups for surgical/non‐surgical intervention. Because we aimed for a representative sample of our inpatient rehabilitation setting, this meant that not every included patient was able to perform every test at both time points. This fact could have biased the reported correlations for hypotheses 1 and 2. However, as the groups with and without capacity test data did not differ systematically, the correlations can be applied to the entire patient sample. The duration between the two rating time points varied considerably, which is an inevitable characteristic in neurorehabilitation. At the same time, the heterogeneity of our sample in terms of age, diagnoses, mobility levels, and rehabilitation duration facilitates the transfer of our results to other inpatient settings.
Conclusion
We evaluated the responsiveness of the FMS and FAQ within a paediatric inpatient setting. We have shown that both tools are suitable for depicting the change that has occurred in children's gait performance. Moreover, the results facilitate the interpretation of FMS and FAQ scores in clinical practice and research by defining an MIC for both tools.
Supporting information
Figure S1: Receiver operating characteristic curve analysis between the dichotomized global rating scale and the Functional Mobility Scale and the Gillette Functional Assessment Questionnaire walking scale.
Table SI: Details of the test procedures for the comparator instruments
Acknowledgements
We thank all children, adolescents, and parents who participated in this research project. We thank Corina Klöti and the physiotherapists who helped collect the data. Further, we acknowledge funding by the Mäxi Foundation, Zurich, Switzerland, for this project. We also acknowledge the Children's Research Center of the University Children's Hospital Zurich and the Neuroscience Center Zurich. The authors have stated that they had no interests that might be perceived as posing a conflict or bias.
References
- 1. Zwicker JG, Mayson TA. Effectiveness of treadmill training in children with motor impairments: an overview. Pediatr Phys Ther 2010; 22: 361–77. [DOI] [PubMed] [Google Scholar]
- 2. Ammann‐Reiffer C, Bastiaenen CH, de Bie RA, van Hedel HJ. Measurement properties of gait‐related outcomes in youth with neuromuscular diagnosis: a systematic review. Phys Ther 2014; 94: 1067–82. [DOI] [PubMed] [Google Scholar]
- 3. Holsbeeke L, Ketelaar M, Schoemaker MM, Gorter JW. Capacity, capability, and performance: different constructs or three of a kind? Arch Phys Med Rehabil 2009; 90: 849–55. [DOI] [PubMed] [Google Scholar]
- 4. Wilson NC, Chong J, Mackey AH, Stott NS. Reported outcomes of lower limb orthopaedic surgery in children and adolescents with cerebral palsy: a mapping review. Dev Med Child Neurol 2014; 56: 808–14. [DOI] [PubMed] [Google Scholar]
- 5. Graham HK, Harvey A, Rodda J, Nattrass GR, Pirpiris M. The Functional Mobility Scale (FMS). J Pediatr Orthop 2004; 24: 514–20. [DOI] [PubMed] [Google Scholar]
- 6. Novacheck TF, Stout JL, Tervo R. Reliability and validity of the Gillette Functional Assessment Questionnaire as an outcome measure in children with walking disabilities. J Pediatr Orthop 2000; 20: 75–81. [PubMed] [Google Scholar]
- 7. Himuro N, Abe H, Nishibu H, Seino T, Mori M. Easy‐to‐use clinical measures of walking ability in children and adolescents with cerebral palsy: a systematic review. Disabil Rehabil 2017; 39: 957–68. [DOI] [PubMed] [Google Scholar]
- 8. Mokkink LB, Terwee CB, Patrick DL, et al. The COSMIN study reached international consensus on taxonomy of measurement properties for health‐related patient‐reported outcomes. J Clin Epidemiol 2010; 63: 737–45. [DOI] [PubMed] [Google Scholar]
- 9. de Vet HC, Terwee CB, Mokkink LB, Knol DL. Measurement in Medicine: A Practical Guide. Cambridge, UK: Cambridge University Press, 2011. [Google Scholar]
- 10. Ammann‐Reiffer C, Bastiaenen CHG, Klöti C, van Hedel HJA. Concurrent validity of two gait performance measures in children with neuromotor disorders. Phys Occup Ther Pediatr 2018. Jan 16; 10.1080/01942638.2017.1420003. [Epub ahead of print]. [DOI] [PubMed] [Google Scholar]
- 11. Harvey AR, Morris ME, Graham HK, Wolfe R, Baker R. Reliability of the Functional Mobility Scale for children with cerebral palsy. Phys Occup Ther Pediatr 2010; 30: 139–49. [DOI] [PubMed] [Google Scholar]
- 12. Ammann‐Reiffer C, Bastiaenen CHG, de Bie RA, van Hedel HJA. Interrater reliability of two gait performance measures in children with neuromotor disorders across two different settings. Dev Med Child Neurol 2017; 59: 1158–63. [DOI] [PubMed] [Google Scholar]
- 13. Harvey A, Baker R, Morris ME, Hough J, Hughes M, Graham HK. Does parent report measure performance? A study of the construct validity of the Functional Mobility Scale. Dev Med Child Neurol 2010; 52: 181–5. [DOI] [PubMed] [Google Scholar]
- 14. Harvey A, Graham HK, Morris ME, Baker R, Wolfe R. The Functional Mobility Scale: ability to detect change following single event multilevel surgery. Dev Med Child Neurol 2007; 49: 603–7. [DOI] [PubMed] [Google Scholar]
- 15. Stout JL, Gage JR, Schwartz MH, Novacheck TF. Distal femoral extension osteotomy and patellar tendon advancement to treat persistent crouch gait in cerebral palsy. J Bone Jt Surg Am 2008; 90: 2470–84. [DOI] [PubMed] [Google Scholar]
- 16. Trost JP, Schwartz MH, Krach LE, Dunn ME, Novacheck TF. Comprehensive short‐term outcome assessment of selective dorsal rhizotomy. Dev Med Child Neurol 2008; 50: 765–71. [DOI] [PubMed] [Google Scholar]
- 17. Terwee CB, Mokkink LB, Knol DL, Ostelo RW, Bouter LM, de Vet HC. Rating the methodological quality in systematic reviews of studies on measurement properties: a scoring system for the COSMIN checklist. Qual Life Res 2012; 21: 651–7. [DOI] [PMC free article] [PubMed] [Google Scholar]
- 18. ATS Committee on Proficiency Standards for Clinical Pulmonary . Function Laboratories. ATS statement: guidelines for the six‐minute walk test. Am J Respir Crit Care Med 2002; 166: 111–17. [DOI] [PubMed] [Google Scholar]
- 19. Graser JV, Letsch C, van Hedel HJA. Reliability of timed walking tests and temporo‐spatial gait parameters in youths with neurological gait disorders. BMC Neurol 2016; 16: 15. [DOI] [PMC free article] [PubMed] [Google Scholar]
- 20. Bartels B, de Groot JF, Terwee CB. The Six‐Minute Walk Test in chronic pediatric conditions: a systematic review of measurement properties. Phys Ther 2013; 93: 529–41. [DOI] [PubMed] [Google Scholar]
- 21. Watson MJ. Refining the Ten‐metre Walking Test for use with neurologically impaired people. Physiotherapy 2002; 88: 386–97. [Google Scholar]
- 22. Russell DJ, Rosenbaum PL, Cadman DT, Gowland C, Hardy S, Jarvis S. The Gross Motor Function Measure: a means to evaluate the effects of physical therapy. Dev Med Child Neurol 1989; 31: 341–52. [DOI] [PubMed] [Google Scholar]
- 23. Harvey A, Robin J, Morris ME, Graham HK, Baker R. A systematic review of measures of activity limitation for children with cerebral palsy. Dev Med Child Neurol 2008; 50: 190–8. [DOI] [PubMed] [Google Scholar]
- 24. Ottenbacher KJ, Taylor ET, Msall ME, et al. The stability and equivalence reliability of the functional independence measure for children (WeeFIM). Dev Med Child Neurol 1996; 38: 907–16. [DOI] [PubMed] [Google Scholar]
- 25. Ziviani J, Ottenbacher KJ, Shephard K, Foreman S, Astbury W, Ireland P. Concurrent validity of the Functional Independence Measure for Children (WeeFIM) and the Pediatric Evaluation of Disabilities Inventory in children with developmental disabilities and acquired brain injuries. Phys Occup Ther Pediatr 2001; 21: 91–101. [PubMed] [Google Scholar]
- 26. Ruscio J. Constructing confidence intervals for Spearman's rank correlation with ordinal data: a simulation study comparing analytic and bootstrap methods. J Mod Appl Stat Methods 2008; 7: 416–34. [Google Scholar]
- 27. Chung M. Encyclopedia of Measurement and Statistics. London: SAGE Publications, 2007. [Google Scholar]
- 28. Obuchowski NA. Receiver operating characteristic curves and their use in radiology. Radiology 2003; 229: 3–8. [DOI] [PubMed] [Google Scholar]
- 29. Terwee CB, Bot SD, de Boer MR, et al. Quality criteria were proposed for measurement properties of health status questionnaires. J Clin Epidemiol 2007; 60: 34–42. [DOI] [PubMed] [Google Scholar]
- 30. Stout JL, Gorton GE 3rd, Novacheck TF, et al. Rasch analysis of items from two self‐report measures of motor function: determination of item difficulty and relationships with children's ability levels. Dev Med Child Neurol 2012; 54: 443–50. [DOI] [PubMed] [Google Scholar]
Associated Data
This section collects any data citations, data availability statements, or supplementary materials included in this article.
Supplementary Materials
Figure S1: Receiver operating characteristic curve analysis between the dichotomized global rating scale and the Functional Mobility Scale and the Gillette Functional Assessment Questionnaire walking scale.
Table SI: Details of the test procedures for the comparator instruments