Abstract
This study aimed to investigate the effects of triggering receptor expressed on myeloid cell‐2 (TREM2) on the production of pro‐inflammatory mediators and cytokines induced by lipopolysaccharide (LPS) in BV2 microglia. TREM2 expression or TREM2‐specific siRNA were used to induce TREM2 overexpression or silencing. The BV2 cells were pre‐treated with the PI3 K inhibitor of LY294002 for 1 h and stimulated with LPS for 24 h. Then, the cell viability, apoptosis, phagocytosis, nitric oxide (NO), lactate dehydrogenase (LDH), and cytokine production, as well as the activation of AKT and NF‐kB were determined, respectively. We found LPS stimulation significantly reduced BV2 cell viability, enhanced BV2 cell phagocytosis and apoptosis compared to the control groups. In addition, LPS stimulation significantly increased the production of NO, LDH, TNF‐α, IL‐1β, and the activation of AKT and NF‐kB, while decreased the levels of IL‐10 and TGF‐β1. However, these pro‐inflammatory effects were significantly attenuated by TREM2 overexpression or pre‐treatment with LY294002, while enhanced by TREM2 silencing. Thus, we concluded that TREM2 inhibited neuroinflammation by down‐regulating PI3 K/AKT and NF‐kB signaling in BV2 microglia. Above all, therapeutic enhanced TREM2 expression may be a new strategy for intervention of neuroinflammatory diseases.
Keywords: anti‐inflammatory, BV2, microglia, NF‐κB, phosphoinositide 3‐kinase/AKT, TREM2
Abbreviations
- IL‐1β
interleukin‐1β
- LPS
lipopolysaccharide
- LDH
lactate dehydrogenase
- NO
nitric oxide
- TNF‐α
tumor necrosis factor
- TREM2
triggering receptor expressed on myeloid cell 2
Introduction
Microglia are important players of immune response in the central nervous system (CNS), and are crucial for host defense and tissue repair under physiological conditions (Cianciulli et al., 2016; N'Diaye et al., 2009). However, aberrant activation of microglia, such as lipopolysaccharide (LPS) stimulation, can promote inflammation by releasing pro‐inflammatory nitric oxide (NO), lactate dehydrogenase (LDH), and interleukin‐1β (IL‐1β), tumor necrosis factor‐α (TNF‐α) (Park et al., 2012; Dong et al., 2014; Tong et al., 2017), eventually leading to neuronal death. Evidences indicated this process was involved in the pathogenesis of neuroinflammatory diseases such as multiple sclerosis, Alzheimer's disease and Parkinson's disease (Coughlin et al., 2017; Jimenez‐Ferrer et al., 2017). Therefore, understanding the regulation of microglial activation and controlling the subsequent inflammation will be of significance in management of neuroinflammatory diseases.
Triggering receptor expressed on myeloid cell‐2 (TREM2) is a cellular surface receptor which belongs to the lectin‐like immunoglobulin superfamily. TREM2 is highly expressed in microglia with approximately 300‐fold higher than that in the neuron and other glial cells (Luo et al., 2014; Wu et al., 2015), and acts as a key regulator of inflammatory response (Torika et al., 2016; Choi et al., 2017; Zhong et al., 2017). TREM‐2 down‐regulates TLR4‐mediated cytokine responses, TNF‐α production and the NF‐kB activation (Peng et al., 2010; Sharif et al., 2014). TLR4 is activated by bacteria to modulate the innate immune responses, which releases pro‐ and anti‐inflammatory cytokines to promote robust inflammatory responses (Gawish et al., 2015). The PI3K is an upstream event of the NF‐κB pathway, which is the most important downstream pathway mediated by TLR4. Recent data indicate TREM2 is capable of binding to bacteria (Lehnardt, 2010) and impacts the phagocytosis and apoptosis via the PI3K signaling in macrophages (Lehnardt, 2010; Jay et al., 2015; Ull et al., 2017). TREM2 silencing can enhance LPS induced pro‐inflammatory cytokineproduction in microglia (Wu et al., 2015; Choi et al., 2017). Studies also indicate PI3K signaling likely modulate pro‐inflammatory signals in microglia (Wang et al., 2016). Therefore, we speculate that TREM2 might inhibit the activation of microglia and control the expression of inflammatory mediators by modulating the PI3K/NF‐κB signaling. Thus, in the present study, we investigate the anti‐inflammatory effects of TREM2 and the mechanisms in LPS‐stimulated BV2 microglia.
Materials and methods
Cell culture
Mouse BV2 microglia were purchased from the Cell Bank of Type Culture Collection of Chinese Academy of Sciences (Shanghai, China). The cells were maintained in Dulbecco's Modified Eagle's Medium (High Glucose, Gibco) with 10% heat‐inactivated fetal bovine serum (FBS, Gibco) at 37°C in a humidified incubator of 5% CO2. When the cells were grown to approximately 80% confluency, they were used for experiments.
Transfection
BV2 cells (4 × 10⁶ cells/well) were cultured in six‐well plates overnight and transfected with 200 nM TREM2‐specific siRNA or control siRNA by electroporation using a glial specific Nucleofector kit in the Amaxa Nucleofector (Lonza, Shanghai, China), according to the manufacturer's instructions. The transfected cells were cultured for 48 h to generate BV2/siRNA and BV2/siRNA‐TREM2 cells, respectively.
The sequences of siRNAs were
control siRNA: forward ′5‐UUCUCCGAACGUGUCACGUTT‐3′,
reverse ′5‐ACGUGACACGUUCGGAGAATT‐3′;
TREM2‐siRNA1: forward ′5‐GACGUUGGUAACUGACAAATT‐3′
reverse 5′‐UUUGUCAGUUACCAACGUCTT‐3′;
TREM2‐siRNA2: forward 5′‐GUCCAUCUAAGGAUGCAAUTT‐3′,
reverse 5′‐AUUGCAUCCUUAGAUGGACTT‐3′;
TREM2‐siRNA3: forward 5′‐GACCUUUCAUUCAGAAGCUTT‐3′
The relative levels of TREM2 expression were determined by Western blot. To generate TREM2 overexpression, cDNA for TREM2 was amplified from a cDNA library and cloned into plasmid of pC1 (Promega, Madison, USA) to generate p‐TREM2, followed by sequencing (Wang et al., 2016). BV2 cells were transfected with control pC1 or p‐TREM2 by electroporation. The cells were treated with G418 for 3 weeks to generate stable control BV2/NC, TREM2 over‐expressing BV2/TREM2 cells. The relative levels of TREM2 expression were determined by quantitative RT‐PCR and Western blot assays.
Measurements of NO and LDH
BV2, BV2/NC, BV2/TREM2, BV2/siRNA, and BV2/siRNA‐TREM2 cells were pre‐treated with vehicle or 10 μM LY294002, a PI3K inhibitor (MCE, Shanghai, China), for 1 h and treated vehicle or 1 μg/mL of LPS (Sigma) for 24 h. The concentrations of nitrite, an indicative of NO, in the supernatants of cultured cells were determined using the Griess reaction kit (Jiancheng, Nanjing, China). Briefly, aliquots of culture supernatants from each group were mixed with an equal volume of Griess reagent [(1% sulfanilamide/0.1% N‐(1‐naphthyl)‐ethylenediamine dihydrochloride/2.5% H3PO4] for 15 min and measured for the absorbance at 540 nm using a microplate spectrophotometer. The concentrations of nitrite were determined, according to the standard curve of different concentrations of sodium nitrite.
Similarly, the concentrations of LDH in the supernatants of each group of cells were examined using the 2,4‐dinitrophenylhydrazine chromogenic colorimetric kit (Jiancheng, Nanjing, China), according to the manufacturers’ instruction. The concentrations of LDH were measured for the absorbance at 440 nm using a microplate spectrophotometer and calculated according to the standard curve.
Cell viability
BV2, BV2/NC, BV2/TREM2, BV2/siRNA, and BV2/siRNA‐TREM2 cells (1 × 10⁴ cells/well) were cultured in 96‐well plates overnight. The cells were pre‐treated with vehicle or 10 μM LY294002 (MCE, Shanghai, China) for 1 h and treated with vehicle or 1 μg/mL of LPS for 24 h. During the last 2 h culture, individual wells of cells were exposed to10 μL of CCK‐8 solution (SAB) and measured for the absorbance at 450 nm in a microplate reader (Molecular Devices, CA, USA).
Cell apoptosis assay
BV2, BV2/NC, BV2/TREM2, BV2/siRNA, and BV2/siRNA‐TREM2 cells (106 cells/well) were cultured in 60 mm plastic dishes overnight. The cells were stimulated with LPS (1 μg/mL) for 24 h. Subsequently, the cells were stained with Annexin V‐FITC and propidium iodide (PI), and the percentages of apoptotic FITC+ and FITC+PI+ cells were analyzed by flow cytometry.
Enzyme‐linked immunosorbent assay (ELISA)
BV2, BV2/NC, BV2/TREM2, BV2/siRNA, and BV2/siRNA‐TREM2 cells (1 × 10⁴ cells/well) were cultured in 96‐well plates overnight. The cells were pre‐treated with vehicle or 10 μM LY294002 for 1 h and treated with vehicle or 1 μg/mL of LPS for 24 h. The levels of IL‐1β, TNF‐α, IL‐10, and TGF‐β in the supernatants of different groups of cells were measured by ELISA using specific kits (BD Bioscience), according to the manufacturer's protocols.
Immunofluorescence
The different groups of cells were cultured in glass coverslips and dried at 60°C overnight, followed by rehydrating in TBS for 60 min. The cells were subjected to antigen retrieval at 98°C for 20 min in Improved Citrate Antigen Retrieval Solution (Beyotime). After washing five times with TBS, the coverslips were blocked with Immunol Staining Blocking Buffer (Beyotime) for 30 min, and then incubated with anti‐TREM2(1:1000 dilution, Bioss, Boston, USA)at 4°C overnight. The coverslips were washed five times with TBS and incubated with anti‐TREM2 at room temperature (RT) for 60 min. After being washed, the cells were counterstained with 4′,6′‐diamidino‐2‐phenylindole (DAPI) at RT for 5 min, and mounted with Antifade Polyvinylpyrrolidone Medium (Beyotime). Images were acquired under a fluorescent microscope (Olympus, Tokyo, Japan).
Phagocytosis assays
BV2, BV2/NC, BV2/TREM2, BV2/siRNA, and BV2/siRNA‐TREM2 cells (1 × 10⁴cells/well) on coverslips were pre‐treated with vehicle or 10 μM LY294002 for 1 h and then treated with vehicle or 1 μg/mL of LPS for 24 h. Subsequently, the individual wells of cells were exposed to 0.4 µL fluorescence labeled latex beads (F8775, Invitrogen) at 37°C, 5% CO2 for 1 h. After being washed, the cells were fixed in 4% paraformaldehyde and treated with 5% goat serum (Zhongshan Golden Bridge Biotechnology, Beijing, China). The cells were incubated with rabbit anti‐mouse Iba‐1 overnight at 4°C and stained with Alexa Fluor 488‐goat anti‐rabbit IgG (H + L) (Proteintech, CHI, USA), followed by counterstaining with DAPI. The fluorescent signals were captured under a fluorescent microscope (OLYMPUS) and further analyzed using Image J software (National Institutes of Health, Bethesda, USA). The percentages of positive phagocytic cells were determined by calculating the number of cells with fluorescence labeled latex beads (red signal) relative to total numbers of microglia (green signal).
Reverse transcriptase‐polymerase chain reaction (RT‐PCR)
Total RNA was extracted by using TRIzol reagent (Invitrogen) and reversely transcribed into cDNA using the Prime Script RT Master Mix Kit (TaKaRa). The relative levels of TREM2, and the β‐actin were determined by quantitative PCR using the SYBR Premix and specific primers on the Super Script One‐Step RT‐PCR System (Applied Biosystems), according to the manufacturer's instructions. PCR amplification was performed in triplicate. The data were analyzed by 2−ΔΔCt.
TREM2 forward primers ′5‐GAGACCTCCTTCCCACCCACCT‐3′,
reverse primers ′5‐GGCTTCTGCCTGCCCCTG‐3′;
β‐actin forward primers ′5‐AGGTCGGTGTGAACGGATTTG‐3′,
reverse primers ′5‐GGGGTCGTTGATGGCAACA‐3′.
Western blot
The different groups of cells were harvested and lyzed in lysis buffer (Beyotime) supplemented with 1 mM phenylmethanesulfonyl fluoride (PMSF, Sigma), followed by centrifugation at 12,000g for 15 min at 4°C. After quantification of protein concentrations by using the Bicinchoninic Acid Protein Assay Kit (Beyotime), the cell lysates (30 μg) were separated by sodium dodecyl sulfatepolyacrylamide gel electrophoresis (SDS–PAGE) on 12% gels and transferred onto polyvinylidene difluoride membranes (PVDF, Millipore). The blots were blocked with 5% fat‐free dry milk in TBST (1 mM Tris, 150 mM NaCl, 0.1% Tween20, pH 7.4) RT for 2 h and probed with primary antibodies at 4°C overnight. The primary antibodies included anti‐TREM2 (bs2723R, Bioss), anti‐GAPDH (AP0063, Bioworld, Minneapolis–Saint Paul, Minnesota, USA), anti‐pAKT(AF0016), anti‐p‐NF‐kBp65(AF2006, Affinity) and anti‐β‐actin (ab8226, Abcam. After washed, the bound antibodies were detected with horseradish peroxidase (HRP)‐conjugated secondary antibodies and visualized using the Super signal West Dura Extended Duration Substrate (Thermo Scientific Pierce). The relative levels of target protein to control were determined by densitometric scanning using the ChemiDoc XRS+ System (Bio‐RAD).
Statistical analyses
Data are expressed as the mean ± S.D. The difference among the groups was calculated by one‐way ANOVA of variance and post hoc Dunnett's test (SPSS version 17). A two‐tailed P < 0.05 was considered statistically significant.
Results
TREM2 mitigates LPS‐induced PI3K‐dependent cytotoxicity in BV2 microglia
To determine the potential effect of TREM2 on LPS‐induced cytotoxicity against BV2 cells, cells were transfected with control pC1 or p‐TREM2 to generate BV2/NC and stable TREM2‐over‐expressing BV2/TREM2 cells, respectively. Simultaneously, BV2 cells were transfected with control siRNA or different TREM2‐specific siRNAs for 48 h. Subsequently, the relative levels of TREM2 mRNA transcripts and protein expression were determined by quantitative RT‐PCR and Western blot. As shown in Figures 1A and 1B. significantly higher levels of TREM2 mRNA transcripts and protein expression were detected in BV2/TREM2 cells, relative to that in the control BV2/NC. Western blot revealed that transfection with TREM2‐specific siRNA2 dramatically reduced the relative levels of TREM2 expression in BV2/siRNA‐TREM2 cells, compared with that in the BV2/siRNA cells (Figures 1C and 1D).
Figure 1.
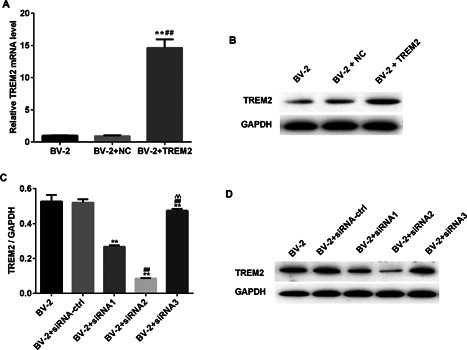
Characterization of TREM2 expression in different groups of BV2 cells. BV2 cells were transfected with control pC1 or pTREM2 to generate stable BV2/NC and BV2/TREM2 cells. Simultaneously, BV2 cells transfected with control or TREM2‐specific siRNAs for 48 h. The relative levels of TREM2 expression in BC2/NC and BV2/TREM2 were determined by quantitative RT‐PCR and Western blot. The relative levels of TREM2 to GADPH protein expression in the control and TREM2‐specific siRNA‐transfected cells were determined by Western blot. Data are representative images and expressed as the mean ± SD of each group of cells from three separate experiments. (A) Quantitative RT‐PCR analysis of TREM2 mRNA transcripts. (B) Western blot analysis of TREM2 expression in BV2/NC and BV2/TREM2 cells. (C) Quantitative RT‐PCR analysis of TREM2‐specific siRNA mRNA transcripts. (D) Western blot analysis of TREM2 expression in BV2/NC and BV2/ TREM2‐specific siRNAs cells. **P < 0.01 versus the BV2 cells; ## P < 0.01 versus the BV2/NC; ^^P < 0.01 versus the BV2 siRNA ctrl cells.
To determine the effect of TREM2 on LPS‐induced cytotoxicity, BV2, BV2/NC, BV2/TREM2, BV2/siRNA, and BV2/siRNA‐TREM2 cells were pre‐treated with vehicle or 10 μM LY294002 for 1 h and treated with vehicle or 1 μg/mL of LPS for 24 h. The viability of different groups of cells was determined by the CCK8 assay. LPS stimulation significantly reduced the viability of BV2 cells, which was mitigated in BV2/TREM2 cells (Figure 2A). Furthermore, pre‐treatment with LY294002 to block the PI3K signaling completely abrogated LPS‐induced cytotoxicity and enhanced BV2/TREM2 cell proliferation even after treatment with LPS. In contrast, knockdown of TREM2 deteriorated LPS‐related cytotoxicity against BV2 cells (Figure 2B). Inhibition of the PI3K signaling partially mitigated LPS‐induced cytotoxicity against TREM2‐silencing BV2 cells and completely abrogated LPS‐induced cytotoxicity against control BV2 cells. Together, these indicated that TREM2 mitigated LPS‐induced PI3K‐dependent cytotoxicity against mouse microglia in vitro.
Figure 2.
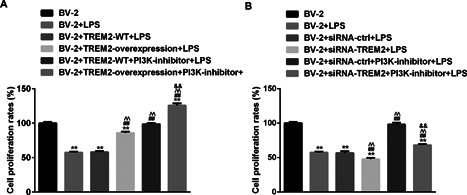
Altered TREM2 expression modulates the LPS‐induced PI3K‐dependent cell proliferation in BV2 cells. BV2, BV2/NC, BV2/TREM2, BV2/siRNA, and BV2/siRNA‐TREM2 cells were pre‐treated in triplicate with, or without, LY294002, a PI3 K inhibitor, for 1 h and stimulated with, or without, LPS for 24 h. The cell viability of individual groups of cells were determined by the CCK8 assays. Data are expressed as the mean ± SD of each group of cells from three separate experiments. (A) Induction of TREM2 over‐expression mitigates LPS‐induced PI3K‐dependent cytotoxicity against in BV2 cells. (B) Knockdown of TREM2 expression enhances LPS‐induced PI3K‐dependent cytotoxicity against BV2 cells. **P < 0.01 versus the BV2 cells; ## P < 0.01 versus the BV2/NC; ^^P < 0.01 versus the BV2/NC or BV2/NC siRNA ctrl cells; && P < 0.01 versus the BV2/NC PI3K‐inhibitor or BV2/NC siRNA ctrl PI3K‐inhibitor cells.
TREM2 promotes LPS‐stimulated phagocytosis in BV2 microglia, which was inhibited by the PI3K signaling
To investigate further functional consequences of altered TREM2 expression, we tested the phagocytosis of different groups of BV2 microglia. As shown in Figure 3, treatment with LPS significantly increased the percentages of phagocytosed BV2 cells, which was significantly enhanced by TREM2 over‐expression. Treatment with the PI3K inhibitor did not affect LPS‐stimulated phagocytosis, but significantly increased the percentages of phagocytosed BV2/TREM2 cells (Figures 3A and 3B). In contrast, knockdown of TREM2 significantly reduced LPS‐stimulated phagocytosis in BV2 cells, which was abrogated by pre‐treatment with the PI3K inhibitor (Figures 3C and 3D). Moreover, blockage of the PI3K signaling increased the percentages of phagocytosed BV2 cells. These independent lines of evidence indicated that TREM2 promoted LPS‐stimulated phagocytosis of BV2 cells, which was inhibited by the PI3K signaling.
Figure 3.
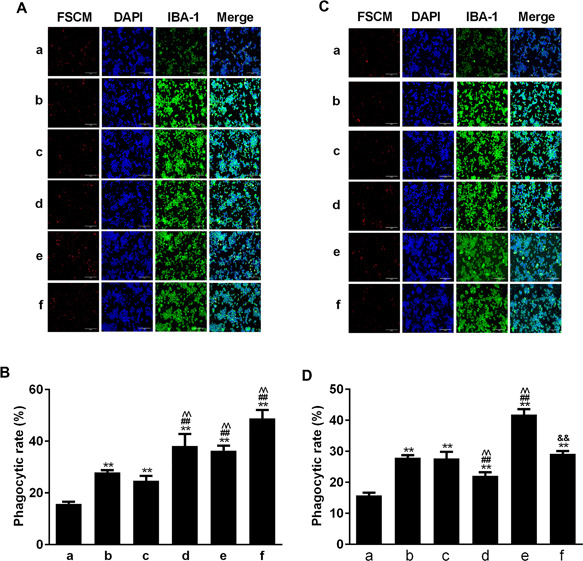
Altered TREM2 expression changes LPS‐stimulated PI3K‐inhibited phagocytosis in BV2 cells. The different groups of cells were pre‐treated with, or without, the PI3K inhibitor and stimulated with, or without, LPS for 24 h. Subsequently, the different groups of cells were treated with fluorescence labeled latex beads at 37°C, 5% CO2 for 1 h. After being washed, the cells were stained with rabbit anti‐mouse Iba‐1 and then Alexa Fluor 488‐goat anti‐rabbit IgG, followed by counterstained with DAPI. The cells were photoimaged and the percentages of phagocytosed (red color) cells in total DAPI+ cells were calculated. Data are representative images or expressed as the mean ± SD of each group of cells from three separate experiments. (A and B) Induction of TREM2 overexpression enhances LPS‐induced PI3K‐inhibited phagocytosis in BV2 cells. (C and D) Knockdown of TREM2 expression reduces LPS‐induced PI3K‐inhibited phagocytosis in BV2 cells. In Figure 3B: a. BV2 b. BV2+LPS c. BV2+TREM2 WT+LPS d. BV2+ TREM2 overexpression + LPS e. BV2+ TREM2 WT+ PI3K‐inhibitor + LPS, f: BV2+ TREM2 overexpression + PI3K‐inhibitor + LPS. Page 25 of 31 Cell Biology International For Review Only In Figure 3D, a. BV2 b. BV2+LPS c. BV2+SiRNA ctrl+LPS d. BV2+ SiRNA TREM2 + LPS e. BV2+ SiRNA ctrl + PI3K‐inhibitor + LPS f. BV2+ SiRNA TREM2 + PI3K‐inhibitor + LPS. **P < 0.01 versus the BV2 cells. ## P < 0.01 versus the BV2/NC ^^ P < 0.01 versus BV2/NC or BV2/NC siRNA ctrl cells && P < 0.01 versus the BV2/NC PI3K‐inhibitor or BV2/NC siRNA ctrl PI3K‐inhibitor cells.
TREM2 reduces LPS‐induced PI3K‐enhanced apoptosis of BV2 cells
Next, we investigated whether altered TREM2 expression affected the survival of BV2 cells. The different groups of cells were pre‐treated with, or without, the PI3K inhibitor and stimulated with, or without, LPS for 24 h. The percentages of apoptotic cells were determined by flow cytometry. As shown in the Figures 4A and 4B, stimulation with LPS significantly increased the percentages of apoptotic BV2 cells, which was significantly mitigated by TREM2 over‐expression or pre‐treatment with the PI3K inhibitor. Pre‐treatment with the PI3K inhibitor nearly completely abrogated the LPS‐enhanced apoptosis in BV2/TREM2 cells. In contrast, knockdown of TREM2 expression significantly increased the percentages of apoptotic cells, which was dramatically reduced by pre‐treatment with the PI3K inhibitor (Figures 4C and 4D). Similarly, pre‐treatment with the PI3K inhibitor also reduced the LPS‐enhanced apoptosis of BV2 cells. Thus, TREM2 acted as an antagonist against LPS‐induced PI3K signaling‐enhanced apoptosis of BV2 cells.
Figure 4.
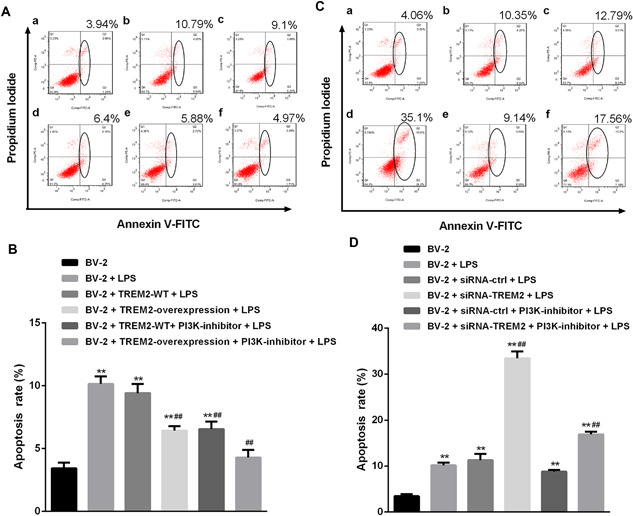
TREM2 reduces LPS‐induced PI3K‐enhanced apoptosis of BV2 cells. BV2, BV2/NC, BV2/TREM2, BV2/siRNA, and BV2/siRNA‐TREM2 cells were pre‐treated in triplicate with, or without, LY294002, a PI3K inhibitor, for 1 h and stimulated with, or without, LPS for 24 h. The percentages of apoptotic cells were determined by flow cytometry. Data are representative flow cytometry charts or expressed as the mean ± SD of each group of cells from three separate experiments. (A and B) Induction of TREM2 overexpression reduces LPS‐induced PI3K‐enhanced apoptosis of BV2 cells. (C and D) Knockdown of TREM2 expression increases LPS‐induced PI3K‐enhancedapoptosis of BV2 cells. **P < 0.01 versus the BV2 cells ## P < 0.01 versus the BV2/NC ^^ P < 0.01 versus the BV2/NC or BV2/NC siRNA ctrl cells && P < 0.01 versus the BV2/NC PI3K‐inhibitor or BV2/NC siRNA ctrl PI3K‐inhibitor cells.
TREM2 inhibits LPS‐stimulated PI3K‐dependent NO and LDH production in BV2 cells
To understand the regulatory effect of TREM2, we further examined the levels of NO production and LDH in the different groups of cells. As shown in Figures 5A and 5B, LPS stimulated high levels of NO production in the supernatants and LDH activity in BV2 cells, which were significantly reduced by TREM2 over‐expression or pre‐treatment with the PI3K inhibitor. Similarly, pre‐treatment with the PI3K inhibitor enhanced TREM2‐mediated inhibition of LPS‐stimulated NO production and LDH activity in BV2 cells. In contrast, knockdown of TREM2 increased the levels of NO and LDH activity (Figures 5C and 5D). Pre‐treatment with the PI3 K inhibitor significantly mitigated LPS‐stimulated NO production and LDH activity in both BV2 and BV2/TREM2 cells. Together, these data indicated that TREM2 inhibits LPS‐stimulated PI3K‐dependent NO and LDH production in BV2 cells.
Figure 5.
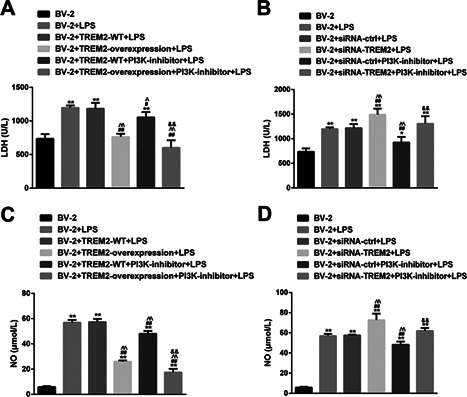
TREM2 inhibits LPS‐stimulated PI3K‐dependent NO production and LDH activity in BV2 cells. BV2, BV2/NC, BV2/TREM2, BV2/siRNA, and BV2/siRNA‐TREM2 cells were pre‐treated in triplicate with, or without, LY294002, a PI3K inhibitor, for 1 h and stimulatedwith, or without, LPS for 24 h. The concentrations of NO in the supernatants of cultured cells were determined and the LDH activity in different groups of cells was analyzed. Data are expressed as the mean ± SD of each group of cells from three separate experiments. (A and B) Induction of TREM2 overexpression reduces LPS‐induced PI3K‐enhanced NO production and LDH activity in BV2 cells. (C and D) Knockdown of TREM2 expression increases LPS‐induced PI3K‐enhanced NO production and LDH activity in BV2 cells. **P < 0.01 versus the BV2 cells ## P < 0.01 versus the BV2/NC ^^ P < 0.01 versus the BV2/NC or BV2/NC siRNA ctrl cells && P < 0.01 versus the BV2/NC PI3K‐inhibitor or BV2/NC siRNA ctrl PI3K‐inhibitor cells.
TREM2 attenuates LPS‐induced PI3K‐dependent IL‐1β and TNF‐α, but enhances IL‐10 and TGF‐β expression in BV2 cells
We further examined the effect of altered TREM2 expression on the levels of TNF‐α, IL‐1β, IL‐10, and TGF‐β in the supernatants of different groups of cells. LPS stimulation significantly increased the levels of TNF‐α and IL‐1β, but reduced the levels of IL‐10 and TGF‐β in the supernatants of cultured BV2 cells (Figure 6A). Induction of TREM2 over‐expression mitigated LPS‐stimulated TNF‐α and IL‐1β, and LPS‐reduced IL‐10 and TGF‐β production in BV2 cells. In addition, pre‐treatment with the PI3K inhibitor significantly mitigated LPS‐modulated TNF‐α, IL‐1β, while increased IL‐10 and TGF‐β production in BV2 and BV2/TREM2 cells. In contrast, knockdown of TREM2 expression significantly enhanced LPS‐stimulated TNF‐α and IL‐1β, and LPS‐reduced IL‐10 and TGF‐β production in BV2 cells (Figure 6B). Pre‐treatment with the PI3K inhibitor dramatically abrogated the LPS‐stimulated TREM2‐enahnced TNF‐α and IL‐1β in BV2 cells and rescued the LPS‐decreased TREM2 silencing enhanced IL‐10 and TGF‐β production in BV2 cells. Thus, TREM2 attenuates LPS‐induced PI3K‐dependent IL‐1β and TNF‐α, but enhances IL‐10 and TGF‐β expression in BV2 cells.
Figure 6.
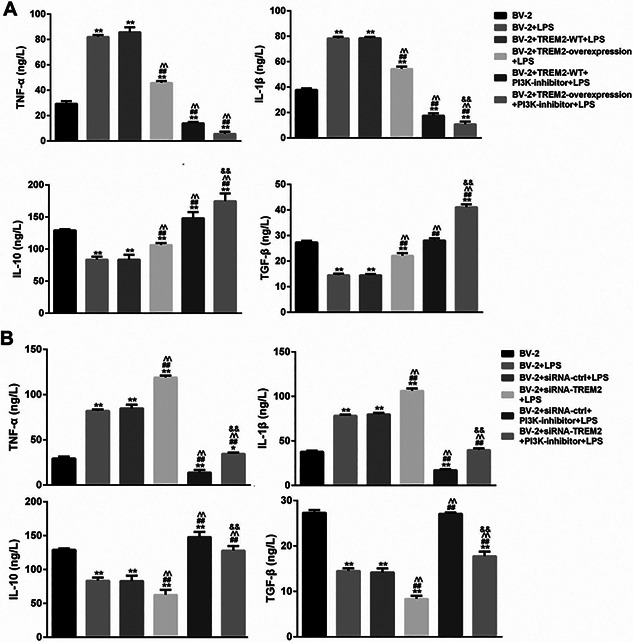
TREM2 modulates LPS‐stimulated cytokine production in BV2 cells. BV2, BV2/NC, BV2/TREM2, BV2/siRNA, and BV2/siRNA‐TREM2 cells were pre‐treated with, or without, LY294002, a PI3K inhibitor, for 1 h and stimulated with, or without, LPS for 24 h. The concentrations of TNF‐α, IL‐1β, IL‐10, and TGF‐β1 in the supernatants of different groups of cells were determined by ELISA. Data are expressed as the mean ± SD of each group of cells from three separate experiments. (A) Induction of TREM2 overexpression reduces LPS‐induced PI3K‐enhanced PI3K‐dependent TNF‐α, IL‐1β, but promotes the PI3K‐dpendent IL‐10 and TGF‐β1 expression in BV2 cells. (B) Knockdown of TREM2 expression enhances LPS‐induced PI3K‐dependent TNF‐α, IL‐1β, but decreases the PI3K‐dpendent IL‐10 and TGF‐β1 expression in BV2 cells. **P < 0.01 versus the BV2 cells ## P < 0.01 versus the BV2/NC ^^ P < 0.01 versus the BV2/NC or BV2/NC siRNA ctrl cells && P < 0.01 versus the BV2/NC PI3K‐inhibitor or BV2/NC siRNA ctrl PI3K‐inhibitor cells.
TREM2 prevents from LPS‐induced NF‐κB and PI3K activation in BV2 cells
The PI3K and NF‐κB signaling are crucial for cell survival and inflammatory cytokine production. To further understand the mechanisms underlying the action of TREM2, We determined the effect of altered TREM2 expression on the PI3K and NF‐kB activation in BV2 cells. First, we found that LPS treatment did not affect the relative levels of PI3K and NF‐kB p65 expression, but significantly increased the relative levels of phosphorylated AKT and NF‐kB p65, indicating that LPS stimulated both the PI3K and NF‐kB activation in BV2 cells (Figure 7). Furthermore, induction of TREM2 over‐expression did not affect the relative levels of AKT and NF‐kB p65 expression, but significantly reduced the relative levels of phosphorylated AKT and NF‐kB p65 in BV2 cells (Figure 8). Pre‐treatment with the PI3K inhibitor not only significantly reduced the relative levels of phosphorylated AKT, but also the relative levels of phosphorylated NF‐kBp65 in BV2 and BV2/TREM2 cells. In contrast, knockdown of TREM2 did not affect the relative levels of AKT and NF‐kB p65 expression, but significantly enhanced LPS‐stimulated AKT and NF‐kB p65 phosphorylation in BV2 cells (Figure 9). Pre‐treatment with the PI3K inhibitor significantly reduced the AKT activation in both BV2 and BV2/TREM2‐siRNA cells. Collectively, these data revealed that TREM2 inhibited the LPS‐stimulated PI3K‐dependent AKT and NF‐kB activation in BV2 cells.
Figure 7.

LPS‐induced NF‐κB activation in BV2 cells. BV2 cells were stimulated with, or without LPS for 24 h. The relative levels of AKT and NF‐kB expression and phosphorylation to the control β‐actin in the different groups of cells were determined by Western blot assays. Data are representative images or expressed as the mean ± SD of each group of cells from three separate experiments. In Figure 7B: 1. BV‐2+TREM2‐WT+LPS 2. BV2+T REM2‐overexpression+LPS 3. BV2 +TREM2‐WT+ PI3K‐inhibitor + LPS 4. BV2 + TREM2‐overexpression + PI3K‐inhibitor + LPS. In Figure 7C: 1. BV2+siRNA‐ctrl+LPS 2. BV‐2+ siRNA‐TREM2+LPS 3. BV2 + siRNA‐ctrl +PI3K‐inhibitor + LPS 4. BV2 + siRNA‐TREM2 + PI3K‐inhibitor + LPS.
Figure 8.

LPS‐induced NF‐κB activation in BV2 cells. BV2 cells were stimulated with, or without LPS for 24 h. The relative levels of AKT and NF‐κB p65 expression were determined by Western blot assays. Data are representative images or expressed as the mean ± SD of each group of cells from three separate experiments. **P < 0.01 versus the BV2 cell.
Figure 9.
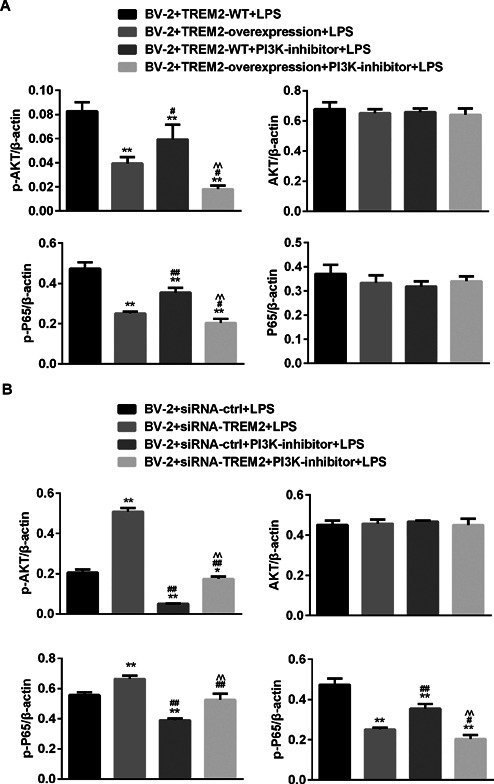
TREM2 prevents from LPS‐induced NF‐κB and PI3K activation in BV2 cells. BV2, BV2/NC, BV2/TREM2, BV2/siRNA, and BV2/siRNA‐TREM2 cells were pre‐treated with, or without, LY294002, a PI3K inhibitor, for 1 h and stimulated with, or without, LPS for 24 h. (A) Induction of TREM2 overexpression reduces the LPS‐induced PI3K and AKT activation in BV2 cells. (B) Knockdown of TREM2 expression enhances the LPS‐induced AKT and NF‐kB activation in BV2 cells. **P < 0.01 versus the BV2 cells ## P < 0.01 versus the BV2/NC ^^ P < 0.01 versus the BV2/NC or BV2/NC siRNA ctrl cells && P < 0.01 versus the BV2/NC PI3K‐inhibitor or BV2/NC siRNA ctrl PI3K‐inhibitor cells.
Discussion
In the present study, we found that TREM2 protected BV2 microglia cells from LPS‐induced apoptosis and inhibited LPS‐induced the related inflammatory responses in BV2 microglia cells. TREM2, like the PI3K inhibitor, significantly reduced the LPS‐induced production of pro‐inflammatory mediators, such as NO and LDH, as well as IL‐1β and TNF‐α, whereas dramatically enhanced the release of anti‐inflammatory cytokines such as IL‐10 and TGF‐β, which associated with negatively regulating the PI3K and NF‐κB signaling in BV2 cells. The novel findings extended previous observations (Ull et al., 2017; Zhong et al., 2017) and supported the notion that TREM2 might act as an anti‐inflammatory factor in the CNS and might be valuable for ameliorating neuroinflammatory diseases.
It is well known that high levels of NO and LDH can be cytotoxic to kinds of cells including microglia. Previous studies have shown that severe inflammation, such as infection, can induce high levels of NO and LDH production, associated with enhanced pro‐inflammatory cytokine release (Park et al., 2012; Tong et al., 2017). Down‐regulating these inflammatory molecules has been considered as potential candidates of anti‐inflammatory agents to alleviate the progression of neuroinflammatory diseases caused by activated microglia. In this study, we found that TREM2 markedly inhibited LPS‐induced NO and LDH production, reduced microglial apoptosis, and enhanced microglial phagocytosis and cell viability. Thus, these results indicated that TREM2 showed potent anti‐neuroinflammatory effects and inhibited microglia‐mediated inflammatory responses and/or oxidative stress. However, TREM‐2 promoted macrophage killing by enhancing reactive oxygen species, but not NO production (Zhu et al., 2014). It is may be attributed to the different mechanisms for pseudomonas aeruginosa and LPS. Recent studies reported that treatment with TREM2‐overexpressing bone marrow‐derived myeloid cells significantly reduced the mortality of polymicrobial sepsis, whereas blockage of TREM2 signaling after sepsis dramatically increased the mortality (Chen et al., 2013). Following LPS stimulation, the synthesis of pro‐inflammatory cytokines were markedly elevated in TREM2‐depleted microglia (Wang et al., 2015; Zhong et al., 2015, 2017). In addition, either TREM2 or DNAX‐activating protein of 12 kDa (DAP12) knockdown in BV2. Microglia significantly increased IL‐1β and IL‐6 releases followed by LPS stimulation (Peng et al., 2013).
TREM2 is associated with DAP12, which contains an immunoreceptor tyrosine‐based activation motif. After TREM2 binds with the ligands exposed in microglia, the immunoreceptor tyrosinebased activation motif‐based transduction complex is phosphorylated, which in turn activates the downstream signaling and finally leads to cellular response (Luo et al., 2014; Jay et al., 2015; Wang et al., 2016; Choi et al., 2017). TREM2 activated PI3 K in macrophage (Peng et al., 2010; Zhu et al., 2014), whereas, the PI3K/AKT signaling can control a variety of cellular proliferation and survival processes as well as inflammatory responses. Previous studies have shown that PI3K/AKT signaling negatively regulates LPS‐induced acute inflammatory responses in microglia (Dong et al., 2014; Cianciulli et al., 2016; Schaafsma et al., 2017). Therefore, to further confirm the inhibitory effects of TREM2 in microglia, we investigated the pro‐inflammatory mediators release, Akt phosphorylation and NF‐κB activation after treatment with PI3K inhibitor in LPS‐stimulated BV2 cells. And we found that the pro‐inflammatory mediators such as NO, LDH, IL‐1β as well as TNF‐α, and Akt phosphorylation was markedly suppressed by treatment with TREM2 and PI3K inhibitor, respectively. These results suggest that TREM2 overexpression, like inhibition of the PI3K signaling, markedly suppressed LPS‐induced inflammatory responses, accompanied by down‐regulating the AKT phosphorylation and NF‐κB activation in BV2microglia. Hence, the inhibition of LPS‐induced NF‐κB activation by TREM2 may be mediated by negatively regulating the PI3K/AKT signaling in BV2 cells.
In conclusion, our results indicated that TREM2 inhibited LPS‐induced pro‐inflammatory responses, associated with down‐regulating the PI3K/AKT signaling in BV2 microglia. Therefore, our findings may provide new insights into better understanding the inhibitory effects of TREM2 on LPS‐mediated neuroinflammation.
Acknowledgements and Funding
CX. L was supported by LY16H150001 from Zhejiang Provincial Natural Science Foundation of China, 2016ZA118 from Science and Technology Plan for Traditional Chinese Medicine of Zhejiang in China and 81491566 from National Natural Science Foundation of China.
References
- Chen Q, Zhang K, Jin Y, Zhu T, Cheng B, Shu Q, Fang X (2013) Triggering receptor expressed on myeloid cells‐2 protects against polymicrobial sepsis by enhancing bacterial clearance. Am J Respir Crit Care Med 188: 201–12. [DOI] [PubMed] [Google Scholar]
- Choi MJ, Lee EJ, Park JS, Kim SN, Park EM, Kim HS (2017) Anti‐inflammatory mechanism of galangin in lipopolysaccharide‐stimulated microglia: critical role of PPAR‐gamma signaling pathway. Biochem Pharmacol 144: 120–31. [DOI] [PubMed] [Google Scholar]
- Cianciulli A, Calvello R, Porro C, Trotta T, Salvatore R, Panaro MA (2016) PI3k/Akt signalling pathway plays a crucial role in the anti‐inflammatory effects of curcumin in LPS‐activated microglia. Int Immunopharmacol 36: 282–90. [DOI] [PubMed] [Google Scholar]
- Coughlin JM, Wang Y, Minn I, Bienko N, Ambinder EB, Xu X, Peters ME, Dougherty JW, Vranesic M, Koo SM, Ahn HH, Lee M, Cottrell C, Sair HI, Sawa A, Munro CA, Nowinski CJ, Dannals RF, Lyketsos CG, Kassiou M, Smith G, Caffo B, Mori S, Guilarte TR, Pomper MG (2017) Imaging of glial cell activation and white matter integrity in brains of active and recently retired national football league players. Jama Neurol 74: 67–74. [DOI] [PMC free article] [PubMed] [Google Scholar]
- Dong H, Zhang X, Dai X, Lu S, Gui B, Jin W, Zhang S, Zhang S, Qian Y (2014) Lithium ameliorates lipopolysaccharide‐induced microglial activation via inhibition of toll‐like receptor 4 expression by activating the PI3K/Akt/FoxO1 pathway. J Neuroinflammation 11: 140. [DOI] [PMC free article] [PubMed] [Google Scholar]
- Gawish R, Martins R, Bohm B, Wimberger T, Sharif O, Lakovits K, Schmidt M, Knapp S (2015) Triggering receptor expressed on myeloid cells‐2 fine‐tunes inflammatory responses in murine Gram‐negative sepsis. FASEB J 29: 1247–57. [DOI] [PMC free article] [PubMed] [Google Scholar]
- Jay TR, Miller CM, Cheng PJ, Graham LC, Bemiller S, Broihier ML, Xu G, Margevicius D, Karlo JC, Sousa GL, Cotleur AC, Butovsky O, Bekris L, Staugaitis SM, Leverenz JB, Pimplikar SW, Landreth GE, Howell GR, Ransohoff RM, Lamb BT (2015) TREM2 deficiency eliminates TREM2+ inflammatory macrophages and ameliorates pathology in Alzheimer's disease mouse models. J Exp Med 212: 287–95. [DOI] [PMC free article] [PubMed] [Google Scholar]
- Jimenez‐Ferrer I, Jewett M, Tontanahal A, Romero‐Ramos M, Swanberg M (2017) Allelic difference in Mhc2ta confers altered microglial activation and susceptibility to α‐synuclein‐induced dopaminergic neurodegeneration. Neurobiol Dis 106: 279–90. [DOI] [PubMed] [Google Scholar]
- Lehnardt S (2010) Innate immunity and neuroinflammation in the CNS: the role of microglia in toll‐like receptor‐mediated neuronal injury. GLIA 58: 253–63. [DOI] [PubMed] [Google Scholar]
- Luo L, Wall AA, Yeo JC, Condon ND, Norwood SJ, Schoenwaelder S, Chen KW, Jackson S, Jenkins BJ, Hartland EL, Schroder K, Collins BM, Sweet MJ, Stow L (2014) Rab8a interacts directly with PI3Kgamma to modulate TLR4‐driven PI3 K and mTOR signalling. Nat Commun 5: 4407. [DOI] [PubMed] [Google Scholar]
- N'Diaye EN, Branda CS, Branda SS, Nevarez L, Colonna M, Lowell C, Hamerman JA, Seaman WE (2009) TREM‐2 (triggering receptor expressed on myeloid cells 2) is a phagocytic receptor for bacteria. J Cell Biol 184: 215–23. [DOI] [PMC free article] [PubMed] [Google Scholar]
- Park HY, Kim GY, Choi YH (2012) Naringenin attenuates the release of pro‐inflammatory mediators from lipopolysaccharide‐stimulated BV2 microglia by inactivating nuclear factor‐κB and inhibiting mitogen‐activated protein kinases. Int J Mol Med 30: 204–10. [DOI] [PubMed] [Google Scholar]
- Peng Q, Malhotra S, Torchia JA, Kerr WG, Coggeshall KM, Humphrey MB (2010) TREM2‐ and DAP12‐dependent activation of PI3 K requires DAP10 and is inhibited by SHIP1. Sci Signal 3: a38. [DOI] [PMC free article] [PubMed] [Google Scholar]
- Peng Q, Long CL, Malhotra S, Humphrey MB (2013) A physical interaction between the adaptor proteins DOK3 and DAP12 is required to inhibit lipopolysaccharide signaling in macrophages. Sci Signal 6: ra72. [DOI] [PMC free article] [PubMed] [Google Scholar]
- Schaafsma W, Basterra LB, Jacobs S, Brouwer N, Meerlo P, Schaafsma A, Boddeke E, Eggen B (2017) Maternal inflammation induces immune activation of fetal microglia and leads to disrupted microglia immune responses, behavior, and learning performance in adulthood. Neurobiol Dis 106: 291–300. [DOI] [PubMed] [Google Scholar]
- Sharif O, Gawish R, Martins R, Lakovits K, Hladik A, Doninger B, Brunner J, Korosec A, Berg T, Kralovics R, Colinge J, Mesteri I, Gilfillan S, Salmaggi A, Verschoor A, Colonna M, Knapp S (2014) The triggering receptor expressed on myeloid cells 2 inhibits complement component 1q effector mechanisms and exerts detrimental effects during pneumococcal pneumonia. PLoS Pathog 10: e1004167. [DOI] [PMC free article] [PubMed] [Google Scholar]
- Tong G, Krauss A, Mochner J, Wollersheim S, Soltani P, Berger F, Schmitt KRL (2017) Deep hypothermia therapy attenuates LPS‐induced microglia neuroinflammation via the STAT3 pathway. Neuroscience 358: 201–10. [DOI] [PubMed] [Google Scholar]
- Torika N, Asraf K, Roasso E, Danon A, Fleisher‐Berkovich S (2016) Angiotensin converting enzyme inhibitors ameliorate brain inflammation associated with microglial activation: possible implications for alzheimer's disease. J Neuroimmune Pharmacol 11: 774–85. [DOI] [PubMed] [Google Scholar]
- Ull TK, Song WM, Huang SC, Ulrich JD, Sergushichev A, Beatty WL, Loboda AA, Zhou Y, Cairns NJ, Kambal A, Loginicheva E, Gilfillan S, Cella M, Virgin HW, Unanue ER, Wang Y, Artyomov MN, Holtzman DM, Colonna M (2017) TREM2 maintains microglial metabolic fitness in alzheimer's disease. CELL 170: 649–63. [DOI] [PMC free article] [PubMed] [Google Scholar]
- Wang Y, Cella M, Mallinson K, Ulrich JD, Young KL, Robinette ML, Gilfillan S, Krishnan GM, Sudhakar S, Zinselmeyer BH, Holtzman DM, Cirrito JR, Colonna M (2015) TREM2 lipid sensing sustains the microglial response in an Alzheimer's disease model. Cell 160: 1061–7. [DOI] [PMC free article] [PubMed] [Google Scholar]
- Wang XQ, Tao BB, Li B, Wang XH, Zhang WC, Wan L, Hua XM, Li ST (2016) Overexpression of TREM2 enhances glioma cell proliferation and invasion: a therapeutic target in human glioma. Oncotarget 7: 2354–66. [DOI] [PMC free article] [PubMed] [Google Scholar]
- Wu K, Byers DE, Jin X, Agapov E, Alexander‐Brett J, Patel AC, Cella M, Gilfilan S, Colonna M, Kober DL, Brett TJ, Holtzman MJ (2015) TREM‐2 promotes macrophage survival and lung disease after respiratory viral infection. J Exp Med 212: 681–97. [DOI] [PMC free article] [PubMed] [Google Scholar]
- Zhong L, Chen XF, Zhang ZL, Wang Z, Shi XZ, Xu K, Zhang YW, Xu H, Bu G (2015) DAP12 stabilizes the C‐terminal fragment of the triggering receptor expressed on myeloid cells‐2 (TREM2) and protects against LPS‐induced pro‐inflammatory response. J Biol Chem 290: 15866–77. [DOI] [PMC free article] [PubMed] [Google Scholar]
- Zhong L, Zhang ZL, Li X, Liao C, Mou P, Wang T, Wang Z, Wang Z, Wei M, Xu H, Bu G, Chen XF (2017) TREM2/DAP12 complex regulates inflammatory responses in microglia via the JNK signaling pathway. Front Aging Neurosci 9: 204. [DOI] [PMC free article] [PubMed] [Google Scholar]
- Zhu M, Li D, Wu Y, Huang X, Wu M (2014) TREM‐2 promotes macrophage‐mediated eradication of Pseudomonas aeruginosa via a PI3K/Akt pathway. Scand J Immunol 9: 187–96. [DOI] [PubMed] [Google Scholar]


