

Abstract
Next‐generation sequencing (NGS) data present an untapped potential to improve microbial risk assessment (MRA) through increased specificity and redefinition of the hazard. Most of the MRA models do not account for differences in survivability and virulence among strains. The potential of machine learning algorithms for predicting the risk/health burden at the population level while inputting large and complex NGS data was explored with Listeria monocytogenes as a case study. Listeria data consisted of a percentage similarity matrix from genome assemblies of 38 and 207 strains of clinical and food origin, respectively. Basic Local Alignment (BLAST) was used to align the assemblies against a database of 136 virulence and stress resistance genes. The outcome variable was frequency of illness, which is the percentage of reported cases associated with each strain. These frequency data were discretized into seven ordinal outcome categories and used for supervised machine learning and model selection from five ensemble algorithms. There was no significant difference in accuracy between the models, and support vector machine with linear kernel was chosen for further inference (accuracy of 89% [95% CI: 68%, 97%]). The virulence genes FAM002725, FAM002728, FAM002729, InlF, InlJ, Inlk, IisY, IisD, IisX, IisH, IisB, lmo2026, and FAM003296 were important predictors of higher frequency of illness. InlF was uniquely truncated in the sequence type 121 strains. Most important risk predictor genes occurred at highest prevalence among strains from ready‐to‐eat, dairy, and composite foods. We foresee that the findings and approaches described offer the potential for rethinking the current approaches in MRA.
Keywords: Listeria monocytogenes, machine learning, microbial risk assessment, support vector machines, whole genome sequencing
1. INTRODUCTION
Listeria monocytogenes is a ubiquitous Gram‐positive bacterium responsible for listeriosis, which has severe manifestations such as septicemia and meningitis in high‐risk groups such as newborn children, pregnant women, the elderly, and immunocompromised patients (Goulet et al., 2012). Even though listeriosis is a rare disease, the associated fatalities make it an important foodborne pathogen. For instance, L. monocytogenes was associated with the second highest case fatality rate (21%) and the highest hospitalization rate (90.5%) of all foodborne pathogens (Goulet, King, Vaillant, & de Valk, 2013; Orsi, Bakker, & Wiedmann, 2011). Contaminated food has been estimated as the source in as many as 99% of the cases (Scallan et al., 2011).
The limitations of existing risk assessment efforts are that dose–response models for L. monocytogenes do not always take into account differences in survivability and virulence among strains. The application of omics data to explore the pathogen–host interaction leading to variation in susceptibility in different high‐risk groups needs to be considered (Brul et al., 2012). The advent of next‐generation sequencing (NGS) technologies provides an ideal subtyping tool for rapid, reproducible, and highly discriminatory characterization of pathogens and creates the opportunity to resolve variations in microbial populations and, in future research, for host populations (Brul et al., 2012). The recent decrease in cost and increase in throughput of whole genome sequencing (WGS) techniques has resulted in a rapid increase in the availability of WGS data (Leekitcharoenphon, Nielsen, Kaas, Lund, & Aarestrup, 2014; Pielaat et al., 2013).
Still, efforts toward incorporation of WGS data in risk‐based decision making remain largely unexplored (Pielaat et al., 2015). WGS may provide the required evidence‐based, transparent, and rigorous approaches to estimate and compare the risk of foodborne illness from microbial hazards. Classical microbial risk assessment (MRA) involves studying the changes in undesirable microorganisms in the food chain using classical microbial identification, enumeration, and stress response study methods. Even though the specificity, sensitivity, and relevance of such methods have been adequate for the purpose, variations in the molecular characteristics of a particular strain may introduce variability in the behavior of the microbial cell (Brul et al., 2012). Application of WGS data in MRA will assist in accounting for this variability in the behavior of the microbial cell.
The initial step in MRA involves hazard identification, which refers to the pathogen or toxin of interest (Brul et al., 2012). WGS presents an opportunity in hazard identification to further study the association between genomic variation and pathogenicity in different subpopulations, which may resolve differences between virulence in foodborne pathogens when coupled with phenotypic data (Pielaat et al., 2013). This will aid in the prediction of virulence based on core and accessory genes associated with increased virulence and eventually aid in the unearthing of undescribed genes or proteins whose function is influenced by nucleotide variations (Brul et al., 2012). WGS data provide a potential opportunity for increased resolution microbial risk assessment by addressing the effect of genetic variations in pathogens on morbidity, mortality, antimicrobial resistance, and adaptations to environmental stress (Houle, Govindaraju, & Omholt, 2010). Such outcomes cannot be realized without phenotypic data.
Efforts toward incorporation of WGS data in MRA have resulted in a number of reviews (Brul et al., 2012; Carriço, Sabat, Friedrich, & Ramirez; ESCMID Study Group for Epidemiological Markers (ESGEM), 2013; Havelaar et al., 2010; Pielaat et al., 2013) as well as initial attempts at practical application (Pielaat et al., 2015). The principal step, however, is linking of relevant derivatives of WGS data to particular risk indicators, especially phenotypic health endpoints. A key challenge remains the highly dimensional nature of genomic data versus the number of isolates. This constitutes a major challenge in the application of common statistical analysis methods (Pielaat et al., 2015). Traditional epidemiological models were developed to address a reasonable number of predictor variables and one or a few response variables. However, WGS data present a phenomenal increase in possible genotypes, which often outstrips the increase in sample size (Houle et al., 2010). This may result in either poorly or over fitting models. Data reduction techniques may in such cases either result in biologically irrelevant outcomes or discarding important data (Houle et al., 2010). A robust and emerging family of models to handle highly dimensional data sets with risk prediction in mind consists of either network‐based analysis techniques (Okser, Pahikkala, & Aittokallio, 2013) or machine learning algorithms applying methods such as partial least squares regression (Sjöström, Wold, Lindberg, Persson, & Martens, 1983), random forests (RFs) (Breiman, 2001a; Liaw & Wiener, 2002), and support vector machines (SVMs) (Breiman, 2001b; Houle et al., 2010).
Machine learning algorithms involve the development and application of computer algorithms that improve with experience (Libbrecht & Noble, 2015). These techniques further enable the identification of predictor combinations that will predict the risk outcome, thus allowing further refinement of risk assessment inputs from big data sets to a fewer number of predictors. Microbial pathogenesis may be mediated by genetically complex microbial variations due to contributions from combinations of genetic variation in different loci (Okser et al., 2013). Traditional statistical association models often average genetic interactions. Machine‐learning‐based predictive modeling, on the other hand, takes into consideration individual effects that are dependent on interactions with other genetic and environmental factors (Okser et al., 2013).
Machine learning (ML) methods further enable the possibility of prediction as well as interpretation using data. It is, therefore, possible to reveal the properties of a sequence that are the most important for determining a certain phenotype or, on the other hand, to predict the occurrence of the protein. Machine learning provides an opportunity to carry out MRA whose inference is flexible to genetic variations acquired over time, which may aid early identification of strains with new virulence characteristics. Machine learning algorithms are increasingly being utilized as alternatives to traditional genome‐wide association (GWAS) studies and have been applied extensively in genomics. Potentially important disease biomarkers have been revealed by the use of machine learning methods on gene expression data, where algorithms learn to differentiate between different disease phenotypes (Libbrecht & Noble, 2015). Recent successful application includes cancer research, where crucial information regarding patient genotypes, gene‐expression‐related phenotypes, and patient outcomes (Griffith et al., 2013; Libbrecht & Noble, 2015; Shipp et al., 2002; Whitney et al., 2015) has been revealed. In the field of bacterial pathogens, three recent studies successfully used machine learning algorithms in the discovery of regions in the genome that are associated with antimicrobial resistance (Davis et al., 2016; Drouin et al., 2014; Santerre, Boisvert, Davis, Xia, & Stevens, 2015).
We describe this approach to application of WGS data in microbial risk analysis with L. monocytogenes as a case study. A risk assessment approach applying WGS data to produce distinct associations between genotypes and frequency of clinical cases is proposed. Such models will facilitate the setup of web‐based tools for the analysis of whole genome sequence data from microbial pathogens or potential pathogens that return an estimate of the resulting risk or health burden at the population level. We also explore the potential of machine learning algorithms for the identification of relevant features in a complex WGS data set, which may facilitate robust and reliable predictions.
2. METHODS
2.1. Hazard Identification
L. monocytogenes is a highly diverse species. A distinction can be made into four lineages (Piffaretti et al., 1989), where L. monocytogenes from lineage I have been more strongly associated with clinical cases than those from lineage II (Orsi et al., 2011). Some strains from lineage I as well as II are responsible for 95% of listeriosis cases (Kathariou, 2002). Strains from lineages III and IV are more strongly associated with animal and natural environment (Haase et al., 2014).
Another distinction can be made using multi loci sequence types (MLST) (Ragon et al., 2008), which detect nucleotide variations within seven housekeeping genes and define sequence types (STs) (same ST defined when all alleles are identical) or clonal complexes (CCs) (separate CC defined when only one allele is different) based on allele combinations. This method has indicated that seven CCs are prevalent among food and clinical cases (Ragon et al., 2008). The most widespread clones are CC121, CC1, CC9, CC2, CC6, CC8, CC16, CC5, and CC4. Strains from CC1, CC2, CC4, and CC6 are strongly associated with human infections, whereas CC121 and CC9 with food (Maury et al., 2016). Hypervirulent strains from CC4 harbor a six‐gene cluster that was recently demonstrated to enhance invasion of the brain and placental tissues in humanized mouse models (Maury et al., 2016). Maury et al. (2016) further differentiated L. monocytogenes clones using NGS data based on their association with human central nervous system (CNS) or maternal–neonatal (MN) listeriosis. The use of NGS data input such as genetic loci associated with virulence factors as well as the phenotypic tendency toward bacteremia, CNS, or placenta infections in susceptible groups of the population is an opportunity to further refine risk assessment in L. monocytogenes.
2.2. Hazard Characterization
Strains of L. monocytogenes have demonstrated considerable variation in virulence, which may also influence the variation in risk of illness associated with different strains. However, serogroups are defined as strains in most studies addressing strain variability in virulence or risk of illness (FDA, 2003; Pouillot, Hoelzer, Chen, & Dennis, 2015). Even though particular serogroups have been associated with higher proportion of cases and outbreaks, serotypes from foods do not reflect the disease distribution, and WGS rather than serotyping data have been recommended for strain‐specific studies (FDA, 2003). An increasing number of virulence and environmental stress resistance genes have been reported in L. monocytogenes and their occurrence singly or in combination may be associated with increased pathogenic potential and the associated epidemiological increase in disease incidence (Maury et al., 2016). Surface and secreted proteins support the mediation of microbial response to the environment and the eventual host infection by pathogens (Abee, Van Schaik, & Siezen, 2004). Various surface or secreted proteins in L. monocytogenes also play a role in invasion, escape from the phagocytic vacuole, and cell‐to‐cell spread. Food safety concerns are increased when such adaptation of microorganisms to changes in environments increase resistance to environmental and host stress (Abee et al., 2004). Recognition and efforts have been made to account for virulence variability in L. monocytogenes and recent attempts have been made to develop dose–response modeling taking this variability into account by defining serogroups as strains (FDA, 2003; Pouillot et al., 2015). However, higher‐resolution data are needed for more precise dose–response models that better capture the variability in L. monocytogenes strain virulence.
2.3. Microbial Strains and Bioinformatics Analysis
2.3.1. L. monocytogenes Strains
The bottleneck in the hazard characterization step in MRA using NGS data is often the lack of reproducible health endpoints linking genotypic to phenotypic data (Brul et al., 2012). The L. monocytogenes isolates included in this study were from an exhaustive and epidemiologically balanced surveillance in France. The 245 strains were selected from a nonredundant collection of 7,342 isolates from food (n = 4,551) and clinical (n = 2,791) sources sampled in France between 2005 and 2013. Selection of the 246 strains from the collection was based on MLST and PFGE typing by Maury et al. (2016) for further study aiming at sampling a representative panel of L. monocytogenes species diversity. The 7,342 isolates were collected by the French National Reference Center (NRC) for Listeria (n total = 6,804; n food = 4,013; n clinical = 2,791) and the French National Reference Laboratory (NRL) for Listeria (n total = n food = 538). In France, surveillance of L. monocytogenes in food and occurrence of listeriosis are organized around the “Cellule Listeria” consisting of multiple partners dedicated to either clinical or food investigation. The aim is to identify the foods associated with listeriosis cases with the ultimate aim of proactively reducing the risk of exposure and new cases of the disease. Listeriosis is a noticeable disease and each case as well as its details should be reported to the responsible ARS (regional health agency). The ARS sends each isolated strain to NRC (national reference center represented by the Pasteur Institute in Paris). Food consumption investigation is then performed based on a questionnaire in order to identify the origin of the infection. Samples are also collected from homes of consenting patients and strains isolated from these investigations are sent to the NRC, where they are characterized and compared to the strains isolated from the patient (Roussel et al., 2012). Due to the route of contamination of L. monocytogenes, food industries routinely perform “own‐check” at various steps of the food production chain and send isolated strains to LNR (French agency for food, environmental, and occupational health and safety represented by Anses) or NRC. In addition, state authorities regularly organize inspections to monitor L. monocytogenes in multiple food matrices. Strains isolated from these sources are sent to the LNR for comprehensive characterization. The NRC collects nearly all isolates involved in human infection cases in France, amounting to an average of 360 strains per year. NRC also collects approximately 700 food or environmental L. monocytogenes strains from food alerts.
This systematic and dual surveillance also ensures that each year more than 98% of clinical strains are sampled and possibly cross‐linked with source food to both investigate and prevent listeriosis cases or outbreaks. Because of this exhaustiveness in sampling, a reliable report of all listeria cases is published every year and realistic frequencies of each type of listeriosis are performed (septicemia, neurological infection, maternal fetal, and other rare types) (Lecuit, Leclercq, Chenal‐Francisque, & Charlier, 2015). Food isolates in this study were part of a collection of 3,143 isolates from food alerts (Roussel et al., 2012). The 4,551 food strains also included strains isolated during investigations of neurological forms of listeriosis (n = 178, 3.9%), self‐reports by food industries (n = 692, 15.2%), and food surveillance activities (n = 538, 11.8%). Redundancy in the panel of strains from food alerts was prevented by selecting only one isolate from the same date, food source, food alert number, and MLST clone. Other nonalert food isolates were deduplicated by selecting an isolate from the same date of isolation and food source. This resulted in 7,342 food and clinical‐associated isolates from which the 245 sequenced strains were selected after MLST and PFGE typing to obtain a panel of strains representative of the original population. The clinical frequency, consisting of percentage of reported cases associated with each of the clinical strains, was treated as the outcome or dependent variable in this study (Maury et al., 2016) (data available in Supporting Information Tables SI and SII).
The 245 strains encompassed 207 strains from food as well as food environment and 38 clinical strains. The 38 clinical case strains consisted of (i) 30 clinical strains from the work of Maury et al. (2016), (ii) strains representative of ST218 and ST2 consisting of six strains isolated from an outbreak in England by Public Health England and two other clinical strains belonging to ST121.
2.3.2. Virulence Genes Database
The L. monocytogenes population is very structured, as shown by the huge diversity between lineages almost to species level (Haase et al., 2014). This study considered an exhaustive set of virulence and associated genes and compared their profiles among two diverse panels of food and clinical strains. An exhaustive literature review for all known virulence‐associated factors, virulence factors, virulence genes, and environmental stress tolerance genes was performed. A final set of 136 genes was selected (Supporting Information Tables SI and SII). Amino acid sequences of the genes were extracted from the NCBI protein database. Multiple sequences were found for each query and in such cases, sequences from EGD‐e strain, which has been the most extensively annotated strain, were used as a reference. A multi fasta nucleic acid (multi‐fna) file was subsequently built for use as a query database.
2.3.3. Assembly and Alignment
The program Velvet for de novo assembly of short reads (Zerbino & Birney, 2008) was used for the assembly of the raw reads. Prediction of open reading frames and proteins was performed using Prodigal for each of the de novo assemblies (Hyatt et al., 2010). Each genome's predicted proteins were aligned against the virulence database using BLASTP, a Basic Local Alignment Search Tool (NCBI‐blast version 2.3.31+). The best hits from the assessment of the length and similarity were kept as the desired potential virulence gene. A matrix consisting of best hit in percentages for each virulence gene in each genome was constructed. Heatmaps were used to visualize the percentage alignment matrix of both the food and clinical strains using R version 3.3.1.
2.4. Predictive Modeling
For MRA based on WGS data, we aimed at linking data on the genome composition with the clinical outcome in humans. We used machine learning algorithms that in design follow the scientific methodology involving design–learn–test processes. The hypothesis is that a machine learning model can recognize certain feature(s) based on the sequences from the strains used as inputs. This is followed by the use of the algorithm itself to predict features in an unknown sample based only on the sequence. Supporting Information Fig. S1 illustrates the machine learning workflow adopted in this study for predicting risk of illness from virulence and environmental adaptation genes in L. monocytogenes.
We used classification, which aims to identify discrete categories of new observations by studying a training data set. We used supervised learning, which allows for the classification of patterns in the data set (also referred to as instances or features) into a set of categories (also referred to as classes or labels) (Rokach, 2010). Classification algorithms were used for the discrete categories of the frequency of illness outcome. The following steps were followed: (1) selection of the best model in predicting frequency of illness given the sequencing data, (2) examination of the predictive importance of genes (features) or their groups using the best performing model, and (3) optimization of the performance of the chosen model while accounting for influence of feature selection on model accuracy, and other performance measures such as positive and negative predictive power (Supporting Information Fig. S1). Exploration and further analyses were performed in R version 3.4.1 and for reproducibility, session information and the list of respective packages along with their versions are included in Supporting Information.
2.4.1. Data Exploration
Models fit on data whose generating mechanisms result in zero‐variance predictors may either crash or result in unstable fit (Kuhn & Johnson, 2013). When predictors have only a handful of unique values occurring at low frequencies, they may also yield zero‐variance predictors when the data are split into cross‐validation/bootstrap subsamples. The first step was to identify such predictors in the data by two metrics. The first one is the frequency ratio, which is the frequency of the most prevalent value compared to the second most frequent value. Values should ideally be either close to one for satisfactory predictors or substantially large for highly unbalanced data. We also calculated the percent of strains having unique values per predictor (i.e., gene) as the number of unique values over the total number of strains expressed as a percent. Percent of unique values approaches zero as the granularity of the data increases. Applying both criteria is important to avoid false exclusion of data in instances such as data from a discrete uniform distribution, where data have low granularity even though they are evenly distributed. Excluding such data resulted in a selection of 50 predictor genes.
Frequency of illness consisted of percent of reported cases associated with each isolate within an ST (Supporting Information Table SII). This frequency of illness was sparse in that some deciles did not contain data values, while values were not well distributed in the other deciles. In such cases, statistics as well as machine learning algorithms produce better performing models when continuous attributes are discretized by partitioning into K equal lengths or width from K% of the total data. Based on the performance statistics in Section 2.4.5, the clinical frequencies associated with the clinical strains were discretized into dentiles (10 parts, each containing one‐tenth of the class percentage). The accuracy of the models trained using classes resulting from this discretization was confirmed by the high class‐specific accuracy sensitivity and specificity. Clinical frequencies associated with the clinical isolates ranged from 7 to 71, which resulted in seven classes.
2.4.2. Subsampling for Class Imbalances
Exploration of predicted variable or classes (Supporting Information Fig. S2) revealed class imbalances. Frequency of illness for two isolates was missing. Imputations of missing data were conducted using the missForest R package, which is an RF‐based technique that is computationally efficient for high‐dimensional data consisting of both categorical and continuous predictors (Stekhoven & Bühlmann, 2012).
Robustness and the use of accuracy as a model fitness measure in machine learning methods are adversely affected by class imbalances (Velez et al., 2007). The learning of most ML methods is biased toward important patterns for the larger of the two classes. In many instances, available WGS data versus the associated phenotype do not allow for a priori sampling approach to cater for class imbalances. Post hoc sampling approaches may help to mitigate the effects of the imbalance during model training (Kuhn & Johnson, 2013). Such subsampling approaches include downsampling and upsampling the data. In an approach by Ling and Li (1998), upsampling is performed by sampling cases from the minority classes with replacement until each class has approximately the same number. Additional random samples to the initial minority class data equalize the minority class to the majority. We used upsampling in R environment for our data set.
2.4.3. Data Splitting
The isolates were first divided into training (70%) and testing sets (30%) (Supporting Information Fig. S1). A validation set was not split from the data owing to the size of the data set, which may lower the power or precision of both the test and validation data sets. Validation using a single test set can be a poor choice (Hawkins, Basak, & Mills, 2003; Martin & Hirschberg, 1996; Molinaro, Simon, & Pfeiffer, 2005). Resampling by cross‐validation was applied to produce performance estimates superior to single test sets by the evaluation of multiple alternate versions of the data. The model sequence was such that the model input samples were randomly partitioned into 10 sets of roughly equal size, held‐out samples were used to estimate accuracy, the first subset was returned to the training set, and the procedure was repeated with the second subset held out and so forth (Kuhn & Johnson, 2013). Accuracies recorded from each run were extracted and used for model performance assessment and model selection.
2.4.4. Model Selection
The predictive performance of the most accurate machine learning methods of common choice in many application domains was compared. These methods include RF (Machado, Mendoza, & Corbellini, 2015; Ogutu, Piepho, & Schulz‐Streeck, 2011), SVM (radial and linear kernels) (Kuhn, 2008; Ogutu et al., 2011), neural networks (NNs), gradient boosting (GBM), and logit boost (LB) (Kuhn, 2008). Each of these methods presents inherent beneficial properties, which are outlined in the Supporting Information.
Each model was built 10 times followed by a selection of the best performing model based on average accuracy and Pearson correlation between the observed and predicted values from the testing data set. Random data splitting was performed, the models were trained, predictions were performed, and accuracies were recorded in each run using caret packages for the R statistical environment (Kuhn et al., 2012; Liaw & Wiener, 2002). A train control parameter was included in each of the models to enable cross‐validation (10 folds) and parallel processing.
The statistical significance of the differences in the model accuracies was tested using analysis of variance, at significance α value of 0.05. To further assess the predictions, model agreement accuracy was also compared for RF, LB, NN, GBM, and SVM‐radial by comparing prediction Pearson correlation values.
2.4.5. Model Evaluation and Prediction
A confusion matrix was plotted for initial model evaluation. This is a cross‐tabulation of the observed and predicted classes for the data whose diagonal cells denote cases where the classes are correctly predicted, while the off‐diagonals illustrate the number of errors for each possible case. The overall accuracy was also compared to the no‐information rate. The no‐information rate is a measure of the accuracy rate possible from randomly guessing the classes without the use of a model. It is desirable that models show accuracy greater than this random guess rate. In order to take into account the class distributions of the training set samples in model diagnosis, Cohen's kappa was also computed as: , where O is the observed accuracy and E is the expected accuracy based on the marginal totals of the confusion matrix. Kappa statistic values range from −1 to 1, where 0 implies no agreement between the observed and predicted classes and 1 suggests perfect concurrence between the predicted and observed classes in the model.
Landis and Koch (1977) proposed kappa statistic values of 0–0.20 as slight, 0.21–0.40 as fair, 0.41–0.60 as moderate, 0.61–0.80 as substantial, and 0.81–1 as almost perfect. Fleiss, Levin, and Cho (2003) suggested kappa values greater than 0.75 as excellent, 0.40–0.75 as fair to good, and <0.40 as poor. While both scales are arbitrary, accompanying them with a confusion matrix enhances confidence in the accuracy of the interpretation. Sensitivity and specificity, as well as balanced accuracy, were also calculated for the individual classes. The final model selected from Section 2.4.4 was used to perform predictions on the food isolate data set.
2.4.6. Variable Importance
A model‐variable importance measure was used. The advantage of model based in contrast to outside measures is that performance measures are closely associated with model performance. Additionally, the correlation structure between the predictors can be included in the importance calculation. Variable importance was assessed from the final selected model using the caret package in R. For instance, for the RF model, the prediction accuracy from an out‐of‐bag portion of the data is documented for each tree during the model run as well as for each associated predictor variable. The average of the difference between the two accuracies over all trees is then computed and normalized by the standard error. Correlation among trees is lessened by a random selection of predictors, where trees are built from a random subset of the top k predictors at each split in the tree (Dietterich, 2000).
2.5. Data Availability
Accession numbers, metadata, and gene alignment data of L. monocytogenes strains used are provided in Supporting Information Tables SI and SII.
3. RESULTS
3.1. Virulence‐Related Genes and Factors
A set of 81 genes of the 136 tested genes from the food isolates was aligned at full length for all the L. monocytogenes strains (Supporting Information Fig. S4). Some genes were heterogeneously distributed among the strains. The virulence gene profiles of strains from similar lineages were homogeneously distributed except for 13 strains from lineage II. Similarly, strains of the same molecular serotype, ST, and CC showed similarities in their virulence gene profiles. InlF demonstrated a unique characteristic by appearing exceptionally truncated, at less than 30% of its full length, among L. monocytogenes belonging to ST121. This gene was considerably truncated among strains from lineage II at a length of up to 70% of the full‐length protein.
A similar trend was exhibited by the clinical isolates, which clustered according to their lineage, molecular serotype, CC, and ST (Supporting Information Fig. S5). All the 81 genes that occurred at full alignment length and the ones that varied among the food isolates also showed a similar trend for the clinical strains. The alignment of clinical strains belonging to ST121 was also truncated at only 30% of the full‐length protein for InlF.
3.2. Predictive Modeling
3.2.1. Model Selection
We compared the performances of the machine learning methods RF, SVM (radial and linear kernels), GBM, NN, and LB. Details on these methods and their strengths are included in the Supporting Information. A selection of the best performing models was performed by evaluating average accuracy and Pearson correlation between the observed and predicted values from 10 model repeats. Predictive performances were tested with these 10 cross‐validations for the candidate models RF, SVM (radial and linear kernels), GBM, NN, and LB models (Supporting Information Fig. S3).
From average accuracy point of view, NN, GBM, and SVM‐linear kernel were the best performing models. These differences were, however, not statistically significant (F‐statistic: 0.24 on 5 and 54 DF, p‐value: 0.943). The valid accuracies for RF, GBM, NN, LB SVM‐linear kernel, and SVM‐radial kernel were 0.89, 0.88, 0.89, 0.86, 0.89, and 0.7, respectively. All three models were in full agreement of predicted values and we choose to proceed with SVM‐linear kernel for building the final model.
3.2.2. SVM‐Linear Kernel Model
The final SVM model was trained using 70% of the data and tested using the rest of the data as a testing set (30%). Resampling by cross‐validation was applied to produce performance estimates. The confusion matrix (Fig. 1) depicting a cross‐tabulation of the actual and predicted classes using a percentage normalization of the tabulated data showed that the model predicted at least 67% of the classes correctly.
Figure 1.
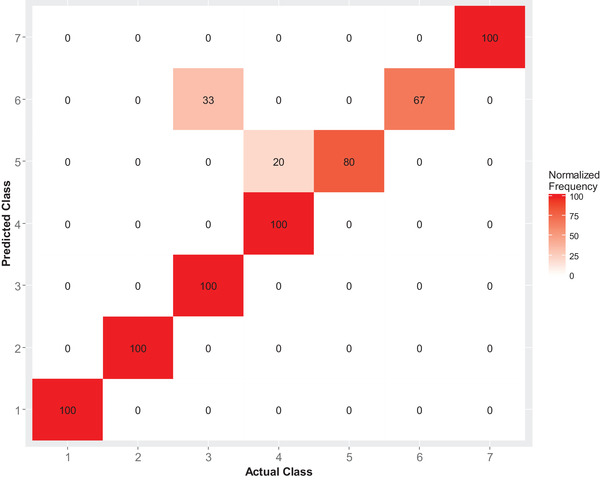
Cross‐tabulation of the actual and predicted classes for the predictions from the support vector machine model normalized as a percentage.
The accuracy of the final SVM model trained with all the predictor variables over the 10‐fold cross‐validation was 89% (95% CI: 68%, 97%). The no information rate (NIR) was 0.25 and the test assessing if accuracy was greater than NIR yielded a p‐value of <0.001.
The kappa statistic was 0.85, which is almost perfect according to criteria by Landis and Koch (1977) and excellent according to Fleiss et al. (2003). Sensitivity and specificity except the sensitivity for class 6 were all ≥0.8. The balanced accuracies for the classes were ≥0.8 (Table I).
Table I.
Sensitivity, Specificity, and Balanced Accuracy for the Frequency of Illness Predictions from the Support Vector Machine Model
| Class | |||||||
|---|---|---|---|---|---|---|---|
| 1 | 2 | 3 | 4 | 5 | 6 | 7 | |
| Sensitivity | 1 | 1 | 1 | 1 | 0.8 | 0.67 | 1 |
| Specificity | 1 | 1 | 0.91 | 0.95 | 1 | 1 | 1 |
| Balanced accuracy | 1 | 0.96 | 0.98 | 0.9 | 0.83 | 1 | |
3.2.3. Variable Importance
The most important genes included Inlk, Auto, GtcA, InlJ, IisY, IisD, IisX, IisH, IisB, Ami, GadA, ActA, InlF, and lmo2026 as well as a selection of recently reported genes FAM002725, FAM002729, FAM002728, FAM003296, FAM003297, and FAM003164 (Fig. 2).
Figure 2.
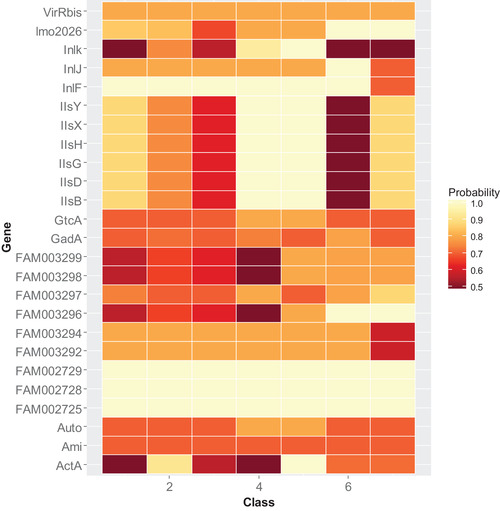
The 20 most important predictor genes for the frequency of illness presented by their class probabilities.
FAM002725, FAM002728, and FAM002729 were associated with probabilities around 1 as important predictors for all the classes of illness frequencies. InlF also occurred at highest probabilities for all frequency of illness categories except highest category 7. Several virulence genes were associated at high probabilities with frequency of illness categories above 5 (50%). Virulence genes InlJ and Inlk were uniquely associated with high frequencies of clinical illness categories 6 and 5, respectively, and were least important predictors of the lower categories of illness frequencies. The genes IisY, IisD, IisX, IisH, and IisB also uniquely occurred at high probabilities in higher frequency of illness categories 4 and 5. Genes lmo2026 and FAM003296 were associated with highest clinical frequencies categories 6 and 7.
We also assessed the prevalence of the predictor genes among the different types of matrices of origin of the isolates (Fig. 3). Virulence genes InlJ, Inlk, and lmo2026, which were associated at high probability with high frequencies of clinical illness categories (Fig. 2), were also highly prevalent in all sources of the isolates (Fig. 3). Gene lmo2026 associated with highest clinical frequencies categories 6 and 7 occurred at highest probability in isolates from ready‐to‐eat foods. InlF, which occurred at high probabilities in isolates associated with high illness categories, occurred at high prevalence in clinical isolates as well as in isolates of dairy and composite food origin. Isolates from composite foods (as well as clinical isolates) also contained genes FAM002725, FAM002728, and FAM002729, which are associated at both low and highest probabilities with highest frequencies of clinical cases.
Figure 3.
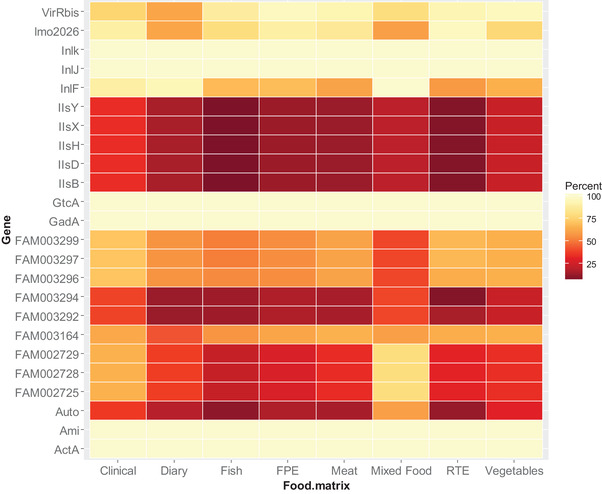
Prevalence of important genes in clinical and different food sources of the isolates. FPE, food process environment; RTE, ready‐to‐eat foods; Mixed Food, composite food made of mixed food types.
4. DISCUSSION
The use of historical strains from selected cases to set dose response in risk assessments neglects within‐species heterogeneity in microbial virulence. Such is the case for L. monocytogenes, which are considered in risk assessments to exhibit uniform pathogenicity despite the fact that lineage I (serotype 4b) has been associated more with clinical isolates when compared to lineage II (Maury et al., 2016). Efforts to account for variability in strain virulence during MRA have enabled the exploration of the marginal distribution of virulence in L. monocytogenes by regarding serotypes as strains (FDA, 2003). WGS provides a potential for higher resolution MRA by precise classification of virulence in individual strains (Pielaat et al., 2013). However, the high‐dimensional nature and complexity of the interaction between the contribution of environmental and genetic factors to disease for individual cases present challenges in risk modeling using single‐variant association testing procedures. Furthermore, even though erstwhile successful approaches such as GWAS studies have revealed an increasing number of genetic variants associated with certain traits and human disease, the statistical association testing approaches have only enabled the identification of a small portion of the heritability whose clinical utility both as individual and combined effects is diminutive (Maher, 2008; Okser et al., 2013). Machine learning methods play a potential role in both prediction and interpretation based on such large, complex data sets, where machine learning techniques “learn” to recognize important patterns in the data (Libbrecht & Noble, 2015). We evaluated machine learning as a tool for increasing the precision of current MRA using the case of L. monocytogenes.
4.1. L. monocytogenes Strains
Incorrect classification from classifiers may result from variations in strains not captured in the training set. Dissimilarities in population genetic structure, where a number of hidden microbial strains or human population subgroups may result in divergent disease phenotypes, result in higher false‐positive rates (Okser et al., 2013; Tian, Gregersen, & Seldin, 2008). To circumvent such a possibility, we used a reasonably representative panel from an exhaustive screening of L. monocytogenes from five main food matrices and clinical cases consisting of 46 different STs and 38 distinct CCs.
4.1.1. Virulence‐Related Genes and Factors
The gene InlF was exceptionally truncated at below 30% of its full length in L. monocytogenes from ST121 in both food and clinical isolates and at 70% of the full‐length protein in strains from lineage II. ST121 is the most prevalent L. monocytogenes clone, followed by CCs 1, 9, 2, 6, 8 and 16, 5, and 4 in decreasing order of prevalence (Maury et al., 2016). It is also reported that ST121 is one of the STs that encompasses the less pathogenic strains and has not been associated with large outbreaks but only with a few sporadic cases (Henri et al., 2016). InlF, which is part of a large group of surface‐exposed leucine‐rich repeat (LRR) proteins, is involved in adhesion between L. monocytogenes and the host cell. The internalin family has a modular architecture comprising an N‐terminal cap domain, an LRR domain containing 22 amino acid repeats, an interrepeat region domain, and varying C‐terminal repeats (Bierne, Sabet, Personnic, & Cossart, 2007). InlF was previously identified as involved in mediated adhesion and invasion of murine fibroblasts and hepatocytes under ROCK pathway inhibition (Kirchner & Higgins, 2008). Ghosh et al. (2018) recently identified InlF using mouse models as a surface protein involved in the infection of the brain interactively with vimentin, a host cell surface protein. More investigations are suggested regarding the possible consequence of L. monocytogenes possessing this truncated InlF gene in epidemiology and food safety.
4.2. Predictive Modeling
4.2.1. Model Selection
When comparing different machine learning models, including RF, SVM‐radial, SVM‐linear, NN, GBM, and LB, the average accuracy of NN, GBM, and SVM‐linear kernel was highest though this difference was not statistically significant. We proceeded with SVM‐linear kernel as the comparison with the other top models, based on their average accuracy ranking, was close to full agreement. Model diagnostic statistics supported SVM‐linear kernel as an appropriate model for the sequence data. An SVM model presents training data as points in space, which are mapped so that the data from separate categories are divided by a clear gap by making this gap as wide as possible (Cortes & Vapnik, 1995). SVMs are finding increased applications in biology, especially in gene expression data analysis in research areas such as tissue classification, gene function prediction, protein subcellular location prediction, protein secondary structure prediction, and protein fold prediction (Moguerza, Muñoz, & Mu, 2006). SVMs apply mathematical features that highly adapt them for the highly dimensional genetic data such as the flexibility in choosing a similarity function, sparseness of solution for large data sets, aptness for large feature spaces, and the capacity to recognize outliers (Brown et al., 2000). SVMs have therefore been reported to perform better or equally well when compared to other machine learning methods in biological applications (Moguerza et al., 2006). Davis et al. (2016), who used AdaBoost to make accurate classifiers for antibiotic resistance prediction, recommended the exploration of other algorithms, such as RFs and SVMs, which may improve the predictions. In our study, SVM was highly accurate in classifications based on genes corresponding to genomic regions influencing clinical phenotype in L. monocytogenes.
4.2.2. Variable Importance
In addition to accurate risk prediction, machine learning models enable feature selection by identifying subsets of genes whose expression patterns lead to different types of specific phenotypes. This allows: (i) identification of a small set of genes with best predictive potential, (ii) use of the trained algorithm to comprehend the biological background (Glaab, Bacardit, Garibaldi, & Krasnogor, 2012; Libbrecht & Noble, 2015; Urbanowicz, Granizo‐Mackenzie, & Moore, 2012) to identify only the genes relevant to the study objective, and to (iii) training the model with the highest accuracy (Libbrecht & Noble, 2015). The most important genes FAM002725, FAM002728, and FAM002729 were also associated with probabilities around 1 as important predictors for all the classes of illness frequency. These genes are part of syntenic genes strongly associated with high virulence in L. monocytogenes by Maury et al. (2016). The most important gene group also included LlsX, LlsY, LlsH, LlsG, LlsD, and LlsB. These genes are part of an extra pathogenicity island designated LIPI‐3, which is found in lineage I strains of L. monocytogenes as part of eight genes in the sequential order: llsAGHXBYDP (Clayton et al., 2014). LlsA encodes a structural peptide LlsB, while Lls Y and D encode enzymes that perform post‐translational modifications; Lls G and H encode an ABC transporter; Lls P encodes a protease; while the function of Lls X is unknown. The associated promoter, Plls A, which is situated upstream of lls A, is induced by oxidative stress, suggesting that expression of the LIPI‐3 genes may be induced in the phagosome of macrophages. LIPI‐3 genes when expressed lead to the production of a hemolytic and cytotoxic factor, Listeriolysin S (LLS), which plays a role in L. monocytogenes virulence (Cotter et al., 2008). LLS contributes to the survival of L. monocytogenes in polymorphonuclear leukocytes and contributes to virulence in the murine model (Clayton et al., 2014). Lineage I strains have therefore been linked to most of the listeriosis outbreaks (Cotter et al., 2008).
The most important genes also included Auto as well as a selection of recently reported genes by Maury et al. (2016), namely, FAM003292, FAM003294, FAM003296, FAM003297, FAM003298, and FAM003299. These genes are associated with high illness frequency in clones, which were found to infect the liver (CC1 and CC6) and brain (CC1, CC4, and CC6) more efficiently. Among these clones, CC4 is associated with the highest proportion of clinical isolates and is strongly associated with both CNS and MN infection in humans (Maury et al., 2016). The gene Auto encodes Auto, which is a surface‐associated autolysin of L. monocytogenes necessary for entry into eukaryotic cells and virulence (Cabanes, Dussurget, Dehoux, & Cossart, 2004). Among the internalins, InlF, InlJ, and Inlk were among the top predictors of high clinical frequencies. Internalins are key virulence factors that contribute in pathogenesis steps ranging from adhesion to receptor recognition (Bierne et al., 2007; Neves, Job, Dortet, Cossart, & Dessen, 2013; Sabet, Lecuit, Cabanes, Cossart, & Bierne, 2005). Inlk is a surface‐associated internalin involved in escape of listeria from autophagy (Neves et al., 2013). The results indicated that certain well‐described virulence and virulence regulation genes involved in infection pathogenesis steps by L. monocytogenes, such as adhesion and invasion in the mammalian host cells (for instance, inlA, Lap, FbpA, lapB, InlF, DltA, InlB, and Vip), growth in the host cell cytoplasm, intracellular mobility, and phagosomal escape (hly, plcA, and plcB), were not among the important predictors of frequency of illness. Furthermore, important virulence genes such as inlA and the central transcription regulator PrfA were present at alignment percentages close to 100 in the genomes of all food and clinical isolates and were therefore not good predictors of the frequency of illness. These important genes can be used to infer risk heterogeneity in L. monocytogenes by decomposing pathogenicity into different strata. Machine learning models enables identification of interactions between genetic loci, thereby capturing the multifactorial nature of complex diseases. Due to the complexity of the interaction between the environmental and genetic factors in their contribution to disease for individual cases, single‐variant association testing procedures are inadequate (Cordell, 2009; Lehner, 2007; Okser et al., 2013). Such effects are too minute to be accepted under the significance cut lines selected in most research despite the fact that they still have a significant impact on the predictive power at strain level or when considered in combination with other nongenetic risk factors. However, attention should be given to model overfitting or variation from linear descent, which may result in the selection of genes with an unclear role as important predictors (Davis et al., 2016). As the diversity of strains used in training the learners increases, such bottlenecks may be recognized or eliminated.
4.2.3. Occurrence Patterns of Important Genes in Food Types
We also assessed the prevalence of the important genes in different types of food matrices of origin of the isolates. InlF, which occurred at high probabilities in isolates associated with high illness categories, occurred at high prevalence in clinical isolates as well as in isolates of dairy and composite food origin. It is also of concern that the gene lmo2026 associated with highest clinical frequencies categories occurred at highest probability in isolates from the ready‐to‐eat foods, which receive no preconsumption heat treatment or other microbial inactivation treatments. Isolates from composite foods (as well as clinical isolates) also contained genes FAM002725, FAM002728, and FAM002729, which are associated at high probabilities with highest frequencies of clinical cases. Foods of dairy origin, especially soft cheeses, have been implicated as the leading source of listeriosis and have been a major concern to the dairy industry and public health authorities (Melo, Andrew, & Faleiro, 2015). This is especially due to the optimal growth conditions suitable for growth of Listeria in dairy products as well as adaptation to adverse conditions during processing (Melo et al., 2015).
This presents an example of how machine learning can be used to derive lower dimensional data from higher ones. Such opportunity is a potential solution to the curse of high‐dimensionality data encountered in genomics, epigenomics, proteomics, or metabolomics (Libbrecht & Noble, 2015). Further predictions based on reduced features could be used to explore pathway analysis approaches. Pathway analysis examines whether a group of related loci in the same biological pathway is jointly associated with a trait of interest and may be used for a food chain risk assessment incorporating genes coding for proteins likely to be involved in preservation stress survival, growth, and/or virulence (Okser et al., 2013). When predictive models are based on WGS data, the hypothesis is that this will greatly reduce the need for future validation of models in the laboratory and in food (Okser et al., 2013).
The success of an infection, however, is also influenced by host factors. However, Maury et al. (2016) found novel evidence that specific virulence factors among invasive clones compensate for the absence of comorbidities and still successfully caused illness, thereby demonstrating the hypervirulence nature of infection‐associated clones. Improved predictive accuracy, as well as the aggregation of such improvements by the revelation of molecular elements that synergistically enhance the risk of disease phenotype when combined, may result in significant predictive benefits (Okser et al., 2013).
4.3. Linkage with Currently Applied Microbial Risk Assessment
Here we discuss the utility of the proposed approach for improved inference in currently applied MRA approaches by incorporating NGS and epidemiological data to derive higher resolution MRA. We illustrate this using the case of “precision medicine” in human medicine, where similar approaches have already shown promise toward improved diagnostic, therapeutic, and prognostic results. The concept of “precision medicine” emerged in human medicine as a result of increased data availability, decrease in cost of NGS, and availability of high computing capacity. In this approach, medical treatment is tailored to the individual characteristics of a patient (Deisboeck, 2009; Reynolds, 2012). Individuals can be categorized into heterogeneous subpopulations differing in their susceptibility to certain diseases, in prognosis, as well as therapeutic response (Deisboeck, 2009; Reynolds, 2012). Mitigation efforts can therefore be more precisely focused, which addresses the risk versus benefits discrepancies in human medicine (Deisboeck, 2009; Reynolds, 2012). Similarly, past MRA efforts have relied on fixed data about a species from selected historical studies to define hazards, evaluate exposure, characterize the hazard, and set dose response. The pathogen is assumed to be a unit characterized by within‐species homogeneity in virulence. Current dose response models are aimed at estimation of the probability of illness taking into account concentration of ingested pathogenic microorganisms. For successful infection and subsequent illness, a proportion of the ingested microorganisms survive human host barriers. For instance, the infection process by L. monocytogenes consists of a number of steps, including survival and passage through the intestine and invasion of membranes in the intestines, as well as ability after intracellular infection to survive and multiply in phagocytic host cells. It is assumed in most MRA studies that each of the ingested microorganisms is a taxonomic unit with similar probability to complete these steps toward infection and illness so that the number of microorganisms surviving different barriers follows a binomial distribution. However, exchange of genetic determinants between bacterial species implies a dynamic heterogeneity in virulence within the taxonomic unit. The WGS approach defined in this study involves viewing the pathogen not as a taxon, but as a genetic unit. This presents an opportunity for more precise dose–response assessment. The pathogen may be viewed as a genetic unit or strain i, with probability pi expressible as pi = f(p1i, p2i…. pni), where each pxi is the probability of a strain i completing each of the n infection steps x. A prerequisite toward this concept is the calculation of pi for every i in the taxonomic unit population. Using this concept, dose–response relationships can be redefined from the relative proportions of each strain from WGS data.
Inputting whole genome sequence data may assist to resolve differences between clinical endpoint estimations. Priority setting of risk from highly pathogenic strains from the full spectrum of strains based on sequencing data is therefore foreseen in what Pielaat et al. (2013) called an “organization principle.” We hypothesize that this approach will also support more discriminatory food safety efforts by setting more specific microbial criteria. First, the approach overcomes the traditional blanket removal of foods based on pathogens where risk is generalized. The qualified presumption of safety status of existing species can, therefore, be dynamically redefined (Pielaat et al., 2013). For instance, in our study, we demonstrated that L. monocytogenes strains having genes FAM002725, FAM002728, FAM002729, InlF, InlJ, Inlk, IisY, IisD, IisX, IisH, IisB, lmo2026, and FAM003296 were important predictors of the higher frequency of illness. Second, the ML risk prediction approach provides more specific hazard identification and characterization, which may provide important real‐time resolution and prevention of outbreaks caused by new and emerging strains of foodborne bacteria. Further studies are proposed utilizing ML approach inputting genomic data to predict exposure and adaptation of microorganisms to changes in environments, which increases resistance to environmental, processing, and host‐associated stress. Phenotypic data such as adaptation to various environmental stresses, for example, salt, acid, desiccation, and temperature, can be used as dependent variables in ML algorithms trained to categorize strains into different stress response categories based on WGS data. The ML approach will facilitate stress response prediction from the large, complex, and highly dimensional genomic data sets, where ML techniques “learn” to recognize important patterns in the data (Libbrecht & Noble, 2015). Predictive models based on WGS will therefore form a predictive platform for survival, eventual exposure, and more precise dose response during MRA.
4.4. Future Perspectives
WGS‐based MRA will improve the resolution of risk assessments to a level where models that predict the commensal existence of a certain strain in one type of food may also depict the pathogenicity of the same strain to humans in another food type (Pielaat et al., 2013). This may allow for the setting of product‐specific microbial criteria, which could avoid blanket removal of foods based on the findings of pathogens whose perceived threat is generalized (Pielaat et al., 2013). More specific hazard identification and characterization may provide important real‐time resolution and prevention of outbreaks caused by foodborne bacteria. Genes involved in virulence, the severity of disease, host specificity, ecological niche, and mechanisms to adapt to particular nutrient supply in certain food may be revealed (Pielaat et al., 2013). This will lead to the identification of genetic markers that can be measured for epidemiological inference in advance of clinically concerning outcomes such as outbreaks. Genomic inputs data, e.g., SNPs, k‐mers, and whole genome MLST, will enable further exploration and improvement of the predictive power and important predictor information obtainable from the models.
An important assumption in this study is that disease frequencies are a proxy for virulence. Like in the case of other virulence proxies, potential bias in this approach emanates from not accounting for host‐associated factors that may explain variations in disease progression due to immune response and other individual factors. This may be improved in the future as data become available on host‐individual variation in genomic and immunological characteristics. Models can therefore account for relative proportions of each microbial genomic form i as well as human subpopulation j. The clinical frequencies in this study were collected from near exhaustive epidemiological studies and may be a considerable estimation reflection of risk at the population level (Maury et al., 2016). The bottleneck in the hazard characterization step in MRA using NGS data is often due to the lack of reproducible health endpoints linking genotypic to phenotypic data (Brul et al., 2012). This hampers the use of WGS data in MRA (Pielaat et al., 2013). With this study as a first step, future studies will be needed to demonstrate the clinical utility of the approach.
5. CONCLUSIONS
We have described a potential approach toward the application of WGS data in L. monocytogenes risk analysis.
The approach looks promising because prediction of pathogenicity of bacterial pathogens prior to phenotypic data will be an important prerequisite to more informed decision making and improved reaction time. Such models will enable the set up of real‐time online analysis of whole genome sequence data from L. monocytogenes, which could estimate risk/health burden at the whole‐population or strain level. Such models/tools could both improve food safety and reduce the number of unnecessary withdrawals of food contaminated with non/low‐pathogenic strains. Additionally, early detection of the evolution of new pathogenic strains, which lead to new threats, will support timely outbreak detection and decision making. For instance, this study indicates that the InlF gene is truncated among a specific subpopulation of L. monocytogenes that could explain reduced illness frequency of those strains. The role of the truncated InlF protein in attenuating the ability of L. monocytogenes to adhere to host cells resulting in decreased virulence needs to be further investigated.
Further studies on the role of important disease outcome predictor genes in L. monocytogenes and other pathogens need to be conducted. Still, this is to our knowledge the first approach where WGS data have been used to predict disease frequencies in human listeriosis.
Supporting information
Supplementary Material
Figure S1
Table S1
Table S2
ACKNOWLEDGMENTS
This research has received funding from the European Union's Horizon 2020 research and innovation program under grant agreement No. 643476 (http://www.compare-europe.eu/).
[Correction added on 7 December 2018, after first online publication: In section 2.4.5, the equation “Kappa = O − E / 1 − E 1 − E” was changed to “Kappa = O − E / 1− E”.]
REFERENCES
- Abee, T. , Van Schaik, W. , & Siezen, R. J. (2004). Impact of genomics on microbial food safety. Trends in Biotechnology, 22(12), 653–660. [DOI] [PubMed] [Google Scholar]
- Bierne, H. , Sabet, C. , Personnic, N. , & Cossart, P. (2007). Internalins: A complex family of leucine‐rich repeat‐containing proteins in Listeria monocytogenes . Microbes and Infection, 9(10), 1156–1166. [DOI] [PubMed] [Google Scholar]
- Breiman, L. (2001a). Random forests. Machine Learning, 45(1), 5–32. [Google Scholar]
- Breiman, L. (2001b). Statistical modeling: The two cultures. Statistical Science, 16(3), 199–215. [Google Scholar]
- Brown, M. P. , Grundy, W. N. , Lin, D. , Cristianini, N. , Sugnet, C. W. , Furey, T. S. , … Haussler, D. (2000). Knowledge‐based analysis of microarray gene expression data by using support vector machines. Proceedings of the National Academy of Sciences of the United States of America, 97(1), 262–267. [DOI] [PMC free article] [PubMed] [Google Scholar]
- Brul, S. , Bassett, J. , Cook, P. , Kathariou, S. , McClure, P. , Jasti, P. R. , & Betts, R. (2012). “Omics” technologies in quantitative microbial risk assessment. Trends in Food Science and Technology, 27(1), 12–24. [Google Scholar]
- Cabanes, D. , Dussurget, O. , Dehoux, P. , & Cossart, P. (2004). Auto, a surface associated autolysin of Listeria monocytogenes required for entry into eukaryotic cells and virulence. Molecular Microbiology, 51(6), 1601–1614. [DOI] [PubMed] [Google Scholar]
- Carriço, J. A. , Sabat, A. J. , Friedrich, A. W. , & Ramirez, M.; ESCMID Study Group for Epidemiological Markers (ESGEM) . (2013). Bioinformatics in bacterial molecular epidemiology and public health: Databases, tools and the next‐generation sequencing revolution. Euro Surveillance, 18(4), 20382. [DOI] [PubMed] [Google Scholar]
- Clayton, E. M. , Daly, K. M. , Guinane, C. M. , Hill, C. , Cotter, P. D. , & Ross, P. R. (2014). Atypical Listeria innocua strains possess an intact LIPI‐3. BMC Microbiology, 14(1), 58. [DOI] [PMC free article] [PubMed] [Google Scholar]
- Cordell, H. J. (2009). Detecting gene–gene interactions that underlie human diseases. Nature Reviews Genetics, 10(6), 392–404. [DOI] [PMC free article] [PubMed] [Google Scholar]
- Cortes, C. , & Vapnik, V. (1995). Support‐vector networks. Machine Learning, 20(3), 273–297. [Google Scholar]
- Cotter, P. D. , Draper, L. A. , Lawton, E. M. , Daly, K. M. , Groeger, D. S. , Casey, P. G. , … Hill, C. (2008). Listeriolysin S, a novel peptide haemolysin associated with a subset of lineage I Listeria monocytogenes . PLoS Pathogens, 4(9), e1000144. [DOI] [PMC free article] [PubMed] [Google Scholar]
- Davis, J. J. , Boisvert, S. , Brettin, T. , Kenyon, R. W. , Mao, C. , Olson, R. , … Stevens, R. (2016). Antimicrobial resistance prediction in PATRIC and RAST. Scientific Reports, 6(1), 27930. [DOI] [PMC free article] [PubMed] [Google Scholar]
- Deisboeck, T. S. (2009). Personalizing medicine: A systems biology perspective. Molecular Systems Biology, 5, 249. [DOI] [PMC free article] [PubMed] [Google Scholar]
- Dietterich, T. G. (2000). Ensemble methods in machine learning. Lecture Notes in Computer Science, 1857, 1–15. [Google Scholar]
- Drouin, A. , Giguère, S. , Sagatovich, V. , Déraspe, M. , Laviolette, F. , Marchand, M. , & Corbeil, J. (2014). Learning interpretable models of phenotypes from whole genome sequences with the set covering machine . Retrieved from http://arxiv.org/abs/1412.1074.
- FDA . (2003). Quantitative assessment of relative risk to public health from foodborne Listeria monocytogenes among selected categories of ready‐to‐eat foods Center for Food Safety and Applied Nutrition. Retrieved from https://www.fda.gov/downloads/food/foodscienceresearch/ucm197330.pdf.
- Fleiss, J. , Levin, B. , & Paik Cho, M. (2003). Statistical methods for rates and proportions. New York: John Wiley & Sons. [Google Scholar]
- Ghosh, P. , Halvorsen, E. M. , Ammendolia, D. A. , Mor‐Vaknin, N. , O'Riordan, M. X. D. , Brumell, J. H. , … Higgins, D. E. (2018). Invasion of the brain by Listeria monocytogenes is mediated by InlF and host cell vimentin. mBio, 9(1). 10.1128/mBio.00160-18 [DOI] [PMC free article] [PubMed] [Google Scholar]
- Glaab, E. , Bacardit, J. , Garibaldi, J. M. , & Krasnogor, N. (2012). Using rule‐based machine learning for candidate disease gene prioritization and sample classification of cancer gene expression data. PLoS One, 7(7), e39932. [DOI] [PMC free article] [PubMed] [Google Scholar]
- Goulet, V. , Hebert, M. , Hedberg, C. , Laurent, E. , Vaillant, V. , De Valk, H. , & Desenclos, J. C. (2012). Incidence of listeriosis and related mortality among groups at risk of acquiring listeriosis. Clinical Infectious Diseases, 54(5), 652–660. [DOI] [PubMed] [Google Scholar]
- Goulet, V. , King, L. A. , Vaillant, V. , & de Valk, H. (2013). What is the incubation period for listeriosis? BMC Infectious Diseases, 13(1), 11. [DOI] [PMC free article] [PubMed] [Google Scholar]
- Griffith, O. L. , Pepin, F. , Enache, O. M. , Heiser, L. M. , Collisson, E. A. , Spellman, P. T. , & Gray, J. W. (2013). A robust prognostic signature for hormone‐positive node‐negative breast cancer. Genome Medicine, 5(10), 92. [DOI] [PMC free article] [PubMed] [Google Scholar]
- Haase, J. K. , Didelot, X. , Lecuit, M. , Korkeala, H. , Achtman, M. , Leclercq, A. , … Apfalter, P. (2014). The ubiquitous nature of Listeria monocytogenes clones: A large‐scale multilocus sequence typing study. Environmental Microbiology, 16(2), 405–416. [DOI] [PubMed] [Google Scholar]
- Havelaar, A. H. , Brul, S. , de Jong, A. , de Jonge, R. , Zwietering, M. H. , & ter Kuile, B. H. (2010). Future challenges to microbial food safety. International Journal of Food Microbiology, 139(Suppl. 1), S79–S94. [DOI] [PubMed] [Google Scholar]
- Hawkins, D. M. , Basak, S. C. , & Mills, D. (2003). Assessing model fit by cross‐validation. Journal of Chemical Information and Computer Sciences, 43, 579–586. [DOI] [PubMed] [Google Scholar]
- Henri, C. , Félix, B. , Guillier, L. , Leekitcharoenphon, P. , Michelon, D. , Mariet, J.‐F. , … Roussel, S. (2016). Population genetic structure of Listeria monocytogenes strains determined by pulsed‐field gel electrophoresis and multilocus sequence typing. Applied and Environmental Microbiology. 10.1128/AEM.00583-16 [DOI] [PMC free article] [PubMed] [Google Scholar]
- Houle, D. , Govindaraju, D. R. , & Omholt, S. (2010). Phenomics: The next challenge. Nature Reviews Genetics, 11(12), 855–866. [DOI] [PubMed] [Google Scholar]
- Hyatt, D. , Chen, G.‐L. , LoCascio, P. F. , Land, M. L. , Larimer, F. W. , & Hauser, L. J. (2010). Prodigal: Prokaryotic gene recognition and translation initiation site identification. BMC Bioinformatics, 11(1), 119. [DOI] [PMC free article] [PubMed] [Google Scholar]
- Kathariou, S. (2002). Listeria monocytogenes virulence and pathogenicity, a food safety perspective. Journal of Food Protection, 65(11), 1811–1829. [DOI] [PubMed] [Google Scholar]
- Kirchner, M. , & Higgins, D. E. (2008). Inhibition of ROCK activity allows InlF‐mediated invasion and increased virulence of Listeria monocytogenes . Molecular Microbiology, 68(3), 749–767. [DOI] [PMC free article] [PubMed] [Google Scholar]
- Kuhn, M. (2008). Building predictive models in R using the caret package. Journal of Statistical Software, 28(5), 1–26.27774042 [Google Scholar]
- Kuhn, M. , & Johnson, K. (2013). Applied predictive modeling. Berlin: Springer. [Google Scholar]
- Kuhn, M. , Wing, J. , Weston, S. , Williams, A. , Keefer, C. , & Engelhardt, A. (2012). Caret: Classification and regression training . Retrieved from https://cran.r-project.org/web/packages/caret/caret.pdf.
- Landis, J. R. , & Koch, G. G. (1977). The measurement of observer agreement for categorical data. Biometrics, 33(1), 159. [PubMed] [Google Scholar]
- Lecuit, M. , Leclercq, A. , Chenal‐Francisque, V. , & Charlier, C. (2015). Rapport annuel d'activites centre national de reference. Paris. Retrieved from https://www.pasteur.fr/fr/file/3251/download?token=UfOuqmW8.
- Leekitcharoenphon, P. , Nielsen, E. M. , Kaas, R. S. , Lund, O. , & Aarestrup, F. M. (2014). Evaluation of whole genome sequencing for outbreak detection of Salmonella enterica . PLoS One, 9(2), e87991. [DOI] [PMC free article] [PubMed] [Google Scholar]
- Lehner, B. (2007). Modelling genotype–phenotype relationships and human disease with genetic interaction networks. Journal of Experimental Biology, 210, 1559–1566. [DOI] [PubMed] [Google Scholar]
- Liaw, A. , & Wiener, M. (2002). Classification and regression by random forest. R News, 2, 18–22. [Google Scholar]
- Libbrecht, M. W. , & Noble, W. S. (2015). Machine learning applications in genetics and genomics. Nature Reviews Genetics, 16(6), 321–332. [DOI] [PMC free article] [PubMed] [Google Scholar]
- Ling, C. X. , & Li, C. (1998). Data mining for direct marketing: Problems and solutions. In Proceedings of the 4th International Conference on Knowledge Discovery and Data Mining (pp. 73–79).
- Machado, G. , Mendoza, M. R. , & Corbellini, L. G. (2015). What variables are important in predicting bovine viral diarrhea virus? A random forest approach. Veterinary Research, 46(1), 1–15. [DOI] [PMC free article] [PubMed] [Google Scholar]
- Maher, B. (2008). Personal genomes: The case of the missing heritability. Nature, 456(7218), 18–21. [DOI] [PubMed] [Google Scholar]
- Martin, J. K. , & Hirschberg, D. S. (1996). Small sample statistics for classification error rates I: Error rate measurements . Department of Informatics and Computer Science. Department of Informatics and Computer Science Technical Report. Retrieved from papers2://publication/uuid/20419455-12C0-4880-9427-E81FEF4E5964.
- Maury, M. M. , Tsai, Y.‐H. , Charlier, C. , Touchon, M. , Chenal‐Francisque, V. , Leclercq, A. , … Lecuit, M. (2016). Uncovering Listeria monocytogenes hypervirulence by harnessing its biodiversity. Nature Genetics, 48(3), 308–313. [DOI] [PMC free article] [PubMed] [Google Scholar]
- Melo, J. , Andrew, P. W. , & Faleiro, M. L. (2015). Listeria monocytogenes in cheese and the dairy environment remains a food safety challenge: The role of stress responses. Food Research International, 67, 75–90. [Google Scholar]
- Moguerza, J. M. , Muñoz, A. , & Mu, A. (2006). Support vector machines with applications (pp. 322–336). Berlin: Springer. [Google Scholar]
- Molinaro, A. , Simon, R. , & Pfeiffer, R. (2005). Prediction error estimation: A comparison of resampling methods. Bioinformatics, 21(15), 3301–3307. [DOI] [PubMed] [Google Scholar]
- Neves, D. , Job, V. , Dortet, L. , Cossart, P. , & Dessen, A. (2013). Structure of internalin InlK from the human pathogen Listeria monocytogenes . Journal of Molecular Biology, 425(22), 4520–4529. [DOI] [PubMed] [Google Scholar]
- Ogutu, J. O. , Piepho, H.‐P. , & Schulz‐Streeck, T. (2011). A comparison of random forests, boosting and support vector machines for genomic selection. BMC Proceedings, 5(Suppl. 3), S11. [DOI] [PMC free article] [PubMed] [Google Scholar]
- Okser, S. , Pahikkala, T. , & Aittokallio, T. (2013). Genetic variants and their interactions in disease risk prediction—Machine learning and network perspectives. BioData Mining, 6(1), 5. [DOI] [PMC free article] [PubMed] [Google Scholar]
- Orsi, R. H. , den Bakker, H. C. , & Wiedmann, M. (2011). Listeria monocytogenes lineages: Genomics, evolution, ecology, and phenotypic characteristics. International Journal of Medical Microbiology, 301(2), 79–96. [DOI] [PubMed] [Google Scholar]
- Pielaat, A. , Barker, G. , Hendriksen, P. , Hollman, P. , Peijnenburg, A. , & Kuile Ter, B. (2013). A foresight study on emerging technologies: State of the art of omics technologies and potential applications in food and feed safety. EFSA Supporting Publications, 10(10), 495E Retrieved from 10.2903/SP.EFSA.2013.EN-495 [DOI] [Google Scholar]
- Pielaat, A. , Boer, M. P. , Wijnands, L. M. , van Hoek, A. H. A. M. , Bouw, E. , Barker, G. C. , … Franz, E. (2015). First step in using molecular data for microbial food safety risk assessment; hazard identification of Escherichia coli O157:H7 by coupling genomic data with in vitro adherence to human epithelial cells. International Journal of Food Microbiology, 213, 130–138. [DOI] [PMC free article] [PubMed] [Google Scholar]
- Piffaretti, J. C. , Kressebuch, H. , Aeschbacher, M. , Bille, J. , Bannerman, E. , Musser, J. M. , … Rocourt, J. (1989). Genetic characterization of clones of the bacterium Listeria monocytogenes causing epidemic disease. Proceedings of the National Academy of Sciences of the United States of America, 86(10), 3818–22. [DOI] [PMC free article] [PubMed] [Google Scholar]
- Pouillot, R. , Hoelzer, K. , Chen, Y. , & Dennis, S. B. (2015). Listeria monocytogenes dose response revisited—Incorporating adjustments for variability in strain virulence and host susceptibility. Risk Analysis, 35(1), 90–108. [DOI] [PubMed] [Google Scholar]
- Ragon, M. , Wirth, T. , Hollandt, F. , Lavenir, R. , Lecuit, M. , Le Monnier, A. , & Brisse, S. (2008). A new perspective on Listeria monocytogenes evolution. PLoS Pathogens, 4(9), e1000146. [DOI] [PMC free article] [PubMed] [Google Scholar]
- Reynolds, K. S. (2012). Achieving the promise of personalized medicine. Clinical Pharmacology & Therapeutics, 92(4), 401–405. [DOI] [PubMed] [Google Scholar]
- Rokach, L. (2010). Ensemble‐based classifiers. Artificial Intelligence Review, 33(1–2), 1–39. [Google Scholar]
- Roussel, S. , Leclercq, A. , Santolini, J. , Agbessi, A. , Chenal‐francisque, V. , Lailler, R. , … Brisabois, A. (2012) Surveillance des Listeria monocytogenes dans les aliments. Bulletin Épidémiologique, Santé Animale et Alimentation, 50, 51–56. [Google Scholar]
- Sabet, C. , Lecuit, M. , Cabanes, D. , Cossart, P. , & Bierne, H. (2005). LPXTG protein InlJ, a newly identified internalin involved in Listeria monocytogenes virulence. Infection and Immunity, 73(10), 6912–6922. [DOI] [PMC free article] [PubMed] [Google Scholar]
- Santerre, J. , Boisvert, S. , Davis, J. , Xia, F. , & Stevens, R. (2015). Gene identification and strain classification using random forests In Great Lakes Bioinformatics Conference. West Lafayette, IN: Purdue University. [Google Scholar]
- Scallan, E. , Hoekstra, R. M. , Angulo, F. J. , Tauxe, R. V , Widdowson, M.‐A. , Roy, S. L. , … Griffin, P. M. (2011). Foodborne illness acquired in the United States—Major pathogens. Emerging Infectious Diseases, 17(1), 7–15. [DOI] [PMC free article] [PubMed] [Google Scholar]
- Shipp, M. A. , Ross, K. N. , Tamayo, P. , Weng, A. P. , Kutok, J. L. , Aguiar, R. C. T. , … Golub, T. R. (2002). Diffuse large B‐cell lymphoma outcome prediction by gene‐expression profiling and supervised machine learning. Nature Medicine, 8(1), 68–74. [DOI] [PubMed] [Google Scholar]
- Sjöström, M. , Wold, S. , Lindberg, W. , Persson, J. Å. , & Martens, H. (1983). A multivariate calibration problem in analytical chemistry solved by partial least‐squares models in latent variables. Analytica Chimica Acta, 150, 61–70. [Google Scholar]
- Stekhoven, D. J. , & Bühlmann, P. (2012). Missforest‐non‐parametric missing value imputation for mixed‐type data. Bioinformatics, 28(1), 112–118. [DOI] [PubMed] [Google Scholar]
- Tian, C. , Gregersen, P. K. , & Seldin, M. F. (2008). Accounting for ancestry: Population substructure and genome‐wide association studies. Human Molecular Genetics, 17(R2), R143–R150. [DOI] [PMC free article] [PubMed] [Google Scholar]
- Urbanowicz, R. J. , Granizo‐Mackenzie, A. , & Moore, J. (2012). An analysis pipeline with statistical and visualization‐guided knowledge discovery for Michigan‐style learning classifier systems. IEEE Computational Intelligence Magazine, 7(4), 35–45. [DOI] [PMC free article] [PubMed] [Google Scholar]
- Velez, D. R. , White, B. C. , Motsinger, A. A. , Bush, W. S. , Ritchie, M. D. , Williams, S. M. , & Moore, J. H. (2007). A balanced accuracy function for epistasis modeling in imbalanced datasets using multifactor dimensionality reduction. Genetic Epidemiology, 31(4), 306–315. [DOI] [PubMed] [Google Scholar]
- Whitney, D. H. , Elashoff, M. R. , Porta‐Smith, K. , Gower, A. C. , Vachani, A. , Ferguson, J. S. , … Spira, A. (2015). Derivation of a bronchial genomic classifier for lung cancer in a prospective study of patients undergoing diagnostic bronchoscopy. BMC Medical Genomics, 8(1), 18. [DOI] [PMC free article] [PubMed] [Google Scholar]
- Zerbino, D. R. , & Birney, E. (2008). Velvet: Algorithms for de novo short read assembly using de Bruijn graphs. Genome Research, 18(5), 821–829. [DOI] [PMC free article] [PubMed] [Google Scholar]
Associated Data
This section collects any data citations, data availability statements, or supplementary materials included in this article.
Supplementary Materials
Supplementary Material
Figure S1
Table S1
Table S2
Data Availability Statement
Accession numbers, metadata, and gene alignment data of L. monocytogenes strains used are provided in Supporting Information Tables SI and SII.