

Abstract
Aims
Resident and peripherally derived glioma associated microglia/macrophages (GAMM) play a key role in driving tumour progression, angiogenesis, invasion and attenuating host immune responses. Differentiating these cells’ origins is challenging and current preclinical models such as irradiation‐based adoptive transfer, parabiosis and transgenic mice have limitations. We aimed to develop a novel nonmyeloablative transplantation (NMT) mouse model that permits high levels of peripheral chimerism without blood‐brain barrier (BBB) damage or brain infiltration prior to tumour implantation.
Methods
NMT dosing was determined in C57BL/6J or Pep3/CD45.1 mice conditioned with concentrations of busulfan ranging from 25 mg/kg to 125 mg/kg. Donor haematopoietic cells labelled with eGFP or CD45.2 were injected via tail vein. Donor chimerism was measured in peripheral blood, bone marrow and spleen using flow cytometry. BBB integrity was assessed with anti‐IgG and anti‐fibrinogen antibodies. Immunocompetent chimerised animals were orthotopically implanted with murine glioma GL‐261 cells. Central and peripheral cell contributions were assessed using immunohistochemistry and flow cytometry. GAMM subpopulation analysis of peripheral cells was performed using Ly6C/MHCII/MerTK/CD64.
Results
NMT achieves >80% haematopoietic chimerism by 12 weeks without BBB damage and normal life span. Bone marrow derived cells (BMDC) and peripheral macrophages accounted for approximately 45% of the GAMM population in GL‐261 implanted tumours. Existing markers such as CD45 high/low proved inaccurate to determine central and peripheral populations while Ly6C/MHCII/MerTK/CD64 reliably differentiated GAMM subpopulations in chimerised and unchimerised mice.
Conclusion
NMT is a powerful method for dissecting tumour microglia and macrophage subpopulations and can guide further investigation of BMDC subsets in glioma and neuro‐inflammatory diseases.
Keywords: chimeric mouse model, Glioblastoma, glioma microenvironment, macrophage, microglia, nonmyeloablative transplantation
Introduction
Glioblastoma is the most frequent primary brain tumour in adults and one of the most aggressive types of solid cancer. Patients with glioblastoma survive an average of 6 months if left untreated and 12–18 months when treated with maximal safe surgical resection and postoperative radio‐chemotherapy 1, 2. Despite intensive research, new treatment regimens have neither led to substantial improvement of progression‐free and overall survival, nor shown significant reduction in disease and treatment‐related morbidity 3. Reasons for slow progress towards improving outcomes include intra‐ and intertumour heterogeneity, the lack of adequate preclinical models and the role of the tumour microenvironment in sustaining progression and treatment resistance 4, 5, 6.
The glioma microenvironment is complex and heterogeneous 7. It consists of extracellular matrix, reactive astrocytes, glioma‐associated microglia and macrophages (GAMMs), endothelial cells, fibroblasts and soluble factors. These cells contribute to tumour progression but the complexity of their interactions with neoplastic cells makes the modelling of the glioma microenvironment challenging. GAMMs increase substantially with tumour grade, accounting for over 30% of the lesion 5, 8, 9. They promote progression by favouring cell survival, proliferation, migration and angiogenesis 10, 11, 12, 13, 14. Gliomas were found to be significantly smaller in animals with impaired or absent microglia vs. those with normal microglia which further supports the role of GAMMs in glioma progression 15. The composition of GAMMs is still a matter of debate, with studies suggesting that bone marrow derived cells (BMDC) account for the predominant population 16, 17. Investigating and targeting GAMMs remains challenging. Activated microglia and BMDC are morphologically indistinguishable and their phenotype as determined by lineage‐specific antibodies shows significant overlap.
In many studies, the distinction between microglia and peripheral macrophages relied on CD45 18, 19 however, such separation has recently been challenged with evidence that microglia in gliomas can increase CD45 expression 18, 19, 20. Modelling GAMMs is also beset by technical difficulties. Myeloablation obtained by irradiating animals damages the blood brain barrier (BBB) both directly, when the head is not shielded, and indirectly by eliciting a potent systemic inflammatory response 21. BMDCs are mobilised in the circulation by proinflammatory cytokines and can easily penetrate the brain when the BBB is permeable 22. Genetic reporter models using flt3‐GFP permit labelling and distinction of microglia vs. BMDC but not the manipulation of the bone marrow (BM) compartment 23.
An accurate account of the contribution of microglia and BMDC to GAMM populations would allow us to gain a better understanding of their heterogeneity and develop therapeutic strategies aimed at manipulating microglia and the bone marrow derived compartment. In order to investigate the complexity of GAMMs without the damaging effects of irradiation, we developed a nonmyeloablative model using a low‐dose busulfan regimen to achieve complete peripheral hematopoietic chimerism in the absence of BBB damage or central chimerism. Busulfan is a DNA alkylating agent used in clinical practice as a myeloablative conditioning agent either alone or in combination with cyclophosphamide prior to bone marrow transplantation (BMT) 24. Peripheral chimerism in an immunocompetent animal is followed by orthotopic implantation of the syngeneic GL‐261 glioma cell line to generate an aggressive glioma that closely replicates human glioblastoma. This preclinical model is the first that allows for a detailed study of the extent and contribution of bone marrow derived cells to glioma progression.
Methods
Lentiviral vector construction and production
Lentiviral vector (LV) plasmid containing the transgene DsRed Express 2 (DSX2; Clontech Laboratories, Mountain View, CA, USA) was constructed by replacing the enhanced Green Fluorescent Protein (eGFP) gene cassette in pHR.sin.SFFV.eGFP.att.wpre (gift from Dr Steve Howe; University College London) with the DSX2 gene using Gateway technology (Life Technologies, Paisley, UK) 25, 26. LVs were generated by transfection of HEK 293T cells with pMD2G, pΔ8.91gag/pol32 and pHRsin.SFFV. att.DSX2.wpre or pHRsin.SFFV.eGFP.att.wpre plasmids in a 2:1:1 ratio using polyethylenimine (PEI, Polysciences, Warrington, PA, USA). Quantitative PCR was used to determine the number of integrated LV genomes per cell and the infectious titre was calculated as shown previously 27.
Glioma cell culture
GL‐261 cells (National Cancer Institute, Frederick, MD, USA) were cultured in RPMI‐1640 (Sigma‐Aldrich, Dorset, UK), 10% Foetal Calf Serum (FCS) and L‐Glutamine (1 mM) without antibiotics. Labelled GL‐261 lines were generated via transduction with LV‐SFFV‐eGFP or LV‐SFFV‐DSX2 25. Flow cytometric cell sorting to remove nontransduced cells was done using BD FACS Aria flow cytometer (BD Biosciences, Oxford, UK).
Animal maintenance
Experimental mice were housed in individually ventilated cages with a 12‐h light/dark cycle with food and water provided ad libitum in accordance with the Animal (Scientific Procedures) Act, 1986 (UK), under project license number PPL40/3658 with ethics board approval.
Bone marrow transplantation
8‐10 week old female transplant recipients, C57BL/6J CD45.2 (Harlan Laboratories, Bicester, UK) or PEP‐3 CD45.1; (B6.SJL‐Ptprc a Pepc b/BoyJ), received acidified water (pH = 2.8) and irradiated diet the week prior to transplant, in order to prevent gastrointestinal infection. Conditioning consisted of 25 mg/kg/day of busulfan (Busilvex, Pierre Fabre, Boulogne, France), with total doses of 25 mg/kg, 50 mg/kg, 75 mg/kg or 125 mg/kg, delivered via the intraperitoneal route. Whole bone marrow (2–3 × 10⁷ cells in 200 μl Phosphate Buffered Saline (PBS)) was delivered via the tail vein, within 24 h of receiving the final busulfan injection. Donor bone marrow was prepared from 8 to 10 week old female OK‐GFP mice (C57BL/6‐Tg(CAG‐EGFP)10sb/J (“OKABE”), Jackson Laboratories, Bar Harbor, ME, USA) or C57BL/6J, (CD45.2) mice as described previously 20. Peripheral blood chimerism and cell population reconstitution (anti‐mouse CD45.2‐PE, anti‐mouse CD3‐PE‐Cy5, anti‐mouse CD19‐APC‐Cy7, anti‐mouse CD11b−PE‐Cy7), was determined using flow cytometry analysis of tail vein bleeds taken at 4, 8 and 12 weeks post‐transplant (BD FACS Canto II flow cytometer, BD Bioscience, Oxford, UK). The percentage eGFP was normalized to the mean percentage eGFP detection in OK‐GFP peripheral blood (70%) (Figure S1C). For whole brain flow experiments, CD45.1 mice with >80% peripheral CD45.2+/eGFP+ BM chimerism at 12 weeks were intracranially implanted with GL‐261 brain tumours (n = 6) and compared to sham intracranial PBS injection (n = 5), or no injection (n = 2).
Stereotactic injection of glioma cells into intracranial compartment
Chimeric mice (12 weeks post‐transplant with 25 mg/kg busulfan) were anaesthetized using isoflurane (Abbott Laboratories, Maidenhead, UK). 5 × 10⁴ GL‐261 cells or PBS (sham control) were injected into the striatum 2 mm lateral, and 3 mm deep to bregma 28 via single burr hole using a Hamilton syringe (Hamilton, Reno, NV, USA). Mice received standard postoperative care and brains were harvested at 7, 14 and 17 days.
Sample processing
Mice were terminally anaesthetised and transcardially perfused with Tyrode's buffer to minimize confounding peripheral blood artefacts. For histopathological and immunohistochemical analysis, brains were fixed in 4% paraformaldehyde (PFA)/PBS. Two tumour bearing brains and two control brains were then processed to paraffin embedding while the others were incubated in 30% sucrose/2 mM MgCl2/PBS for 24 h at 4°C and stored at −80°C. Six coronal slices from the same areas of bregma (0.98, 0.26, −0.46, −1.18, −1.94, and −2.62 mm; Figure S2) from each mouse. For whole brain dissociation, specimens were placed in ice‐cold PBS without calcium or magnesium (Lonza, Slough, UK).
Tissue analysis and immunohistochemistry
One section from each frozen brain and one section from FFPE brains were stained with haematoxylin‐eosin. The level of brain engraftment, extent of GAMMs and proliferation were determined on consecutive sections of frozen and fixed brains using immunoperoxidase immunohistochemistry with antibodies directed against eGFP (Abcam, rabbit polyclonal, Cambridge, UK; dilution 1:3000), Iba1 (Wako, polyclonal Osaka, Japan; dilution 1:250), Ki67 (Abcam, rabbit polyclonal, Cambridge, UK; dilution 1:250) and Tmem119 (Abcam, Cambridge UK, rabbit polyclonal, dilution 1:50). Permeability of the BBB was tested using a previously described protocol in stroke studies 29. Biotinylated anti‐mouse IgG (Vector Laboratories, Peterborough, UK; Dilution 1 in 500) and anti‐fibrinogen (Dako, Ely,Cambridgeshire UK, rabbit polyclonal, dilution 1:50 000) antibodies were used. Briefly, after washings in PBS, the sections were incubated with biotinylated secondary antibodies followed by Avidin‐Biotin Complex (Vector Laboratories, Peterborough, UK). The reactions were developed with the DAB‐peroxidase kit (Vector Laboratories, Peterborough, UK), using identical developing times for all sections 30. Sections were then washed and rehydrated. Nuclear counterstaining was performed with Mayer's haematoxylin. Slides were finally coverslipped in DPX mounting medium (Leica, Milton Keynes, United Kingdom).
Triple immunofluorescence was performed on free floating sections. They were stained using anti‐mouse eGFP, Iba1, CD11b (Abd Serotec, Oxford, UK; Dilution 1:250) antibodies with the appropriate fluorescent secondary antibodies 21 (1 μg/ml). Three sections were used for staining and mounting: 1 at maximal tumour dimension, and sections taken at 240 μm intervals before and after the maximum dimension section. Slides were scanned using the Pannoramic 250 Flash automated scanning microscope (3D Histech, Budapest, Hungary) and viewed using Pannoramic viewer software (3D Histech).
Image analysis
Quantification of donor cells in peritumoural, tumoural and sham injected areas
To demonstrate that eGFP+ (donor‐derived) cells were primarily located within the tumour borders, eGFP+ cells were counted using FIJI 31 in representative section for each condition. Five high power fields were selected in the peritumoural area, the intratumoural area and the ipsilateral parenchyma in a sham injected animal. Automated counting was performed using the analyse particles plugin (Figure S6).
Quantification of immune cell subtypes in tumour bearing brains
Images (×40 magnification) were captured in Tagged Image file Format (TIFF) format and analysed using Cellprofiler software 32. The analysis pipeline was configured to identify five categories of cells on fluorescence imaging: (i) eGFP+ cells (peripheral cells), (ii) Iba1+ cells (microglia/macrophages), (iii) co‐localizing Iba1+/eGFP+ cells (peripherally derived macrophages), (iv) eGFP only cells = [eGFP+ cells] – [Iba1+/eGFP+ cells] (peripherally derived non‐GAMM cells), (v) microglia = [Iba1+ cells] – [Iba1+/eGFP+ cells].
Quantification of donor cells in nontumour chimeras
eGFP+ (donor‐derived) and Iba1+/eGFP− (microglial) cells were counted using HistoQuant software (3D Histech) in all six sections from each mouse. Automated counting was optimised against a manual count of three single sections, to avoid false positives and negatives, until 95% accuracy was reached. Objects in eGFP+ stained untransplanted wild type (WT) controls (n = 8) were counted to obtain a mean background value which was subtracted from the mean of the transplanted groups. To assess proliferation, Ki67+ cells were counted in six consecutive sections using HistoQuant software, with staining around the choroid plexus and on the very edge of the sections excluded, and validated against manual counting as above. The manual count showed an overestimation of Ki67+ cells for each group, therefore a percentage overestimation was determined and removed from the data generated by the software.
Whole brain dissociation
Dissociation of cerebral hemisphere was adapted from Robinson et al. with modifications 33. Different concentrations of Percoll were prepared by mixing nine parts Percoll (Sigma‐Aldrich) with 1 part of 10X PBS (Lonza, Slough, UK) to make an isotonic solution. 35% and 70% Percoll were then constituted with standard 1X PBS.
Mice were perfused with cold PBS/5 mM EDTA (Sigma‐Aldrich). The brain was divided into tumour and nontumour bearing hemispheres in a sterile Petri dish and each digested with 1 mL Accutase (Merck Millipore, Darmstadt, Germany) for 30 min at 37°C. Samples were mechanically dissociated through a 100 μm cell strainer (Corning, New York, NY, USA) using syringe plungers. The cell strainer was washed with 2% FCS/2 mM EDTA/PBS (FEP) until clean and the sample centrifuged at 280G for 5 min at 4°C. Supernatant was discarded and the cells purified from myelin by resuspending the pellet in 35% Percoll and underlaying with 70% Percoll. The homogenate was centrifuged at 650G without brake for 10 min at room temperature. The myelin layer at the surface was removed and a thin milky layer of cells at the 35%/70% interface was aspirated and resuspended with 5 ml of FEP. The cell suspension was centrifuged at 400G for 5 min at 4°C and the supernatant removed. The cell pellet was then resuspended with 200 μl 2%FCS/PBS for flow cytometry.
Cell preparation and analysis using flow cytometry
Cells were counted and aliquoted at a maximum density of 1 × 10⁶ cells per well in a 96‐well plate (Corning, New York, NY, USA). Cells were fixed with 1% paraformaldehyde (PFA) at room temperature and a Live/Dead Blue cell viability stain was performed (Life Technologies, UK). Samples were then blocked with 45 μl of 5% mouse serum (Vector Laboratories, USA) 2% FCS/PBS for 15 min and stained with a freshly made master mix of antibodies in a volume of 25 μl/sample (Table S1). After staining, cells were washed twice with 2% FCS/PBS and suspended in 200 μl 2% FCS/PBS prior to analysing samples on flow cytometry (BD LSR Fortessa; BD Biosciences, Oxford, UK). Compensation was performed using UltraComp beads (eBiosciences, San Diego, CA, USA), Amine Reactive beads for live/dead staining (ThermoFisher Scientific, Waltham, MA, USA) and OK‐GFP peripheral blood for eGFP detection. Fluorescence minus one (FMO) controls were used instead of isotype controls to delineate gating margins and determine true antibody staining. Blood and bone marrow samples from each animal were also analysed to determine relative CD45.2 chimerism. FlowJo v10 10.0.8r1 was used to analyses all samples (FlowJo LLC., Ashland, OR, USA).
Statistical analysis
Preliminary analysis
Data transformation: Exclusion criteria: Animals which did not display donor chimerism (n = 1) were excluded from analysis, animals with low levels of chimerism (<50%) were also not used in subsequent experiments. Cell count data from immunohistochemistry slides was converted into percentages of total, however, differences between groups was analysed using raw cell count data.
Primary analysis
Assumption of normality was checked using D'Agostino & Pearson omnibus normality test and all cell count data sets passed. Data were analysed using either Student's t‐test for comparison between two groups or one‐way ANOVA, with Tukey's post‐hoc correction for multiple comparisons. Time course groups were independent. For flow cytometry data, results were reported as the mean of the experiments per antibody panel. Statistical significance was defined as an alpha of 0.05. Statistical analysis was performed using the software package Prism 6 (version 6.0 g; Graphpad Software, USA).
Results
Low‐dose busulfan achieves high levels of peripheral haematopoietic chimerism without perturbation of the BBB
In order to determine if peripheral chimerism could be achieved in the absence of either brain chimerism or damage to the BBB, regimens of busulfan conditioning at 25, 50, 75 or 125 mg/kg were given to syngeneic sex‐matched mice prior to transplant. Busulfan conditioning was followed by tail vein injection of eGFP+ whole bone marrow cells (Figure 1 A). The efficiency of eGFP+ donor cell chimerism was assessed using flow cytometry 12 weeks post‐transplant. All busulfan‐conditioned recipients showed significant eGFP+ chimerism in blood, spleen and bone marrow compared to nontransplanted littermates (P < 0.001) (Figure 1 B and Figure S1A). Mice showed normal reconstitution of CD11b+ monocytes, CD3+ T‐cells and CD19+ B‐cells (Figure S1B). Over time, peripheral chimerism increased from 4 to 12 weeks with 25 mg/kg busulfan (Figure S1C) and normalized donor eGFP chimerism averaged 70% at 12 weeks (Figure S1D).
Figure 1.
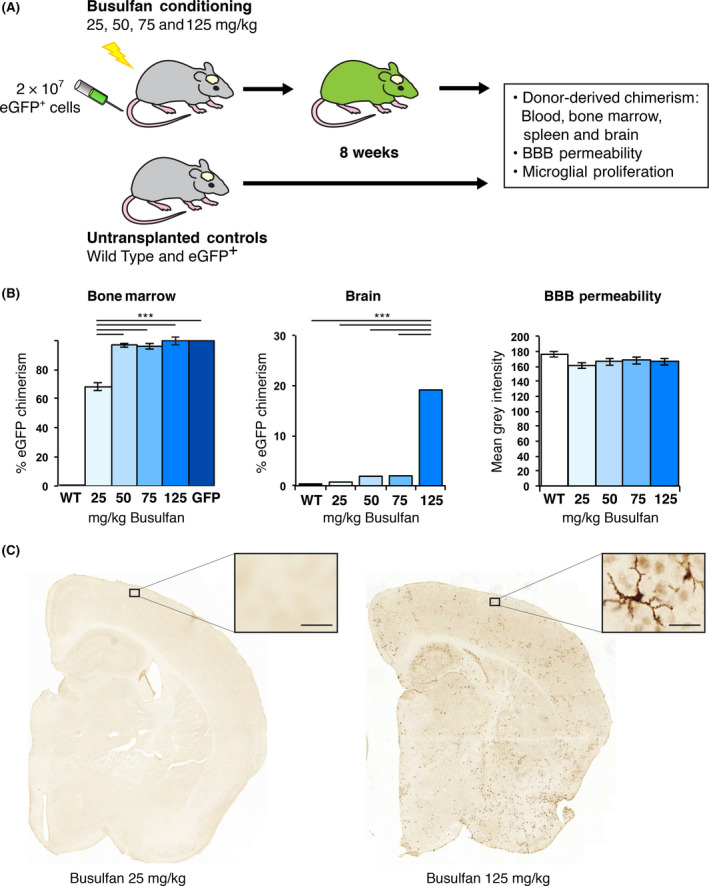
eGFP + donor chimerism was achieved in the bone marrow but not in the brain of 25 mg/kg busulfan‐conditioned transplant recipients. (A) 2 × 10⁷ eGFP + bone marrow (BM) cells were delivered via the tail vein of C57BL/6J (WT) mice that received either 25, 50, 75 or 125 mg/kg busulfan. Untransplanted C57BL/6J and OK‐GFP + mice were included as controls (n = 8 mice/group). (B) Bone marrow and brain chimerism, as well as blood‐brain barrier (BBB) permeability by IgG staining, were determined 8 weeks post‐transplant. No changes in BBB permeability were observed. (C) Brain chimerism was established by counting eGFP + cells from six coronal sections per mouse using HistoQuant software (Bregma; 0.98, 0.26, −0.46, −1.18, −1.94 and −2.62 mm; 1 to 6; see Figure S2). Brain section 4 is shown with the boxed area enlarged to highlight eGFP + donor‐derived cells. ***P < 0.001. Error bars represent the SEM. Bar = 25 μm.
Donor‐derived brain engraftment was determined by quantifying the number of eGFP+ cells (Figure S2) in tissue sections. No difference in eGFP+ cell infiltration was observed between mice receiving 25 mg/kg busulfan and nontransplanted controls (Figure 1 B, Figure S2). In contrast, a stepwise increase in eGFP+ cell infiltration was seen from 50 mg/kg upwards, with animals treated with 125 mg/kg dose having a 6‐fold increase over 75 mg/kg and a 45‐fold increase compared with the 25 mg/kg group (P < 0.001) (Figure S2B). A significantly larger brain area infiltrated by eGFP+ cells was found in 125 mg/kg busulfan‐conditioned recipients compared with lower doses. No significant differences were observed between the doses of 25 and 50 mg/kg.
The number of Iba1+ (resident and peripheral macrophages) and eGFP+ cells (donor macrophages) was quantified using automated software on 6 coronal sections per animal to determine the percentage of donor cells within the Iba1+ population (Figure S3).
In the 125 mg/kg group, 20% eGFP+ donor cells were observed compared to 2% in both the 50 and 75 mg/kg group, and 0.7% in the 25 mg/kg group (Figure 1 B). In the group treated with 25 mg/kg, the 0.7% eGFP+ donor population was restricted to peripherally derived perivascular and choroid plexus macrophages and therefore did not represent true engraftment. Animals treated with 25 mg/kg of busulfan showed only a few perivascular eGFP+ cells while mice treated with 125 mg/kg busulfan showed widespread and evenly distributed ramified eGFP+ cells (Figure 1 C).
Ki67 staining was quantified to determine any effect on proliferation of the conditioning regimen (Figure S3A). No microglial proliferation was observed with any of the busulfan doses. Overall, we observed no changes in Iba1+ cell numbers in the brain with 25 mg/kg busulfan by 8 weeks post‐transplant. The absence of perivascular deposits of IgG and fibrinogen in the brains of mice receiving any dose of busulfan conditioning and in controls at 8 weeks post‐transplant suggested the BBB was not affected (Figure 1 B & Figure S4 & S5).
Bone marrow derived cells migrate to tumours in nonmyeloablative transplant
Having established that nonmyeloablative transplant does not perturb microglia, we used this model to differentiate microglia from peripheral cell infiltration in a syngeneic model of glioma. GL‐261 mouse glioma cells were orthotopically implanted into immunocompetent animals and were sacrificed at the onset of neurological deficits at approximately 17 days. A DSred expressing GL‐261 cell line demonstrated significant eGFP+ peripheral donor cell infiltration. Infiltrating cells were mainly seen within the tumour bulk with some at the tumour/brain interface (Figure 2 A–F). Cells were quantified using image analysis software (Figure S6).
Figure 2.
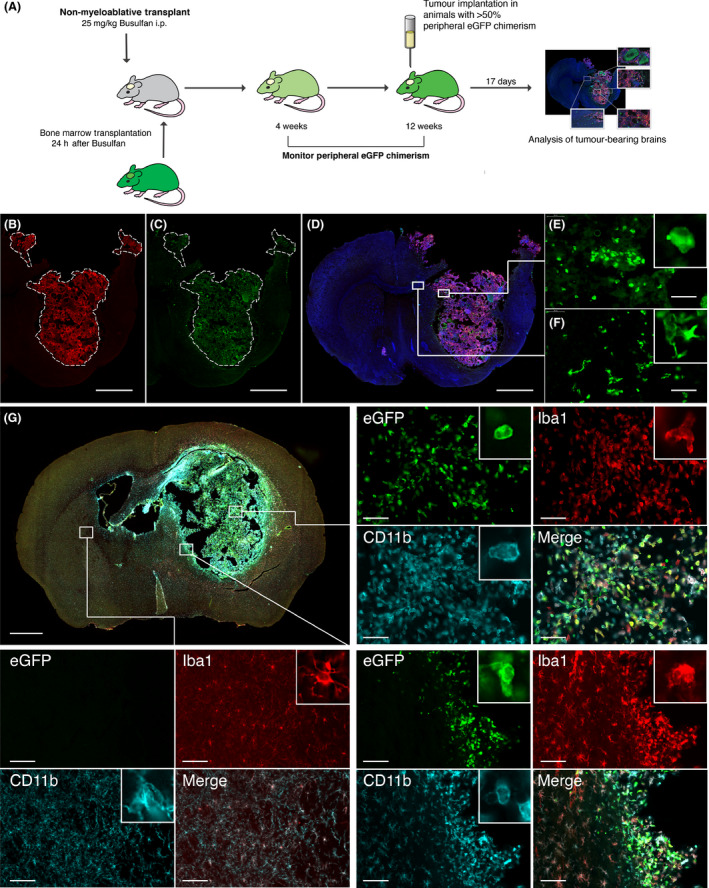
Immunofluorescent staining of syngeneic GL‐261 tumours in nonmyeloablative transplant mice. (A) Schematic diagram showing the experimental design using Nonmyeloablative transplantation with Busulfan at 25 mg/kg followed by implantation of GL‐261 tumour 12 weeks later, and brain harvest 17 days post implantation. (B) Anti‐DsRed staining in a chimerised animal implanted with GL‐261_DSX2 tumours. White dotted line delineates tumour border (scale bar = 1000 μm). (C) Anti‐eGFP staining to demonstrate BMDC within the brain of a chimerised animal; peripheral eGFP + cells are mainly confined to within the tumour mass. (D) 30 μm thickness coronal section of tumour bearing brain. Combined merged image of anti‐DsRed (tumour), anti‐eGFP (BMDC) and DAPI (nuclei). (E) X40 high powered field of intratumoural region demonstrating infiltrating eGFP + BMDC (scale bar = 100μm). (F) Intraparenchymal, peritumoural region showing lesser degree of eGFP + BMDC infiltration. (G) Merged picture of anti‐eGFP staining (Green ‐ BMDC), anti‐Iba1 staining (Red ‐ microglia/macrophage) and anti‐CD11b (Cyan ‐ myeloid cells) staining. Four quadrant high powered fields (X40) demonstrating staining pattern for each region of interest (white boxes). Upper Right Panel: Intratumoural region of interest. Bottom Right Panel ‐ Peritumoural region of interest. Bottom Left Panel – Nontumour brain parenchyma in contralateral hemisphere. Inset within each panel shows representative cell morphology.
Tumours generated by implanting GL‐261 cells had features resembling human glioblastoma. They were composed of sheets of densely packed, severely atypical cells with eosinophilic or fibrillary cytoplasm and irregular, hyperchromatic nucleus; several neoplastic multinucleated cells were also present (Figure 3 A,B); mitotic activity was brisk (Figure 3 C), endothelial and capillary proliferation (Figure 3 D) and microfoci of necrosis (Figure 3 E). Lesions were focally infiltrative but never showed extensive invasion of the hemisphere unilateral and contralateral to the tumour site (Figure 3 F).
Figure 3.
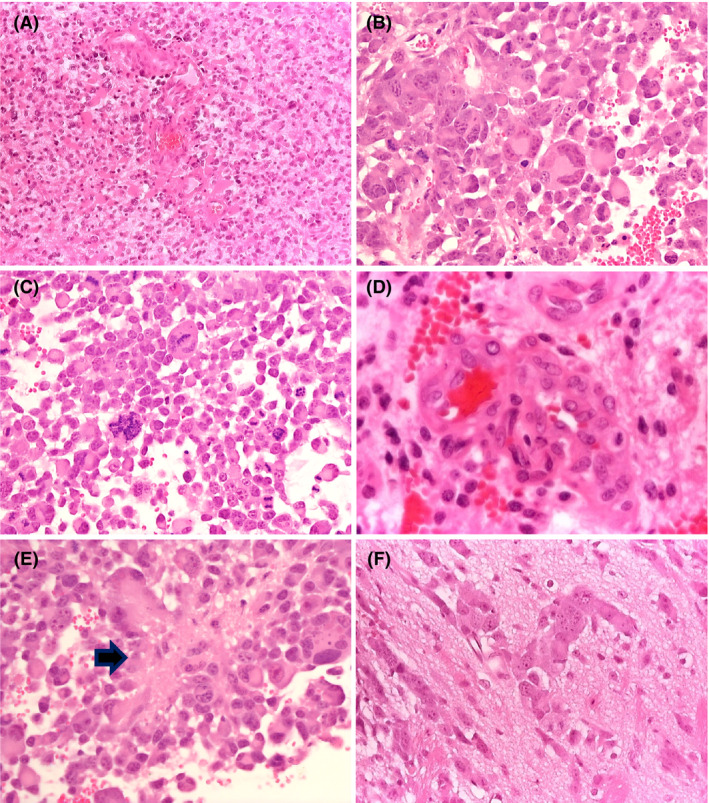
Histopathological features of GL‐261 tumours. The tumour is composed of densely packed, severely atypical cells with scanty or fibrillary cytoplasm; a few gemistocytes are seen (A ‐ Haematoxylin‐Eosin, X10); severely atypical cells with eosinophilic cytoplasm and one or multiple irregular, hyperchromatic nuclei are hallmark of this tumour (B – Haematoxylin‐Eosin, X40); the lesion shows brisk mitotic activity (C – Haematoxylin‐Eosin, X40) endothelial and capillary proliferation (D ‐ Haematoxylin‐Eosin, X40) and microfoci of necrosis (E – Haematoxylin‐Eosin, X40 ‐ arrow); the tumour/brain interface shows focal infiltration of the adjacent brain (F ‐ Haematoxylin‐Eosin, X40).
Brain sections were divided into: (i) tumour, (ii) tumour/brain interface and (iii) the rest of the brain (Figure 2 G). Considerable infiltration by peripheral Iba1+/eGFP+ macrophages, with many resident Iba1+/eGFP− microglia were present within the tumour (Figure 2 G right upper quadrant). In contrast, the donor macrophages were mainly confined to the tumour/brain interface. PBS injected controls did not exhibit any eGFP+ cell infiltration (data not shown). Iba1+/eGFP− microglia had a ramified morphology in the contralateral nontumour bearing hemisphere (Figure 2 G left lower quadrant) while features changed to amoeboid in the proximity to the tumour margins (Figure 2 G right lower quadrant). There was no difference in the morphology of peripherally derived eGFP+ and centrally derived eGFP− cells. Tmem119‐positive microglia was seen both within the tumour and at the tumour/brain interface (data not shown).
Peripheral macrophages form up to 50% of the Iba1 positive tumour GAMM population and their proportion does not change significantly over time
We wanted to determine the timing of BMDC migration. Time course experiments at 7, 14 and 17 days showed overall peripheral infiltration of 10–15% of Iba1−/eGFP+ BMDCs with 36–41% Iba1+/eGFP+ peripheral macrophages and 42–52% Iba1+/eGFP− microglia. The peripheral Iba1− cells represent other leucocyte populations (T‐cells and granulocytes, data not shown). A significantly higher microglial density than peripheral derived macrophages was seen in the brain on day 7 (322.4 vs. 215.4, P < 0.0001) (59% vs. 41%) and day 17 (271.1 vs. 181.2, P = 0.0029) (56% vs. 44%), but not on day 14 (221.5 vs. 215.8, P = 0.9034) (50% vs. 50%) suggesting that peripheral infiltration occurs early in tumour progression and is established by day 7. Microglia were the primary contributors to GAMMs although peripheral macrophages were in nearly equal numbers (Figure 4 A–E).
Figure 4.
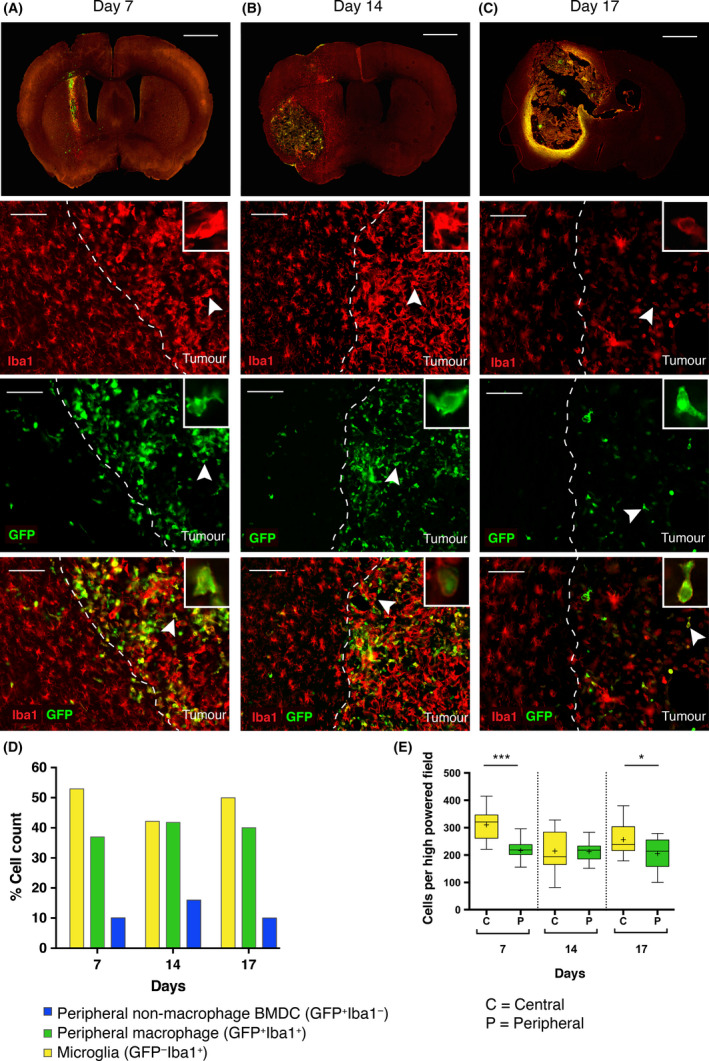
Time course experiment quantifying the number of eGFP + and Iba1+ cells present within the tumour mass over time. (A–C) Vertical panels represent cells at the tumour margin (dashed white line) on Day 7, 14 and 17, respectively. From top to bottom: First row = 30 μm thickness coronal section of tumour bearing brain (scale bar = 1000 μm). Second row = Iba1 staining with highlighted cell (inset) to demonstrate morphology (scale bar = 100 μm). Third row = eGFP staining demonstrating eGFP + BMDC located within the tumour margin. Fourth row = merged image of Iba1 and eGFP staining. A significant number of Iba1+/eGFP −(yellow) microglial cells within the tumour, Iba1+/eGFP + double positive (green) cells represent peripheral macrophages are almost found exclusively within tumour, and Iba1−/eGFP + (blue) cells represent non‐macrophage BMDC within the tumour. (D) Total cell counts: The majority of infiltrating cells are Iba1+/eGFP − (microglia). The next most frequently seen population are Iba1+/eGFP + (peripheral macrophage), followed by Iba1−/eGFP + (nonmacrophage BMDC) which is present at all time points, suggesting the presence of nonmacrophage derived haematopoietic cells within the tumour. BMDC infiltration (eGFP +) occurs early in disease and the overall proportions do not significantly vary over the time course. (E) Analysis of microglia vs. peripheral macrophage cell counts demonstrates a consistently higher microglial population, which is significantly greater than the peripheral macrophage population at Day 7 (*** = P < 0.0001) and at Day 17 (* = P < 0.05). There is no significant difference between microglial and peripheral macrophage cell counts at day 14.
CD45.1/CD45.2 distinguishes peripheral macrophages from microglia in the brain more effectively than eGFP on flow cytometry
To further confirm the results obtained with eGFP, we used the pan‐leucocyte congenic CD45.1 model (PEP‐3). CD45.1 can be distinguished from the CD45.2 (C57BL/6J) epitope with accuracy close to 100% by flow cytometry. In contrast with eGFP, however, these markers are more difficult to detect using immunochemistry. We transplanted CD45.2+/eGFP+ whole donor bone marrow into a CD45.1+ host and compared the percentage of eGFP chimerism with the percentage of CD45.2 chimerism post nonmyeloablative transplant. Samples were gated (Figure S7A) to select for live singlet CD45+ cells. eGFP+ expression was only detectable in 43% of CD45.2 donor cells in BM or 55% in the brain (Figure S7B) as expected, whilst eGFP+ cells were >99% CD45.2+. eGFP expression was higher in blood at approximately 70–75% of donor cells. CD45.2/CD45.1 therefore distinguished much more accurately between donor and recipient within the brain with little or no double staining overlap (Figure 5 A–D). Furthermore, we achieved an average of 88.4% donor peripheral blood chimerism and 92.4% BM donor chimerism (Figure 5 E).
Figure 5.
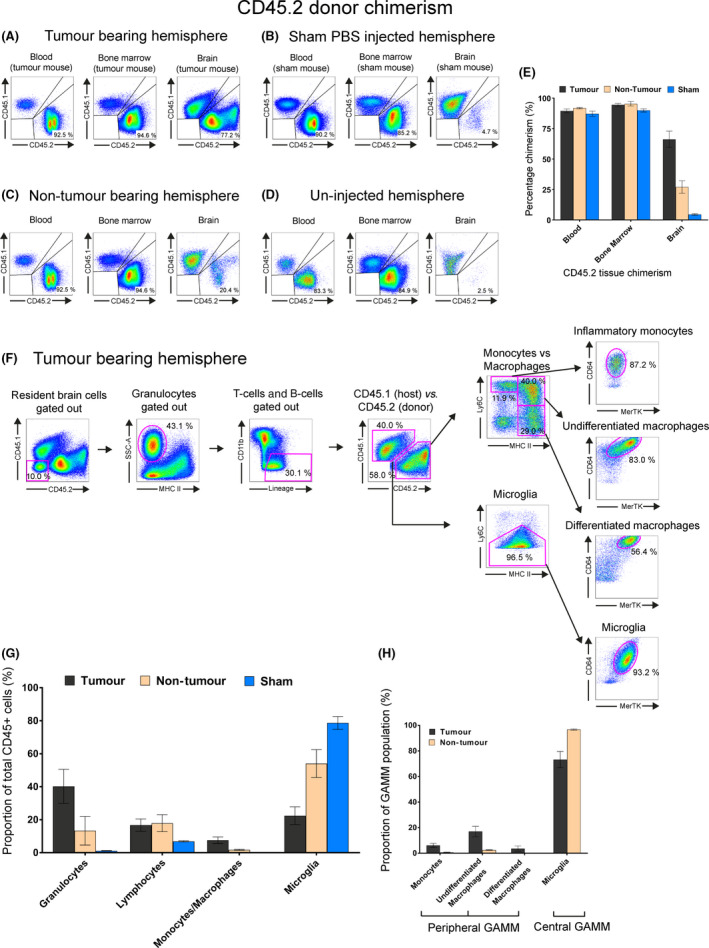
Characterising immune cell populations by flow cytometry in GL‐261‐implanted CD45.1/eGFP‐CD45.2 nonmyeloablative transplant mice. All flow plots used the initial gating strategy outlined in Figure S7A to show live singlet CD45+ cells. (A–D) Chimerism comparison in blood, bone marrow and brain of tumour bearing hemisphere, sham‐PBS injected hemisphere, contralateral nontumour bearing hemisphere of mice implanted with GL‐261 cells and uninjected brain of chimeric mouse. Quadrant plots were used to show the relative proportion/chimerism of CD45.2 (donor) vs. CD45.1 (host) cells. (E) Relative CD45.2 donor chimerism of blood, bone marrow and brain in a tumour bearing hemisphere (black), the contralateral nontumour bearing hemisphere in the same animal (beige) and sham‐injected hemisphere of a different animal (blue). (F) Gating strategy used to identify multiple tumour‐tropic immune cells within the tumour bearing hemisphere of a mouse. Host cells were distinguished from peripheral donor cells using CD45.1 and CD45.2 marker expression, respectively. Sequential gating strategies using SSC/MHCII and CD11b/lineage depletion was used to remove granulocytes, T‐cell and B‐cells to obtain a GAMM population. Downstream gating with Ly6C/MHCII/MerTK/CD64 was then used to characterise GAMM. (G) Relative proportions of each immune cell type. Immune cell types identified included: granulocytes, lymphocytes (T and B‐cells) and GAMMs. GAMMs were further subdivided into inflammatory monocytes, undifferentiated macrophages, differentiated macrophages and microglia. (H) Proportion of subpopulations found within GAMMs in tumour (black) and nontumour bearing (brown) hemispheres.
Using CD45.1 recipients with >80% peripheral CD45.2+/eGFP+ blood chimerism, we intracranially implanted GL‐261 cells and compared the resulting glioma to sham intracranial PBS injection or noninjection controls (Figure 5 A–D). The tumour bearing brain hemisphere contained on average 67% peripheral CD45+ cells while on average 4.7% peripheral cells were detected in the brain of the sham injected control group (Figure 5 E). The nontumour bearing hemisphere also showed average 20% infiltration (Figure 5 E), whilst un‐injected mice had 2.5% peripheral infiltration (Figure 5 D).
A four‐marker panel of Ly6C/MHCII/MerTK/CD64 allows accurate distinction between GAMM populations in chimerised and unchimerised mice
A four‐marker panel of Ly6C/MHCII/MerTK/CD64 was applied to determine the individual subpopulations of immune cells present in the tumour microenvironment by combining the lineage tracing ability of NMT and marker sets previously used to distinguish monocyte and macrophage populations within the gut and tissue macrophages (Figure 5 F) 34, 35.
Within the tumour bearing hemisphere, granulocytes (SSChi/MHCII−) accounted for 40.2% of all CD45+ cells; T and B cells (CD11b−/CD3+/CD19+) 16.7%, and the GAMM population made up 29.9% of total CD45+ cells (Figure 5 G). The CD45+ population could be subdivided into peripheral/donor (CD45.2+) and central/host (CD45.1+) (Figure 5 G). Peripheral donor inflammatory monocytes (MHCII−/Ly6C+) accounted for 1.7% of CD45+ cells, peripheral undifferentiated macrophages (MHCII+/Ly6C+) 4.9% and peripheral differentiated macrophages (MHCII+/Ly6C−) 0.9%; CD45.1+ host microglia accounted for 22.4% and were identified as Ly6Clow/−, using the MHCII/Ly6C waterfall gate previously described in addition to MerTK/CD64 (Figure 5 G) 35.
As a proportion of GAMMs, defined as CD11b+CD45+ cells minus granulocytes, T cells and B‐cells; inflammatory monocytes accounted for 6.1%, undifferentiated macrophages 17.0%, differentiated macrophages 3.6% and microglia 73.2%, making the total peripheral contribution in the tumour bearing hemisphere 26.7% (Figure 5 H).
Sham injections led to 4.7% infiltration of donor CD45.2+ cells into the brain, but they were predominantly T and B cells (86.3%) with the remaining portion consisting of granulocytes. Any peripheral infiltration seen were almost exclusively monocytes (0.03%) (Figure S7C).
In tumour bearing animals, we also investigated the immune cell fractions in the contralateral nontumour bearing hemisphere. As a proportion of CD45+ cells granulocytes accounted for 13.3%, T and B cells 17.9% and undifferentiated macrophages 1.4% (Figure S7D). As a proportion of GAMMs, cells were almost exclusively microglia (96.7%). Results of previous experiments are represented in Figures 5 H.
The waterfall gating of MHCII/Ly6C separated peripheral monocytes (MHCII−/Ly6Chi) and peripheral undifferentiated macrophages (MHCII+/Ly6Chi), however differentiated macrophages and microglia (Ly6Clow/−) required further separation. By using the macrophage marker CD64 these two populations were well separated with differentiated macrophages expressing CD64hi and microglia expressing CD64low. Further confirmation of macrophage and tissue macrophage status within GAMMs was done using MerTK, which showed that all macrophages and microglia expressed the tyrosine kinase MerTK, whereas monocytes did not (Figure 5 F). The peripheral/central origin of each subpopulation identified using this gating strategy was checked by back‐gating onto CD45.1/CD45.2 which demonstrated >91% purity for each population (Figure 6 A).
Figure 6.
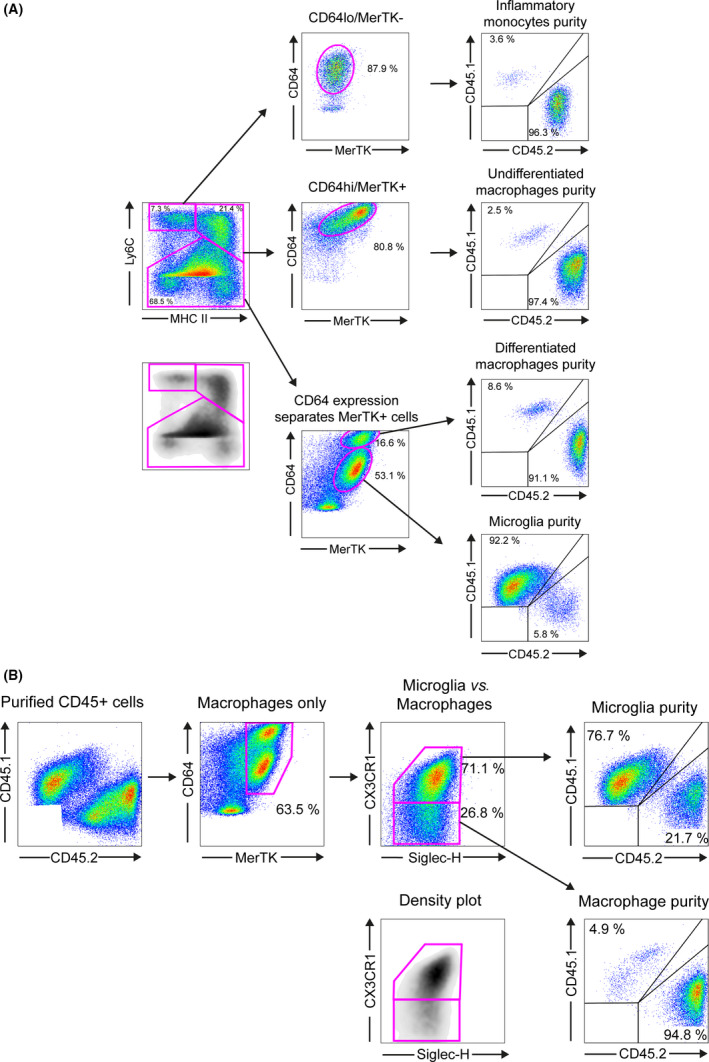
GAMM subpopulation analysis in GL‐261 implanted nonmyeloablative conditioned mice. (A) Subpopulation purity analysis using Ly6C/MHCII/MerTK/CD64 gating strategy; isolated cells were first separated using Ly6C/MHCII/MerTK/CD64 into 4 GAMM subpopulations and the donor/host purity of each subpopulation was determined using CD45.2 (donor)/CD45.1 (host) expression level. (B) A similar analysis was performed using microglia surface markers Siglec‐H and CX3CR1. CD45+ cells were separated using MerTK/CD64/Siglec‐H/CX3CR1. Donor/host purity was then determined using CD45.2 (donor)/CD45.1 (host) expression. This gating strategy showed that only 76.7% of cells in the microglial population were confirmed CD45.1+ host cells.
Siglec‐H and CX3CR1 have both been purported to be microglia‐specific markers 36, 37. In a separate marker panel, we also found that MerTK+/CD64+/Siglec‐H+/CX3CR1 consistently resulted in pure macrophage populations with approximately 5% microglial contamination, but the (MerTK+/CD64+/Siglec‐H+/CX3CR1+) microglial population was 10–20% cross‐contaminated with monocytes and macrophages (Figure 6 B) suggesting a lack of specificity of both Siglec‐H and CX3CR1 for microglia in an inflammatory environment.
Concerns have also been raised regarding the validity of CD45 in differentiating microglia from macrophages in glioma 5, 7, 16, 17. To address this, we compared CD11b/CD45 expression against our four‐marker set (Figure 7 A). Selection of CD11b+/CD45+ cells effectively removed T and B cell populations but resulted in overlapping populations of SSChi/MHCII− granulocytes and all four GAMM subpopulations (Figure 7 B). Although CD11b/CD45 appears to separate differentiated macrophages from microglia; monocytes and undifferentiated macrophages overlay both peripheral and central CD11b/CD45 populations, making the CD11b/CD45 marker set limited in glioma (Figure 7 B).
Figure 7.
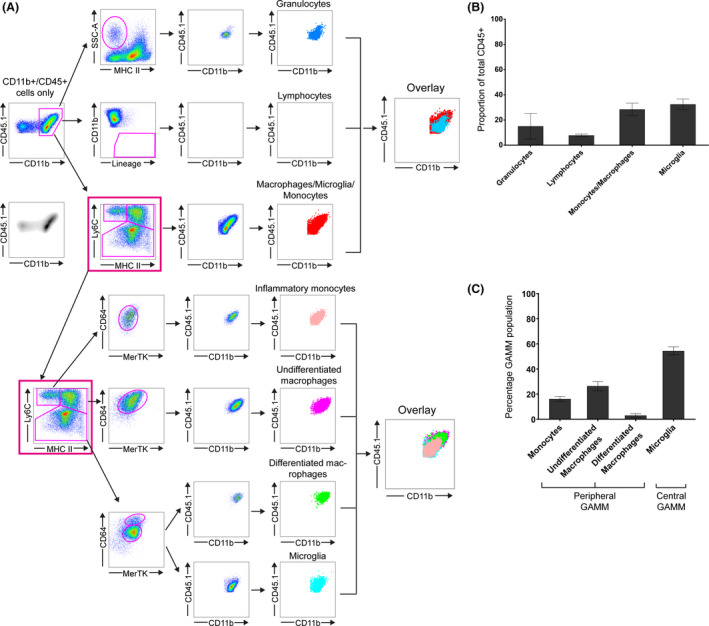
Unchimerised mice implanted with GL‐261. (A) CD11b+/CD45+ cells were selected and gated against cell surface markers ordinarily used to characterise different immune populations: granulocytes, T and B‐cells and GAMM. An overlay of all four immune populations using CD11b/CD45 expression is shown (left overlay box). GAMM population was then selected (pink box) and each GAMM subpopulation back‐gated using CD11b/CD45. A second overlay demonstrates overlap of inflammatory monocytes, undifferentiated macrophages, differentiated macrophages and microglia, thereby showing that CD45 expression does not adequately separate microglia from other GAMM populations. (B) Relative proportions of each immune cell type. GAMM is the sum of inflammatory monocytes, undifferentiated macrophages, differentiated macrophages and microglia. (C) Relative proportions of each GAMM subpopulation.
Finally, we validated the panel of Ly6C/MHCII/MerTK/CD64 to differentiate GAMMs in unchimerised mice. In the tumour bearing hemisphere, granulocytes accounted for 15.1%, T‐cell and B‐cells 7.9%, and GAMMs 60.8%. Relative peripheral GAMM contribution was 45.7% while central GAMM was 61% (Figure 7 C). Marrow‐derived GAMMs consisted of monocytes 16.2%, undifferentiated macrophages 26.4% and differentiated macrophages 3% (Figure 7 D).
Discussion
We used a nonmyeloablative transplant (NMT) in mice with low‐dose busulfan to develop a novel brain tumour chimeric model and investigate the contributions of BMDCs to the glioma microenvironment. We obtained high levels of chimerism without damaging the BBB or impacting on animal health and life‐expectancy. We also demonstrated that recruitment occurs early in the disease and that the overall proportion of central vs. peripherally derived cells remains stable over time.
Haematopoietic stem cells are highly sensitive to busulfan 38, 39. Treatment with this drug at low doses induces cellular senescence and replacement with donor bone marrow without affecting the integrity of the BBB 38, 40, 41, 42. Low‐dose busulfan as a nonmyeloablative model has not been previously applied to the study of Central Nervous System (CNS) tumours and was critical to our model 43. This technique resulted in >80% peripheral chimerism by 12 weeks without accompanying brain engraftment. Higher doses cause damage to resident immune cells 38, 44, 45 and are known to mediate peripheral immune cell migration into the CNS resulting in long‐term promigratory signals in the brain 21. The absence of noticeable morphological changes in microglia or increase in their number compared to controls suggested the dose of 25 mg/kg did not affect brain resident inflammatory cells. In addition, NMT preserves the BBB as proven by the lack of IgG and fibrinogen perivascular deposits in treated animals, prior to the implantation of GL‐261. Our model requires a single intraperitoneal injection prior to donor BMT and the procedure is well tolerated by recipient animals. Over 8–12 weeks, engrafted donor BM cells became the dominant population. Such long lead times represents a limitation of our model, but it also gives the advantage of allowing post‐transplant inflammatory responses to resolve 21, 44. In addition to achieving high levels of peripheral haematopoietic chimerism, our myeloablative model showed low toxicity and allowed for the preservation of BM homeostasis. Animals have normal life expectancy and are not immunocompromised.
Our NMT model has several advantages over other models. CD45.1 and CD45.2 are both pan‐leucocyte antigens commonly used in the context of adoptive transfer experiments 46. This approach has the advantage of permitting a more efficient identification of donor vs. host populations in flow cytometry compared to eGFP. Adoptive transfer using whole body irradiation with or without head shielding followed by BMT is a cornerstone technique for the study of blood‐borne macrophages vs. microglia 47, 48, 49, 50, 51, 52. Nevertheless this technique has significant drawbacks such as decreased chimerism when the head is shielded and the use of lethal doses of irradiation, which provokes a long‐term, radiation‐induced systemic increase in proinflammatory cytokines such as Tumour Necrosis Factor‐α, Platelet Derived Growth Factor, chemokines CCL2 and CCR8 21, and Interleukin‐1 53. Parabiosis proposed by Ajami et al. attempted to overcome these limitations by surgically anastomosing circulations of donor and recipient animals 54. However, chimerism with this technique can be as low as 50% leading to underestimation of BMDCs. Knock‐in, lineage tracing models exploiting microglial expression of the fractalkine receptor CX3CR1‐GFP and CX3CR1‐CreERT have increased the accuracy in distinguishing microglia from peripherally derived cells but overlap still exists due to CX3CR1 cross‐expression in circulating monocytes and peripheral and tissue macrophages 22. Recently, Bowman et al. used a genetically engineered mouse with Flt3:Cre;Rosa26:mTmG crossed with a Nestin TVA glioma to interrogate the transcriptional profile of microglia vs. BMDC 23. Similar to other transgenic animals, the technique allowed for efficient labelling of microglia and BMDCs from the earliest stages of differentiation but unlike NMT the technique does not permit one to ‘swap out’ bone marrow compartments in mature animals without cross‐breeding (Table 1).
Table 1.
Summary of different techniques used to distinguish microglia from BMDC in the CNS
| Method | Description | Advantages | Disadvantages |
|---|---|---|---|
| IR bone marrow transplantation 44, 48 | Whole body irradiation followed by labelled bone marrow rescue | High levels of chimerism, rapid chimerism | Lethal dose radiation. Fulminant systemic inflammatory response, BBB damage |
| Head‐shielded bone marrow transplantation 16, 17, 47 | As above with lead shielding of cranium. | Similar to above with protection from BBB damage | Higher doses of irradiation required. Significant systemic inflammatory response |
| Parabiosis 54 | Surgical anastomosis of labelled donor and recipient blood circulations | Minimal systemic inflammatory response. No perturbation of BBB | Lower levels of chimerism (~50%). Technically challenging |
| NMT | Single injection of busulfan followed by bone marrow transplantation | Technically simple. High levels of chimerism, minimal systemic inflammatory response and perturbation of BBB | Longer time to chimerism (12 weeks) |
| Genetic lineage tracing studies 23, 59 | Transgenic mice expressing labelled cell populations or genetically engineered conditional labelling of specific myeloid lineages | Highly accurate lineage dependent labelling of different cell types and myeloid subpopulations | Costly and technically challenging. Nonconditionally labelled single gene marker systems (e.g. CX3CR1 labelled transgenic mice) are less reliable at distinguishing microglia from macrophages in inflammatory environments |
Our model was developed using the mouse glioma cell line GL‐261. This 3‐methylcholantrene‐induced cell line is widely used as preclinical model of GBM as it is highly reproducible and it closely replicates the human counterpart. Lenting et al., suggest orthotopic implantation in syngeneic, immunocompetent animals can also be regarded as an advantage to investigate glioma microenvironment and its complex tumour–stromal interactions 43, 55, 56, 57. The GL‐261 model has recognized limitations, which include focal infiltration of the surrounding brain and high expression of MHCI, unlike human GBM. Finally, similar to all models that require cell implantation it has the limitation of orthotopic surgery 56, 57. Previous studies with GL‐261‐derived glioma demonstrated heterogeneous composition of GAMMs using live‐two photon imaging and FACS analysis 58, 59, 60. Pathological examination of the implanted tumours in our experiments revealed features similar to human GBM. Unlike other studies 56, 57, we only observed limited infiltration into the surrounding brain, however, it is worth noting that nontumour bearing hemispheres were significantly inflamed and myeloid migration in this hemisphere was influenced by the tumour. As such, contralateral hemispheres should not be used as controls and instead sham injected mice are more appropriate.
We confirmed that the CD11b+/CD45 low/high approach showed considerable overlap between microglia and blood‐borne macrophages. Badie and Schartner were the first to use flow cytometry to analyse central vs. peripheral contributions to GAMMs in a rat glioma model based on CD11b+/CD45low and CD11b+/CD45high expression and found that microglia accounted for 13‐34% of the immune infiltrate, and peripheral macrophages 4.6–12% 61. However, the reliability of CD45 has been questioned as its expression may change under environmental influence, particularly neuroinflammation 5, 7, 62. Moreover, stratification by CD45 expression alone potentially masks myeloid subpopulations within the tumour. To distinguish between resident and peripherally derived GAMMs we therefore applied a four‐marker gating strategy for flow cytometry based on previous studies 34, 36. We observed microglia to be the predominant population within GAMMs with a contribution of peripheral cells of approximately 45%. MerTK/CD64 is a transcriptionally derived marker set used to define macrophages in the peritoneum, spleen, lung and brain 36, whereas Ly6C/MHCII is a commonly used marker set to delineate monocytes 35. Our, Ly6C/MHCII/MerTK/CD64 gating strategy was chosen to consolidate these two‐marker approaches into one set of markers. In inflammatory conditions, blood monocytes (Ly6C+/MHCII−) upregulate MHCII but retain monocytic features to resemble undifferentiated macrophages 63. In contrast, Ly6C is downregulated upon monocyte maturation to a macrophage 63. By overlaying the highly expressed macrophage markers MerTK/CD64 macrophages were identified and further subcategorized into resident and peripheral based on the CD64 expression 36, 64. The recent discovery of Tmem119 as a specific marker of microglia has simplified their separation in both human and mouse brains using immunohistochemistry, flow cytometry and cell sorting. Tmem119 is a transmembrane cell‐surface developmentally regulated protein of unknown function that is highly expressed on microglial cells but not by macrophages or other immune cells 65. Our preliminary results on eGFP/Iba1 tissue sections are in keeping with these findings and appear to confirm the reliability of Tmem119 in differentiating microglia from BMDC.
Recent years have witnessed a shift in focus in glioma research from investigating the genetic and molecular makeup of tumour cells to unravelling the complexity of glioma microenvironment and its contribution to progression and resistance to treatment 7, 66. Interactions between resident and peripherally derived inflammatory cells, the contribution of resident cells and BMDCs in each tumour, the phenotype and functions they acquire and their interplay with tumour cells and glioma stem cells remain to be fully investigated. Several lines of evidence support the relevance of studying the glioma microenvironment. For instance, selective ablation of CD11b+ myeloid cells using a conditional ganciclovir activated CD11b‐Herpes Simplex Virus‐Thymidine Kinase transgenic model in GL261 tumour bearing animals showed a survival benefit 15 and a recent study by Sorensen and colleagues 67 demonstrated a survival disadvantage in human glioblastomas expressing high levels of the M2 phenotype maker CD163, CD204 and CD206. Gabrusiewicz and colleagues 20 have shown an increase in circulating BMDCs compared to healthy subjects which has further fuelled interest in the contribution of these cells to glioma progression and reinforced the concept that mobilization and recruitment of BMDCs is a key event in patients with glioblastoma.
In conclusion, we propose a novel model to investigate the glioma microenvironment and the contribution of resident and BMDCs. Although we share the concern that data from murine models should be interpreted with caution when applied to human glioblastoma 20, 43, 60, the development of new models in healthy, immunocompetent animals with preserved BBB, normal brain environment, with the absence of systemic inflammation nonetheless represent a powerful tool in furthering our understanding of tumour‐host interactions.
Author Contributions
KY conceived, designed and carried out the experiments and analysis and wrote the paper. ASY designed and carried out experiments and analysis and identified the marker set and contributed to the manuscript. KY and ASY should be considered to have made equal contributions to this work. FW designed and performed the preliminary experiments and contributed to the manuscript. CL, LL, AL, CW and HS helped carry out experiments and performed analyses. DM performed validation immunohistochemical experiments. PC assisted on flow cytometric technique and analyses. OP and IK advised on experimental design and data analysis and manuscript editing. AM assisted with experimental design and reviewed the manuscript. FR reviewed the histology, edited, wrote and contributed to the manuscript and BB approved, designed and analysed experiments and wrote and reviewed the manuscript.
Supporting information
Figure S1. Donor chimerism was achieved in the blood and spleen of busulfan‐conditioned transplant recipients.
Figure S2. No significant levels of eGFP+ donor‐derived microglia were detected in the brains of 25mg/kg busulfan‐conditioned transplant recipients.
Figure S3. Quantification of total Iba‐1+ microglia demonstrated that busulfan did not induce a significant proliferative response.
Figure S4. No significant changes in brain integrity were observed in busulfanconditioned mouse brains.
Figure S5. Tumour shows extravascular fibrin deposits and some uptake in tumour cells
Figure S6. The graph represents the density of eGFP+ cells in the brain away from the tumour, within the tumour mass and in sham controls
Figure S7. Flow cytometry gating analysis used to determine live CD45+ cells, chimerism and immune cell populations.
Table S1. Flow cytometry antibody panel and native eGFP antigen used to characterise monocytes, peripheral bone‐marrow derived macrophages and microglia in brain, blood and bone marrow.
Acknowledgements
We thank Professor Andrew King and the Endowment Fund of the Department of Neurosurgery at Salford Royal Hospital, and the kind joint donation by Mr. Ian Huen and Fredric Chung towards this research project. We also thank the Bioimaging facility, Flow cytometry facility at the Manchester Collaborative Centre for Inflammation Research, Biological Services Facility (BSF) and the Biomedical Research Facility at the University of Manchester for their expertise and assistance. Dr Roncaroli's work has received funding from the European Union's Seventh Framework Programme (FP7/2007‐2013) under grant agreement n_ HEALTH‐F2‐2011‐278850 (INMiND). Omar Pathmanaban received funding from the Brain Tumour Charity.
Yu K., Youshani A. S., Wilkinson F. L., O'Leary C., Cook P., Laaniste L., Liao A., Mosses D., Waugh C., Shorrock H., Pathmanaban O., Macdonald A., Kamaly‐Asl I., Roncaroli F., and Bigger B. W. (2019) Neuropathology and Applied Neurobiology 45, 119–140 A nonmyeloablative chimeric mouse model accurately defines microglia and macrophage contribution in glioma
References
- 1. Stupp R, Hegi ME, Mason WP, van den Bent MJ, Taphoorn MJ, Janzer RC, Ludwin SK, Allgeier A, Fisher B, Belanger K, Hau P, Brandes AA, Gijtenbeek J, Marosi C, Vecht CJ, Mokhtari K, Wesseling P, Villa S, Eisenhauer E, Gorlia T, Weller M, Lacombe D, Cairncross JG, Mirimanoff RO. Effects of radiotherapy with concomitant and adjuvant temozolomide versus radiotherapy alone on survival in glioblastoma in a randomised phase III study: 5‐year analysis of the EORTC‐NCIC trial. Lancet Oncol 2009; 10: 459–66 [DOI] [PubMed] [Google Scholar]
- 2. Hegi ME, Diserens AC, Gorlia T, Hamou MF, de Tribolet N, Weller M, Kros JM, Hainfellner JA, Mason W, Mariani L, Bromberg JE, Hau P, Mirimanoff RO, Cairncross JG, Janzer RC, Stupp R. MGMT gene silencing and benefit from temozolomide in glioblastoma. N Engl J Med 2005; 352: 997–1003 [DOI] [PubMed] [Google Scholar]
- 3. Nam JY, de Groot JF. Treatment of glioblastoma. J Oncol Pract 2017; 13: 629–38 [DOI] [PubMed] [Google Scholar]
- 4. Poon CC, Sarkar S, Yong VW, Kelly JJ. Glioblastoma‐associated microglia and macrophages: targets for therapies to improve prognosis. Brain 2017; 140: 1548–60 [DOI] [PubMed] [Google Scholar]
- 5. Glass R, Synowitz M. CNS macrophages and peripheral myeloid cells in brain tumours. Acta Neuropathol 2014; 128: 347–62 [DOI] [PubMed] [Google Scholar]
- 6. Bowman RL, Joyce JA. Therapeutic targeting of tumor‐associated macrophages and microglia in glioblastoma. Immunotherapy 2014; 6: 663–6 [DOI] [PubMed] [Google Scholar]
- 7. Hambardzumyan D, Gutmann DH, Kettenmann H. The role of microglia and macrophages in glioma maintenance and progression. Nat Neurosci 2016; 19: 20–7 [DOI] [PMC free article] [PubMed] [Google Scholar]
- 8. Li W, Graeber MB. The molecular profile of microglia under the influence of glioma. Neuro Oncol 2012; 14: 958–78 [DOI] [PMC free article] [PubMed] [Google Scholar]
- 9. Wei J, Gabrusiewicz K, Heimberger A. The controversial role of microglia in malignant gliomas. Clin Dev Immunol 2013; 2013: 285246 [DOI] [PMC free article] [PubMed] [Google Scholar]
- 10. Komohara Y, Horlad H, Ohnishi K, Fujiwara Y, Bai B, Nakagawa T, Suzu S, Nakamura H, Kuratsu J, Takeya M. Importance of direct macrophage‐tumor cell interaction on progression of human glioma. Cancer Sci 2012; 103: 2165–72 [DOI] [PMC free article] [PubMed] [Google Scholar]
- 11. Wesolowska A, Kwiatkowska A, Slomnicki L, Dembinski M, Master A, Sliwa M, Franciszkiewicz K, Chouaib S, Kaminska B. Microglia‐derived TGF‐beta as an important regulator of glioblastoma invasion–an inhibition of TGF‐beta‐dependent effects by shRNA against human TGF‐beta type II receptor. Oncogene 2008; 27: 918–30 [DOI] [PubMed] [Google Scholar]
- 12. Sliwa M, Markovic D, Gabrusiewicz K, Synowitz M, Glass R, Zawadzka M, Wesolowska A, Kettenmann H, Kaminska B. The invasion promoting effect of microglia on glioblastoma cells is inhibited by cyclosporin A. Brain 2007; 130: 476–89 [DOI] [PubMed] [Google Scholar]
- 13. Pyonteck SM, Akkari L, Schuhmacher AJ, Bowman RL, Sevenich L, Quail DF, Olson OC, Quick ML, Huse JT, Teijeiro V, Setty M, Leslie CS, Oei Y, Pedraza A, Zhang J, Brennan CW, Sutton JC, Holland EC, Daniel D, Joyce JA. CSF‐1R inhibition alters macrophage polarization and blocks glioma progression. Nat Med 2013; 19: 1264–72 [DOI] [PMC free article] [PubMed] [Google Scholar]
- 14. Wu A, Wei J, Kong LY, Wang Y, Priebe W, Qiao W, Sawaya R, Heimberger AB. Glioma cancer stem cells induce immunosuppressive macrophages/microglia. Neuro Oncol 2010; 12: 1113–25 [DOI] [PMC free article] [PubMed] [Google Scholar]
- 15. Zhai H, Heppner FL, Tsirka SE. Microglia/macrophages promote glioma progression. Glia 2011; 59: 472–85 [DOI] [PMC free article] [PubMed] [Google Scholar]
- 16. Muller A, Brandenburg S, Turkowski K, Muller S, Vajkoczy P. Resident microglia, and not peripheral macrophages, are the main source of brain tumor mononuclear cells. Int J Cancer 2015; 137: 278–88 [DOI] [PubMed] [Google Scholar]
- 17. Brandenburg S, Muller A, Turkowski K, Radev YT, Rot S, Schmidt C, Bungert AD, Acker G, Schorr A, Hippe A, Miller K, Heppner FL, Homey B, Vajkoczy P. Resident microglia rather than peripheral macrophages promote vascularization in brain tumors and are source of alternative pro‐angiogenic factors. Acta Neuropathol 2016; 131: 365–78 [DOI] [PubMed] [Google Scholar]
- 18. Parney IF, Waldron JS, Parsa AT. Flow cytometry and in vitro analysis of human glioma‐associated macrophages. Laboratory investigation. J Neurosurg 2009; 110: 572–82 [DOI] [PMC free article] [PubMed] [Google Scholar]
- 19. Tran Thang NN, Derouazi M, Philippin G, Arcidiaco S, Di Berardino‐Besson W, Masson F, Hoepner S, Riccadonna C, Burkhardt K, Guha A, Dietrich PY, Walker PR. Immune infiltration of spontaneous mouse astrocytomas is dominated by immunosuppressive cells from early stages of tumor development. Cancer Res 2010; 70: 4829–39 [DOI] [PubMed] [Google Scholar]
- 20. Gabrusiewicz K, Rodriguez B, Wei J, Hashimoto Y, Healy LM, Maiti SN, Thomas G, Zhou S, Wang Q, Elakkad A, Liebelt BD, Yaghi NK, Ezhilarasan R, Huang N, Weinberg JS, Prabhu SS, Rao G, Sawaya R, Langford LA, Bruner JM, Fuller GN, Bar‐Or A, Li W, Colen RR, Curran MA, Bhat KP, Antel JP, Cooper LJ, Sulman EP, Heimberger AB. Glioblastoma‐infiltrated innate immune cells resemble M0 macrophage phenotype. JCI Insight 2016; 1: pii: e85841 [DOI] [PMC free article] [PubMed] [Google Scholar]
- 21. Wilkinson FL, Sergijenko A, Langford‐Smith KJ, Malinowska M, Wynn RF, Bigger BW. Busulfan conditioning enhances engraftment of hematopoietic donor‐derived cells in the brain compared with irradiation. Mol Ther 2013; 21: 868–76 [DOI] [PMC free article] [PubMed] [Google Scholar]
- 22. Chen Z, Feng X, Herting CJ, Garcia VA, Nie K, Pong WW, Rasmussen R, Dwivedi B, Seby S, Wolf SA, Gutmann DH, Hambardzumyan D. Cellular and Molecular Identity of Tumor‐Associated Macrophages in Glioblastoma. Cancer Res 2017; 77: 2266–78 [DOI] [PMC free article] [PubMed] [Google Scholar]
- 23. Bowman RL, Klemm F, Akkari L, Pyonteck SM, Sevenich L, Quail DF, Dhara S, Simpson K, Gardner EE, Iacobuzio‐Donahue CA, Brennan CW, Tabar V, Gutin PH, Joyce JA. Macrophage Ontogeny Underlies Differences in Tumor‐Specific Education in Brain Malignancies. Cell Rep 2016; 17: 2445–59 [DOI] [PMC free article] [PubMed] [Google Scholar]
- 24. Wynn RF, Boelens JJ. Bone‐marrow transplantation in non‐malignant disease. Lancet 2009; 374: 856–8 [DOI] [PubMed] [Google Scholar]
- 25. Langford‐Smith A, Wilkinson FL, Langford‐Smith KJ, Holley RJ, Sergijenko A, Howe SJ, Bennett WR, Jones SA, Wraith J, Merry CL, Wynn RF, Bigger BW. Hematopoietic stem cell and gene therapy corrects primary neuropathology and behavior in mucopolysaccharidosis IIIA mice. Mol Ther 2012; 20: 1610–21 [DOI] [PMC free article] [PubMed] [Google Scholar]
- 26. Hartley JL, Temple GF, Brasch MA. DNA cloning using in vitro site‐specific recombination. Genome Res 2000; 10: 1788–95 [DOI] [PMC free article] [PubMed] [Google Scholar]
- 27. Sergijenko A, Langford‐Smith A, Liao AY, Pickford CE, McDermott J, Nowinski G, Langford‐Smith KJ, Merry CL, Jones SA, Wraith JE, Wynn RF, Wilkinson FL, Bigger BW. Myeloid/Microglial driven autologous hematopoietic stem cell gene therapy corrects a neuronopathic lysosomal disease. Mol Ther 2013; 21: 1938–49 [DOI] [PMC free article] [PubMed] [Google Scholar]
- 28. Paxinos G, Franklin KBJ. The mouse brain in stereotaxic coordinates. Compact 2nd ed. Amsterdam; Boston: Elsevier Academic Press, 2004. [Google Scholar]
- 29. Denes A, Wilkinson F, Bigger B, Chu M, Rothwell NJ, Allan SM. Central and haematopoietic interleukin‐1 both contribute to ischaemic brain injury in mice. Dis Model Mech 2013; 6: 1043–8 [DOI] [PMC free article] [PubMed] [Google Scholar]
- 30. Denes A, Humphreys N, Lane TE, Grencis R, Rothwell N. Chronic systemic infection exacerbates ischemic brain damage via a CCL5 (regulated on activation, normal T‐cell expressed and secreted)‐mediated proinflammatory response in mice. J Neurosci 2010; 30: 10086–95 [DOI] [PMC free article] [PubMed] [Google Scholar]
- 31. Schindelin J, Arganda‐Carreras I, Frise E, Kaynig V, Longair M, Pietzsch T, Preibisch S, Rueden C, Saalfeld S, Schmid B, Tinevez JY, White DJ, Hartenstein V, Eliceiri K, Tomancak P, Cardona A. Fiji: an open‐source platform for biological‐image analysis. Nat Methods 2012; 9: 676–82 [DOI] [PMC free article] [PubMed] [Google Scholar]
- 32. Kamentsky L, Jones TR, Fraser A, Bray MA, Logan DJ, Madden KL, Ljosa V, Rueden C, Eliceiri KW, Carpenter AE. Improved structure, function and compatibility for Cell Profiler: modular high‐throughput image analysis software. Bioinformatics 2011; 27: 1179–80 [DOI] [PMC free article] [PubMed] [Google Scholar]
- 33. Robinson AP, Rodgers JM, Goings GE, Miller SD. Characterization of oligodendroglial populations in mouse demyelinating disease using flow cytometry: clues for MS pathogenesis. PLoS ONE 2014; 9: e107649 [DOI] [PMC free article] [PubMed] [Google Scholar]
- 34. Bain CC, Bravo‐Blas A, Scott CL, Gomez Perdiguero E, Geissmann F, Henri S, Malissen B, Osborne LC, Artis D, Mowat AM. Constant replenishment from circulating monocytes maintains the macrophage pool in the intestine of adult mice. Nat Immunol 2014; 15: 929–37 [DOI] [PMC free article] [PubMed] [Google Scholar]
- 35. Bain CC, Mowat AM. The monocyte‐macrophage axis in the intestine. Cell Immunol 2014; 291: 41–8 [DOI] [PMC free article] [PubMed] [Google Scholar]
- 36. Gautier EL, Shay T, Miller J, Greter M, Jakubzick C, Ivanov S, Helft J, Chow A, Elpek KG, Gordonov S, Mazloom AR. Ma'ayan A, Chua WJ, Hansen TH, Turley SJ, Merad M, Randolph GJ, Immunological Genome C. Gene‐expression profiles and transcriptional regulatory pathways that underlie the identity and diversity of mouse tissue macrophages. Nat Immunol 2012; 13: 1118–28 [DOI] [PMC free article] [PubMed] [Google Scholar]
- 37. Ransohoff RM, Perry VH. Microglial physiology: unique stimuli, specialized responses. Annu Rev Immunol 2009; 27: 119–45 [DOI] [PubMed] [Google Scholar]
- 38. Meng A, Wang Y, Brown SA, Van Zant G, Zhou D. Ionizing radiation and busulfan inhibit murine bone marrow cell hematopoietic function via apoptosis‐dependent and ‐independent mechanisms. Exp Hematol 2003; 31: 1348–56 [DOI] [PubMed] [Google Scholar]
- 39. Yeager AM, Shinn C, Shinohara M, Pardoll DM. Hematopoietic cell transplantation in the twitcher mouse. The effects of pretransplant conditioning with graded doses of busulfan. Transplantation 1993; 56: 185–90 [DOI] [PubMed] [Google Scholar]
- 40. Bottcher C, Fernandez‐Klett F, Gladow N, Rolfes S, Priller J. Targeting myeloid cells to the brain using nonmyeloablative conditioning. PLoS ONE 2013; 8: e80260 [DOI] [PMC free article] [PubMed] [Google Scholar]
- 41. Probin V, Wang Y, Bai A, Zhou D. Busulfan selectively induces cellular senescence but not apoptosis in WI38 fibroblasts via a p53‐independent but extracellular signal‐regulated kinase‐p38 mitogen‐activated protein kinase‐dependent mechanism. J Pharmacol Exp Ther 2006; 319: 551–60 [DOI] [PubMed] [Google Scholar]
- 42. Andersson G, Illigens BM, Johnson KW, Calderhead D, LeGuern C, Benichou G, White‐Scharf ME, Down JD. Nonmyeloablative conditioning is sufficient to allow engraftment of EGFP‐expressing bone marrow and subsequent acceptance of EGFP‐transgenic skin grafts in mice. Blood 2003; 101: 4305–12 [DOI] [PubMed] [Google Scholar]
- 43. Lenting K, Verhaak R, Ter Laan M, Wesseling P, Leenders W. Glioma: experimental models and reality. Acta Neuropathol 2017; 133: 263–82 [DOI] [PMC free article] [PubMed] [Google Scholar]
- 44. Kierdorf K, Katzmarski N, Haas CA, Prinz M. Bone marrow cell recruitment to the brain in the absence of irradiation or parabiosis bias. PLoS ONE 2013; 8: e58544 [DOI] [PMC free article] [PubMed] [Google Scholar]
- 45. Lampron A, Lessard M, Rivest S. Effects of myeloablation, peripheral chimerism, and whole‐body irradiation on the entry of bone marrow‐derived cells into the brain. Cell Transplant 2012; 21: 1149–59 [DOI] [PubMed] [Google Scholar]
- 46. Deak E, Gottig S, Ruster B, Paunescu V, Seifried E, Gille J, Henschler R. Bone marrow derived cells in the tumour microenvironment contain cells with primitive haematopoietic phenotype. J Cell Mol Med 2010; 14: 1946–52 [DOI] [PMC free article] [PubMed] [Google Scholar]
- 47. Ford AL, Goodsall AL, Hickey WF, Sedgwick JD. Normal adult ramified microglia separated from other central nervous system macrophages by flow cytometric sorting. Phenotypic differences defined and direct ex vivo antigen presentation to myelin basic protein‐reactive CD4 + T cells compared. J Immunol 1995; 154: 4309–21 [PubMed] [Google Scholar]
- 48. Burrell K, Singh S, Jalali S, Hill RP, Zadeh G. VEGF regulates region‐specific localization of perivascular bone marrow‐derived cells in glioblastoma. Cancer Res 2014; 74: 3727–39 [DOI] [PubMed] [Google Scholar]
- 49. Furuya T, Tanaka R, Urabe T, Hayakawa J, Migita M, Shimada T, Mizuno Y, Mochizuki H. Establishment of modified chimeric mice using GFP bone marrow as a model for neurological disorders. NeuroReport 2003; 14: 629–31 [DOI] [PubMed] [Google Scholar]
- 50. Machein MR, Plate KH. Bone marrow chimera experiments to determine the contribution of hematopoietic stem cells to cerebral angiogenesis. Methods Mol Biol 2014; 1135: 275–88 [DOI] [PubMed] [Google Scholar]
- 51. Sedgwick JD, Schwender S, Imrich H, Dorries R, Butcher GW, ter Meulen V. Isolation and direct characterization of resident microglial cells from the normal and inflamed central nervous system. Proc Natl Acad Sci U S A 1991; 88: 7438–42 [DOI] [PMC free article] [PubMed] [Google Scholar]
- 52. Wright DE, Wagers AJ, Gulati AP, Johnson FL, Weissman IL. Physiological migration of hematopoietic stem and progenitor cells. Science 2001; 294: 1933–6 [DOI] [PubMed] [Google Scholar]
- 53. Bigildeev AE, Zhironkina OA, Lubkova ON, Drize NJ. Interleukin‐1 beta is an irradiation‐induced stromal growth factor. Cytokine 2013; 64: 131–7 [DOI] [PubMed] [Google Scholar]
- 54. Ajami B, Bennett JL, Krieger C, Tetzlaff W, Rossi FM. Local self‐renewal can sustain CNS microglia maintenance and function throughout adult life. Nat Neurosci 2007; 10: 1538–43 [DOI] [PubMed] [Google Scholar]
- 55. Maes W, Van Gool SW. Experimental immunotherapy for malignant glioma: lessons from two decades of research in the GL261 model. Cancer Immunol Immunotherapy 2011; 60: 153–60 [DOI] [PMC free article] [PubMed] [Google Scholar]
- 56. Szatmari T, Lumniczky K, Desaknai S, Trajcevski S, Hidvegi EJ, Hamada H, Safrany G. Detailed characterization of the mouse glioma 261 tumor model for experimental glioblastoma therapy. Cancer Sci 2006; 97: 546–53 [DOI] [PMC free article] [PubMed] [Google Scholar]
- 57. Oh T, Fakurnejad S, Sayegh ET, Clark AJ, Ivan ME, Sun MZ, Safaee M, Bloch O, James CD, Parsa AT. Immunocompetent murine models for the study of glioblastoma immunotherapy. J Transl Med 2014; 12: 107 [DOI] [PMC free article] [PubMed] [Google Scholar]
- 58. Bayerl SH, Niesner R, Cseresnyes Z, Radbruch H, Pohlan J, Brandenburg S, Czabanka MA, Vajkoczy P. Time lapse in vivo microscopy reveals distinct dynamics of microglia‐tumor environment interactions‐a new role for the tumor perivascular space as highway for trafficking microglia. Glia 2016; 64: 1210–26 [DOI] [PubMed] [Google Scholar]
- 59. Resende FF, Bai X, Del Bel EA, Kirchhoff F, Scheller A, Titze‐de‐Almeida R. Evaluation of TgH(CX3CR1‐EGFP) mice implanted with mCherry‐GL261 cells as an in vivo model for morphometrical analysis of glioma‐microglia interaction. BMC Cancer 2016; 16: 72 [DOI] [PMC free article] [PubMed] [Google Scholar]
- 60. Szulzewsky F, Pelz A, Feng X, Synowitz M, Markovic D, Langmann T, Holtman IR, Wang X, Eggen BJ, Boddeke HW, Hambardzumyan D, Wolf SA, Kettenmann H. Glioma‐associated microglia/macrophages display an expression profile different from M1 and M2 polarization and highly express Gpnmb and Spp1. PLoS ONE 2015; 10: e0116644 [DOI] [PMC free article] [PubMed] [Google Scholar]
- 61. Badie B, Schartner JM. Flow cytometric characterization of tumor‐associated macrophages in experimental gliomas. Neurosurgery 2000; 46: 957–61; discussion 61‐2 [DOI] [PubMed] [Google Scholar]
- 62. Charles NA, Holland EC, Gilbertson R, Glass R, Kettenmann H. The brain tumor microenvironment. Glia 2011; 59: 1169–80 [DOI] [PubMed] [Google Scholar]
- 63. Jakubzick C, Gautier EL, Gibbings SL, Sojka DK, Schlitzer A, Johnson TE, Ivanov S, Duan Q, Bala S, Condon T, vanRooijen N , Grainger JR, Belkaid Y, Ma'ayan A, Riches DW, Yokoyama WM, Ginhoux F, Henson PM, Randolph GJ. Minimal differentiation of classical monocytes as they survey steady‐state tissues and transport antigen to lymph nodes. Immunity 2013; 39: 599–610 [DOI] [PMC free article] [PubMed] [Google Scholar]
- 64. Tamoutounour S, Henri S, Lelouard H, deBovis B , deHaar C , dervan Woude CJ , Woltman AM, Reyal Y, Bonnet D, Sichien D, Bain CC, Mowat AM, Reis e Sousa C, Poulin LF, Malissen B, Guilliams M. CD64 distinguishes macrophages from dendritic cells in the gut and reveals the Th1‐inducing role of mesenteric lymph node macrophages during colitis. Eur J Immunol 2012; 42: 3150–66 [DOI] [PubMed] [Google Scholar]
- 65. Bennett ML, Bennett FC, Liddelow SA, Ajami B, Zamanian JL, Fernhoff NB, Mulinyawe SB, Bohlen CJ, Adil A, Tucker A, Weissman IL, Chang EF, Li G, Grant GA, Hayden Gephart MG, Barres BA. New tools for studying microglia in the mouse and human CNS. Proc Natl Acad Sci U S A 2016; 113: E1738–46 [DOI] [PMC free article] [PubMed] [Google Scholar]
- 66. Wang Q, Hu B, Hu X, Kim H, Squatrito M, Scarpace L, deCarvalho AC, Lyu S, Li P, Li Y, Barthel F, Cho HJ, Lin YH, Satani N, Martinez‐Ledesma E, Zheng S, Chang E, Sauve CG, Olar A, Lan ZD, Finocchiaro G, Phillips JJ, Berger MS, Gabrusiewicz KR, Wang G, Eskilsson E, Hu J, Mikkelsen T, DePinho RA, Muller F, Heimberger AB, Sulman EP, Nam DH, Verhaak RGW. Tumor Evolution of Glioma‐Intrinsic Gene Expression Subtypes Associates with Immunological Changes in the Microenvironment. Cancer Cell 2017; 32: 42–56 e6 [DOI] [PMC free article] [PubMed] [Google Scholar]
- 67. Sorensen MD, Dahlrot RH, Boldt HB, Hansen S, Kristensen BW. Tumour‐associated microglia/macrophages predict poor prognosis in high‐grade gliomas and correlate with an aggressive tumour subtype. Neuropathol Appl Neurobiol 2018; 44: 185–206 [DOI] [PubMed] [Google Scholar]
Associated Data
This section collects any data citations, data availability statements, or supplementary materials included in this article.
Supplementary Materials
Figure S1. Donor chimerism was achieved in the blood and spleen of busulfan‐conditioned transplant recipients.
Figure S2. No significant levels of eGFP+ donor‐derived microglia were detected in the brains of 25mg/kg busulfan‐conditioned transplant recipients.
Figure S3. Quantification of total Iba‐1+ microglia demonstrated that busulfan did not induce a significant proliferative response.
Figure S4. No significant changes in brain integrity were observed in busulfanconditioned mouse brains.
Figure S5. Tumour shows extravascular fibrin deposits and some uptake in tumour cells
Figure S6. The graph represents the density of eGFP+ cells in the brain away from the tumour, within the tumour mass and in sham controls
Figure S7. Flow cytometry gating analysis used to determine live CD45+ cells, chimerism and immune cell populations.
Table S1. Flow cytometry antibody panel and native eGFP antigen used to characterise monocytes, peripheral bone‐marrow derived macrophages and microglia in brain, blood and bone marrow.