

Abstract
Background
Currently, no federal guidelines provide recommendations on healthy birth spacing for women in the United States. This systematic review summarises associations between short interpregnancy intervals and adverse maternal outcomes to inform the development of birth spacing recommendations for the United States.
Methods
PubMed/Medline, POPLINE, EMBASE, CINAHL, the Cochrane Database of Systematic Reviews, and a previous systematic review were searched to identify relevant articles published from 1 January 2006 and 1 May 2017. Included studies reported maternal health outcomes following a short versus longer interpregnancy interval, were conducted in high‐resource settings, and adjusted estimates for at least maternal age. Two investigators independently assessed study quality and applicability using established methods.
Results
Seven cohort studies met inclusion criteria. There was limited but consistent evidence that short interpregnancy interval is associated with increased risk of precipitous labour and decreased risks of labour dystocia. There was some evidence that short interpregnancy interval is associated with increased risks of subsequent pre‐pregnancy obesity and gestational diabetes, and decreased risk of preeclampsia. Among women with a previous caesarean delivery, short interpregnancy interval was associated with increased risk of uterine rupture in one study. No studies reported outcomes related to maternal depression, interpregnancy weight gain, maternal anaemia, or maternal mortality.
Conclusions
In studies from high‐resource settings, short interpregnancy intervals are associated with both increased and decreased risks of adverse maternal outcomes. However, most outcomes were evaluated in single studies, and the strength of evidence supporting associations is low.
Keywords: birth spacing, interpregnancy interval, maternal health, maternal morbidity
1. BACKGROUND
In 2005, the World Health Organization (WHO) recommended that women should wait a minimum of 24 months between livebirth and conception of the next child in order to reduce the risk of adverse maternal, perinatal, and infant outcomes.1 These recommendations were primarily informed by a systematic review and meta‐analysis demonstrating that short interpregnancy interval—the time between one birth and the start of the subsequent pregnancy—is associated with adverse perinatal outcomes in the subsequent pregnancy, such as preterm birth and low birthweight.2 In terms of maternal health, the recommendations were based, in part, on a systematic review that found short interpregnancy interval may increase the risks of adverse maternal health outcomes such as uterine rupture and maternal death, while long intervals have been consistently linked with increased risk of preeclampsia.1, 3 Possible mechanisms through which short interpregnancy interval may increase risks of adverse maternal health outcomes include inadequate maternal repletion of nutritional status following the delivery of a live infant, insufficient time to lose pregnancy weight post‐partum, and incomplete healing of the uterine incision post‐caesarean.4, 5 Both the WHO Technical Consultation and the systematic review study authors concluded that more research is needed on the relationship between birth spacing and maternal mortality and morbidity.
The extent to which the WHO recommendations are relevant to women in the United States (US) is unclear. The two systematic reviews on which the recommendations were based included a large proportion of studies from lower resourced countries, where women's nutritional status and access to contraception are not comparable to most US women. Further, the reviews were published over a decade ago and therefore do not incorporate the findings of research conducted since 2006.
At present, there are no federal recommendations on birth spacing in the United States. In accordance with National Academy of Medicine (formerly the Institute of Medicine) guideline development standards,6 the purpose of this systematic review was to summarise the association between short interpregnancy interval and adverse maternal outcomes in high‐resource settings in order to inform development of recommendations on birth spacing for the United States. The association between short interpregnancy interval and adverse perinatal outcomes in high‐resource settings is reported separately in this journal supplement in a companion paper.7
2. METHODS
This systematic review was conducted using established methodological standards.8, 9 Figure S1 shows the analytic framework we constructed outlining the target population and relationships between interpregnancy intervals and outcomes, as well as our two key questions examining the link between interpregnancy interval and perinatal and maternal health outcomes. In this manuscript, we present findings for key question #2, In postpartum women in the United States, what is the effect of short interpregnancy intervals (any interval <24 months) versus a longer interpregnancy interval on short‐term maternal health outcomes: maternal depression, gestational diabetes, preeclampsia, maternal obesity, interpregnancy weight gain, labor dystocia, maternal anaemia, and maternal mortality? We based our protocol on a previous systematic review published in 2007 on the effects of birth spacing on maternal health.3 The 2007 review included studies published between 1966 and March 2006 in PubMed/MEDLINE; between 1980 and March 2006 in EMBASE, POPLINE, and ECLA; or between 1982 and March 2006 in CINAHL and LILACS using a combination of medical subject headings and keyword terms to identify relevant studies. The 2007 review included observational studies of the relationships between birth or interpregnancy interval and adverse maternal health outcomes with statistical adjustment for at least maternal age. Health outcomes in our review were based on those included in the 2007 review and included maternal depression, gestational diabetes, maternal obesity, interpregnancy weight gain, labour dystocia, maternal anaemia, preeclampsia and other hypertensive disorders of pregnancy (gestational hypertension, HELLP, eclampsia, pregnancy‐induced hypertension), and maternal mortality.
In contrast to the 2007 review, the updated review includes only studies conducted in the United States, Canada, Australia, New Zealand, and European countries categorised as “very high” on the United Nations Human Development Index10 to identify those most clinically applicable to women in the United States. In addition, the updated review concerns potential consequences of short rather than long interpregnancy intervals because they are more amenable to prevention, for example through the provision of contraceptive services.
Of 22 studies included in the 2007 review, 12 were conducted in study populations from the United States and other high‐resource countries,11, 12, 13, 14, 15, 16, 17, 18, 19, 20, 21, 22 and only 6 of these examined interpregnancy intervals as opposed to interbirth intervals.12, 17, 18, 20, 21, 22
2.1. Literature search
Using the same search terms as the previous review, we conducted electronic searches of PubMed/Medline, POPLINE, EMBASE, CINAHL, and the Cochrane Database of Systematic Reviews for relevant articles published between 1 January 2006 and 1 May 2017. In addition to search terms for specific outcomes, we also included general terms like “obstetric outcome” and “maternal morbidity.” After our initial search, we ran a targeted search covering the same 2006‐2017 search period for maternal health outcomes not included in the original search but identified through initial search findings (uterine rupture, placental abruption, placenta previa), similar to the strategy used in the 2007 review. Specific search terms and publication date ranges are listed in Table S1. Investigators also conducted manual searches of reference lists of key papers.
2.2. Inclusion/exclusion criteria
Inclusion criteria for studies were developed a priori using the PICOTS framework and independently applied to the search results by two study authors (KA and JH) (Table S2). Studies from the 2007 review meeting new, more restrictive inclusion criteria were also included. Included studies met the following criteria:
The study population consisted of women of reproductive age with at least one livebirth who become pregnant again. Women whose last delivery was a stillbirth were also included as long as they comprised <5% of the study population.
The study measured the interpregnancy interval—the time between one birth and the start of the subsequent pregnancy—rather than other types of intervals (eg, post‐pregnancy loss interpregnancy intervals, post‐abortion interpregnancy intervals, and interbirth intervals). This definition was imposed because there are separate considerations and recommendations for interpregnancy interval following pregnancy losses.1, 23 Also, birth intervals are the sum of the interpregnancy interval and the duration of the subsequent pregnancy; therefore, adverse pregnancy outcomes associated with shorter pregnancy duration, such as preeclampsia, will have systematically shorter interbirth intervals than women without these outcomes. This systematic difference creates the potential for bias due to reverse causation (ie, a short interbirth interval was the result of, rather than the cause of, an adverse outcome).
The study compared a short interpregnancy interval, defined as any interval shorter than 24 months, to a longer interpregnancy interval, and the comparison interval had clearly defined lower and upper boundaries specified (ie, “18‐23 months” rather than “>18 months”). A clearly defined upper boundary was required because of the reverse J‐shaped relationship between interpregnancy interval and many adverse health outcomes.2, 24 So reference categories without an upper boundary are likely to represent a heterogeneous risk group. For similar reasons, studies that modelled interpregnancy interval assuming a continuous, linear association with adverse outcomes were also excluded.
The study adjusted for at least maternal age and had a sample size of at least 100 women.
The study was designed as a randomised controlled trial, or cohort, cross‐sectional, or case‐control study.
Included studies were available as full‐text English‐language publications and presented the relevant findings and estimates of precision numerically.
2.3. Data abstraction, study quality assessment, data synthesis
A structured Excel‐based abstraction form was developed for data abstraction (available on request). Two authors independently abstracted relevant data from full‐text articles of included studies; discrepancies were resolved through consensus. Data included study design, source, setting, numbers and characteristics of participants, interpregnancy intervals, comparisons, adjustment for confounders, maternal outcomes, and results.
Included studies were assessed for quality using criteria outlined by the US Preventive Services Task Force for internal and external validity and rated as good, fair, or poor.25, 26 Two reviewers independently assessed quality, and discrepancies were resolved through consensus. Internal validity was determined by considering sources of potential information bias (misclassification), confounding, and selection bias. External validity was assessed by comparing the study population to either the general obstetric population in the United States or, for studies of women with specific obstetric history, a population with similar history in the United States.
Findings of the systematic review were not combined quantitatively through meta‐analysis due to the small number and heterogeneity of studies. Although our protocol originally specified that only studies determined to be of good or fair internal validity would be included in the review, we included all studies irrespective of quality given the low number of articles that met inclusion criteria.
3. RESULTS
The literature search identified 490 unique references, of which 445 were excluded, most commonly because the studies were conducted outside the United States or high‐resource settings or did not address the research question. A total of 45 articles were identified for full‐text review, of which six studies met eligibility criteria in addition to one study from the 2007 review. A literature flow diagram is shown in Figure 1.
Figure 1.
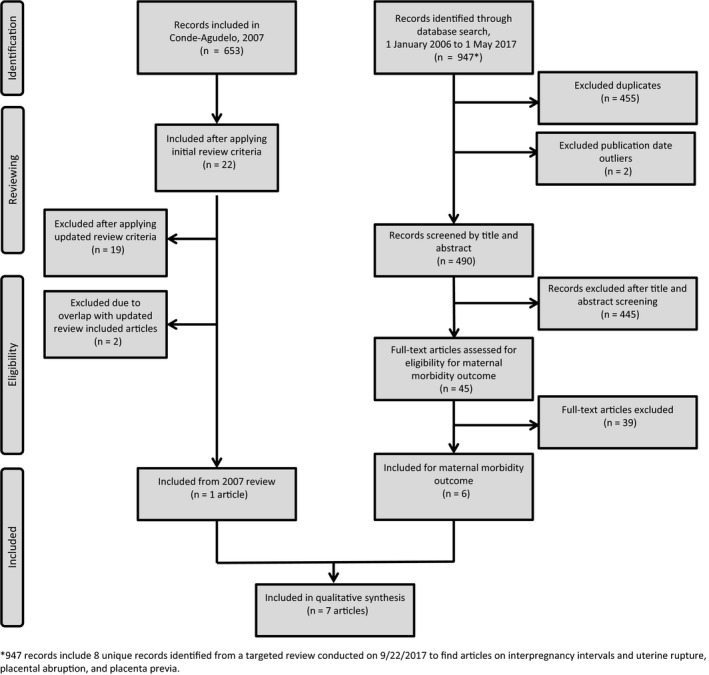
Literature flow diagram of the systematic review process for identifying relevant studies on short interpregnancy intervals and adverse maternal health outcomes
The seven included studies, all cohort studies, are described in Table 1. Studies examined labour abnormalities (three studies),18, 27, 28 obesity (two studies),29, 30 gestational diabetes (one study),30 preeclampsia (one study),30 placental abruption (one study),31 and uterine rupture among women attempting vaginal birth after caesarean (one study).32 Most studies examined more than one maternal health outcome, and no studies reported outcomes related to maternal depression, interpregnancy weight gain, maternal anaemia, or maternal mortality. A summary of evidence for included studies is provided in Table 2.
Table 1.
Characteristics and quality of included studies
| Author year | Location | Data source | Study Population (N) Study design | Interpregnancy intervals (months) | Outcome | Covariates in adjusted analysis | Subgroup/Stratified analyses | Quality ratings |
|---|---|---|---|---|---|---|---|---|
| Appareddy et al27 2016 | Tennessee, USA | Birth certificate data matched with infant mortality data |
Women with a previous livebirth, who gave birth during 2012‐2014 and had IPI <5 y (N = 101912) Cohort study |
<6 6‐12 12‐18 18‐≤60a |
Precipitous labour (n = not stated and cannot be calculated from data provided) | Maternal age, marital status, educational level, race, household income, pre‐pregnancy BMI, number of previous pregnancies, timing of entry into prenatal care, and maternal smoking | WIC use during pregnancy vs no WIC use during pregnancy |
Poor internal validity Strengths: large, population‐based sample Weaknesses: potential for outcome misclassification due to lack of standardised definition for precipitous labour; variable was subsequently removed from national birth certificates due to low validity. Birth certificate information on lifestyle and socio‐economic position is limited, creating the potential for residual confounding Good external validity: study population based on all vital statistics records from Tennessee |
| Blumenfeld et al31 2014 | California, USA | California Prenatal Screening Program data linked to livebirth and hospital discharge records in birth cohort database |
Singleton pregnancies undergoing first‐ and second‐trimester screening, with expected dates of delivery during 2009‐2010, with chromosomal abnormalities and other causes of vaginal bleeding excluded (N = 137 915) Cohort study |
<6 6‐23 24‐59a >60 |
Placental abruption (n = 1017; 0.7%) | Maternal age, BMI, pre‐existing hypertension, preeclampsia severity, previous preterm birth, first‐ and second‐trimester PAPP‐A, AFP, uE3, and INH | Abruption without hypertensive disorder vs abruption with hypertensive disorder |
Fair internal validity Strengths: large sample size, outcome and covariates ascertained using both vital records and hospital discharge records Weaknesses: potential for measurement error of up to 1 mo in interpregnancy interval measurement due to lack of data on day of last livebirth; birth certificate information on lifestyle and socio‐economic position is limited, creating the potential for residual confounding Poor external validity: study population limited to women who presented in the first trimester and opted for prenatal genetic screening. This population is likely not representative with respect to pregnancy intention and interpregnancy interval planning but represents women who opt against screening or present for care after 10‐13 wk |
| Davis et al29 2014 | National sample USA | National Longitudinal Survey of Youth survey |
Youth aged 14‐21 in 1979, restricted to women non‐obese and never pregnant as of 1981 and followed on average for 8.3 y (N = 3422) Cohort study |
<12 12‐18 ≥18a |
Obesity (n = not stated in text, but cumulative incidence is approximately 23%) | Adjusted for baseline BMI, baseline age, time‐dependent marital status, race/ethnicity, time‐dependent and baseline urban/rural, mother's education, and time‐dependent and baseline poverty status | None |
Fair internal validity Strengths: prospectively collected data, uniform data collection techniques Weaknesses: outcome of obesity based on self‐reported heights and weights; time‐to‐obesity analyses based on a time zero of the baseline visit of 1981, irrespective of time of first pregnancy Good external validity: National Longitudinal Survey of Youth 79 is nationally representative based on multi‐stage stratified area probability sampling |
| Hanley et al30 2017 | British Columbia, Canada | Database of abstracted obstetric and neonatal medical charts, British Columbia Perinatal Data Registry, with maternally linked deliveries |
Women with at least three singleton deliveries between 1 April 2000 and 21 March 2015 delivered at 20‐44 wk’ gestation (N = 38 178 women; N = 76, 356 s and third deliveries) Cohort study |
0‐5 6‐11 12‐17 18‐23a 24‐59 ≥60 |
Gestational diabetes (5.8% at second pregnancy; 8.5% at third pregnancy); obese at beginning of pregnancy (14.2% at second pregnancy; 17.0% at third pregnancy); preeclampsia (2.1% at second pregnancy, 2.9% at third pregnancy) |
Unmatched analysis: age at time of each delivery, delivery year, any diabetes (except for gestational diabetes model), any high blood pressure diagnosis (except for preeclampsia model), smoking during pregnancy, and history of perinatal death Maternally matched analysis: included covariates used in unmatched analysis, plus additionally controlled for maternal characteristics that did not change between deliveries |
None |
Good internal validity for matched analysis; poor for unmatched Strengths: large, population‐based sample; quality‐controlled database based on abstracted medical records information Weaknesses: unmatched analyses do not control for any measures of socio‐economic status, creating the potential for residual confounding; adjustment for maternal age at pregnancy following IPI an over‐adjustment Good external validity for unmatched analysis; poor for matched: from the Canadian province of British Columbia; analyses restricted to women with 3 or more births, but applicable to all women with 2 or more births. Matched analyses are restricted to women with discordant adverse outcomes, which is only a small subset of the target population |
| Sandstrom et al28 2012 | Sweden | Swedish Medical Birth Register linked to Education Register and Register of Total Population, with maternal‐linked deliveries |
Women with first and second consecutive singleton full‐term livebirths with cephalic presentation and spontaneous onset of labour during 1992 and 2006 (N = 239 953) Cohort study |
<12 12‐47a 48‐83 ≥84 |
Labour dystocia (n = 12 599; 5.3%) | Dystocia, mode of delivery, and birthweight in first birth; education as of 2005; country of birth; and second birth maternal age, early pregnancy BMI, maternal height, cohabitation with partner, gestational age, year of birth, and early pregnancy cigarette smoking | None |
Good internal validity Strengths: large, population‐based sample; quality‐controlled database derived from medical records Weaknesses: control for maternal age at second pregnancy over‐adjustment Fair external validity: conducted in Sweden, where labour management differs from the United States as evidenced by lower caesarean delivery rate and higher TOLAC rate. Women with induced labour were excluded |
| Stamilio et al32 2007 | North‐eastern states, USA | Abstracted data from medical records of deliveries at 17 hospitals in the north‐eastern United States |
Pregnant women with at least one prior caesarean delivery who attempted vaginal birth after caesarean between 1995 and 2000 (N = 13 331) Cohort study |
0‐5 6‐11 12‐17 18‐59a ≥60 |
Uterine rupture (n = 128; 0.9%) | Number of previous caesarean birth (one vs two plus); previous vaginal delivery; race; index delivery gestational age, hospital type, anaemia, smoking, maternal age, parity, health insurance status, and labour type (spontaneous/induced/augmented) | Immediate previous delivery mode caesarean vs vaginal |
Poor internal validity Strengths: large, multi‐hospital cohort study; uterine rupture outcome based on clear case definition abstracted from medical record Weaknesses: interpregnancy interval calculated with only year, not date, of prior pregnancy, introducing considerable measurement error Good external validity: restricted to women attempting VBAC; hospital sites included a mix of teaching, non‐teaching, and community hospitals |
| Zhu et al18 2006 | Michigan, USA | Birth certificate data linked to hospital discharge data for births between 1994 and 2002, with deliveries linked maternally |
Singleton births to multiparae Cohort study |
0‐23a 24‐47 48‐71 72‐95 96‐119 ≥120 |
Labour dystocia (n = 92 020 calculated; 14.2%) | Second delivery maternal age, marital status, education, gravidity, previous pregnancy outcome (livebirth vs termination/loss), weight gain during pregnancy, prenatal care utilisation, smoking during pregnancy, previous caesarean delivery, and infant birthweight | Functional, mechanical, and respective subtypes; overall labour dystocia outcome stratified by many pregnancy and maternal characteristics |
Fair internal validity Strengths: large sample size, outcome and covariates ascertained using both vital records and hospital discharge records Weaknesses: accuracy of ICD codes to capture labour dystocia unknown, particularly within subtypes of dystocia; potential confounders such as pre‐pregnancy BMI not included; adjustment for maternal age at second pregnancy may be an over‐adjustment Good external validity: Based on all vital statistics records from Michigan |
AFP, alpha fetoprotein; BMI, body mass index; ICD, International Classification of Disease; INH, dimeric inhibin‐A; PAPP‐P, pregnancy‐associated plasma protein A; TOLAC, trial of labour after cesarean; uE3, unconjugated estriol; VBAC, vaginal birth after cesarean; WIC, Special Supplemental Nutrition Program for women, infants, and children.
Reference group.
Table 2.
Summary of evidence
| Outcome | Studies (k) Observations (n) Study designs | Summary of findings | Consistency and precision | Other limitations | Strength of evidence | Applicability |
|---|---|---|---|---|---|---|
| Obesity | 2 studies (1 sibling matched, 1 prospective cohort); N = 41,600 | Risk was higher with shorter IPI in a sibling matched study (<6 vs. 18‐23 mo aOR = 1.61 [95% CI, 1.05 to 2.45]; 6‐11 vs. 18‐23 mo aOR = 1.43 [95% CI, 1.10 to 1.87]). In a prospective cohort study, a trend towards higher risk for shorter IPI was not statistically significant (<12 vs. 12‐18 mo aHR = 1.94 [95% CI, 0.85 to 4.45]). | Inconsistent, imprecise | Obesity based on self‐reports | Low | Moderate |
| Gestational diabetes | 1 sibling matched study; N = 38,178 | Risk was higher with shorter IPI in a sibling matched study (<6 vs. 18‐23 mo aOR = 1.35 [95% CI, 1.02 to 1.80]). | Not applicable | Low generalisability of matched pairs. | Low | Low |
| Preeclampsia | 1 sibling matched study; N = 38,178 | Risk was lower with shorter IPI in a sibling matched study (6‐11 vs. 18‐23 mo OR = 0.71 [95% CI, 0.54 to 0.94]) | Not applicable | Low generalisability of matched pairs. | Low | Low |
| Labour dystocia | 2 cohort studies; N = 660,624 | Risk was lower with shorter IPI in two studies (<12 vs. 12‐43 mo aOR = 0.91 [95% CI, 0.85 to 0.97]; <24 vs. 24‐47 mo aOR = 0.94 [95% CI, 0.93 to 0.96]; and <24 vs. ≥120 mo aOR = 0.66 [95% CI, 0.64 to 0.68]) | Consistent, imprecise | Accuracy of ICD codes unknown; potential confounders not included; adjustment for maternal age at second pregnancy may be an over adjustment | Low | Moderate |
| Precipitous labour | 1 cohort study; N = 101,192 | Risk was higher with shorter IPI in one study (<6 vs. 18‐60 mo aOR = 1.30 [95% CI, 1.11 to 1.51]; aOR 6‐12 vs. 18‐60 mo aOR = 1.19 [95% CI, 1.04 to 1.36]; and 12‐18 vs. 18‐60 mo aOR = 1.25 [95% CI, 1.10 to 1.41]) | Not applicable | Lack of standardised definition for precipitous labour; poor validity of birth certificate data | Low | Low |
| Placental abruption | 1 cohort study; N = 137,915 | Risk was higher with shorter IPI in one study (<6 vs. 24‐59 mo overall aOR = 1.9; [95% CI, 1.3 to 3.0]; without hypertensive disorders aOR=2.0 [95% CI, 1.3 to 3.1]) | Not applicable | Poor validity of birth certificate data; decreased generalisability as cohort restricted to women who opted for prenatal genetic testing | Low | Low |
| Uterine rupture after VBAC | 1 cohort study; N = 13,331 | Risk was higher with shorter IPI in one study (<6 vs.18‐59 mo aOR = 3.05 [95% CI, 1.36 to 6.87]). Blood transfusions and delivery complications were also higher | Not applicable | Interpregnancy interval imprecise introducing measurement error | Low | Low |
| Maternal depression; interpregnancy weight gain; maternal anemia; maternal mortality | No studies | Not applicable | Not applicable | Not applicable | Insufficient | Insufficient |
Abbreviations: aHR, adjusted hazard ratio; aOR, adjusted odds ratio; ICD, International Classification of Disease; IPI, interpregnancy interval; US, United States; VBAC, vaginal birth after cesarean section.
3.1. Study quality
The internal validity of the studies was mixed, with two of the seven studies rated as having good internal validity,28, 30 three fair,18, 29, 31 and two poor.27, 32 The two good‐quality studies were based on quality‐controlled population perinatal databases—the Swedish Medical Birth Register28 and the British Columbia Perinatal Database Registry.30 The latter study also used a sibling comparison design of women with two or more interpregnancy intervals (ie, three or more pregnancies) to better account for confounding by factors that generally remain constant across a woman's pregnancies, such as ethnicity, education, and socio‐economic position.
The potential for measurement errors of interpregnancy intervals or maternal outcomes was a common limitation. For example, use of self‐reported heights and weights to evaluate the onset of obesity is known to introduce error33 (contributing to a “fair” rating), while use of the variable for “precipitous labour” from the US birth certificate has low sensitivity compared with medical record data, which lead to its removal from the national file in 201434, 35 (contributing to a “poor” rating).
Four studies met criteria for good external validity,18, 27, 29, 32 one fair,28 and two poor.30, 31 Use of population‐based records, including birth certificate records and population perinatal registries, supported the highest ratings. A sibling comparison matched analysis was ranked as “poor” because, by virtue of the matched design, the analysis was restricted to women who not only had three or more pregnancies, but also experienced discordant pregnancy outcomes.30 Given the relatively low incidence of maternal pregnancy complications in the general population, such as gestational diabetes and preeclampsia, the effective study cohort represented only a very small fraction of the target population. External validity was also downgraded in a study that examined the association between first‐ and second‐trimester screening markers during pregnancy and risk of placental abruption in California.31, 36 In this study, generalisability was limited because 30% of women in California do not undergo prenatal screening, and screening uptake differs by factors that are also linked with short interpregnancy interval, such as socio‐economic status.37, 38
3.2. General obstetric population studies
3.2.1. Obesity
A good‐quality sibling comparison matched analysis evaluated the relationship between interpregnancy interval and maternal obesity at the beginning of the subsequent pregnancy among 38 178 women in British Columbia, Canada, between 2000 and 2015.30 This study used each woman as her own control to isolate the effects of interpregnancy interval from other time‐invariant factors, such as ethnicity or family history, that remain constant between a woman's pregnancies. By design, the study was restricted to women with three or more pregnancies that resulted in deliveries. Models additionally were adjusted for age at time of each delivery, delivery year, diabetes, hypertension, smoking during pregnancy, and history of perinatal death.
Results indicated interpregnancy intervals of <6 and 6‐11 months were associated with increased risks of obesity compared with intervals of 18‐23 months (adjusted odds ratio [aOR] = 1.61; 95% CI, 1.05‐2.45 and aOR = 1.43; 95% CI, 1.10‐1.87, respectively) (Figure 2). For comparative purposes, the study also presented findings from between‐women unmatched analyses that were restricted to women with three or more pregnancies (Table S3). However, these analyses lacked adjustment for important confounders, such as socio‐economic status, and are likely prone to bias.
Figure 2.
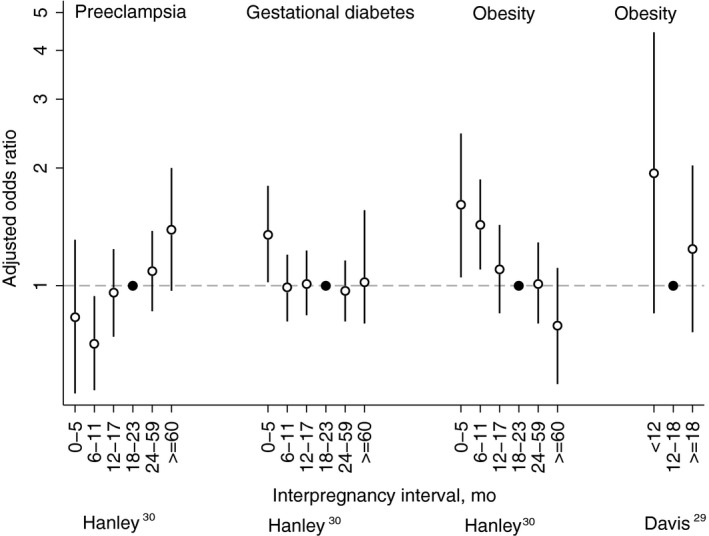
Adjusted odds ratios (white circle) with 95% confidence intervals for preeclampsia, gestational diabetes mellitus, and obesity by interpregnancy interval as reported in Hanley30 (within‐woman matched analyses) and Davis.29 See Table 1 for adjustment variables in each study. Reference categories are indicated with a black circle
Interpregnancy interval and time to obesity were also estimated in a fair‐quality prospective cohort study of women enrolled in the National Longitudinal Survey of Youth.29 The cohort included 3422 women aged 14‐21 years in 1979 who were not obese and had never been pregnant as of 1981. Women were followed for an average 8.3 years or until they first became obese (cumulative incidence 23%). After adjusting for time‐varying and baseline demographics, point estimates suggested increased obesity in women with two births separated by an interpregnancy interval <12 months compared to women with births separated by 12‐18 months, although differences were not statistically significant (adjusted hazard ratio [aHR] = 1.94; 95% CI, 0.85‐4.45).
3.2.2. Gestational diabetes
The association between interpregnancy interval and gestational diabetes was evaluated in the same Canadian sibling comparison matched analysis.30 Results indicated increased risks for interpregnancy intervals <6 months compared with 18‐23 months (aOR = 1.35; 95% CI, 1.02‐1.80), but not for other interpregnancy intervals (Figure 2).
3.2.3. Preeclampsia
The same Canadian sibling comparison matched analysis evaluated the association between interpregnancy interval and preeclampsia.30 In this study, an interpregnancy interval of 6‐11 months reduced risk of preeclampsia compared with 18‐23 months (aOR = 0.71; 95% CI, 0.54‐0.94), while intervals ≥60 months increased risk (aOR = 1.39; 95% CI, 0.97‐2.00).
3.2.4. Labour dystocia
Dystocia in second labour was evaluated in a large, good‐quality cohort Swedish study of women with first and second full‐term births with cephalic presentation and spontaneous onset of labour during 1992 and 2006.28 After adjustment for a comprehensive set of confounders, estimates indicated that interpregnancy intervals <12 months were associated with lower odds of dystocia compared with 12‐43 months (aOR = 0.91; 95% CI, 0.85‐0.97) (Figure 3).
Figure 3.
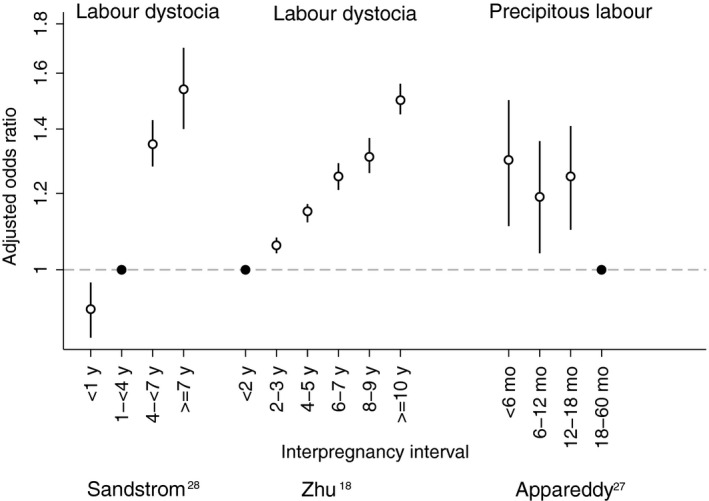
Adjusted odds ratios (white circle) with 95% confidence intervals for labour abnormalities by interpregnancy interval as reported in Sandström,28 Zhu,18 and Appareddy.27 See Table 1 for adjustment variables in each study. Reference categories are indicated with a black circle
Figure 4.
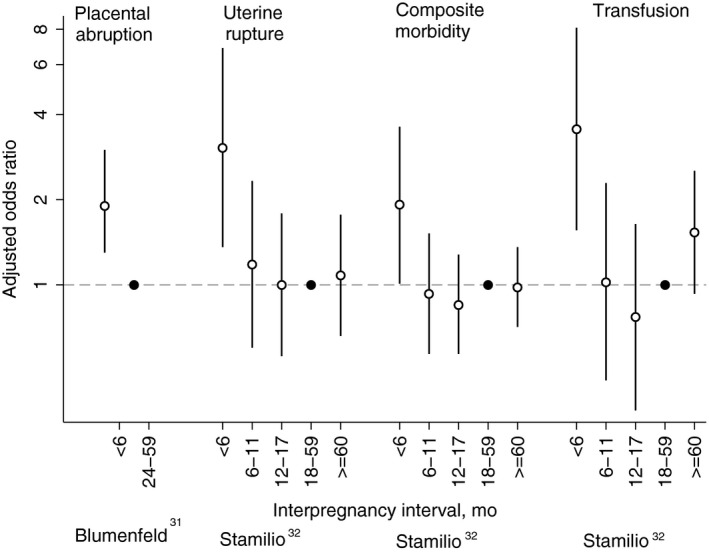
Adjusted odds ratios (white circle) with 95% confidence intervals for maternal morbidities by interpregnancy interval as reported in Blumenfeld31 and Stamilio.32 See Table 1 for adjustment variables in each study. Reference categories are indicated with a black circle
The association between interpregnancy interval and labour dystocia was also evaluated in a fair‐quality cohort study of 648 025 singleton births to multiparae delivering in Michigan between 1994 and 2002.18 In adjusted analyses, length of interpregnancy interval was inversely related to labour dystocia in a dose‐response fashion, with intervals <24 months showing the lowest odds of dystocia compared with 24‐47 months (aOR = 0.94; 95% CI, 0.93‐0.96) and ≥120 months (aOR = 0.66; 95% CI, 0.64‐0.68). Note that published estimates in the original publication have been inverted for the purpose of this systematic review. When analysed by labour dystocia subtype, length of interpregnancy interval was inversely associated with both functional dystocia and mechanical dystocia.
3.2.5. Precipitous labour
A poor‐quality study based on vital statistics records evaluated interpregnancy intervals and precipitous labour among 101 192 multiparae in Tennessee from 2012 to 2014.27 Odds of precipitous labour were higher for women with an interval <18 months compared with 18 to 60 months (aOR <6 months = 1.30; 95% CI, 1.11‐1.51; aOR 6‐12 months = 1.19; 95% CI, 1.04‐1.36; aOR 12‐18 months = 1.25; 95% CI, 1.10‐1.41).
3.2.6. Placental abruption
A fair‐quality study of California's Prenatal Screening Program assessed interpregnancy intervals and placental abruption among 137 915 singleton pregnancies undergoing first‐ and second‐trimester screening during 2009‐2010.31 In this study, an interpregnancy interval of <6 months compared with 24‐59 months was associated with increased placental abruption overall (aOR = 1.9; 95% CI, 1.3‐3.0) and among a subset of pregnancies without hypertensive disorders (aOR = 2.0; 95% CI, 1.3‐3.1). Interpregnancy interval was not associated with placental abruption among a subset of pregnancies with hypertensive disorders (estimate not reported).
3.3. Special obstetric population studies
3.3.1. Uterine rupture among women attempting vaginal birth after caesarean delivery
Uterine rupture was evaluated in a cohort of 13 331 pregnant women attempting vaginal birth after caesarean delivery presenting for delivery in 17 hospitals in the north‐eastern United States between 1995 and 2000.32 Results indicated an interpregnancy interval of <6 months compared with 18‐59 months was associated with uterine rupture (aOR = 3.05; 95% CI, 1.36‐6.87) after adjustment for pregnancy history, demographic factors, and second delivery pregnancy characteristics. An interpregnancy interval of <6 months was also associated with increased blood transfusions (aOR = 3.55; 95% CI, 1.56‐8.10) and a composite measure of other delivery complications including bladder, ureter, or bowel injury and uterine artery laceration (aOR = 1.92; 95% CI, 1.01‐3.62). An unadjusted stratified analysis found that an interpregnancy interval of <6 months compared with ≥6 months among women whose last delivery was a caesarean birth was associated with increased risk of uterine rupture and other complications of delivery (bladder, ureter, or bowel injury; and uterine artery laceration) (OR = 5.1; 95% CI, 2.4‐10.8). In contrast, there was no increased risk associated with interpregnancy interval <6 months compared with ≥6 months among women whose last delivery was a vaginal birth (OR = 0.8; 95% CI, 0.1‐6.0). However, the test for homogeneity was not statistically significant (P = 0.07).
4. DISCUSSION
This systematic review identified seven studies describing the associations between short interpregnancy intervals and adverse maternal health outcomes among women in the United States and similar high‐resource settings. Most outcomes were evaluated in single studies, and the strength of evidence supporting associations is low (Table 2). Available studies indicate that short interpregnancy intervals may be associated with increased risks of subsequent obesity, gestational diabetes, precipitous labour, and placental abruption, and decreased risks of preeclampsia and labour dystocia. Among women with a previous caesarean delivery, an interval <6 months was associated with increased risks of uterine rupture, blood transfusions, and other delivery complications. No studies reported outcomes related to maternal depression, interpregnancy weight gain, maternal anaemia, or maternal mortality.
The evidence base for maternal outcomes is small compared with that examining short interpregnancy interval and adverse perinatal outcomes.7 A systematic review reported separately in this journal supplement identified a total of 32 studies examining the consequences of short interpregnancy interval on preterm birth, small‐for‐gestational‐age birth, perinatal mortality, and other adverse outcomes in high‐resource settings. Although the quality of many of these studies was limited due to concerns of confounding by socio‐economic position, prior perinatal death, and pregnancy intention, a consistent association between short interpregnancy intervals, particularly <12 months, was observed.
It remains controversial whether the link between short interpregnancy interval and adverse health outcomes is causal or confounded by differences in the health characteristics and behaviours of women with short vs longer intervals, such as socio‐economic status.39, 40 Much of this debate has focused on perinatal outcomes such as preterm birth. For several of the maternal health outcomes identified in our review, however, there is a clear biological pathway through which interpregnancy interval could exert a causal effect and the argument for residual confounding is less compelling. For example, a longitudinal study of maternal postpartum weight in US women suggests that most women continue to lose weight up to 1 year after delivery, before reaching a plateau from 12 to 24 months.41 It is therefore highly plausible that women who become pregnant within 12 months after delivery will have a higher weight at the start of the subsequent pregnancy. This, in turn, would increase risk of obesity and potentially gestational diabetes in the subsequent pregnancy. Likewise, studies of caesarean wound healing suggest that repair of uterine smooth muscle tissue occurs over the course of several months post‐surgery, with radiologic findings suggesting that 6 months is needed for full scar tissue and anatomical recovery.42 This supports the finding that risk of uterine rupture is increased in women with an interpregnancy interval <6 months following caesarean delivery. As a result, maternal outcomes may present a more compelling case that modifying interpregnancy interval length will causally affect health outcomes.
Our review identified a number of studies that presented data on birth spacing and adverse maternal outcomes, but did not meet our inclusion criteria because of methodological concerns that limited their interpretability for informing development of recommendations on birth spacing for the United States. Several studies examined interbirth interval (rather than interpregnancy interval),43, 44, 45, 46, 47, 48, 49, 50, 51, 52, 53 presented crude results only (no adjustment for maternal age),22, 43, 49, 52, 54, 55 or did not account for a potential non‐linear relationship between interpregnancy interval and health outcome by either assuming that interpregnancy interval had a linear association with risks of adverse outcomes or using a reference category with no upper bound.20, 22, 46, 47, 56, 57, 58 Nevertheless, the conclusions of the excluded studies are consistent with our findings that short interpregnancy interval is associated with increased risk of uterine rupture among women with prior caesarean birth46, 47, 49 and placental abruption,17, 52 as well as decreased risk of preeclampsia or other hypertensive disorders of pregnancy.12, 21, 50, 51, 59, 60 However, in contrast to the studies in our review, several excluded studies suggested that risks of obesity and gestational diabetes may actually increase with longer (not shorter) interpregnancy interval.43, 44, 54, 56 In addition, both short and long interpregnancy intervals were linked with increased risk of placenta previa,53 while women with placenta accreta had a shorter average interpregnancy interval than controls.20
Limitations of studies specific to each key question are briefly described in Tables 1 and 2. Our review applied more stringent inclusion/exclusion criteria than previous systematic reviews in this field.3, 61, 62, 63 Although this led to the exclusion of a number of potentially relevant studies, this ensured that our review consisted of more methodologically robust studies whose findings are most directly applicable to inform guidelines for US women. The small number of studies identified meeting our review criteria also highlights the need for research to fill these gaps. Greater research on these outcomes would also enable the potential for publication bias to be better assessed. Finally, by focusing on studies of interpregnancy interval, we did not identify studies examining more directly modifiable changes after birth such as contraception use and return to sexual activity that, combined, can determine a woman's interpregnancy interval. These factors, rather than interpregnancy interval itself, may be more directly relevant for informing family planning guidelines.64
Policy‐makers and professional medical organisations currently have access to a large body of research examining the consequences of a short interpregnancy interval for perinatal and newborn health, but recommendations on postpartum counselling and contraception access should be equally informed by the consequences of a short interval for maternal health. This systematic review provided some evidence that short interpregnancy interval increases the risks of some adverse maternal outcomes (such as obesity in pregnancy), while protecting against others (such as preeclampsia). However, our review highlights the sparseness of the evidence based on the consequences of short interpregnancy interval for maternal health in high‐ resource settings, and the need for further research in this area. The findings that short intervals may increase risk of gestational diabetes and obesity warrant particular investigation given the links between these outcomes and longer term maternal cardiometabolic health. Evidence on outcomes for which no eligible studies were found, such as maternal depression, is also critical.
DISCLAIMER
The findings and conclusions in this report are those of the authors and do not necessarily represent the official position of the Office of Population Affairs, Office of the Secretary for Health, Department of Health and Human Services.
CONFLICT OF INTEREST
No financial or other disclosures of conflict of interests were reported by the authors of this paper.
Supporting information
ACKNOWLEDGEMENTS
The authors thank Julia Rollison, Stephen Tregear, and their research team, from Atlas Research, for conducting the preliminary systematic review and evidence report. The authors also acknowledge the critical feedback they received during the September 14‐15, 2017, expert workgroup meeting Birth Spacing and Adverse Pregnancy Outcomes, in Washington, DC.
Hutcheon JA, Nelson HD, Stidd R, Moskosky S, Ahrens KA. Short interpregnancy intervals and adverse maternal outcomes in high‐resource settings: An updated systematic review. Paediatr Perinat Epidemiol. 2019;33:O48–O59. 10.1111/ppe.12518
Funding information
This product was supported, in part, by contracts between the Office of Population Affairs and Atlas Research, LLC [# HHSP233201450040A].
REFERENCES
- 1. Report of a WHO Technical Consultation on Birth Spacing: Geneva, Switzerland 13‐15 June 2005. Department of Reproductive Health and Research (RHR). Geneva, Switzerland: World Health Organization; 2006. http://apps.who.int/iris/bitstream/10665/69855/1/WHO_RHR_07.1_eng.pdf. Accessed 15 March 2018.
- 2. Conde‐Agudelo A, Rosas‐Bermudez A, Kafury‐Goeta AC. Birth spacing and risk of adverse perinatal outcomes: a meta‐analysis. J Am Med Assoc. 2006;295:1809‐1823. [DOI] [PubMed] [Google Scholar]
- 3. Conde‐Agudelo A, Rosas‐Bermudez A, Kafury‐Goeta AC. Effects of birth spacing on maternal health: a systematic review. Am J Obstet Gynecol. 2007;196:297‐308. [DOI] [PubMed] [Google Scholar]
- 4. Conde‐Agudelo A, Rosas‐Bermudez A, Castano F, Norton MH. Effects of birth spacing on maternal, perinatal, infant, and child health: a systematic review of causal mechanisms. Stud Fam Plann. 2012;43:93‐114. [DOI] [PubMed] [Google Scholar]
- 5. Dewey KG, Cohen RJ. Does birth spacing affect maternal or child nutritional status? A systematic literature review. Matern Child Nutr. 2007;3:151‐173. [DOI] [PMC free article] [PubMed] [Google Scholar]
- 6. Institute of Medicine . Clinical Practice Guidelines We Can Trust. Washington DC: The National Academies Press; 2011. http://www.nap.edu/catalog.php?record_id=13058. [Google Scholar]
- 7. Ahrens KA, Nelson HD, Stidd R, Moskosky S, Hutcheon JA. Short interpregnancy intervals and adverse perinatal outcomes in high‐resource settings: an updated systematic review. Paediatr Perinat Epidemiol. 2018, In press. [DOI] [PMC free article] [PubMed] [Google Scholar]
- 8. Procedure Manual . U.S. Preventive Services Task Force. https://www.uspreventiveservicestaskforce.org/Page/Name/procedure-manual. Accessed 29 May 2018.
- 9. Nelson H. Systematic Reviews to Answer Health Care Questions. Philadelphia, PA: Lippincott Williams & Wilkins; 2014. [Google Scholar]
- 10. United Nations Human Development Index , 2015. New York, NY: United Nations; 2015. http://hdr.undp.org/en/composite/HDI. Accessed 21 March 2018.
- 11. Shipp TD, Zelop CM, Repke JT, Cohen A, Lieberman E. Interdelivery interval and risk of symptomatic uterine rupture. Obstet Gynecol. 2001;97:175‐177. [DOI] [PubMed] [Google Scholar]
- 12. Basso O, Christensen K, Olsen J. Higher risk of pre‐eclampsia after change of partner. An effect of longer interpregnancy intervals? Epidemiology. 2001;12:624‐629. [DOI] [PubMed] [Google Scholar]
- 13. Trogstad LI, Eskild A, Magnus P, Samuelsen SO, Nesheim BI. Changing paternity and time since last pregnancy; the impact on pre‐eclampsia risk. A study of 547 238 women with and without previous pre‐eclampsia. Int J Epidemiol. 2001;30:1317‐1322. [DOI] [PubMed] [Google Scholar]
- 14. Huang WH, Nakashima DK, Rumney PJ, Keegan KA Jr, Chan K. Interdelivery interval and the success of vaginal birth after cesarean delivery. Obstet Gynecol. 2002;99:41‐44. [DOI] [PubMed] [Google Scholar]
- 15. Skjaerven R, Wilcox AJ, Lie RT. The interval between pregnancies and the risk of preeclampsia. N Engl J Med. 2002;346:33‐38. [DOI] [PubMed] [Google Scholar]
- 16. Bujold E, Mehta SH, Bujold C, Gauthier RJ. Interdelivery interval and uterine rupture. Am J Obstet Gynecol. 2002;187:1199‐1202. [DOI] [PubMed] [Google Scholar]
- 17. Getahun D, Oyelese Y, Salihu HM, Ananth CV. Previous cesarean delivery and risks of placenta previa and placental abruption. Obstet Gynecol. 2006;107:771‐778. [DOI] [PubMed] [Google Scholar]
- 18. Zhu BP, Grigorescu V, Le T, et al. Labor dystocia and its association with interpregnancy interval. Am J Obstet Gynecol. 2006;195:121‐128. [DOI] [PubMed] [Google Scholar]
- 19. Sturchler D, Menegoz F, Daling J. Reproductive history and intrapartum fever. Gynecol Obstet Invest. 1986;21:182‐186. [DOI] [PubMed] [Google Scholar]
- 20. Wax JR, Seiler A, Horowitz S, Ingardia CJ. Interpregnancy interval as a risk factor for placenta accreta. Conn Med. 2000;64:659‐661. [PubMed] [Google Scholar]
- 21. Mostello D, Catlin TK, Roman L, Holcomb WL Jr, Leet T. Preeclampsia in the parous woman: who is at risk? Am J Obstet Gynecol. 2002;187:425‐429. [DOI] [PubMed] [Google Scholar]
- 22. Esposito MA, Menihan CA, Malee MP. Association of interpregnancy interval with uterine scar failure in labor: a case‐control study. Am J Obstet Gynecol. 2000;183:1180‐1183. [DOI] [PubMed] [Google Scholar]
- 23. Kangatharan C, Labram S, Bhattacharya S. Interpregnancy interval following miscarriage and adverse pregnancy outcomes: systematic review and meta‐analysis. Hum Reprod Update. 2017;23:221‐231. [DOI] [PubMed] [Google Scholar]
- 24. Zhu BP, Rolfs RT, Nangle BE, Horan JM. Effect of the interval between pregnancies on perinatal outcomes. N Engl J Med. 1999;340:589‐594. [DOI] [PubMed] [Google Scholar]
- 25. US Preventive Services Task Force, Appendix VI . Criteria for assessing internal validity of individual studies. https://www.uspreventiveservicestaskforce.org/Page/Name/appendix-vi-criteria-for-assessing-internal-validity-of-individual-studies. Accessed 24 May 2018.
- 26. US Preventive Services Task Force, Appendix VII . Criteria for assessing external validity (generalizability) of individual studies. https://www.uspreventiveservicestaskforce.org/Page/Name/appendix-vii-criteria-for-assessing-external-validity-generalizability-of-individual-studies. Accessed 24 May 2018.
- 27. Appareddy S, Pryor J, Bailey B. Inter‐pregnancy interval and adverse outcomes: evidence for an additional risk in health disparate populations. J Matern Fetal Neonatal Med. 2017;30:2640‐2644. [DOI] [PubMed] [Google Scholar]
- 28. Sandström A, Cnattingius S, Wikström AK, Stephansson O. Labour dystocia‐risk of recurrence and instrumental delivery in following labour‐a population‐based cohort study. Br J Obstet Gynaecol. 2012;119:1648‐1656. [DOI] [PubMed] [Google Scholar]
- 29. Davis EM, Babineau DC, Wang X, et al. Short inter‐pregnancy intervals, parity, excessive pregnancy weight gain and risk of maternal obesity. Matern Child Health J. 2014;18:554‐562. [DOI] [PMC free article] [PubMed] [Google Scholar]
- 30. Hanley GE, Hutcheon JA, Kinniburgh BA, Lee L. Interpregnancy interval and adverse pregnancy outcomes: an analysis of successive pregnancies. Obstet Gynecol. 2017;129:408‐415. [DOI] [PubMed] [Google Scholar]
- 31. Blumenfeld YJ, Baer RJ, Druzin ML, et al. Association between maternal characteristics, abnormal serum aneuploidy analytes, and placental abruption. Am J Obstet Gynecol. 2014;211:144.e141‐144.e149. [DOI] [PubMed] [Google Scholar]
- 32. Stamilio DM, DeFranco E, Paré E, et al. Short interpregnancy interval: risk of uterine rupture and complications of vaginal birth after cesarean delivery. Obstet Gynecol. 2007;110:1075‐1082. [DOI] [PubMed] [Google Scholar]
- 33. Stommel M, Schoenborn CA. Accuracy and usefulness of BMI measures based on self‐reported weight and height: findings from the NHANES & NHIS 2001‐2006. BMC Public Health. 2009;9:421. [DOI] [PMC free article] [PubMed] [Google Scholar]
- 34. Martin J, Wilson EC, Osterman MK, Saadi EW, Sutton SR, Hamilton BE. Assessing the quality of medical and health data from the 2003 birth certificate revision: results from two states. Natl Center Health Stat. 2013;62:1‐19. [PubMed] [Google Scholar]
- 35. Ventura SJ. The U.S. National vital statistics system: transitioning into the 21st century, 1990‐2017. National Center for Health Statistics. Vital Health Stat 1(62). 2018. https://www.cdc.gov/nchs/data/series/sr_01/sr01_062.pdf. Accessed 5 April 2018. [PubMed]
- 36. Norton ME, Jelliffe‐Pawlowski LL, Currier RJ. Chromosome abnormalities detected by current prenatal screening and noninvasive prenatal testing. Obstet Gynecol. 2014;124:979‐986. [DOI] [PubMed] [Google Scholar]
- 37. Kuppermann M, Gates E, Washington AE. Racial‐ethnic differences in prenatal diagnostic test use and outcomes: preferences, socioeconomics, or patient knowledge? Obstet Gynecol. 1996;87:675‐682. [DOI] [PubMed] [Google Scholar]
- 38. Rowe RE, Garcia J, Davidson LL. Social and ethnic inequalities in the offer and uptake of prenatal screening and diagnosis in the UK: a systematic review. Public Health. 2004;118:177‐189. [DOI] [PubMed] [Google Scholar]
- 39. Klebanoff MA. Interpregnancy interval and pregnancy outcomes: causal or not? Obstet Gynecol. 2017;129:405‐407. [DOI] [PubMed] [Google Scholar]
- 40. Klebanoff MA. The interval between pregnancies and the outcome of subsequent births. N Engl J Med. 1999;340:643‐644. [DOI] [PubMed] [Google Scholar]
- 41. Onyango AW, Nommsen‐Rivers L, Siyam A, et al. Post‐partum weight change patterns in the WHO Multicentre Growth Reference Study. Matern Child Nutr. 2011;7:228‐240. [DOI] [PMC free article] [PubMed] [Google Scholar]
- 42. Dicle O, Kucukler C, Pirnar T, Erata Y, Posaci C. Magnetic resonance imaging evaluation of incision healing after cesarean sections. Eur Radiol. 1997;7:31‐34. [DOI] [PubMed] [Google Scholar]
- 43. England L, Kotelchuck M, Wilson HG, et al. Estimating the recurrence rate of gestational diabetes mellitus (GDM) in Massachusetts 1998‐2007: methods and findings. Matern Child Health J. 2015;19:2303‐2313. [DOI] [PMC free article] [PubMed] [Google Scholar]
- 44. Hoff GL, Cai J, Okah FA, Dew PC. Pre‐pregnancy overweight status between successive pregnancies and pregnancy outcomes. J Womens Health. 2009;18:1413‐1417. [DOI] [PubMed] [Google Scholar]
- 45. Helle S, Brommer JE, Pettay JE, Lummaa V, Enbuske M, Jokela J. Evolutionary demography of agricultural expansion in preindustrial northern Finland. Proc Biol Sci. 2014;281:20141559. [DOI] [PMC free article] [PubMed] [Google Scholar]
- 46. Al‐Zirqi I, Daltveit AK, Forsen L, Stray‐Pedersen B, Vangen S. Risk factors for complete uterine rupture. Am J Obstet Gynecol. 2017;216:165.e161‐165.e165. [DOI] [PubMed] [Google Scholar]
- 47. Barger MK, Nannini A, Weiss J, et al. Severe maternal and perinatal outcomes from uterine rupture among women at term with a trial of labor. J Perinatol. 2012;32:837‐843. [DOI] [PubMed] [Google Scholar]
- 48. Bujold E, Gauthier RJ. Risk of uterine rupture associated with an interdelivery interval between 18 and 24 months. Obstet Gynecol. 2010;115:1003‐1006. [DOI] [PubMed] [Google Scholar]
- 49. Bujold E, Goyet M, Marcoux S, et al. The role of uterine closure in the risk of uterine rupture. Obstet Gynecol. 2010;116:43‐50. [DOI] [PubMed] [Google Scholar]
- 50. Coghill AE, Hansen S, Littman AJ. Risk factors for eclampsia: a population‐based study in Washington State, 1987‐2007. Am J Obstet Gynecol. 2011;205:553.e551‐553.e557. [DOI] [PubMed] [Google Scholar]
- 51. Mostello D, Kallogjeri D, Tungsiripat R, Leet T. Recurrence of preeclampsia: effects of gestational age at delivery of the first pregnancy, body mass index, paternity, and interval between births. Am J Obstet Gynecol. 2008;199:55.e51‐55.e57. [DOI] [PubMed] [Google Scholar]
- 52. Ananth CV, Skjaerven R, Klunssoyr K. Change in paternity, risk of placental abruption and confounding by birth interval: a population‐based prospective cohort study in Norway, 1967‐2009. BMJ Open. 2015;5:e007023. [DOI] [PMC free article] [PubMed] [Google Scholar]
- 53. Gurol‐Urganci I, Cromwell DA, Edozien LC, et al. Risk of placenta previa in second birth after first birth cesarean section: a population‐based study and meta‐analysis. BMC Pregnancy Childbirth. 2011;11:95. [DOI] [PMC free article] [PubMed] [Google Scholar]
- 54. Holmes HJ, Lo JY, McIntire DD, Casey BM. Prediction of diabetes recurrence in women with class A1 (diet‐treated) gestational diabetes. Am J Perinatol. 2010;27:47‐52. [DOI] [PubMed] [Google Scholar]
- 55. Deen ME, Ruurda LG, Wang J, Dekker GA. Risk factors for preeclampsia in multiparous women: primipaternity versus the birth interval hypothesis. J Matern Fetal Neonatal Med. 2006;19:79‐84. [DOI] [PubMed] [Google Scholar]
- 56. Khambalia AZ, Ford JB, Nassar N, Shand AW, McElduff A, Roberts CL. Occurrence and recurrence of diabetes in pregnancy. Diabet Med. 2013;30:452‐456. [DOI] [PubMed] [Google Scholar]
- 57. Wallace ME, Harville EW. Predictors of healthy birth outcome in adolescents: a positive deviance approach. J Pediatr Adolesc Gynecol. 2012;25:314‐321. [DOI] [PMC free article] [PubMed] [Google Scholar]
- 58. Bowman ZS, Manuck TA, Eller AG, Simons M, Silver RM. Risk factors for unscheduled delivery in patients with placenta accreta. Am J Obstet Gynecol. 2014;210:241.e241‐241.e246. [DOI] [PubMed] [Google Scholar]
- 59. Bertozzi S, Londero AP, Salvador S, et al. Influence of the couple on hypertensive disorders during pregnancy: a retrospective cohort study. Pregnancy Hypertens. 2011;1:156‐163. [DOI] [PubMed] [Google Scholar]
- 60. Van Oostwaard MF, Langenveld J, Schuit E, et al. Prediction of recurrence of hypertensive disorders of pregnancy in the term period, a retrospective cohort study. Pregnancy Hypertens. 2014;4:194‐202. [DOI] [PubMed] [Google Scholar]
- 61. Wendt A, Gibbs CM, Peters S, Hogue CJ. Impact of increasing inter‐pregnancy interval on maternal and infant health. Paediatr Perinat Epidemiol. 2012;26(Suppl 1):239‐258. [DOI] [PMC free article] [PubMed] [Google Scholar]
- 62. Brown G, Allen L, Torkelson A. Direct patient interventions that can reduce maternal mortality in developing countries: a systematic review. Fam Med. 2013;45:550‐557. [PubMed] [Google Scholar]
- 63. Cormick G, Betran AP, Ciapponi A, Hall DR, Hofmeyr GJ. Inter‐pregnancy interval and risk of recurrent pre‐eclampsia: systematic review and meta‐analysis. Reprod Health. 2016;13:83. [DOI] [PMC free article] [PubMed] [Google Scholar]
- 64. Ahrens KA, Hutcheon JA. Optimal birth spacing: what can we measure and what do we want to know? Paediatr Perinat Epidemiol. 2018;32:149‐151. [DOI] [PubMed] [Google Scholar]
Associated Data
This section collects any data citations, data availability statements, or supplementary materials included in this article.
Supplementary Materials