Summary
Background
The incidence of basal cell carcinoma (BCC) is increasing and the costs for care rising. Therefore, the need for simplified and cost‐effective treatment choices is substantial. Aberrant signalling in several pathways, induced by ultraviolet radiation, is of importance in the development of BCC. Alterations in tumour metabolic activity are part of general carcinogenesis; however, these alterations are only partially recognized in skin cancer.
Objectives
To study expression profiles in BCCs compared with individually matched nontumour skin, with a focus on finding differences associated with tumour metabolism.
Materials and methods
Gene expression in biopsies from BCCs (n = 14) compared with biopsies from nontumour gluteal skin was analysed with microarrays (n = 4 + 4) and/or quantitative real‐time polymerase chain reaction (qPCR, n = 14 + 14). Protein expression and localization was assessed using immunohistochemistry (IHC) in formalin‐fixed and paraffin‐embedded BCC samples.
Results
Microarray analysis revealed increased expression of the amino acid transporters SLC7A5, SLC7A7 and SLC7A8 as well as the cytosolic enzyme tryptophan 2,3‐dioxygenase (TDO) 2 in BCC. Higher expression of SLC7A5 (P < 0·001), SLC7A8 (P < 0·001) and TDO2 (P = 0·002), but not SLC7A7 (P = 0·50), was confirmed by qPCR, and IHC demonstrated correlating tumour cell protein expression of SLC7A5 and SLC7A8. Protein expression of SLC7A7 was observed in the stratum granulosum, and TDO2 in immune cells.
Conclusions
This study highlights the upregulation of SLC7A5, SLC7A8 and TDO2 in BCC compared with nontumour skin. Our findings imply that amino acid transporters may be further explored as potential targets for future medical treatment.
Short abstract
What's already known about this topic?
The incidence of basal cell carcinoma (BCC) is increasing and consequently also the costs of care.
The transport and metabolism of amino acids are often altered in tumours although the knowledge of whether this applies to BCCs is limited.
What does this study add?
Alterations of amino acid transporters SLC7A5 and SLC7A8 and the cytosolic enzyme TDO2 is suggested in BCC and are possible potential targets for treatment.
SLC7A7 (transporter of e.g. lysine) is expressed in the stratum granulosum of normal epidermis and may be involved in the cornification process.
What is the translational message?
We have found tumour‐specific changes in proteins involved in nutrient transport and metabolism.
These changes may be of importance for carcinogenesis and should be explored further for future drug development.
Linked Comment: O’Shaughnessy. Br J Dermatol 2019; 180:16–17.
Plain language summary available online
Basal cell carcinoma (BCC) is the most common type of skin cancer and the incidence is increasing worldwide.1 The tumours generally grow slowly with limited soft tissue invasion.2 Metastasizing BCCs are rare but the tumours occasionally grow in a local invasive manner with destruction of bone and cartilage.3 Due to rising costs of care, BCC is becoming a global public health problem and the need for cost‐effective noninvasive treatment choices is substantial.4
The mechanism for BCC carcinogenesis is only partially identified, although DNA damage following ultraviolet radiation (UVR) exposure (mainly UVB) is widely accepted as a fundamental cause of most skin cancers. UVR is associated with aberrations in multiple signalling pathways that regulate DNA repair, metabolism, checkpoint signalling and proliferation.5 Alteration in the Hedgehog signalling pathway, with frequent mutations of genes in the patched gene family (e.g. PTCH1), sonic hedgehog (SHH) and/or smoothened (SMO), has been identified.6, 7 These findings have led to the development of new target drugs such as the smoothened receptor (SMO) inhibitor vismodegib, which has improved the treatment of metastasizing BCC.8
Altered metabolic activity in tumours mainly involves uptake and turnover of essential nutrients for the survival of tumour cells. Amino acids are fundamental building blocks in structural maintenance and are components of cell signalling.9 Several enzymes and membrane transporters participate in metabolic changes favouring tumour growth, such as indoleamine 2,3‐dioxygenase (IDO), which degrades the essential amino acid tryptophan. Expression of IDO promotes immune evasion and angiogenesis, which is a reason that IDO inhibitors are being evaluated in cancers such as metastatic melanoma.10, 11 The large neutral amino acid transporter small subunit 1/solute carrier family 7 member 5 (LAT1/SLC7A5) has been described in various malignancies and with higher expression in BCC compared with normal epidermis.12 As upregulation promotes tumour cell proliferation and inhibition leads to decreased growth, LAT1/SLC7A5 is a promising target for cancer therapy.13, 14 In this study, by comparing expression profiles between BCC tumours and nontumour skin tissue, we aimed at exploring metabolism‐related factors that may serve as future targets for inhibitor drugs. We conducted microarray analysis and observed tumour upregulation of tryptophan 2,3‐dioxygenase (TDO2), a gene with a similar function as IDO1, as well as upregulation of the genes SLC7A5, SLC7A7 and SLC7A8, all involved in tryptophan transport. Thus, the study emphasis is on these four candidate genes.
Materials and methods
Patient recruitment and tissue handling
Fourteen patients, seven men and seven women, were included in the present cohort study. All patients had been diagnosed with BCC at the Department of Dermatology, Örebro University Hospital, Örebro, Sweden. Patients with recurrent tumours or tumours from where biopsies had already been taken for diagnostic purposes were excluded from the study. The patients’ ages ranged from 64 to 92 years and the size of the tumours varied between 8 and 20 mm in diameter. The tumours were excised from the face (n = 7) and the trunk (n = 7). The histopathological evaluation of the included tumours showed nodular growth (n = 11), mixed superficial/nodular (n = 1) and more aggressive growth (n = 2) patterns. At the time of excision, a 4‐mm punch biopsy was taken from the centre of the tumour as well as from gluteal skin (nontumour tissue) from the same patient. All biopsies (n = 28) were immediately put in Allprotect Tissue Reagent (Qiagen, Solna, Sweden) at room temperature (RT) and then transferred to –80 °C storage. Control skin from two healthy donors was taken in conjunction with surgical removal of excess skin after weight loss. Two biopsies were taken from each donor's abdominal skin, then formalin‐fixed and paraffin‐embedded (FFPE) according to clinical protocols. The donors’ identities were decoded and no personal information was recorded.
The study was approved by the local Ethics Committee in Uppsala, Sweden (Uppsala/Örebro no. 2011/242) with the requirement of written consent from all the participants.
RNA extraction
RNA was extracted using the RNeasy Microarray Tissue Mini Kit (Qiagen) according to the manufacturer's instructions. RNA concentration and absorbance ratios (260/280 and 260/230) were measured using the NanoDrop Spectrophotometer ND‐1000 (NanoDrop Technologies, Thermo Fisher Scientific, Wilmington, DE, U.S.A.). RNA was further controlled by determining the RNA integrity number (RIN) of each sample using the Agilent RNA 6000 Nano Kit for the 2100 Bioanalyzer (Agilent Technologies, Santa Clara, CA, U.S.A.). The RNA was stored at –80 °C.
Microarray data acquisition
Eight samples (tumour n = 4, nontumour n = 4) were considered to have acceptable RNA quality for microarray analysis (RIN > 6·5, 260/280 and 260/230 > 1·8). From each sample, 25 ng of total RNA was used for the generation of amplified, fluorescent complementary RNA (cRNA), labelled with cyanine dye (Cy3) with the one‐color Low Input Quick Amp Labeling Kit (Agilent Technologies). The cRNA was purified using the RNeasy Mini Kit (Qiagen), and hybridized to SurePrint G3 Human Gene Expression 8x60K v2 Microarrays (Agilent Technologies) for 17 h at 65 °C before the fluorescent pattern was read with a G2565CA Microarray Scanner (Agilent Technologies). Analysis of the raw microarray images was performed using Agilent Feature Extraction software v10·7·3·1 (Agilent Technologies).
Quantitative real‐time polymerase chain reaction
For quantitative real‐time polymerase chain reaction (qPCR) analysis, 100 ng of RNA from tumour and nontumour tissues (n = 28) was converted to complementary DNA (cDNA) using the SuperScript IV First‐Strand Synthesis System (Invitrogen, Thermo Fisher Scientific) run in triplicate reactions and pooled into a total volume of 60 μL. Expression of the target genes SLC7A5, SLC7A7, SLC7A8 and TDO2 as well as the reference genes ABL1, TOP1 and ACTB were measured with qPCR using TaqMan® Gene Expression Assays (Table 1; Applied Biosystems, Foster City, CA, U.S.A.) and the TaqMan® Fast Advanced Master Mix (Applied Biosystems). The cDNA samples (5 ng μL−1) were set in triplicate in 96‐well plates and in a final volume of 20 μL. The plates were run, using the 7900HT Fast Real‐Time PCR system (Applied Biosystems), at 50 °C for 2 min, 95 °C for 20 s and then 95 °C for 1 s followed by 60 °C for 20 s, repeated for 40 cycles. The quantification cycle (Cq) was set automatically. Expression of the four target genes was normalized against the mean value of the three reference genes. The fold change (FC) gene expression (tumour vs. nontumour tissue) was calculated using the 2–ΔΔCq method.15
Table 1.
Immunohistochemistry (IHC) staining of proteins in tumours, including the results from evaluation (H‐scores) and information of the specific TaqMan gene expression assays used in quantitative real‐time polymerase chain reaction (qPCR) analysis
| SLC7A5 | SLC7A7 | SLC7A8 | TDO2 | |
|---|---|---|---|---|
| IHC | ||||
| Antibody | ab208776 | HPA036227 | UM500058 | PA5‐42759 |
| Species | Rabbit monoclonal | Rabbit polyclonal | Mouse monoclonal | Rabbit polyclonal |
| Distributor | Abcam, Cambridge, U.K. | Sigma‐Aldrich, St Louis, MO, U.S.A. | Origene, Rockville, MD, U.S.A. | Thermo Fisher, Waltham, MA, U.S.A. |
| Dilution | 1 : 500 | 1 : 135 | 1 : 100 | 1 : 500 |
| Incubation time | 1 h (RT) | 30 min (RT) | 30 min (RT) | 30 min (RT) |
| qPCR | ||||
| TaqMan assay IDa | Hs01001183_m1 | Hs00374418_m1 | Hs00794796_m1 | Hs00194611_m1 |
RT, room temperature.
TaqMan assay ID for the reference genes: ABL1 (Hs01104728_m1), TOP1 (Hs00243257_m1) and ACTB (Hs99999903_m1) (Applied Biosystems, Foster City, CA, U.S.A.).
Immunohistochemistry
Blocks of FFPE tissue were available from the patients’ tumours only and not from nontumour tissue. Protein expression of SLC7A5, SLC7A7, SLC7A8 and TDO2 was assessed using immunohistochemistry (IHC). For reference, protein expression was also assessed in FFPE abdominal skin from healthy donors. All antibodies were optimized for ideal dilution and incubation time (Table 1).
In brief, 4‐μm sections of FFPE tissue were mounted onto microscope glass slides, oven‐dried at 60 °C for 1 h, deparaffinized and rehydrated in xylene, decreasing concentration series of ethanol and finally placed in deionized water. Subsequently, the slides were placed in DIVA decloaker buffer, pH 6 (Biocare Medical, Walnut Creek, CA, U.S.A.) and heat‐induced epitope retrieval was performed in a decloaking chamber (Biocare Medical) for 10 min at 110 °C. Staining was carried out using the automated slide stainer IntelliPATH FLXTM (Biocare Medical) and the MACH 1 Universal HRP‐Polymer Detection system (Biocare Medical) with Betazoid DAB chromogen according to the manufacturer's instructions. After counterstaining with Mayer's haematoxylin (5 min, RT), the tissues were dehydrated in increasing concentrations of ethanol and finally xylene prior to mounting with Pertex® mounting medium. Along all runs tissues with known protein expression were included as positive and negative staining controls, as well as the healthy donor tissues.
Evaluation of protein expression
The slides were scanned using the Pannoramic 250 Flash II (3DHistech Ltd, Budapest, Hungary) and the digital images analysed using the software CaseViewer (3DHistech Ltd). In each tumour, 10 annotations with sizes corresponding to × 40 magnification vision fields were placed randomly in areas with BCC and the staining intensity in 20 consecutive tumour cells was assessed. The staining was graded as 0 (negative), 1 (weak), 2 (moderate) or 3 (strong) and the H‐score algorithm was used for estimation of protein expression (1 × % cells with staining grade 1) + (2 × % cells with staining grade 2) + (3 × % cells with staining grade 3) resulting in a number of 0–300. The final H‐scores were based on consensus scores from two separate observers (S.P. and E.T.) who graded the staining individually. Protein expression in skin from healthy donors was recorded descriptively only.
Statistical data analysis
The raw microarray data was normalized using the 75th percentile shift and baseline adjusted to median prior to statistical analysis. The detected entities were filtered on normality by the Shapiro–Wilks test (P < 0·05). Entities that were expressed differentially between tumour and nontumour tissues were retrieved based on statistical significance (corrected P ≤ 0·05) using a moderated t‐test with the Benjamini–Hochberg multiple testing correction method. Aiming to leave out entities with lower biological significance, the level for absolute FC was set to FC ≥ 5·0. The differentially expressed genes (DEGs) were further analysed through Gene Ontology (GO) term enrichment (P ≤ 0·1). The microarray data was analysed using GeneSpring v.14·9 (Agilent Technologies).
In order to perform statistical calculations of qPCR data of SLC7A5, SLC7A7, SLC7A8 and TDO2 gene expression, all 2–∆Cq values were logarithmized. Gaussian distribution of the log 2–ΔCq values was tested using the Shapiro–Wilks test and normality was assumed for P > 0·05. Differences in gene expression (log 2–ΔCq values) between tumour and nontumour tissues were calculated using the paired t‐test. For graphical visualization of gene expression, the log 2–ΔCq values were transformed into z‐scores where a z‐score of 0 represents the mean and z‐scores of ± 1 equals 1 SD from the mean. Spearman's correlation coefficient (ρ) for nonparametric data was used as a measure of correlation between gene expression (log 2–ΔCq value) and protein expression (H‐score) for each patient's tumour tissue. A simple linear regression model was used to estimate R2 as well as the regression linear equation. P‐values ≤ 0·05 were considered as significant. All data analysis was performed using IBM SPSS Statistics v. 22·0 (IBM, Armonk, NY, U.S.A.) and GraphPad Prism v. 7·03 (GraphPad Software, La Jolla, CA, U.S.A.).
Results
Gene expression profile in basal cell carcinoma
The analysis of microarray data resulted in 58 341 detected entities, of which 58 306 remained after filtering on normality. A moderated t‐test (with Benjamini–Hochberg multiple testing correction) generated a list of 4864 entities that were differentially expressed in tumours compared with nontumour tissues (corrected P < 0·05). The list of entities was further filtered by using a threshold FC of ≥ 5·0 (1883 remaining, Table S1; see Supporting Information). After eliminating entities represented by long noncoding RNA and pseudogenes 1225, differentially expressed genes remained (Table S2; see Supporting Information). Of those, 669 DEGs were upregulated (FC ranging from +5·0 to +341·7) and 556 DEGs were downregulated (FC ranging from –5·0 to –256·8).
Among all 669 upregulated DEGs (FC > 5·0) were also members of Hedgehog and Wnt signalling (e.g. PTCH1, PTCH2, GLI1 and WNT5A). The 100 most upregulated DEGs (FC > 22) comprised matrix metalloproteinases (MMP1, MMP12, MMP11, MMP3 and MMP10), chemokines (e.g. CXCL9, CXCL13, CXCL10, CCL18, CXCL11), various cancer genes (e.g. SPP1, OLFM4) and genes involved in amino acid metabolism and membrane transport of solutes (e.g. TDO2, SLCO1A2, SLC6A1). Among the 100 most downregulated DEGs (FC > –15) were those associated with adipose tissue (eg. PLIN4, LEP, PLIN1, ADIPOQ) and inhibition of peptidases and proteinases (SERPINA12, TIMP4). Tables 2 and 3 present the top 25 most upregulated and downregulated genes including genes overlapping with results from other studies of BCC gene expression.16, 17, 18, 19, 20, 23 GO analysis presented 211 enriched terms (Table S3; see Supporting Information) and one of the top candidate terms was the term Plasma membrane part (corrected P < 10–8, GO:0044459), branching into Intrinsic component of plasma membrane (GO:0031226) and Plasma membrane region (GO:0098590). Among the genes enriched, within the latter GO term (Table S4; see Supporting Information), were the upregulated SLC7A5 (FC = 7·5), SLC7A7 (FC = 6·8) and SLC7A8 (FC = 12·3), solute carriers involved in amino acid transport across the cell membrane.
Table 2.
Genes with upregulation in BCC by microarray analysis. The curated list of DEGs includes genes selected through GO analysis, literature mining and on the basis of overlapping with results from other studies of BCC molecular signatures16, 17, 18, 19, 20, 23
| The 25 most upregulated genes | Curated DEGs | ||||
|---|---|---|---|---|---|
| Gene symbol | FC | Log 2 FC | Gene symbol | FC | Log 2 FC |
| IGLL5 | 341·7 | 8·4 | EDN2 | 64·1 | 6·0 |
| SOX11 | 177·0 | 7·5 | MYCN | 43·9 | 5·5 |
| CXCL9 | 146·9 | 7·2 | OLFM4 | 43·8 | 5·5 |
| ABCC12 | 139·7 | 7·1 | SLCO1A2 | 37·1 | 5·2 |
| PCDH8 | 135·7 | 7·1 | CHGA | 35·8 | 5·2 |
| CHRDL2 | 123·1 | 6·9 | CXCL11 | 35·6 | 5·2 |
| S100A7A | 108·6 | 6·8 | TDO2 | 35·3 | 5·1 |
| MMP1 | 106·1 | 6·7 | MMP11 | 31·2 | 5·0 |
| TCL6 | 101·6 | 6·7 | MMP3 | 25·8 | 4·7 |
| KRTAP17‐1 | 98·2 | 6·6 | SLC6A1 | 25·6 | 4·7 |
| HHIP | 93·8 | 6·6 | GLI1 | 24·2 | 4·6 |
| RBFOX3 | 83·7 | 6·4 | SH3GL3 | 23·4 | 4·5 |
| CASC9 | 83·6 | 6·4 | MMP10 | 22·4 | 4·5 |
| FBN3 | 83·6 | 6·4 | PTCH1 | 18·5 | 4·2 |
| HMGA2 | 81·3 | 6·3 | TRO | 18·3 | 4·2 |
| ADAMTS3 | 74·9 | 6·2 | MSR1 | 17·9 | 4·2 |
| CXCL13 | 74·8 | 6·2 | GPR161 | 17·6 | 4·1 |
| ERC2 | 73·9 | 6·2 | SLC39A14 | 16·1 | 4·0 |
| ALK | 72·0 | 6·2 | MDK | 13·8 | 3·8 |
| CXCL10 | 71·8 | 6·2 | VCAN | 12·6 | 3·7 |
| CCL18 | 70·9 | 6·1 | SLC7A8 | 12·3 | 3·6 |
| PNOC | 70·2 | 6·1 | CSPG4 | 12·0 | 3·6 |
| SPP1 | 70·0 | 6·1 | SLC16A3 | 11·9 | 3·6 |
| MMP12 | 68·4 | 6·1 | LRP8 | 11·2 | 3·5 |
| KIF12 | 66·6 | 6·1 | SHOX2 | 10·4 | 3·4 |
| DIO2 | 10·3 | 3·4 | |||
| PDGFA | 9·7 | 3·3 | |||
| PTCH2 | 8·9 | 3·2 | |||
| NINL | 8·8 | 3·1 | |||
| DUSP10 | 8·8 | 3·1 | |||
| SOX13 | 8·6 | 3·1 | |||
| SLC1A4 | 8·1 | 3·0 | |||
| HEPH | 8·0 | 3·0 | |||
| KRT16 | 8·0 | 3·0 | |||
| SLC7A5 | 7·5 | 2·9 | |||
| STMN1 | 7·4 | 2·9 | |||
| COL5A2 | 7·0 | 2·8 | |||
| SLC7A7 | 6·8 | 2·8 | |||
| TSPAN4 | 6·7 | 2·7 | |||
| EPCAM | 6·6 | 2·7 | |||
| CDH8 | 6·6 | 2·7 | |||
| CDH3 | 6·5 | 2·7 | |||
| TOP2A | 6·4 | 2·7 | |||
| LOXL2 | 6·4 | 2·7 | |||
| TUSC3 | 5·9 | 2·6 | |||
BCC, basal cell carcinoma; DEGs, differentially expressed genes; FC, fold change; GO, Gene Ontology.
Table 3.
Genes with downregulation in BCC by microarray analysis. The curated list of DEGs include genes selected through GO analysis, literature mining and on the basis of overlapping with results from other studies of BCC molecular signatures16, 17, 18, 19, 20, 23
| The 25 most downregulated genes | Curated DEGs | ||||
|---|---|---|---|---|---|
| Gene symbol | FC | Log 2 FC | Gene symbol | FC | Log 2 FC |
| PLIN4 | –256·8 | –8·0 | ADH1A | –29·7 | –4·9 |
| DCD | –250·3 | –8·0 | PRLR | –27·1 | –4·8 |
| LEP | –177·8 | –7·5 | SOX21 | –26·5 | –4·7 |
| PLIN1 | –163·9 | –7·4 | WNT16 | –25·5 | –4·7 |
| PIP | –134·5 | –7·1 | RBP4 | –24·9 | –4·6 |
| TMEM213 | –75·9 | –6·2 | MUCL1 | –24·8 | –4·6 |
| CA6 | –73·3 | –6·2 | FABP7 | –23·7 | –4·6 |
| SERPINA12 | –72·9 | –6·2 | ADH1B | –23·4 | –4·5 |
| ADIPOQ | –63·3 | –6·0 | TUSC8 | –22·2 | –4·5 |
| GDPD2 | –62·2 | –6·0 | FOXA1 | –21·9 | –4·5 |
| MYOC | –62·1 | –6·0 | CDHR4 | –20·9 | –4·4 |
| PSAPL1 | –52·3 | –5·7 | CDHR4 | –20·9 | –4·4 |
| SCGB1D1 | –51·5 | –5·7 | FOXP2 | –20·7 | –4·4 |
| HOXA‐AS3 | –49·5 | –5·6 | NOX1 | –18·4 | –4·2 |
| FA2H | –46·1 | –5·5 | TIMP4 | –18·1 | –4·2 |
| ACADL | –42·9 | –5·4 | ADH1C | –17·1 | –4·1 |
| SCGB1D2 | –42·9 | –5·4 | LAMB4 | –17·0 | –4·1 |
| CDHR1 | –41·5 | –5·4 | LIPK | –16·7 | –4·1 |
| SOX6 | –41·1 | –5·4 | TNMD | –15·9 | –4·0 |
| FABP4 | –38·3 | –5·3 | WNT3 | –15·9 | –4·0 |
| CHP2 | –37·9 | –5·2 | COBL | –14·5 | –3·9 |
| ISL1 | –37·5 | –5·2 | SPINK1 | –12·4 | –3·6 |
| MRAP | –36·9 | –5·2 | CLDN10 | –12·0 | –3·6 |
| CLDN3 | –36·8 | –5·2 | LIPE | –12·0 | –3·6 |
| HOXA9 | –36·7 | –5·2 | SLC2A4 | –11·9 | –3·6 |
| LIPH | –11·4 | –3·5 | |||
| ENDOU | –11·4 | –3·5 | |||
| EXPH5 | –11·1 | –3·5 | |||
| ERBB4 | –10·0 | –3·3 | |||
| AZGP1 | –9·5 | –3·2 | |||
| FCGBP | –9·3 | –3·2 | |||
| DMKN | –9·2 | –3·2 | |||
| ZBTB16 | –8·2 | –3·0 | |||
| TGFBR3 | –7·7 | –2·9 | |||
| GPR126 | –7·6 | –2·9 | |||
| AKR1C1 | –7·5 | –2·9 | |||
| CA12 | –7·4 | –2·9 | |||
| ABCC3 | –7·3 | –2·9 | |||
| NRG2 | –6·8 | –2·8 | |||
| C2CD2 | –6·6 | –2·7 | |||
| SLC25A48 | –6·1 | –2·6 | |||
| NRG4 | –6·1 | –2·6 | |||
| WNT4 | –5·9 | –2·6 | |||
| CRYAB | –5·9 | –2·6 | |||
| LPL | –5·2 | –2·4 | |||
BCC, basal cell carcinoma; DEGs, differentially expressed genes; FC, fold change; GO, Gene Ontology.
Gene expression of SLC7A5, SLC7A7, SLC7A8 and TDO2
The gene expression of SLC7A5, SLC7A7, SLC7A8 and TDO2 was further examined in all samples (tumours n = 14 with matched nontumour tissue n = 14) using qPCR. The genes SLC7A5 (P < 0·001), SLC7A8 (P < 0·001) and TDO2 (P = 0·002) were found to have higher expression in tumour tissues while SLC7A7 gene expression showed no difference in tumour compared with nontumour tissue (P = 0·50, Fig. 1). The median FC was as follows: for SLC7A5, 7·7 (min = 2·8, max = 24·1); for SLC7A7, 1·2 (min = 0·26, max = 8·0); for SLC7A8, 8·6 (min = 4·2, max = 21·5) and for TDO2, 7·6 (min = 0·37, max = 105·7).
Figure 1.
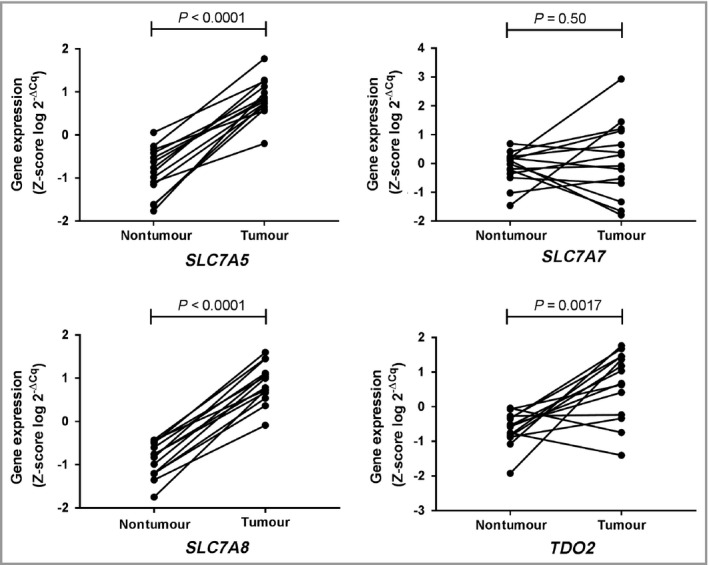
Expression of candidate genes selected from microarray data and validated using quantitative real‐time polymerase chain reaction analysis. The statistical differences in gene expression of SLC7A5,SLC7A7,SLC7A8 and TDO2 between basal cell carcinoma (n = 14) and individually matched nontumour tissues (gluteal skin, n = 14) were calculated using a paired t‐test.
Protein expression of SLC7A5, SLC7A7, SLC7A8 and TDO2
Protein expression was assessed in FFPE BCCs from 13 of the 14 individuals included in the study. The overall tissue staining for each protein was evaluated descriptively but grading of staining intensity (i.e. level of protein expression) was restricted to tumour cells. The H‐scores for each protein are shown in Figure 2.
Figure 2.
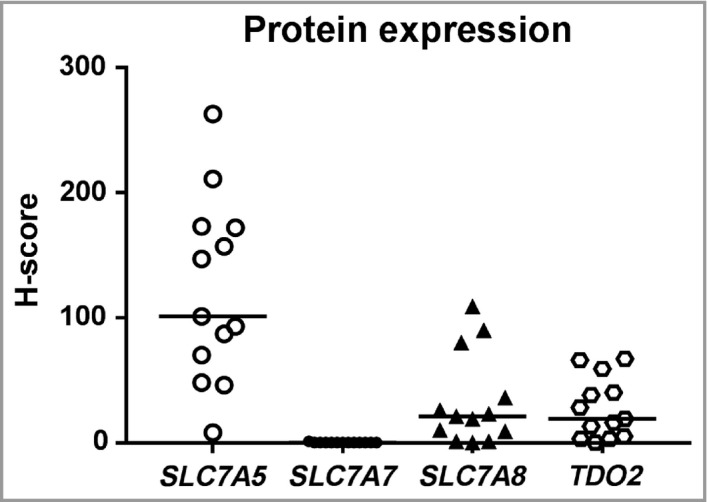
Distribution of H‐scores after evaluation of protein staining of SLC7A5, SLC7A7, SLC7A8 and TDO2. Horizontal bars indicate mean H‐score.
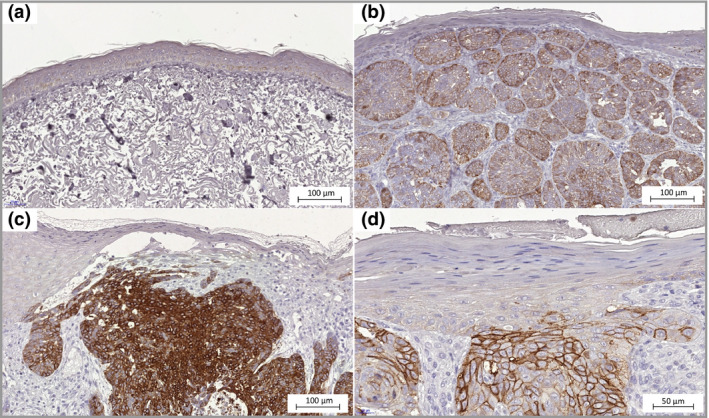
SLC7A5 protein expression (Fig. 3) in the BCC tissues was primarily located in the cell membranes and to some extent in the cytoplasm of tumour cells, with H‐scores varying between 8 and 263 (median H‐score = 101, Fig. 2). The staining was heterogeneous and tumour cells in the centre part of the BCC were generally more intensely stained than the palisading cells in the tumour margins. The epithelia close to the tumour areas was more stained than the epithelia in the periphery. Staining was also present in the sebaceous glands as well as in hair follicles closer to the apical part with weakened intensity deeper down in the hair follicle. In the samples of skin from healthy donors staining was almost absent in the epidermis.
Figure 3.
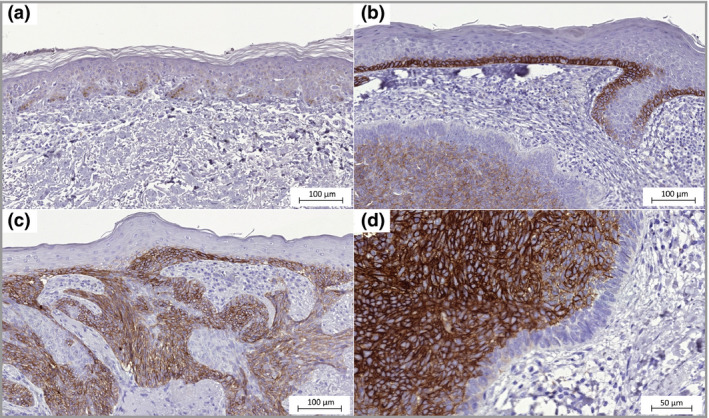
SLC7A5 expression in basal cell carcinoma. (a) Epidermis with normal appearance adjacent to the tumour, weak immunohistochemistry staining (× 20). (b) Epidermis directly above the tumour mass shows strong SLC7A5 staining (× 20). (c) The tumour is growing in a nodular and superficial pattern (× 20). (d) The inner mass of tumour cells with membrane staining and negative palisading cells (× 40).
The staining intensity of SLC7A7 and the fraction of stained cells in tumour areas, epithelia and follicular epithelia were generally low. However, strong membrane staining was observable in the stratum granulosum of the epidermis (Fig. 4). All but one patient's BCC showed no SLC7A7 protein expression in tumour cells, with H‐scores of 0 and 1 (median H‐score = 0, Fig. 2). The skin tissues from healthy donors showed strong staining in the stratum granulosum and were similar to the epidermis of tumour tissues.
Figure 4.
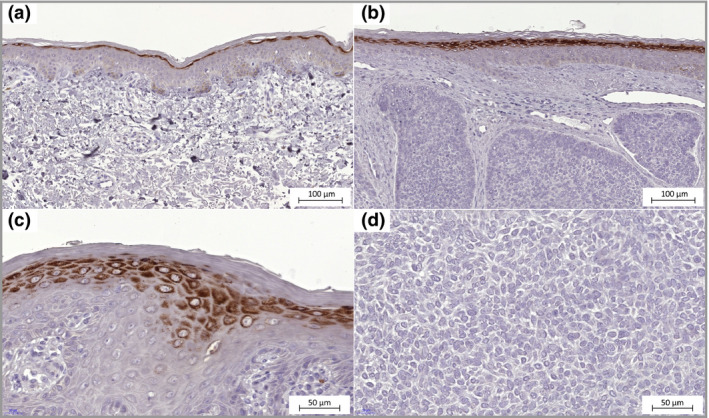
SLC7A7 expression in basal cell carcinoma. (a) Epidermis with normal appearance adjacent to the tumour, weak immunohistochemistry staining in basal cell layer and strong staining in the stratum granulosum cells (× 20). (b) Epidermis directly above the tumour mass shows strong SLC7A7 staining in stratum granulosum cells similar to normal cells (× 20). (c) Cells in the stratum granulosum with SLC7A7 protein expression in membrane and cytoplasm (× 40). (d) No SLC7A7 protein expression in tumour cells (× 40).
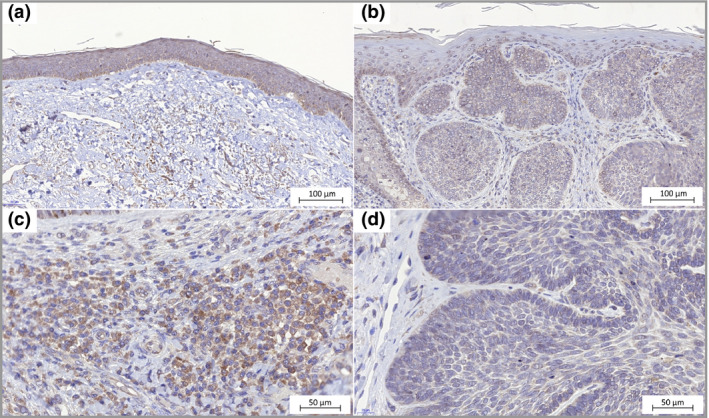
SLC7A8 protein expression was located in cell membranes and to some extent in cytoplasm, and presented with heterogeneity among tumour areas (Fig. 5). Although the overall SLC7A8 staining intensity in BCC was low with H‐scores between 0 and 109 (median H‐score = 21, Fig. 2), a stronger staining intensity was observed in the tumour cells than cells in epithelia and hair follicular epithelia. Strong staining was observed in the hair bulbs. There was no visible SLC7A8 staining in the epidermis taken from healthy donor skin.
Figure 5.
SLC7A8 expression in basal cell carcinoma. (a) Epidermis with normal appearance adjacent to the tumour, none‐to‐weak immunohistochemistry staining (× 20). (b) Epidermis directly above the tumour mass shows none‐to‐weak staining. The tumour cells seem to express SLC7A8 heterogeneously as they display various degrees of staining intensity (× 20). (c) Some tissues had areas of tumour cells with strong membrane and cytoplasmic staining (× 20). (d) Staining of SLC7A8 in membranes of tumour cells (× 40).
The staining intensity of TDO2 (Fig. 6) was generally low in the tumour cells with H‐scores of 0–67 (median H‐score = 19, Fig. 2) as well as in the follicular epithelia. There was a clearly visible, and for several cases even strong, staining in lymphocyte infiltrates, in the stroma in dermis and in sebaceous glandules. In the skin samples from healthy donors, the epithelial cells showed strong staining intensity.
Figure 6.
TDO2 expression in basal cell carcinoma. (a) Epidermis with normal appearance adjacent to the tumour shows weak immunohistochemistry staining (× 20). (b) Epidermis directly above the tumour mass shows none‐to‐weak staining. Stroma surrounding the masses of tumour cells shows immunoreactivity (× 20). (c) Immune cells with cytoplasmic TDO2 staining (× 40). (d) Staining of TDO2 in tumour cells (× 40).
Protein expression levels for SLC7A5, SLC7A7, SLC7A8 and TDO2 in abdominal skin from healthy donors are shown in Figure 7.
Figure 7.
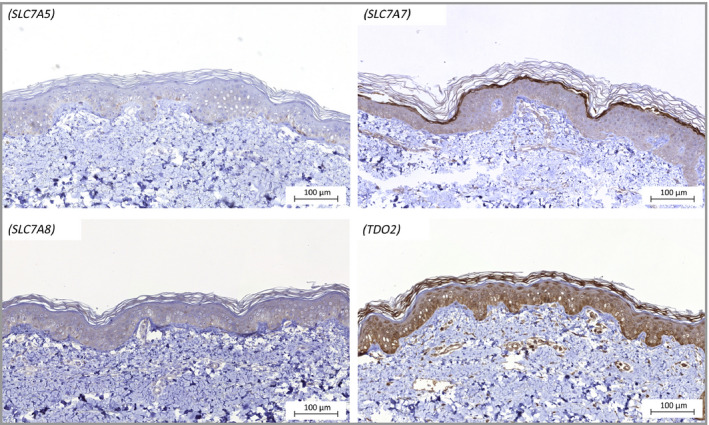
Representative micrographs of protein staining of SLC7A5, SLC7A7, SLC7A8 and TDO2 in abdominal skin from healthy donors.
Correlation between gene and protein expression in tumours
In order to evaluate whether higher gene expression in tumour tissues reflects higher amounts of protein, correlations between the log 2–ΔCq values and H‐scores were calculated. Higher gene expression of SLC7A5 and SLC7A8 correlated with higher protein expression (ρ = 0·64, P = 0·019 and ρ = 0·74, P = 0·004, respectively, Fig. 8). There were no relationships found between gene and protein expression of SLC7A7 (ρ = 0·08, P = 0·80) or TDO2 (ρ = 0·19, P = 0·54).
Figure 8.
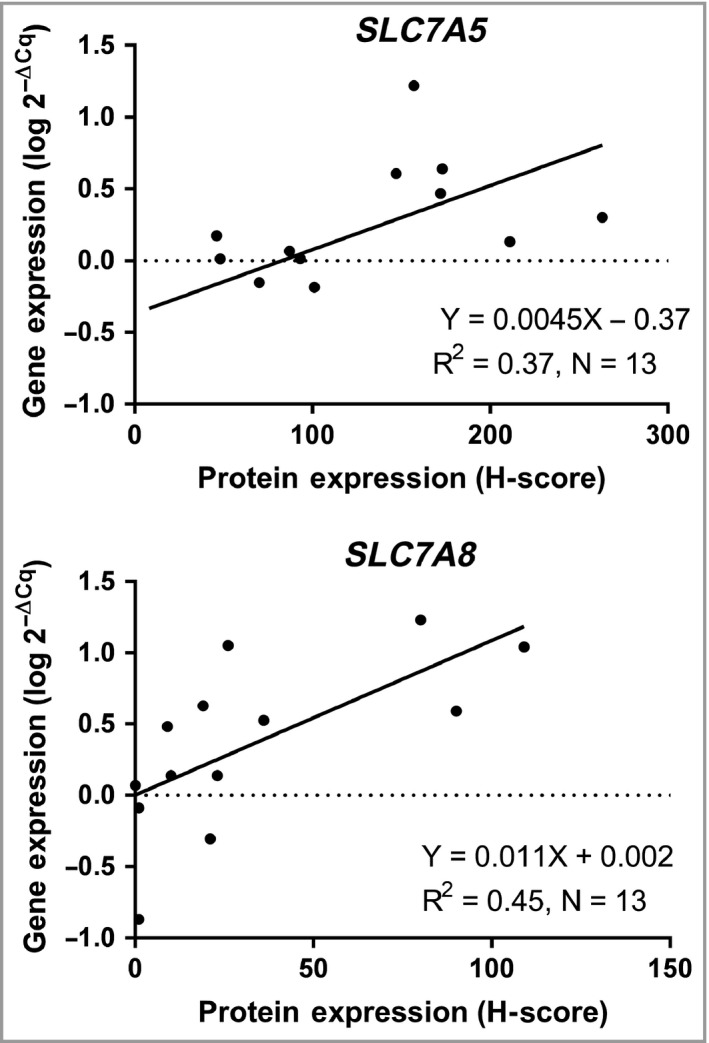
Estimation of R2 by linear regression and Spearman's correlation between basal cell carcinoma gene expression (log 2–ΔCq values) and the protein expression (H‐score) of SLC7A5 and SLC7A8.
Discussion
Aiming to identify factors that may be important in BCC carcinogenesis, we conducted gene expression analysis with a focus on amino acid metabolism and transport. Our results show that the genes SLC7A5, SLC7A8 and TDO2 are upregulated in BCC compared with individually matched nontumour tissue (gluteal skin).
Firstly, we performed microarray analysis and compared our results with those of other studies to evaluate the correspondence. Bonifas et al.20 conducted qPCR to analyse gene expression in BCC in comparison with normal skin and found upregulation of PTCH1, GLI1, HHIP, WNT5A and downregulation of WNT4. Heller et al.16 integrated microarray analysis with literature mining and reported genes that overlap those in other publications. According to their list of DEGs in BCC, several occur among our DEGs (e.g. upregulated MDK, DUSP10, TSPAN4, SLC7A8, TOP2A, SHOX2 and downregulated FABP4, ADH1B, ABCC3, LPL, COBL, TGFBR3).16, 17, 19 The gene coding for osteopontin (SPP1), a multifunctional protein involved in cancer development and with promising clinical utilization, was upregulated 70‐fold.21, 22, 23
Microarray analysis requires high‐quality RNA, and extraction from skin is generally difficult due to the high presence of RNases. We aimed at seeking differences between tumours and matched nontumour tissues (n = 14), and by matching thus minimizing the impact of variations between individuals. Only eight of 28 samples had RIN > 6·5 and 260/280 and 260/230 absorbance ratios > 1·8, which is the reason why the microarray data analysis was based on group‐wise differences between tumours (n = 4) and nontumour tissues (n = 4). Low study power was taken into consideration when processing data by using a stringent multiple correction method to adjust false‐discovery rates. The more classical approach of selecting biologically relevant DEGs is using an FC cut‐off point of 2, an arbitrary number not necessarily reflecting the most important changes as even small changes may be of relevance.24 As our data are restricted with the small number of patients and an assumption of heterogeneity among samples, we selected DEGs with FC ≥ 5·0 and made modest interpretations of the results. Despite study limitations, the DEGs with the highest FCs were both biologically relevant (e.g. MMPs and members of Hedgehog and Wnt signalling pathways) as well as in concordance with other studies of BCC gene expression.
Subsequently, in order to retrieve genes that fall into the focus of our research field and for restricting the number of DEGs, we conducted GO analysis. Our primary goal was to find DEGs involved in amino acid metabolism and transport across cellular membranes. Sorting on statistical significance, the top GO term was ‘Plasma membrane part’, branching further into ‘Plasma membrane region’ where several candidate genes were identified and selected for further validation (SLC7A5, SLC7A7, SLC7A8 and TDO2). Sequentially, the candidate genes were analysed using qPCR, a method allowing lower RNA quality compared with microarray analysis, given that each target gene expression is normalized against a set of (here, three) reference genes measured in that same individual sample.25 To confirm whether alterations in gene expression followed altered protein expression, we also performed IHC in corresponding FFPE BCCs. The grading of protein expression, or staining intensity, was restricted to tumour cells and generated H‐scores that were further correlated to gene expression. However, the expression of selected proteins was evaluated descriptively in abdominal skin from two healthy donors.
SLC7A5 and SLC7A8 code for LAT1 and LAT2, respectively. Both are Na+‐independent heteromeric amino acid transporters and associate with 4F2hc (SLC3A2) to be functional.26 SLC7A5 and SLC7A8 transport large neutral amino acids (e.g. tyrosine, tryptophan and alanine) across the cell membrane. Increased expression of SLC7A5 in tumours is suggested to be of importance for cell growth and survival26 and the effects of inhibitory drugs are being evaluated for cancer treatment.13, 14, 27 SLC7A8 is less well studied in cancer, but found to be overexpressed in neuroendocrine tumours.28 We found both SLC7A5 and SLC7A8 overexpression in BCC (Figs 1 and 8), verified by gene and protein analysis, which supports previous reports of altered expression in tumour cells.
Upregulation of SLC7A7, which encodes a Y(+)l‐type amino acid transporter (y+LAT1), could not be verified when analysing gene expression with qPCR as there was no statistically significant difference between the tumours and their matching nontumour tissues. The function of SLC7A7 is transporting amino acids (e.g. lysine) across the membrane in both a Na+ independent and dependent manner in association with 4F2hc.26 Interestingly, protein expression of SLC7A7 was detected in the stratum granulosum in the epithelia (Figs 4a–c and 7). During the cornification process, the cells in the stratum granulosum become more flat and a specific gene cluster named ‘epidermal differentiation complex’ generates expression of specific proteins such as profilaggrin, involucrin and loricrin. The nuclei and other cellular organelles degrade and an intracellular increase of Ca2+ activates transglutaminases. The transglutaminases cross‐link cellular proteins to form the cornified envelope close to the cell surface and eventually the only cellular proteins left are keratins (containing lysine), providing mechanical strength to the stratum corneum.29 Our results show that SLC7A7 protein is strongly expressed in the stratum granulosum, indicating that SLC7A7 may have a role in the process of cornification, possibly by transporting lysine. Studies have shown upregulation of SLC7A7 in glioblastoma;30, 31 however, after qPCR validation, our study fails to demonstrate any alterations in BCC.
Among the most upregulated genes was TDO2, encoding the cytosolic enzyme TDO. TDO catalyses the first step of degradation of the essential amino acid tryptophan. A similar reaction is catalysed by IDO, a protein well studied for its immunosuppressive effects on T lymphocytes.32 The effects of TDO are relatively unstudied but suggested to be analogous to those of IDO. Previous studies have shown TDO2 upregulation in, for example, malignant melanoma, bladder carcinoma, hepatocarcinoma and triple‐negative breast cancer.32, 33 According to our results, the majority of BCC cells did not express TDO2 protein. Similarly to IDO, IHC staining was confined to stromal cells (i.e. immune cells) and to the tumour microenvironment. There was no correlation between TDO2 protein and gene expression as scoring of protein was restricted to tumour cells and gene expression generated from whole tumour tissue, including stroma and stromal cells. TDO2 is suggested to promote carcinogenesis, as tryptophan catabolism seems be an important factor in the immunosuppressive microenvironment of many types of cancers.34 Because IDO inhibitors have shown promising results in melanoma treatment, it is plausible that TDO2 may also serve as a target in BCC,10 although abdominal epidermis from the two healthy donors was, according to IHC, indicated to have higher TDO2 protein expression than epidermis in BCCs. In order to elucidate any biological importance of the findings in present study, in vitro functional studies with gene modulation will be a first start.
In conclusion, by using different methods we have identified upregulation of the amino acid transporters SLC7A5, SLC7A8 and the cytosolic enzyme TDO2 in BCC. This study thereby adds knowledge to forthcoming studies of therapeutic modalities. In addition, we found that the lysine transporter SLC7A7 was exclusively expressed in the stratum granulosum of normal epidermis, which, to the best of our knowledge, has not been shown previously.
Supporting information
Table S1 Genes and entities with differential expression in basal cell carcinoma tumours compared with nontumour tissue.
Table S2 Differentially expressed genes (DEGs) in basal cell carcinoma after removal of entities corresponding to pseudogenes and lncRNA etc.
Table S3 Gene Ontology analysis with 211 enriched terms (corrected P < 0·1).
Table S4 Genes included in GO:term Plasma membrane part; Intrinsic component of plasma membrane; Plasma membrane region.
Powerpoint S1 Journal Club Slide Set.
Video S1 Author video.
Funding sources This study was supported by grants from the Lions Cancer Research fund (Region Uppsala Örebro), Nyckelfonden (Örebro University Hospital) and ALF grants, Region Örebro County.
Conflicts of interest None to declare.
Plain language summary available online
References
- 1. Lomas A, Leonardi‐Bee J, Bath‐Hextall F. A systematic review of worldwide incidence of nonmelanoma skin cancer. Br J Dermatol 2012; 166:1069–80. [DOI] [PubMed] [Google Scholar]
- 2. Walling HW, Fosko SW, Geraminejad PA et al Aggressive basal cell carcinoma: presentation, pathogenesis, and management. Cancer Metastasis Rev 2004; 23:389–402. [DOI] [PubMed] [Google Scholar]
- 3. Wong CS, Strange RC, Lear JT. Basal cell carcinoma. BMJ 2003; 327:794–8. [DOI] [PMC free article] [PubMed] [Google Scholar]
- 4. Housman TS, Feldman SR, Williford PM et al Skin cancer is among the most costly of all cancers to treat for the Medicare population. J Am Acad Dermatol 2003; 48:425–9. [DOI] [PubMed] [Google Scholar]
- 5. Kim Y, He YY. Ultraviolet radiation‐induced non‐melanoma skin cancer: Regulation of DNA damage repair and inflammation. Genes Dis 2014; 1:188–98. [DOI] [PMC free article] [PubMed] [Google Scholar]
- 6. Gailani MR, Ståhle‐Bäckdahl M, Leffell DJ et al The role of the human homologue of Drosophila patched in sporadic basal cell carcinomas. Nat Genet 1996; 14:78–81. [DOI] [PubMed] [Google Scholar]
- 7. Stone DM, Hynes M, Armanini M et al The tumour‐suppressor gene Patched encodes a candidate receptor for Sonic hedgehog. Nature 1996; 384:129–34. [DOI] [PubMed] [Google Scholar]
- 8. Sekulic A, Migden MR, Oro AE et al Efficacy and safety of vismodegib in advanced basal‐cell carcinoma. N Engl J Med 2012; 366:2171–9. [DOI] [PMC free article] [PubMed] [Google Scholar]
- 9. Ganapathy V, Thangaraju M, Prasad PD. Nutrient transporters in cancer: relevance to Warburg hypothesis and beyond. Pharmacol Ther 2009; 121:29–40. [DOI] [PubMed] [Google Scholar]
- 10. Brochez L, Chevolet I, Kruse V. The rationale of indoleamine 2,3‐dioxygenase inhibition for cancer therapy. Eur J Cancer 2017; 76:167–82. [DOI] [PubMed] [Google Scholar]
- 11. Moon YW, Hajjar J, Hwu P, Naing A. Targeting the indoleamine 2,3‐dioxygenase pathway in cancer. J Immunother Cancer 2015; 3:51. [DOI] [PMC free article] [PubMed] [Google Scholar]
- 12. Hirano K, Uno K, Kuwabara H et al Expression of l‐type amino acid transporter 1 in various skin lesions. Pathol Res Pract 2014; 210:634–9. [DOI] [PubMed] [Google Scholar]
- 13. Imai H, Kaira K, Oriuchi N et al Inhibition of l‐type amino acid transporter 1 has antitumor activity in non‐small cell lung cancer. Anticancer Res 2010; 30:4819–28. [PubMed] [Google Scholar]
- 14. Yothaisong S, Dokduang H, Anzai N et al Inhibition of l‐type amino acid transporter 1 activity as a new therapeutic target for cholangiocarcinoma treatment. Tumour Biol 2017; 39:1010428317694545. [DOI] [PubMed] [Google Scholar]
- 15. Livak KJ, Schmittgen TD. Analysis of relative gene expression data using real‐time quantitative PCR and the 2(–delta delta C(T)) method. Methods 2001; 25:402–8. [DOI] [PubMed] [Google Scholar]
- 16. Heller ER, Gor A, Wang D et al Molecular signatures of basal cell carcinoma susceptibility and pathogenesis: a genomic approach. Int J Oncol 2013; 42:583–96. [DOI] [PubMed] [Google Scholar]
- 17. Asplund A, Gry Bjorklund M, Sundquist C et al Expression profiling of microdissected cell populations selected from basal cells in normal epidermis and basal cell carcinoma. Br J Dermatol 2008; 158:527–38. [DOI] [PubMed] [Google Scholar]
- 18. Howell BG, Solish N, Lu C et al Microarray profiles of human basal cell carcinoma: insights into tumor growth and behavior. J Dermatol Sci 2005; 39:39–51. [DOI] [PubMed] [Google Scholar]
- 19. O'Driscoll L, McMorrow J, Doolan P et al Investigation of the molecular profile of basal cell carcinoma using whole genome microarrays. Mol Cancer 2006; 5:74. [DOI] [PMC free article] [PubMed] [Google Scholar]
- 20. Bonifas JM, Pennypacker S, Chuang PT et al Activation of expression of hedgehog target genes in basal cell carcinomas. J Invest Dermatol 2001; 116:739–42. [DOI] [PubMed] [Google Scholar]
- 21. Cohen JD, Li L, Wang Y et al Detection and localization of surgically resectable cancers with a multi‐analyte blood test. Science 2018; 359:926–30. [DOI] [PMC free article] [PubMed] [Google Scholar]
- 22. Wei R, Wong JPC, Kwok HF. Osteopontin – a promising biomarker for cancer therapy. J Cancer 2017; 8:2173–83. [DOI] [PMC free article] [PubMed] [Google Scholar]
- 23. Bal E, Park HS, Belaid‐Choucair Z et al Mutations in ACTRT1 and its enhancer RNA elements lead to aberrant activation of Hedgehog signaling in inherited and sporadic basal cell carcinomas. Nat Med 2017; 23:1226–33. [DOI] [PubMed] [Google Scholar]
- 24. Dalman MR, Deeter A, Nimishakavi G, Duan ZH. Fold change and P‐value cutoffs significantly alter microarray interpretations. BMC Bioinformatics 2012; 13(Suppl. 2):S11. [DOI] [PMC free article] [PubMed] [Google Scholar]
- 25. Fleige S, Walf V, Huch S et al Comparison of relative mRNA quantification models and the impact of RNA integrity in quantitative real‐time RT‐PCR. Biotechnol Lett 2006; 28:1601–13. [DOI] [PubMed] [Google Scholar]
- 26. Fotiadis D, Kanai Y, Palacín M. The SLC3 and SLC7 families of amino acid transporters. Mol Aspects Med 2013; 34:139–58. [DOI] [PubMed] [Google Scholar]
- 27. Napolitano L, Scalise M, Koyioni M et al Potent inhibitors of human LAT1 (SLC7A5) transporter based on dithiazole and dithiazine compounds for development of anticancer drugs. Biochem Pharmacol 2017; 143:39–52. [DOI] [PubMed] [Google Scholar]
- 28. Barollo S, Bertazza L, Watutantrige‐Fernando S et al Overexpression of l‐type amino acid transporter 1 (LAT1) and 2 (LAT2): novel markers of neuroendocrine tumors. PLOS One 2016; 11:e0156044. [DOI] [PMC free article] [PubMed] [Google Scholar]
- 29. Costanzo A, Fausti F, Spallone G et al Programmed cell death in the skin. Int J Dev Biol 2015; 59:73–8. [DOI] [PubMed] [Google Scholar]
- 30. Fan S, Meng D, Xu T et al Overexpression of SLC7A7 predicts poor progression‐free and overall survival in patients with glioblastoma. Med Oncol 2013; 30:384. [DOI] [PubMed] [Google Scholar]
- 31. Fan S, Zhao Y, Li X et al Genetic variants in SLC7A7 are associated with risk of glioma in a Chinese population. Exp Biol Med (Maywood) 2013; 238:1075–81. [DOI] [PubMed] [Google Scholar]
- 32. Pilotte L, Larrieu P, Stroobant V et al Reversal of tumoral immune resistance by inhibition of tryptophan 2,3‐dioxygenase. Proc Natl Acad Sci U S A 2012; 109:2497–502. [DOI] [PMC free article] [PubMed] [Google Scholar]
- 33. D'Amato NC, Rogers TJ, Gordon MA et al A TDO2‐AhR signaling axis facilitates anoikis resistance and metastasis in triple‐negative breast cancer. Cancer Res 2015; 75:4651–64. [DOI] [PMC free article] [PubMed] [Google Scholar]
- 34. Platten M, von Knebel Doeberitz N, Oezen I et al Cancer immunotherapy by targeting IDO1/TDO and their downstream effectors. Front Immunol 2014; 5:673. [DOI] [PMC free article] [PubMed] [Google Scholar]
Associated Data
This section collects any data citations, data availability statements, or supplementary materials included in this article.
Supplementary Materials
Table S1 Genes and entities with differential expression in basal cell carcinoma tumours compared with nontumour tissue.
Table S2 Differentially expressed genes (DEGs) in basal cell carcinoma after removal of entities corresponding to pseudogenes and lncRNA etc.
Table S3 Gene Ontology analysis with 211 enriched terms (corrected P < 0·1).
Table S4 Genes included in GO:term Plasma membrane part; Intrinsic component of plasma membrane; Plasma membrane region.
Powerpoint S1 Journal Club Slide Set.
Video S1 Author video.


