

Abstract
Background
The prognostic significance of misfolded α‐synuclein (α‐Syn) aggregates in Parkinson's disease (PD) has not been well investigated. The aim of this study was to reveal the relationship between misfolded α‐Syn aggregate concentration in cerebrospinal fluid (CSF) and cognitive decline risk in PD.
Methods
A total of 278 patients with PD were retrospectively included. They were diagnosed between 2011 and 2013. The end‐point was 2016, and the follow‐up period was 54.3 ± 10.0 months. Cognitive decline was defined as a 4‐point decrease in the Mini‐Mental State Examination score during follow‐up. Misfolded α‐Syn aggregate concentration in baseline CSF was measured using the protein misfolding cyclic amplification (PMCA) technique. Time to reach 50% of the maximum fluorescence value was recorded.
Results
The PMCA technique successfully detected the level of misfolded α‐Syn aggregates in CSF with a sensitivity of 85.3% and a specificity of 91.4%. The time to reach 50% of the maximum fluorescence value was shorter in the patients with cognitive decline than in the patients without cognitive decline (190.7 ± 40.1 h vs. 240.8 ± 45.6 h, P < 0.001). Multifactorial Cox regression analysis revealed that reaching 50% of the maximum fluorescence value in ≤219 h at baseline was associated with increased risk of cognitive decline during the follow‐up (HR: 4.90, 95% CI: 2.75–8.74, P < 0.001).
Conclusion
Baseline concentration of misfolded α‐Syn aggregates in CSF measured by the PMCA technique predicts risk of cognitive decline in PD.
Keywords: alpha‐synuclein, cognitive decline, dementia, Parkinson disease, protein misfolding cyclic amplification
Introduction
Parkinson's disease (PD) is a long‐term neurodegenerative disease with unknown aetiology. In 2015, PD affected approximately 6.2 million individuals globally. In the same year, PD caused more than one hundred thousand deaths around the world 1. Tremor, rigidity, bradykinesia and postural instability are the four main motor symptoms in the disease 2. In advanced patients, cognitive problems and dementia become very common. One study reports that up to 78% of advanced patients suffer from PD‐related dementia (PDD) 3. PDD causes a heavy economic burden and significantly reduces the quality of life of patients and their caregivers 4. Early intervention may retard the development of PDD and improve the prognosis of patients. Thus, it is important to identify a marker for predicting prognosis and guiding therapy.
Alpha‐synuclein (α‐Syn) is a soluble protein expressed in the presynaptic and perinuclear regions of the central nervous system 5. Its structure can include monomers, oligomers, fibrils and fibres depending on its cellular environment and gene mutations 5. Under pathological conditions, α‐Syn forms insoluble fibrillar precipitates and results in neuronal death 6. The misfolding, aggregation and deposition of α‐Syn in the brain play important roles in the development and progression of PD 7, 8. The misfolding and aggregation of α‐Syn have the characteristic of intercellular transmission, which is similar to prion proteins 9.
Furthermore, the misfolding and aggregation of α‐Syn in the brain is one of the major types of pathological changes in PDD. Zarranz et al., in a post mortem examination, discovered that dementia with Lewy bodies was related to the E46K mutation of α‐Syn 10. Armstrong et al. reported a quantitative change in α‐Syn composition in the brain of PDD patients 11. Guella et al. further suggested that PD and PDD have distinct genetic aetiologies, albeit within one genomic locus, and α‐Syn genetic variability might be a biomarker for dementia in PD 12.
A study from Shahnawaz et al. in 2017 suggested that the detection of α‐Syn oligomers in cerebrospinal fluid (CSF) of patients affected by PD offered an opportunity for a sensitive and specific biochemical diagnosis of the disease 13. Another study from Menéndez‐González et al. in 2018 further proposed that the continuous depletion of α‐Syn oligomers in CSF might produce a steady clearance of the protein in interstitial fluid, preventing transmission and deposition in the brain 14. Therefore, the concentration of α‐Syn oligomers in CSF has potential diagnostic and therapeutic value in PD patients. However, the prognostic significance of α‐Syn oligomers in CSF for predicting the development of cognitive decline has not been well investigated.
Protein misfolding cyclic amplification (PMCA) is a novel amplification and detection technique originally developed by Soto et al. 15. Its operating principle is similar to DNA amplification by polymerase chain reaction (PCR). PMCA has become a standard technology for amplifying and detecting misfolded prion proteins in prion‐related diseases 15, 16. Salvadores and his colleagues detected Aβ oligomers in CSF of patients with Alzheimer's disease (AD) using PMCA and suggested that PMCA might be a sensitive method for biochemical diagnosis of AD 17. Shahnawaz et al. also adopted PMCA to detect α‐Syn oligomers in CSF and confirmed the feasibility of PMCA in PD 13.
Therefore, we conducted this retrospective cohort study to measure the concentration of α‐Syn oligomers in CSF using PMCA and to explore the relationship between the concentration of α‐Syn oligomers in CSF and risk of cognitive decline in patients affected by PD. In addition, we also evaluated the clinical significance of α‐Syn oligomers in motor decline in PD patients.
Materials and methods
The study was approved by the ethics committee of Zhengzhou University.
Study design
This is a retrospective cohort study. A total of 326 continuous PD patients who met the inclusion criteria were preliminarily enrolled in the study. All of them were diagnosed at the First Affiliated Hospital of Zhengzhou University or the Second Affiliated Hospital of Zhengzhou University between January 2011 and December 2013. At the time of diagnosis, CSF specimens were collected. For years, these patients had been treated for PD in these hospitals. Their therapeutic regimen was anticholinergic agents, Madopar, amantadine and their combination. A modified Hoehn and Yahr (H&Y) scale, the Unified Parkinson's Disease Rating Scale part III (UPDRS‐III) and the Mini‐Mental State Examination (MMSE) were routinely adopted to assess the progression of the disease. If cognitive or motor decline occurred, the CSF specimens were collected again.
An interview with these patients was performed between July 2016 and December 2016. Three hundred and six patients or their relatives agreed to participate in the study and signed the written informed consents. Among them, 28 patients had died and 278 patients were still living. Therefore, 278 living patients were included in the whole study, and 28 dead patients were only included in our survival analysis. Twenty patients or their immediate relatives refused to take part in the study and were excluded from the study.
A total of 278 patients with cervical spondylotic myelopathy (n = 233) or other type of cervical spondylosis (n = 45) were also included between January 2011 and December 2016 from the First Affiliated Hospital of Zhengzhou University or the Second Affiliated Hospital of Zhengzhou University and served as controls. They had signed the written informed consents to authorize the use of their medical records and CSF specimens.
Inclusion criteria
Inclusion criteria of the PD patients were predefined as follows: First, the patients were clinically diagnosed with PD between January 2010 and December 2013. The diagnosis was confirmed again in 2016 by a neurology specialist team according to the UK Brain Bank guidelines 18. Second, the patients were Han Chinese. Third, the patients were local residents. Fourth, there was no cognitive impairment at baseline according to cognitive function examination. Fifth, the patients did not have cerebral trauma, cerebral infarction, cerebral haemorrhage, encephalitis, other type of dementia, epilepsy, myocardial infarction, any type of mental disease or any type of cancer.
CSF specimens
Five ml of CSF was collected from each subject in the morning through a standard lumbar puncture. The specimen was centrifuged at 3000 g for 15 min at 25°C. Supernatant was obtained and stored at −80°C until assays.
Disease assessment
Disease assessment was performed at the time of diagnosis, once a year and when the condition was getting worse. The basic condition of the patients was evaluated using the modified H&Y scale with 1–5 stages 19. Motor function was assessed using UPDRS‐III with a score range of 0–108 20. Cognitive function was measured using MMSE with a score range of 0–30 21.
Follow‐up
The starting point was January 2011 to December 2013, and the end‐point was December 2016. The average follow‐up period was 54.3 ± 10.0 months (Table 1).
Table 1.
Characteristics of the retrospective cohort
| Characteristica | PD | Control | P value |
|---|---|---|---|
| No. of patients (n, %) | 278 (100.0) | 278 (100.0) | – |
| Age at diagnosis (years) | 70.8 ± 11.2 | 68.9 ± 11.4 | 0.045 |
| Male (n, %) | 162 (58.3) | 155 (55.8) | 0.549 |
| Body mass index (kg/m2) | 21.4 ± 2.6 | 21.3 ± 2.8 | 0.660 |
| History of diabetes (n, %) | 68 (24.5) | 54 (19.4) | 0.151 |
| History of hypertension (n, %) | 113 (40.6) | 88 (31.7) | 0.027 |
| History of hyperlipidaemia (n, %) | 62 (22.3) | 61 (21.9) | 0.919 |
| History of depression (n, %) | 29 (10.4) | 33 (11.9) | 0.590 |
| History of insomnia (n, %) | 165 (59.4) | 130 (46.8) | 0.003 |
| History of OSAHS (n, %) | 13 (4.7) | 17 (6.1) | 0.453 |
| History of osteoporosis (n, %) | 183 (65.8) | 167 (60.1) | 0.160 |
| History of drinking alcohol (n, %) | 28 (10.1) | 24 (8.6) | 0.560 |
| History of smoking (n, %) | 60 (21.6) | 50 (18.0) | 0.287 |
| History of pesticide exposure (n, %) | 5 (1.8) | 2 (0.7) | 0.254 |
| Lack of exercise (n, %) | 133 (47.8) | 119 (42.8) | 0.233 |
| Family history of PD (n, %) | 28 (10.1) | 14 (5.0) | 0.025 |
| Period of follow‐up (months) | 54.3 ± 10.0 | – | – |
| Modified H&Y stage | |||
| No. of stage ≥ 3 at baseline (n, %) | 24 (8.6) | – | – |
| No. of stage ≥ 3 at the end (n, %) | 113 (40.6) | – | – |
| MMSE score | |||
| Score at baseline | 22.1 ± 2.4 | – | – |
| Score at the end | 20.1 ± 1.7 | – | – |
| No. of cognitive decline (n, %) | 54 (19.4) | – | – |
| UPDRS‐III motor score | |||
| Score at baseline | 24.3 ± 8.6 | – | – |
| Score at the end | 37.8 ± 11.0 | – | – |
| No. of motor decline (n, %) | 66 (23.7) | – | – |
OSAHS, obstructive sleep apnoea‐hypopnoea syndrome; PD, Parkinson's disease; modified H&Y, modified Hoehn and Yahr scale; MMSE, mini‐mental state examination; UPDRS‐III, Unified Parkinson's Disease Rating Scale part III.
Continuous variables are expressed as the mean ± SD, and categorical variables are expressed as the frequency and constituent ratio.
Previous studies suggested that a significant decrease in MMSE score over a long time is 3–4 points 22, 23. A reliable increase in UPDRS‐III score over a long interval is 2.5–5.2 points per year 24. Therefore, cognitive decline was defined as a 4‐point decrease in MMSE score, and motor decline was defined as a 20‐point increase in UPDRS‐III score (4 points per year).
At the time of diagnosis, no complaint of cognitive impairment and an MMSE score >24 points were defined as normal cognitive function.
Research variables
Medical and personal histories of the subjects were confirmed according to the information from their medical records.
Medical and personal histories of the subjects were confirmed according to the information from their medical records. A history of diabetes was confirmed by fasting plasma glucose value, 2‐h postprandial plasma glucose value and use of hypoglycaemic agents. A history of hypertension was confirmed by the value of the blood pressure (systolic blood pressure ≥140 mmHg and/or diastolic blood pressure ≥90 mmHg) and use of antihypertensive agents. History of hyperlipidaemia was confirmed by the level of triglyceride, total cholesterol and use of antihyperlipidaemic agents. A history of depression was confirmed by their symptoms and use of antidepressant agents. A history of insomnia was confirmed by their complaints and use of hypnotic agents. Obstructive sleep apnoea‐hypopnoea syndrome (OSAHS) was confirmed by their symptoms and sleep monitoring. Osteoporosis was confirmed by bone mineral density examination and use of antiosteoporosis agents.
A history of drinking alcohol was defined as drinking alcohol at least one time every week for more than 1 year in his or her life. A history of smoking was defined as smoking at least one cigarette every day for more than 1 year in his or her life. Body mass index (BMI) was calculated according to the formula: weight (kg)/height2 (m2). A history of pesticide exposure was defined as engaging in pesticide manufacturing, storage or spraying for more than 1 year in his or her life. Lack of exercise meant never doing any sports in his or her life.
Preparation of seed‐free substrate (α‐Syn)
The steps were performed according to the instructions in the previous studies with appropriate modification 13, 17. (i) Plasmids carrying the human α‐Syn gene (GenePharma, Shanghai, China) were transfected into BL21(DE3) pLysS cells (MCLAB, Beijing, China). (ii) The cells were incubated in 1 mmol/l isopropyl β‐d‐thiogalactoside (BioVision, Wuhan, China) at 25°C for 10 h. (iii) The bacterial pellets were lysed in solutions containing sodium chloride (300 mmol/l), sodium dihydrogen phosphate (50 mmol/l, pH 8.0), phenylmethylsulfonyl fluoride (1 mmol/l), Tris(2‐carboxyethyl)phosphine hydrochloride (0.1 mmol/l) and lysozyme (1 mg/ml) (R&D Systems, Shanghai, China). (iv) The solution was prepared using sonication at 0°C. (v) The solution was centrifuged at 25 000 g for 20 min at 4°C. (vi) A nickel affinity column (Qiagen, Shanghai, China) was adopted to filter the supernatant, and the protein was eluted using a buffer containing sodium chloride (125 mmol/l), imidazole (300 mmol/l), Tris(2‐carboxyethyl)phosphine hydrochloride (0.1 mmol/l) and sodium dihydrogen phosphate (25 mmol/l, pH 7.4). (vii) The solution was added to protease inhibitors and dialysed against phosphate‐buffered saline at 4°C overnight. (viii) The solution was filtered by a filter with a molecular weight cut‐off of 100 kDa (Millipore, Jiangsu, China).
Preparation of seed templates (α‐Syn oligomers)
Seed templates were prepared according to previous studies with appropriate modifications 13, 17. (i) Purified α‐Syn and phosphate‐buffered saline were mixed to form a solution of 1 mg/ml. (ii) The solution was separately incubated and vigorously shaken at 37°C for 96 h.
α‐Syn PMCA
The steps were performed according to the instructions in the previous studies with appropriate modifications 13, 17. (i) Adding substrate seed‐free α‐Syn: The substrate α‐Syn (1 mg/ml), ethanesulfonic acid (100 mmol/l, pH 6.5) and sodium chloride (500 mmol/l) were mixed to form a solution, and the concentration of the substrate α‐Syn was 100 μg/ml. An equal amount (100 μl) of the solution including α‐Syn was put into black 96‐well plates. (ii) Adding CSF specimen: Forty microlitres of CSF from the subjects (the patients or controls) and 100 μl thioflavin T (ThT) were put into the 96‐well plates. (iii) Positive control: The positive control consisted of a healthy CSF specimen and seed template α‐Syn oligomers (200 ng). (iv) Incubation: The 96‐well plates were continuously incubated at 37°C for 360 h and periodically shaken (at 500 rpm for 1 min following with holding still for 29 min). (v) Measurement: In the process of incubation (360 h), the increase in ThT fluorescence was periodically measured at the excitation wavelength of 435 nm and emission wavelength of 485 nm by a Gemini EM spectrofluorometer (Molecular Devices, Shanghai, China). The increase in ThT fluorescence value represented the increase in the aggregation degree of the α‐Syn. Then, an aggregated dynamic marker (i.e. T50) was recorded. T50 was defined as the time to reach 50% of the maximum fluorescence value, and it was used in the PMCA reaction as an indication of the concentration of oligomeric seeds present in the sample. Shahnawaz et al. reported that there was a direct relationship between T50 and the logarithmic concentration of seeds added to the assay 13. Each CSF specimen was measured twice, and the mean and standard deviation of T50 were adopted in the analysis.
Sensitivity, specificity, positive predictive value, negative predictive value and their 95% CIs were measured by receiver operating characteristic curve (ROC) analysis using MedCalc statistical software version 16.2 (MedCalc, Mariakerke, Belgium).
Statistical analysis
Continuous variables are expressed as the mean and standard deviation, and differences between two continuous variables were determined using the independent‐sample t test. Categorical variables are expressed as frequency and constituent ratio, and differences between two categorical variables were determined using the χ²‐test. The linear association of T50 with cognitive or motor function score was measured by Pearson correlation analysis. Survival analysis was adopted to measure the survival difference between two different groups. ROC analysis was adopted to determine the cut‐off point of baseline T50 for predicting cognitive or motor decline. Multifactorial Cox regression analysis was conducted to determine the association of T50 with cognitive or motor decline. The hazard ratio (HR) and 95% CI are reported. All tests were two‐tailed. If a P value was less than 0.05, it had statistical significance. The statistical analysis was performed using spss 19.0 (SPSS Inc, Chicago, IL, USA).
Results
Basic data
As shown in Table 1, there were 278 PD patients and 278 controls in the study. There was no difference in gender, BMI, history of diabetes, hyperlipidaemia, depression, OSAHS, osteoporosis, drinking alcohol, smoking, pesticide exposure or lack of exercise between the PD patients and the controls (P = 0.549, P = 0.660, P = 0.151, P = 0.919, P = 0.590, P = 0.453, P = 0.160, P = 0.560, P = 0.287, P = 0.254, P = 0.233). Age at diagnosis was higher in the patients than in the controls (P = 0.045). More patients had hypertension, insomnia and family history of PD (P = 0.027, P = 0.003, P = 0.025). The follow‐up in the PD patients was 54.3 ± 10.0 months. During the follow‐up, the number of patients with modified H&Y stage ≥3 increased from 24 to 113. In this period, 54 patients suffered from cognitive decline, and 66 patients suffered from motor decline. The characteristics of the PD patients according to cognitive decline and motor decline are presented in Tables S1 and S2.
PMCA
The baseline concentration of α‐Syn oligomers in CSF was measured using PMCA. Baseline fluorescence value in the PD patients was higher than in the controls (5295.2 ± 2907.8, 38.6 ± 224.9, P < 0.001) (Figure 1 A). Among these patients, some had negative fluorescence values (n = 29). Therefore, Figure 1 B,C only include the PD patients with positive fluorescence values (n = 249). The included data show that the misfolded aggregation rate of α‐Syn in the baseline CSF specimens from the patients with cognitive or motor decline reached 100% faster than that from the patients without cognitive or motor decline (Figure 1 B,C).
Figure 1.
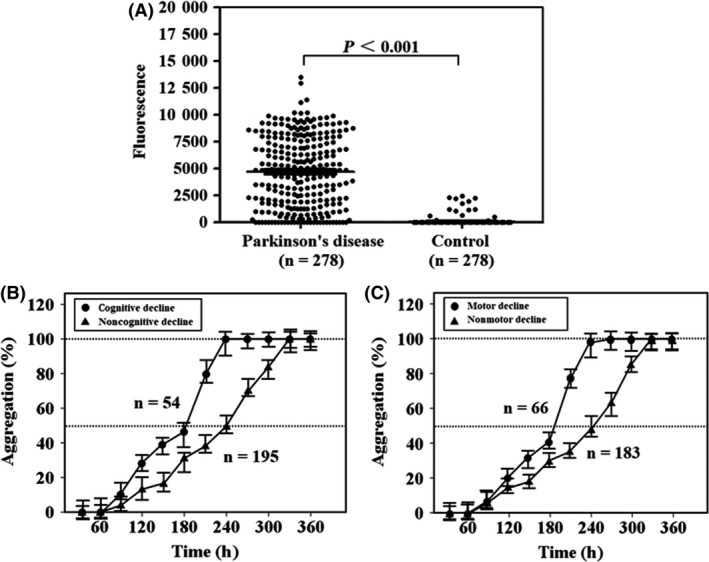
Fluorescence value and aggregation rate in protein misfolding cyclic amplification detecting misfolded α‐synuclein aggregates. Laboratory‐prepared solutions, including seed‐free substrate α‐synuclein (100 μl), were continuously incubated at 37°C for more than 360 h with cerebrospinal fluid specimens from Parkinson patients or controls (40 μl). In this period, the solutions were periodically shaken for 1 min every 30 min. Fluorescence values were periodically measured using a spectrofluorometer. (A) The difference in fluorescence value at 360 h between the Parkinson patients and controls. Twenty‐nine patients reported negative results. The misfolded aggregation rate of α‐synuclein was monitored using the fluorescence value and was calculated by the ratio between the fluorescence value at one time point and the maximum fluorescence value. (B,C) Only include the Parkinson patients with positive fluorescence values (n = 249). (B) The increase in the aggregation rate from 0% to almost 100% during the test period in the Parkinson patients with or without cognitive decline. (C) The increase in the aggregation rate during the same time period in the Parkinson patients with or without motor decline. Filled circles represent the average fluorescence value in Parkinson patients with cognitive or motor decline at a certain time point. Filled triangles represent the average fluorescence value in Parkinson patients without cognitive or motor decline at a certain time point. Error bars indicate standard deviation in the graphs.
As shown in Table 2, data analysis was performed using the results of 273 PD patients and 273 controls. The sensitivity for PMCA in PD was 85.3 (77.5–91.2) %, the specificity against controls was 91.4 (85.1–95.7) %, the positive predictive value was 89.5 (84.8–95.1) % and the negative predictive value was 85.9 (77.2–89.7) %.
Table 2.
Sensitivity, specificity and predictive value of protein misfolding cyclic amplification in detecting misfolded α‐synuclein aggregates in cerebrospinal fluid
| Value (%)a | 95% CIa | |
|---|---|---|
| Sensitivity for PD | 85.3 | 77.5–91.2 |
| Specificity against controls | 91.4 | 85.1–95.7 |
| Positive predictive value | 89.5 | 84.8–95.1 |
| Negative predictive value | 85.9 | 77.2–89.7 |
PD, Parkinson's disease.
Data analysis was performed using the results of 273 Parkinson patients and 273 controls, and receiver operating characteristic curve analysis was adopted in this process.
T50
Only the PD patients with positive fluorescence values (n = 249) were included. T50 was calculated by PMCA. Compared with the patients without cognitive decline, baseline T50 was shorter in the patients with cognitive decline during the follow‐up (240.8 ± 45.6 h, 190.7 ± 40.1 h, P < 0.001) (Figure 2 A). Compared with the patients without motor decline, baseline T50 was also shorter in the patients with motor decline during the follow‐up (240.4 ± 47.4 h, 200.9 ± 40.3 h, P < 0.001) (Figure 2 B).
Figure 2.
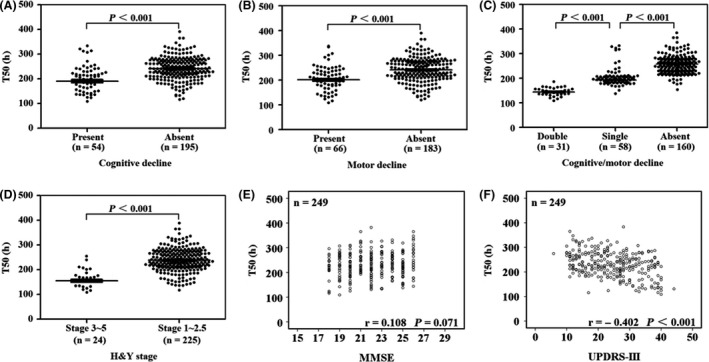
Time to 50% of the maximum fluorescence value in protein misfolding cyclic amplification to detect misfolded α‐synuclein aggregates. T50 was defined as the time to reach 50% of the maximum fluorescence value in the continuous incubation with periodic shaking for more than 360 h. There was a direct relationship between T50 and the logarithmic concentration of seeds added to the assay. In the following assay, only the Parkinson patients with positive fluorescence values (n = 249) were included. Among them, 54 patients suffered from cognitive decline and 66 patients motor decline during the follow‐up period. (A–D) The baseline T50 in Parkinson patients according to grouping (i.e. patients with cognitive decline or not, patients with motor decline or not, combination of the above two conditions and patients with different Hoehn and Yahr stages). Error bars indicate standard deviation in the graphs. (E,F) The linear association of baseline T50 with cognitive or motor score in Parkinson patients using Pearson correlation analysis. H&Y stage, Hoehn and Yahr stage; UPDRS‐III, Unified Parkinson's Disease Rating Scale part III; MMSE, Mini‐Mental State Examination.
As shown in Figure 2 C, baseline T50 was shorter in the patients with both cognitive and motor decline than the patients with only cognitive or motor decline during the follow‐up (144.2 ± 15.9 h, 192.9 ± 12.6 h, P < 0.001). Baseline T50 was shorter in the patients with cognitive or motor decline than the patients without any type of decline during the follow‐up (192.9 ± 12.6 h, 257.0 ± 32.3 h, P < 0.001).
In Figure 2 D, compared with the patients with H&Y stage 1–2.5, T50 was shorter in the patients with H&Y stage 3–5 at baseline (238.2 ± 44.1 h, 155.3 ± 26.0 h, P < 0.001).
As shown in Figure 2 E,F, T50 was linearly correlated with UPDRS‐III score (r = −0.402, P < 0.001), but was not correlated with MMSE score at baseline (r = 0.108, P = 0.071).
In Figure 3 A,C, baseline T50 was linearly correlated with the time from baseline to cognitive decline or motor decline (r = 0.526, P < 0.001; r = 0.404, P = 0.001). Furthermore, baseline T50 was linearly correlated with the MMSE decrease from baseline to the end (r = −0.834, P < 0.001) (Figure 3 B). Baseline T50 was also linearly correlated with the UPDRS‐III increase from baseline to the end (r = −0.287, P = 0.019) (Figure 3 D).
Figure 3.
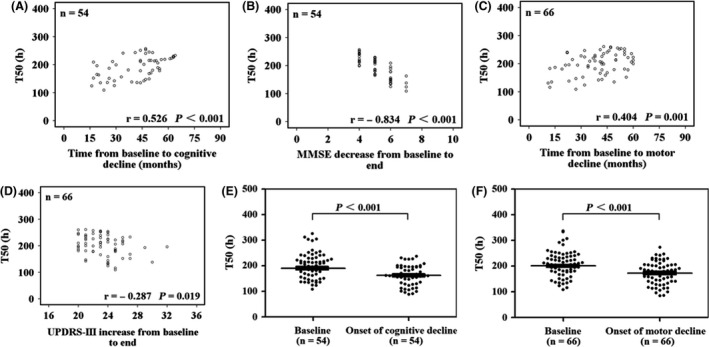
Time to 50% of the maximum fluorescence value in patients with cognitive decline or motor decline. Cognitive decline was defined as a 4‐point decrease in the score of the Mini‐Mental State Examination, and motor decline was defined as a 20‐point increase in the score of the Unified Parkinson's Disease Rating Scale part III (4 points per year). (A,C) The linear association of baseline T50 with the time from baseline to the onset of cognitive and motor decline, respectively. (B,D) The linear association of baseline T50 with the change in the cognitive and motor scores during the follow‐up period, respectively. (E,F) Compare baseline T50 with T50 at the time of cognitive or motor decline occurrence. UPDRS‐III, Unified Parkinson's Disease Rating Scale part III; MMSE, Mini‐Mental State Examination.
In the PD patients with cognitive or motor decline, T50 at the development of cognitive or motor decline significantly decreased compared with baseline T50 (190.7 ± 40.1 h, 162.9 ± 39.6 h, P < 0.001; 200.9 ± 40.3 h, 173.3 ± 42.6 h, P < 0.001) (Figure 3 E,F).
ROC analysis and COX regression analysis
Only the PD patients with positive fluorescence values (n = 249) were included. As shown in Figure 4, a cut‐off point for baseline T50 was 219 h, with a sensitivity of 76.3% and a specificity of 69.6% in predicting cognitive decline risk (area under the curve = 0.798, 95% CI: 0.733–0.862, P < 0.001). Another cut‐off point for baseline T50 was 226 h, with a sensitivity of 74.2% and a specificity of 63.3% in predicting motor decline risk (area under the curve = 0.749, 95% CI: 0.686–0.812, P < 0.001).
Figure 4.
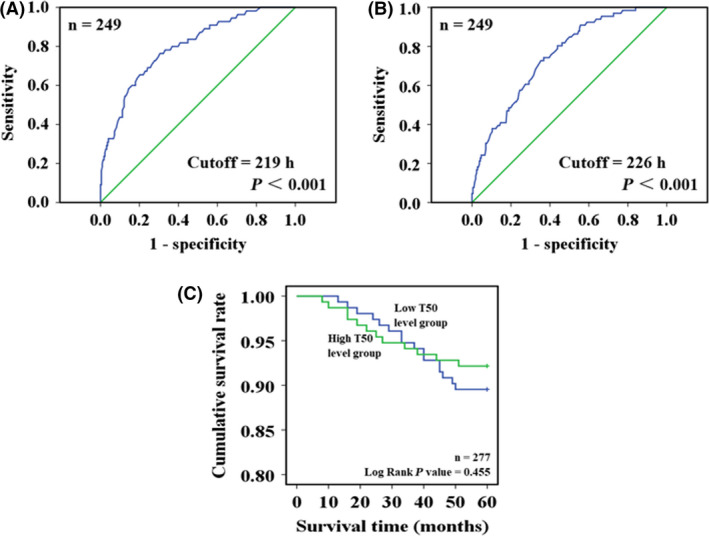
Receiver operating characteristic (ROC) curve analysis and survival analysis. ROC curve analysis was adopted to explore the predictive significance of baseline T50 in the development of cognitive or motor decline during the follow‐up period. Only the Parkinson patients with positive fluorescence values (n = 249) were included. (A) Reports a cut‐off point of baseline T50 (219 h), which had a sensitivity of 76.3% and a specificity of 69.6% in predicting cognitive decline risk (area under the curve = 0.798, P < 0.001). (B) Reports another cut‐off point of baseline T50 (226 h), which had a sensitivity of 74.2% and a specificity of 63.3% in predicting motor decline risk (area under the curve = 0.749, P < 0.001). In addition to the 249 patients, another 28 patients with Parkinson's disease who died of some diseases during the follow‐up period were also included in the survival analysis to explore the relationship between baseline T50 and survival advantage. In the process, all the patients were divided into two groups according to the cut‐off point of baseline T50, and cumulative survival rates in these two groups are compared in (C).
As shown in Table 3, baseline T50 ≤ 219 h was associated with increased risk of cognitive decline (HR: 4.90, 95% CI: 2.75–8.74, P < 0.001). Baseline T50 ≤ 226 h was correlated with elevated risk of motor decline (HR: 3.40, 95% CI: 2.05–5.60, P < 0.001).
Table 3.
Associations of time to 50% of the maximum fluorescence value with cognitive decline and motor decline
| Event (n) | Total (n)a | Model 1b | Model 2b | |||
|---|---|---|---|---|---|---|
| HR (95% CI)c | P value | HR (95% CI) | P value | |||
| Cognitive decline | ||||||
| T50 > 219 h | 13 | 150 | Reference | – | Reference | – |
| T50 ≤ 219 h | 42 | 99 | 4.91 (2.76–8.75) | P < 0.001 | 4.90 (2.75–8.74) | P < 0.001 |
| Motor decline | ||||||
| T50 > 226 h | 17 | 135 | Reference | – | Reference | – |
| T50 ≤ 226 h | 49 | 114 | 3.42 (2.07–5.61) | P < 0.001 | 3.40 (2.05–5.60) | P < 0.001 |
HR, hazard ratio.
Only the Parkinson patients with positive fluorescence values (n = 249) were included.
Model 1 was adjusted by age and gender. Model 2 was adjusted by age, gender, body mass index, history of several chronic diseases, history of drinking alcohol, history of smoking, history of pesticide exposure, lack of exercise and family history of Parkinson's disease.
T50: time to 50% of the maximum fluorescence value.
Survival analysis
The PD patients with positive fluorescence values (n = 249) were included. In addition, 28 patients with PD who died during the follow‐up period were also included. Causes of death were cerebrovascular disease (10), cardiovascular disease (8), cancer (6) and fracture‐related complications (4). Thus, there were 277 PD patients in this survival analysis. The patients were divided into a high T50 level group (n = 139) and a low T50 level group (n = 138) according to their arithmetic mean (mean = 231 h). In Figure 4 C, there was no survival advantage in the high T50 level group compared with the low T50 level group (log rank P value = 0.455).
Discussion
A previous study from Shahnawaz et al. in 2017 suggested that the detection of α‐Syn oligomers by PMCA in the CSF of PD patients offered a good opportunity for a sensitive and specific biochemical diagnosis of the disease 13. They also showed a relationship between α‐Syn oligomers and H&Y score, which indicated the potential clinical significance of PMCA to monitor the disease progression, but they used few patients and did not provide any longitudinal data 13. Therefore, we conducted this retrospective cohort study with a relatively large sample size and reported that a higher concentration of α‐Syn oligomers in the CSF at the time of diagnosis indicated a higher risk of cognitive decline and motor decline in the PD patients. We also demonstrated that the concentration of α‐Syn oligomers was related to the speed and degree of the disease progression.
However, we did not find any relationship between the α‐Syn oligomers and overall death in the PD patients. This result was expected, because PD was not a disease that can directly lead to death and most of patients died of other conditions.
The theoretical basis of α‐Syn in predicting the prognosis in PD patients is as follows. First, misfolded α‐Syn aggregates are a major pathogenic factor in PD 7, 8, and α‐Syn in the brain is also involved in the development of cognitive problems and dementia 10, 11, 12. Second, compared with long fibrils, α‐Syn oligomers with small or intermediate molecular weight are more important for pathological changes in PD 25, 26, and these α‐Syn oligomers can be detected in CSF of PD patients 27, 28. Third, α‐Syn misfolding, aggregation and deposition appear much earlier than the onset of clinical symptoms in PD patients 29.
PMCA is an amplification technique. Initially, a small amount of misfolded protein (template) is incubated with an excess of normal protein (substrate). Under given conditions, normal protein is converted into misfolded protein, and the chain of misfolded protein continually grows. Then, a mechanical fragmentation procedure, such as ultrasound or strong shaking, is adopted to break the chain into smaller fragments. Thus, a large amount of misfolded protein is obtained rapidly 15, 16. PMCA has been widely used to sensitively detect prions in body fluids, explore the potential mechanism of prion replication and develop inhibitors against prions 15, 16. Two previous studies also adopted this technology to detect misfolded pathogenic proteins in PD and AD 13, 17. In our study, we referred to the experimental steps of the previous studies 13, 17 and performed the PMCA to measure the concentration of α‐Syn oligomers in CSF. Our results were consistent with a previous study 13. Therefore, we believe that the experimental steps in our study were reasonable. Of course, they should be verified by subsequent experiments.
This study had a retrospective cohort design, and the CSF specimens had been preserved at −80°C for several years. In the previous study, several CSF specimens had undergone different numbers of freezing/thawing cycles, and similar results were reported about misfolded α‐Syn aggregates using PMCA 13. Some specimens even had six freezing/thawing cycles 13. Therefore, freezing and thawing is unlikely significantly affect our conclusions.
In this study, the aggregated dynamic marker T50 was our major research marker, but the true concentration of the misfolded α‐Syn aggregates was not reported. The reasons were as follows: First, our study did not use a commercial kit, and the concentration of standard products was not accurate enough, so the true concentration of α‐Syn aggregation could not be calculated. Second, because it was not known which type of intermediates had the strongest pathogenicity in PD, our specimens were a mixture of α‐Syn aggregates with different molecular weights. The true concentration in the mixture was meaningless. Third, all specimens reached a plateau value of fluorescence after more than 300 h of incubation. So T50 should be valid marker in this study. The above‐referenced study also adopted this marker, and our two studies provided similar determination values 13.
This study only explored the potential role of α‐Syn in PDD. Actually, AD pathology (tau and amyloid‐beta) also contributed to the development of cognitive impairment, at least in some of the PD patients. Several studies found that the patients with PDD had an increased level of tau and a decreased level of amyloid‐beta in CSF compared with the nondemented PD patients and controls 30, 31, 32. Another study suggested that α‐Syn was the most significant correlate of dementia in PD, and AD pathology was only abundant in a subset of patients 33. Furthermore, two studies focused on the predictive function of neuropsychological scores, quantitative imaging patterns, amyloid‐beta, tau and α‐Syn pathologies, and reported that a combination of abnormalities was a better predictor of dementia than the severity of any single abnormality 34, 35. Therefore, combining several pathological factors for predicting the development of PDD should be an important direction of future research.
Both cognitive performance and α‐Syn aggregation are age‐dependent factors 36, 37. In this study, the PD patients were significantly older than the controls, which may have caused potential bias. However, the study still detected a difference in baseline fluorescence value between the patients and the controls, which was consistent with a previous study 13. In the main part of the study, the PD patients were divided into subgroups according to cognitive or motor decline. Age was equivalent between these subgroups (Tables S1 and S2), and many confounding factors, including age, were well adjusted in the regression model. Therefore, age imbalance in this study is unlikely to have affected our main conclusions.
There were several limitations besides age imbalance and ignoring other pathological factors (such as tau and amyloid‐beta). First, this was a retrospective cohort study. To overcome this limitation, the data were collected according to a predesigned plan, and no modification to the plan was allowed in the process of the study. It ensured the integrity and homogeneity of the research data. Second, the PD patients were not diagnosed by neuropathology. However, the retrospectively included patients were reconfirmed according to the UK Brain Bank guidelines on admission. At this time, the clinical performance of the patients had become obvious, which may have improved the accuracy of diagnosis. Third, the controls were patients with cervical spondylosis, not healthy subjects. This kind of controls had been adopted in a previous study 13. No previous studies reported that cervical spondylosis was related to α‐Syn. Therefore, there was no evidence that it affected the conclusion.
In conclusion, our findings suggest that elevated concentration of misfolded α‐Syn aggregates in CSF predicts a high risk of cognitive and motor decline in PD. PMCA is an effective technology with high sensitivity and specificity to detect misfolded α‐Syn aggregates in CSF of PD patients. Identifying α‐Syn aggregate markers associated with faster progression of the disease may help understand the pathogenesis and guide further research in PD.
Ethical approval
The study was approved by the ethics committee of Zhengzhou University.
Author contributions
HN, QW, DH, XL, study design; DH, TY, JW, WL, SL, QJ, experiment operation; DH, TY, JW, WL, SL, QJ, data acquisition; HN, QW, DH, TY, JW, data analysis/interpretation; HN, QW, DH, XL, manuscript preparation.
Conflict of interest
The authors report no conflicts of interest.
Data accessibility
Because this is a part of an ongoing study, the data cannot be shared at present.
Supporting information
Table S1. Characteristics of the patients with cognitive decline and the patients without cognitive decline.
Table S2. Characteristics of the patients with motor decline and the patients without motor decline.
Ning H., Wu Q., Han D., Yao T., Wang J., Lu W., Lv S., Jia Q., Li X. (2019) Neuropathology and Applied Neurobiology 45, 398–409 Baseline concentration of misfolded α‐synuclein aggregates in cerebrospinal fluid predicts risk of cognitive decline in Parkinson's disease
References
- 1. GBD 2015 Disease and Injury Incidence and Prevalence Collaborators . Global, regional, and national incidence, prevalence, and years lived with disability for 310 diseases and injuries, 1990–2015: a systematic analysis for the Global Burden of Disease Study 2015. Lancet 2016; 388: 1545–602. [DOI] [PMC free article] [PubMed] [Google Scholar]
- 2. Ricciardi L, Bologna M, Morgante F, Ricciardi D, Morabito B, Volpe D, et al Reduced facial expressiveness in Parkinson's disease: a pure motor disorder? J Neurol Sci 2015; 358: 125–30 [DOI] [PubMed] [Google Scholar]
- 3. Gomperts SN. Lewy body dementias: dementia with Lewy bodies and Parkinson disease dementia. Continuum 2016; 22: 435–63 [DOI] [PMC free article] [PubMed] [Google Scholar]
- 4. Findley LJ. The economic impact of Parkinson's disease. Parkinsonism Relat Disord 2007; 13(Suppl.): S8–12 [DOI] [PubMed] [Google Scholar]
- 5. Dong C, Hoffmann M, Li X, Wang M, Garen CR, Petersen NO, et al Structural characteristics and membrane interactions of tandem α‐synuclein oligomers. Sci Rep 2018; 8: 6755 [DOI] [PMC free article] [PubMed] [Google Scholar]
- 6. Deas E, Cremades N, Angelova PR, Ludtmann MH, Yao Z, Chen S, et al Alpha‐synuclein oligomers interact with metal ions to induce oxidative stress and neuronal death in Parkinson's disease. Antioxid Redox Signal 2016; 24: 376–91 [DOI] [PMC free article] [PubMed] [Google Scholar]
- 7. Baba M, Nakajo S, Tu PH, Tomita T, Nakaya K, Lee VM, et al Aggregation of alpha‐synuclein in Lewy bodies of sporadic Parkinson's disease and dementia with Lewy bodies. Am J Pathol 1998; 152: 879–84 [PMC free article] [PubMed] [Google Scholar]
- 8. Miraglia F, Betti L, Palego L, Giannaccini G. Parkinson's disease and alpha‐synucleinopathies: from arising pathways to therapeutic challenge. Cent Nerv Syst Agents Med Chem 2015; 15: 109–16 [DOI] [PubMed] [Google Scholar]
- 9. Bhak G, Lee JH, Hahn JS, Paik SR. Granular assembly of alpha‐synuclein leading to the accelerated amyloid fibril formation with shear stress. PLoS ONE 2009; 4: e4177 [DOI] [PMC free article] [PubMed] [Google Scholar]
- 10. Zarranz JJ, Alegre J, Gómez‐Esteban JC, Lezcano E, Ros R, Ampuero I, et al The new mutation, E46K, of alpha‐synuclein causes Parkinson and Lewy body dementia. Ann Neurol 2004; 55: 164–73 [DOI] [PubMed] [Google Scholar]
- 11. Armstrong RA, Kotzbauer PT, Perlmutter JS, Campbell MC, Hurth KM, Schmidt RE, et al A quantitative study of α‐synuclein pathology in fifteen cases of dementia associated with Parkinson disease. J Neural Transm 2014; 121: 171–81 [DOI] [PMC free article] [PubMed] [Google Scholar]
- 12. Guella I, Evans DM, Szu‐Tu C, Nosova E, Bortnick SF; SNCA Cognition Study Group , et al α‐synuclein genetic variability: a biomarker for dementia in Parkinson disease. Ann Neurol 2016; 79: 991–9. [DOI] [PubMed] [Google Scholar]
- 13. Shahnawaz M, Tokuda T, Waragai M, Mendez N, Ishii R, Trenkwalder C, et al Development of a biochemical diagnosis of Parkinson disease by detection of α‐synuclein misfolded aggregates in cerebrospinal fluid. JAMA Neurol 2017; 74: 163–72 [DOI] [PubMed] [Google Scholar]
- 14. Menéndez‐González M, Padilla‐Zambrano HS, Tomás‐Zapico C, García BF. Clearing extracellular alpha‐synuclein from cerebrospinal fluid: a new therapeutic strategy in Parkinson's disease. Brain Sci 2018; 8: E52 [DOI] [PMC free article] [PubMed] [Google Scholar]
- 15. Saborio GP, Permanne B, Soto C. Sensitive detection of pathological prion protein by cyclic amplification of protein misfolding. Nature 2001; 411: 810–13 [DOI] [PubMed] [Google Scholar]
- 16. Saá P, Castilla J, Soto C. Ultra‐efficient replication of infectious prions by automated protein misfolding cyclic amplification. J Biol Chem 2006; 281: 35245–52 [DOI] [PubMed] [Google Scholar]
- 17. Salvadores N, Shahnawaz M, Scarpini E, Tagliavini F, Soto C. Detection of misfolded Aβ oligomers for sensitive biochemical diagnosis of Alzheimer's disease. Cell Rep 2014; 7: 261–8 [DOI] [PubMed] [Google Scholar]
- 18. Mollenhauer B, Trautmann E, Sixel‐Döring F, Wicke T, Ebentheuer J, Schaumburg M, et al Nonmotor and diagnostic findings in subjects with de novo Parkinson disease of the DeNoPa cohort. Neurology 2013; 81: 1226–34 [DOI] [PubMed] [Google Scholar]
- 19. Hoehn MM, Yahr MD. Parkinsonism: onset, progression and mortality. Neurology 1967; 17: 427–42 [DOI] [PubMed] [Google Scholar]
- 20. Hentz JG, Mehta SH, Shill HA, Driver‐Dunckley E, Beach TG, Adler CH. Simplified conversion method for unified Parkinson's disease rating scale motor examinations. Mov Disord 2015; 30: 1967–70 [DOI] [PMC free article] [PubMed] [Google Scholar]
- 21. Folstein MF, Folstein SE, McHugh PR. ‘Mini‐mental state’: a practical method for grading the cognitive state of patients for the clinician. J Psychiatr Res 1975; 12: 189–98 [DOI] [PubMed] [Google Scholar]
- 22. Hensel A, Angermeyer MC, Riedel‐Heller SG. Measuring cognitive change in older adults: reliable change indices for the Mini‐Mental State Examination. J Neurol Neurosurg Psychiatry 2007; 78: 1298–303 [DOI] [PMC free article] [PubMed] [Google Scholar]
- 23. Tombaugh TN. Test‐retest reliable coefficients and 5‐year change scores for the MMSE and 3MS. Arch Clin Neuropsychol 2005; 20: 485–503 [DOI] [PubMed] [Google Scholar]
- 24. Shulman LM, Gruber‐Baldini AL, Anderson KE, Fishman PS, Reich SG, Weiner WJ. The clinically important difference on the unified Parkinson's disease rating scale. Arch Neurol 2010; 67: 64–70 [DOI] [PubMed] [Google Scholar]
- 25. Roberts HL, Brown DR. Seeking a mechanism for the toxicity of oligomeric α‐synuclein. Biomolecules 2015; 5: 282–305 [DOI] [PMC free article] [PubMed] [Google Scholar]
- 26. Rockenstein E, Nuber S, Overk CR, Ubhi K, Mante M, Patrick C, et al Accumulation of oligomer‐prone α‐synuclein exacerbates synaptic and neuronal degeneration in vivo. Brain 2014; 137: 1496–513 [DOI] [PMC free article] [PubMed] [Google Scholar]
- 27. Tokuda T, Qureshi MM, Ardah MT, Varghese S, Shehab SA, Kasai T, et al Detection of elevated levels of α‐synuclein oligomers in CSF from patients with Parkinson disease. Neurology 2010; 75: 1766–72 [DOI] [PubMed] [Google Scholar]
- 28. Hansson O, Hall S, Ohrfelt A, Zetterberg H, Blennow K, Minthon L, et al Levels of cerebrospinal fluid α‐synuclein oligomers are increased in Parkinson's disease with dementia and dementia with Lewy bodies compared to Alzheimer's disease. Alzheimers Res Ther 2014; 6: 25 [DOI] [PMC free article] [PubMed] [Google Scholar]
- 29. Compta Y, Valente T, Saura J, Segura B, Iranzo Á, Serradell M, et al Correlates of cerebrospinal fluid levels of oligomeric‐ and total‐α‐synuclein in premotor, motor and dementia stages of Parkinson's disease. J Neurol 2015; 262: 294–306 [DOI] [PubMed] [Google Scholar]
- 30. Compta Y, Martí MJ, Ibarretxe‐Bilbao N, Junqué C, Valldeoriola F, Muñoz E, et al Cerebrospinal tau, phospho‐tau, and beta‐amyloid and neuropsychological functions in Parkinson's disease. Mov Disord 2009; 24: 2203–10 [DOI] [PubMed] [Google Scholar]
- 31. Alves G, Brønnick K, Aarsland D, Blennow K, Zetterberg H, Ballard C, et al CSF amyloid‐beta and tau proteins, and cognitive performance, in early and untreated Parkinson's disease: the Norwegian ParkWest study. J Neurol Neurosurg Psychiatry 2010; 81: 1080–6 [DOI] [PubMed] [Google Scholar]
- 32. Siderowf A, Xie SX, Hurtig H, Weintraub D, Duda J, Chen‐Plotkin A, et al CSF amyloid beta 1–42 predicts cognitive decline in Parkinson disease. Neurology 2010; 75: 1055–61 [DOI] [PMC free article] [PubMed] [Google Scholar]
- 33. Irwin DJ, White MT, Toledo JB, Xie SX, Robinson JL, Van Deerlin V, et al Neuropathologic substrates of Parkinson disease dementia. Ann Neurol 2012; 72: 587–98 [DOI] [PMC free article] [PubMed] [Google Scholar]
- 34. Compta Y, Pereira JB, Ríos J, Ibarretxe‐Bilbao N, Junqué C, Bargalló N, et al Combined dementia‐risk biomarkers in Parkinson's disease: a prospective longitudinal study. Parkinsonism Relat Disord 2013; 19: 717–24 [DOI] [PubMed] [Google Scholar]
- 35. Compta Y, Parkkinen L, O'Sullivan SS, Vandrovcova J, Holton JL, Collins C, et al Lewy‐ and Alzheimer‐type pathologies in Parkinson's disease dementia: which is more important? Brain 2011; 134: 1493–505 [DOI] [PMC free article] [PubMed] [Google Scholar]
- 36. Petersen RC, Lopez O, Armstrong MJ, Getchius TSD, Ganguli M, Gloss D, et al Practice guideline update summary: mild cognitive impairment: report of the guideline development, dissemination, and implementation Subcommittee of the American Academy of Neurology. Neurology 2018; 90: 126–35 [DOI] [PMC free article] [PubMed] [Google Scholar]
- 37. Li X, Yang W, Li X, Chen M, Liu C, Yu S. Age‐dependent elevations of oligomeric and phosphorylated alpha‐synuclein synchronously occurs in the brain and gastrointestinal tract of cynomolgus monkeys. Neurosci Lett 2018; 662: 276–82 [DOI] [PubMed] [Google Scholar]
Associated Data
This section collects any data citations, data availability statements, or supplementary materials included in this article.
Supplementary Materials
Table S1. Characteristics of the patients with cognitive decline and the patients without cognitive decline.
Table S2. Characteristics of the patients with motor decline and the patients without motor decline.
Data Availability Statement
Because this is a part of an ongoing study, the data cannot be shared at present.