Abstract
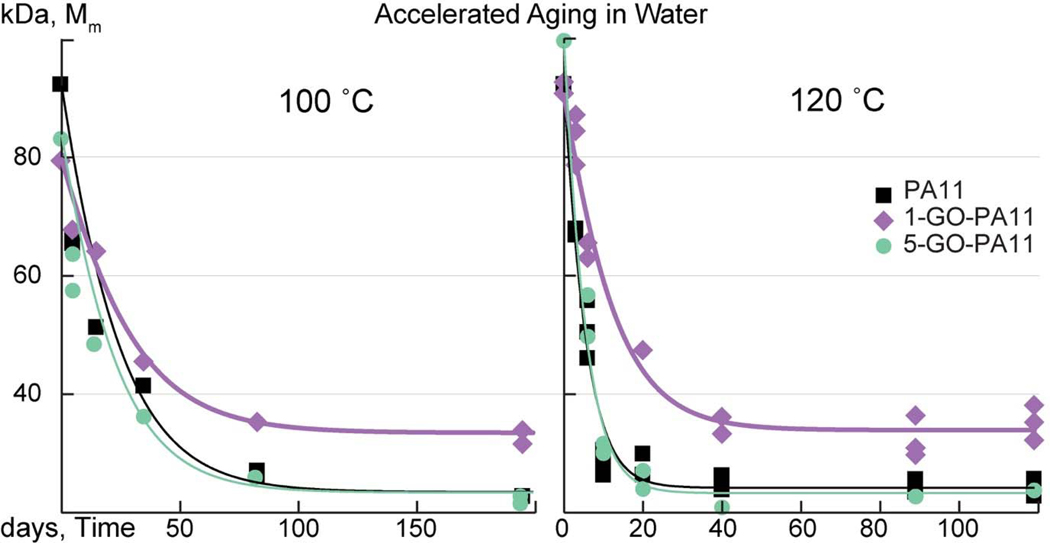
Graphene oxide (GO) was incorporated into polyamide-11 (PA11) via in-situ polymerization. The GO-PA11 nano-composite had elevated resistance to hydrolytic degradation. At a loading of 1 mg/g, GO to PA11, the accelerated aging equilibrium molecular weight of GO-PA11 was higher (33 and 34 kDa at 100 and 120 °C, respectively) compared to neat PA11 (23 and 24 kDa at 100 and 120 °C, respectively). Neat PA11 had hydrolysis rate constants (kH) of 2.8 and 12 (×10−2 day−1) when aged at 100 and 120 °C, respectively, and re-polymerization rate constants (kP) of 5.0 and 23 (×10−5 day−1), respectively. The higher equilibrium molecular weight for GO-PA11 loaded at 1 mg/g was the result of a decreased kH, 1.8 and 4.5 (×10−2 day−1), and an increased kP, 10 and 17 (×10−5 day−1) compared with neat PA11 at 100 and 120 °C, respectively. The decreased rate of degradation and resulting 40 % increased equilibrium molecular weight of GO-PA11 was attributed to the highly asymmetric planar GO nano-sheets that inhibited the molecular mobility of water and the polymer chain. The crystallinity of the polymer matrix was similarly affected by a reduction in chain mobility during annealing due to the GO nanoparticles’ chemistry and highly asymmetric nano-planar sheet structure.
Introduction
Polyamide-11 (PA11) is a widely-used engineering polymer. PA11 comprises the pressure sheath liner in contact with the production fluid at elevated temperature and pressure in flexible hoses for underwater transport of gas, oil, and crude to offshore platforms. As such, PA11 fulfills a vital role in the global economy. Degradation and failure of these hoses have far-reaching financial and environmental implications. Currently, the molecular weight of PA11 is used to predict the operational lifetimes of the PA11 liner [1, 2] where hydrolysis of PA11 is the mechanism for degradation in anaerobic environments such as the condition of underwater crude oil risers. Improving the properties of PA11 as a pressure sheath motivates research on the hydrolytic degradation of graphene oxide (GO) loaded PA11: GO-PA11 polymer nano-composite.
Polymer nanocomposites have become high potential alternatives to traditionally filled polymers or polymer blends [3]. Since Usuki, Kojima, Kawasumi, Okada, Fukushima, Kurauchi and Kamigaito [4], polymer nanocomposites have shown valuable performance property enhancements such as stiffness and thermal management at much lower percent mass loadings than often used glass and carbon fiber micron scale fillers. This lower percent mass loading can lead to cheaper processing and novel material solutions to engineering problems.
Graphene is an atomic single layer of carbon, a 2-D carbon-honeycomb crystal structure with remarkable properties. It would be advantageous if graphene’s properties; an extremely high modulus of 1 terapascal (TPa), an ultimate strength of 130 gigapascal (GPa), a gas impermeable honeycomb network, and superior electrical and thermal conductivity, [5, 6] - could be lent to polymers by means of creating graphene-polymer nanocomposites [3, 7–10]. The challenge is to disperse graphene as single nano-sheets into polar solvents, then into the polymer matrix.
A wide interest in graphene’s exceptional strength involves the analogous compound GO. GO has nearly the same strength and barrier properties as pristine graphene, given the very high aspect ratio planar honeycomb structure. GO has the same honeycomb structure as graphene with oxygen-containing functional groups on the surface of the planar carbon. These oxygen containing functional groups are ketones, 6-membered lactol rings, alcohols, epoxides, and hydroxyl groups [11]. As a result, GO is a polar hydrophilic material compared to graphene, which is nonpolar and hydrophobic. GO, unlike graphene, can be dispersed into water and solvents [8] commonly used in polymer precursor resins or mixtures to create GO-polymer nanocomposites. Also, the oxide groups on the GO surface can be reacted with functional groups for improved dispersion and incorporation into a polymer matrix.
Several methods of making graphitic oxide have been developed, starting with Brodie [12] in 1859, modified Brodie [13, 14], Staudenmaier [15], Hofmann [16], Hummers [17], modified Hummers [18], and most recently Tour [19] in 2010. Importantly, synthesis of graphitic oxide is suitable for industrial scale GO production [20, 21].
GO-polymer nanocomposites are easily made by exfoliating graphitic oxide into GO nanosheets using a compatible solvent in-situ with the polymer. Many GO-polymer nanocomposites have been made using polyurethanes, polyimides, polyamides, and other polymers [3, 7–10]. Properties reported to be improved by incorporating GO, functionalized GO, and functionalized graphene into polymers include: electrical conductivity [22–29], thermal conductivity [30, 31], thermal stability [22, 31–35], permeability [22–26, 29, 31–33, 36–41], and mechanical properties [22, 23, 26, 29, 31, 32, 34, 35, 38, 41–43]. Well dispersed GO nanoparticles in a polymer can change the chemical and morphological properties of the polymer, to result in significantly improved performance properties.
In previous research on GO-PA11, Jin, Rafiq, Gill and Song [38] extruded thermally reduced GO into commercial PA11 at loadings ranging from 1 to 30 mg/g reduced GO-PA11. They showed that water vapor and oxygen permeation resistance of PA11 films were increased by 49 % at a 1 mg/g loading and reported on the tensile properties of functionalized graphene loaded PA11. Yuan, Wang, Wang, Wang and Zhou [44] prepared 1.25 to 5 mg/g GO-PA11 by in- situ melt polycondensation and discussed improved toughness and correlated changes in crystal structures that were formed when GO was loaded into PA11.
In this work, the hydrolytic degradation of GO-PA11 and the effect GO had on the PA11 matrix crystallization was explored.
Methods and Measurements
GO was incorporated into PA11 via in-situ melt condensation polymerization (GO-PA11). Accelerated aging of PA11 and GO-PA11 was performed by immersing 0.3 mm thick × 1 cm2 samples in 15 mL of deionized water at elevated temperatures of 100 and 120 °C. The extent of hydrolytic degradation was measured by monitoring the change in mass averaged molecular weight (Mm) of PA11 over time. For PA11, a hydrolytic aging equilibrium molecular weight (Mme) was established after extended aging times in anaerobic conditions.
GO was synthesized using Hummers method [17], and dispersed in water by ultrasonication (Cole-Parmer EW-04711-40 homogenizer 750-Watt) for 30 minutes. The resulting solution of GO in water was filtered using G4 glass fiber filter paper (Fisher Scientific) to remove unreacted graphitic particles. The GO particle water dispersion was measured by mass to have a concentration of 0.3 mg/g. A Laurell: WS-650Sz-6NPP-Lite spin processor was used to apply a single layer of GO particles to V5 cleaved sheet of mica (Ted Pella). A NT-MDT NTEGRA atomic force microscope was used to characterize the dimensions of the GO sheets. The sheet sizes in the collected filtered GO/water dispersion were observed to be 0.3-1 μm laterally and 1 nm in height, Figure 1.
Figure 1:
AFM height image (from GO-water dispersion) distributed on mica.
Dry 11-aminoundecanoic acid powder was mixed with the filtered GO/water dispersion at a concentration of 1 and 5 mg of GO per gram of powder. Water was added to the mixture for a total volume of 15 mL. An ultrasonication tip was submerged in the mixture and sonication at 35 % of maximum power proceeded for 30 minutes with continuous stirring at 300 rpm and a maximum temperature of 30 °C.
The homogeneous golden-brown mixture of GO-monomer settled with a clear water supernatant. The mixture was poured into a Teflon® lined vessel and placed at 100 °C in an oven for 60 minutes. The dried powder was uniformly brown. The GO-monomer powder was placed under argon at 235 °C for 4 hours of melt condensation static polymerization with in-situ thermal reduction of GO’s carbon oxygen ratio [45], and thereby GO-PA11 was made. PA11 fabrication followed the same method. For convention, a concentration of 1 mg/g GO-PA11 was termed 1-GO-PA11 and 5 mg/g GO-PA11 was 5-GO-PA11.
Aging samples were prepared by slowly hot pressing the PA11 and GO-PA11 between two Teflon® surfaces at pressures up to 16 MPa at 250 °C under argon. The system was allowed to cool under flowing argon to room temperature. The approximate dimension of each film was 60 cm2 with a 300 μm thickness, 1 cm2 area coupons were cut from the films. For each material tested, ten coupons were immersed in deionized water over a period of 3 – 4 months at elevated temperature to accelerate aging. Two independent sets were studied at the temperatures of 100 and 120 °C. High-pressure rated #40 glass tubes with Teflon® plugs (Ace Glass) were used as containment vessels. Before sealing the pressure tubes, dissolved oxygen was removed by sparging the water with argon in-situ until the measured oxygen concentration dropped below 50 ppm (Oakton Waterproof DO 450 Optical Dissolved Oxygen Portable Meter). Samples were removed periodically from each pressure tube, and then each pressure tube was degassed and resealed for continued aging of the remaining samples.
Mass average molecular weight (Mm) was measured by in-line Shodex size exclusion chromatography columns (HFIP-LG, HFIP-805, and HFIP-803) paired with a Wyatt miniDAWN light scattering detector and Wyatt Optilab 803 dynamic refractive index detector. The miniDAWN had a laser wavelength of λ = 690 nm and three detection angles θ of 45, 90, and 135°. The solvent used to dissolve the PA11 samples was 1,1,1,3,3,3-hexafluroisopropan-2-ol (HFIP) doped with 0.05 M potassium tri-fluroacetate (KTFA) salt to remove nylon agglomerations [46]. The KTFA doped HFIP was degassed in the pump reservoir via constant helium sparge under atmospheric pressure. The polymer solution concentration was 2 mg/mL (PA11/KTFA-HFIP). A 100 μL aliquot of solution was injected for measurement. A dn/dc of 0.235 mL/g determined the concentration of the PA11 at each fraction per the refractive index measurement. The measured Mm values had a 6% error margin, determined by the standard deviation divided by the mean for six consecutive Mm measurements on a single solution of PA11.
The GO-PA11/KTFA-HFIP solutions were darkened by the presence of GO. All visible GO in each solution was removed by a 0.45 μm porosity polytetrafluoroethylene filter. Additionally, the 0.2 μm stainless steel frit column guard on the SEC-MALLS was unaffected by injections of clear solutions that were passed through the 0.45 μm filter. The unaffected 0.2 μm frit indicated that the polymer solutions being measured on the SEC-MALLS were free of GO contamination.
Differential scanning calorimetry (DSC) was used to measure the heat of fusion and re-crystallization in PA11. The DSC (TA Instruments Q20) was calibrated using indium. A ramp rate of 3 °C/min was used to heat, cool, and re-heat the samples under nitrogen from 40 to 220 °C. The integration limits were 140 to 200 °C for the heating ramps and 130 to 190 °C for the cooling ramp. The root of the peak onset maximum slope with the peak baseline set to zero was the fusion or crystallization onset temperature.
Optical microscopy images were taken with an IX71 Olympus Inverted microscope and a LUCPLFLN, 40x (0.6 NA) objective. Transmission bright field and cross polarized light images were taken. For PA11 and 1-GO-PA11, optical glass microscope slides were prepared by melt pressing the PA11 or GO-PA11 for 30 seconds at 250 °C under argon, then ambient cooling to room temperature under argon. The 5-GO-PA11 was sliced using a Leica Ultracut UCT Microtome to obtain a sample less than 150 nm, for optical transmission.
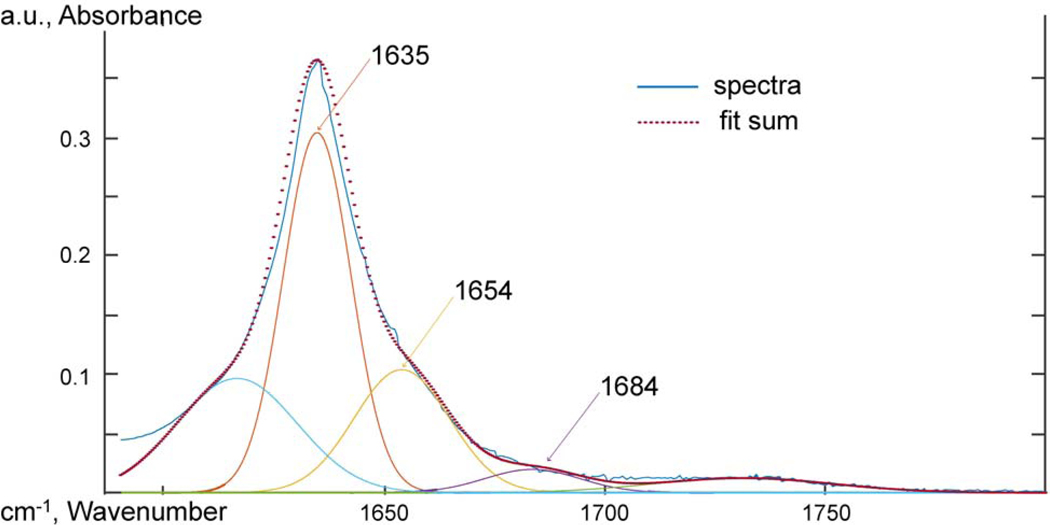
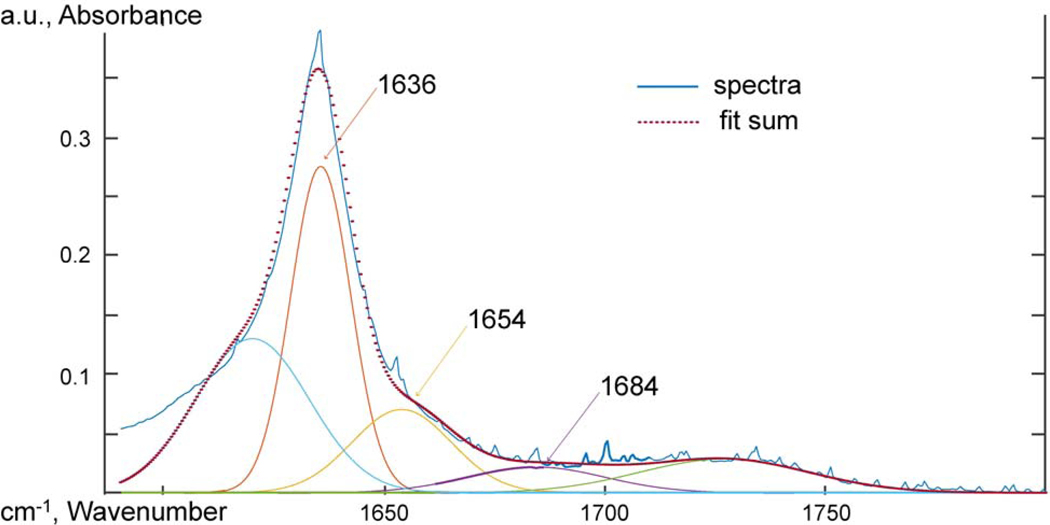
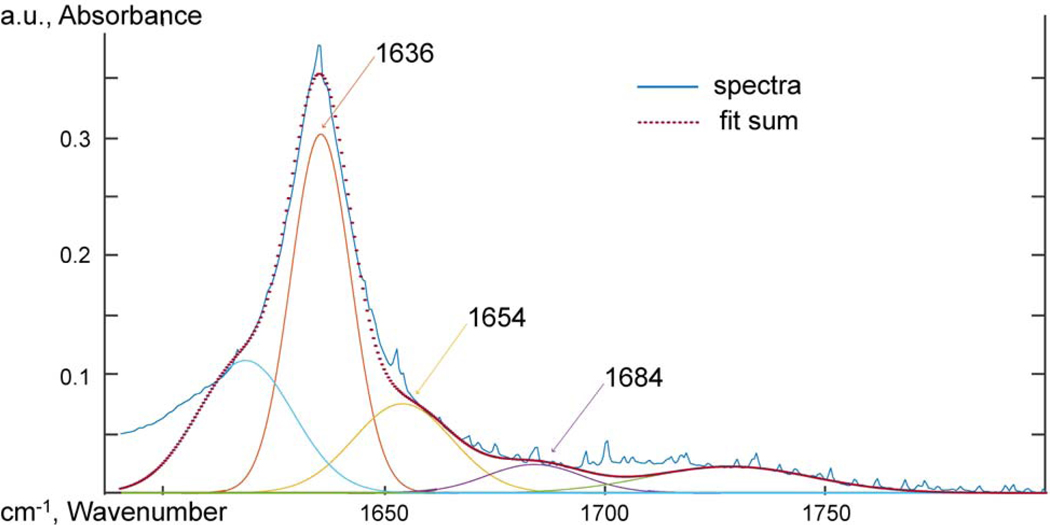
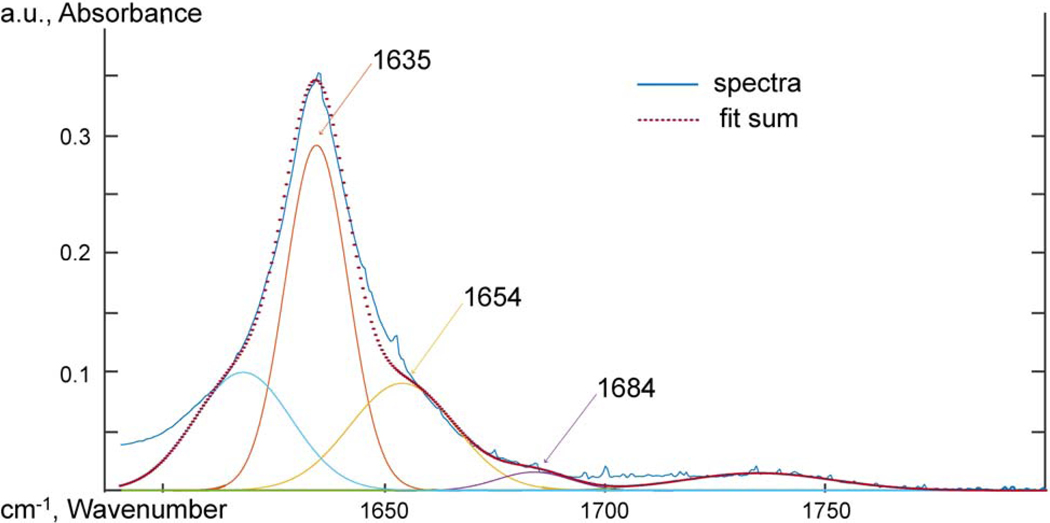
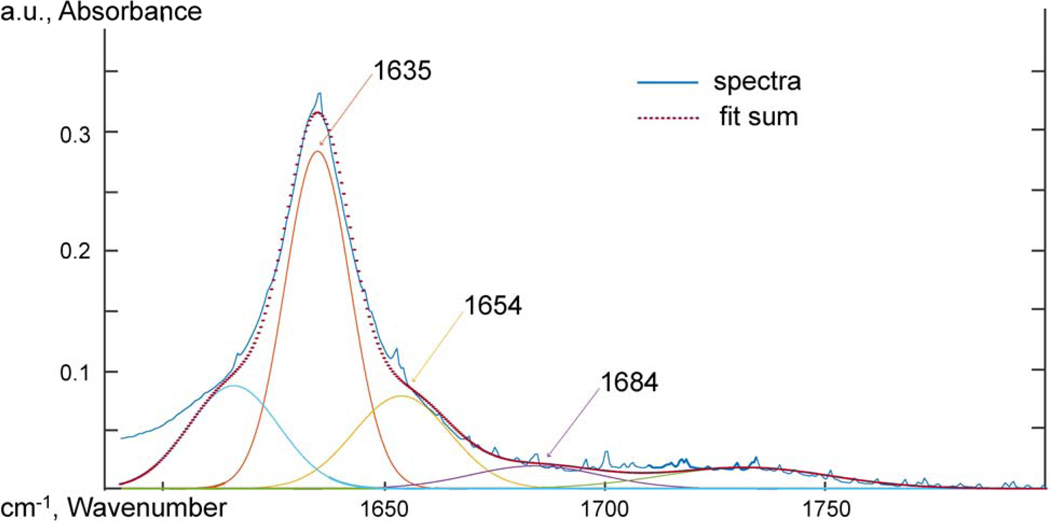
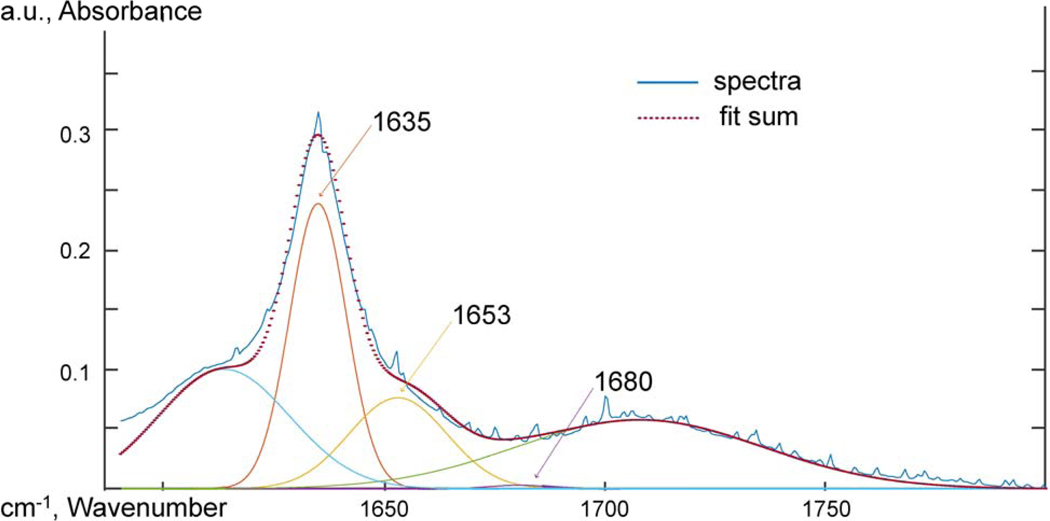
Attenuated total reflectance Fourier transform infrared spectroscopy (ATR-FTIR) was used to probe the chemical functional groups and intermolecular interactions. Spectra were taken using an IR Tracer-100 Shimadzu FTIR with a MIRacle 10 Single Reflectance ATR accessory at a resolution of 2 cm−1 from 600 to 4000 cm−1 and 32 scans were averaged. The spectra were adjusted to a common baseline and normalized to the 2851 cm−1 peak. To analyze the carbonyl oxygen peak, the work of Skrovanek, Painter and Coleman [47] was followed. The 1635 cm−1 carbonyl oxygen peak was deconvoluted using MagicPlot software, and the relative concentration of free and hydrogen bonded amide oxygen groups were measured at 1684, 1654, and 1635 cm−1. The heights of the deconvoluted peaks were used to compare the relative concentration of hydrogen bonded carbonyl oxygen groups. The half-height peak width of the 3304 cm−1 N-H absorption was also used to probe the hydrogen bonding behavior of the amide hydrogen.
The equilibrium molecular weight (Mme) hydrolysis rate constant (kH), and solid state polymerization (kP) rate constant were determined during accelerated molecular weight degradation by fitting the literature mathematical model of amide hydrolysis to the measured Mm per aging time [48–50]. The previously published model was derived from the condensation-hydrolysis kinetics described by Equation 2 and the associated first order ordinary differential Equation 7. The values kH and kP were fit to the changing values of molecular weight over time in days and reflected the effect of the aqueous aging environment on the hydrolysis process.
In the model, Equation 10, was derived from the hydrolysis kinetics of Equation 1 – 3, and the associated first order ordinary differential solution, Equation 9. The values kH and kP were fit to the changing values of molecular weight over time via the relationship described in Equation 10 where at was the average number of amide bonds at time t. Subscript “0” refered to the starting value, “e” refered to the equilibrium value, and “t” refered to the value associated at time t.
| Equation 1 |
| Equation 2 |
| Equation 3 |
| Equation 4 |
| Equation 5 |
| Equation 6 |
| Equation 7 |
| Equation 8 |
| Equation 9 |
| Equation 10 |
The hydrolysis degradation model in terms of the mass average number of amide bonds at time t (at) was defined by Equation 10. The derivation of Equation 10 started with the steady state approximation at equilibrium, Equation 3 [1, 49]. Then the concentration of water was assumed to be constant and thereby Equation 6 was used to form the first order ordinary differential Equation 7. At the steady state, equilibrium, dx/dt was defined to be zero and thereby rearranging Equation 7 in terms of of kP resulted in Equation 8. Equation 9 was the solution of the differential equation that resulted from substituting Equation 8 into Equation 7. Equation 10 was Equation 9 rearranged in terms of at.
Equation 5 established that at was proportional to the measured Mm by the molecular weight of the monomer. Using Equation 5, the changes in the Mm data over time were fit to Equation 10 to determine kH using a non-linear least squares fit. The model fit determined both the Mme and kH. Then, the best fit of Mme and kH were used in Equation 8 to calculate the re- polymerization rate constant kP.
Results and Discussion
The Mme of PA11 is very important to the performance properties of PA11. If the Mme is above the ductile-brittle transition Mm then PA11 can retain its ductility [1].
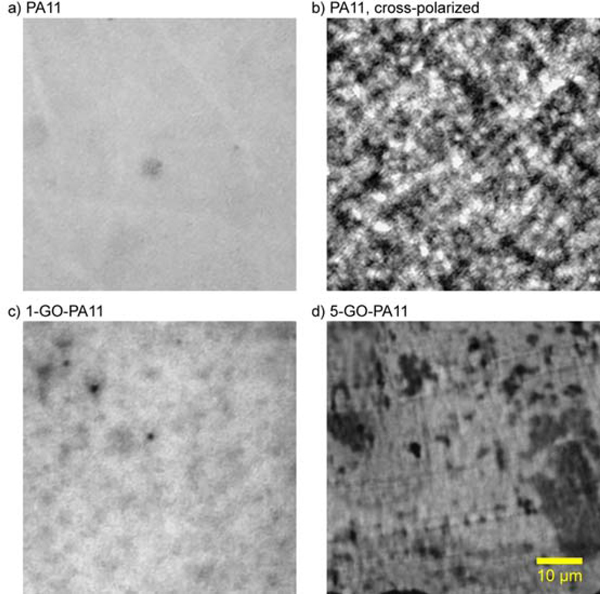
The Mme of 1-GO-PA11 was 10 kDa larger than that obtained for PA11 at both 100 and 120 °C, respectively. This was an impressive increase of 40 % at both temperatures. Using Equation 10 and a non-linear least squares fit, the kH and solid state kP rate constants were determined and listed in Table 1. Figure 2 and Table 1 showed that the kH of 1-GO-PA11 was reduced by a factor of 2 and the Mme of 1-GO-PA11 was increased by 40 % at both temperatures. At 120 °C, both kH and kP were reduced for 1-GO-PA11 compared with PA11. The higher loading, 5-GO-PA11 showed no change in the rate of hydrolytic degradation compared with PA11 at both temperatures. The absence of this effect at the higher concentration, 5-GO- PA11, was attributed to a poor nano-particle dispersion as shown in Figure 9. The optical images of 5-GO-PA11 showed that GO was highly agglomerated, the GO sheets were in contact with each other. This agglomeration resulted in no effect on the Mme compared with the finely dispersed GO in the 1-GO-PA11 nano-composite.
Table 1:
Rate constants and Mme for GO-PA11 aged in water; determined using Equation 8 and a non-linear least squares fit.
| Temperature, °C | GO Loading, mg/g | kH, × 10−2 day−1 | kP, × 10−5 day−1 | Mme, kDa |
|---|---|---|---|---|
| 100 | 0 | 2.8 ±0.5 | 5.0 ±1.5 | 24 ±3 |
| 1 | 1.8 ±0.5 | 10.0 ±4.0 | 34 ±4 | |
| 5 | 2.9 ±0.6 | 6.8 ±2.4 | 24 ±3 | |
| 120 | 0 | 12 ±2 | 23 ±7 | 24 ±3 |
| 1 | 4.5 ±1.1 | 17 ±5 | 34 ±3 | |
| 5 | 13 ±2 | 19 ±5 | 23 ±3 | |
Figure 2:
Mme of 1- GO-PA11 was approximately 10 kDa higher than PA11 and 5-GO-PA11 when aging in water at 100 °C and 120 °C, respectively.
Figure 9:
Transmission optical microscopy of PA11 bright field (a), cross-polarized (b), 1-GO-PA11 bright field 6c), and 5-GO-PA11 bright field (d). Each image is equivalently sized at 60 × 60 μm.
PA11 is a semicrystalline polymer. Amide hydrolysis in PA11 is understood to occur in the amorphous regions rather than the impermeable crystalline domains. A key component of the crystalline formation is hydrogen bonding. Hydrogen bonding in the PA11 matrix is an intermolecular interaction between the amide hydrogen and the carbonyl oxygen of a neighboring amide bond. Hydrogen bonding also occurs between nearby amide bonds in the amorphous regions. The hydrogen bonding between adjacent amide groups is responsible for the higher melting temperatures of polyamide crystalline structures versus a nonpolar semicrystalline polymer such as polyethylene.
Commercially prepared PA11 is plasticized with N-n-butylbenzenesulfonamide (BBSA) and shows a similar increase in the Mme over neat PA11 [48, 51]. The BBSA increases the amorphous content in PA11 by disrupting hydrogen bonding. The function of BBSA is to hydrogen bond with amide bonds and block intermolecular hydrogen bonding between neighboring amide bonds for lower crystallinity and increased amorphous content [52].
In the 1-GO-PA11, there were three species involved in the amide hydrolysis reaction: polyamide chains, GO, and water. The elementary chemical mechanisms for chain scission were identified: base catalyzed [53–57], acid catalyzed [58–61], and water assisted [62, 63]. The activation energies had been determined to be 21, 31, and 99 kJ/mol for the base catalyzed, acid catalyzed, and water assisted mechanisms of amide hydrolysis, respectively [64]. Computationally, Zahn [62] found activation energies of 66, 78, and 147 kJ/mol. Thus, given equivalent concentrations of OH− and H+ the base catalyzed pathway was favored; and the water assisted hydrolysis of an amide bond was the least favored pathway.
Figure 3 shows the initial resonance stabilization of the amide bond. Resonance stabilization chemically shortens and strengthens the amide bond.
Figure 3:
Elementary chemical mechanism of resonance stabilization of the amide bond.
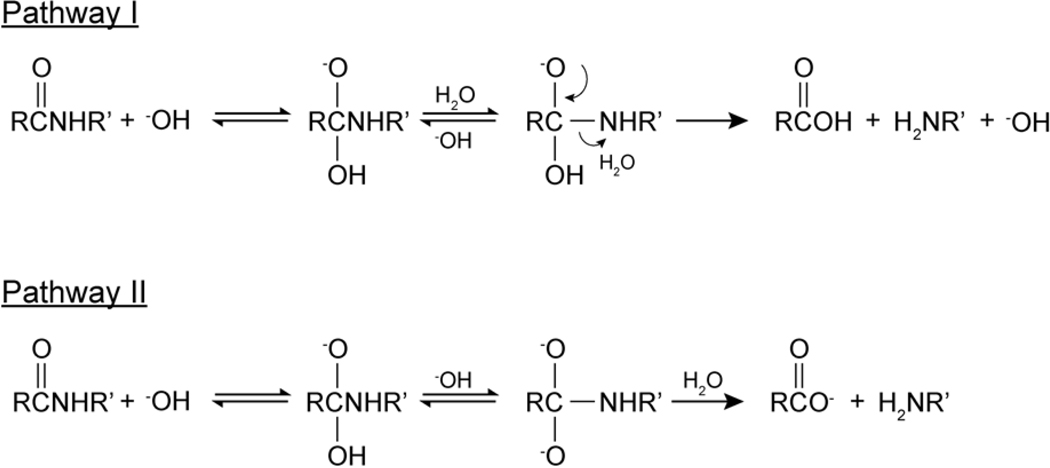
The base catalyzed hydrolysis mechanisms were drawn in Figure 4. Zahn [53] computationally studied the mechanism of base catalyzed hydrolysis of the amide bond, and found that the base catalyzed Pathway II was favored. Zahn [53] also found that a proton transfer reaction led to the simultaneous protonation of the amide nitrogen and deprotonation of the hydroxyl group. Since the amide anion was a poorer leaving group than an alkoxide ion, the base catalyzed hydrolysis the proton transfer to the amide anion was considered the rate limiting step [65, 66].
Figure 4:
Base catalyzed elementary chemical mechanism of amide hydrolysis.
The four-step acid catalyzed hydrolysis mechanism was drawn in Figure 5. The first step was the protonation of the carbonyl oxygen of the amide bond. Zahn [67] found in a computational study that the second step, nucleophilic attack of a water molecule to the carbon atom of the amide group, was the rate determining step. The third step was the intermediate deprotonation of the carbonyl oxygen and protonation of the amide nitrogen, quickly followed by the dissociation of the protonated amine and the carboxylic acid.
Figure 5:
Acid Catalyzed elementary chemical mechanism of amide hydrolysis.
The water assisted hydrolysis mechanism was drawn in Figure 6. The water assisted mechanism involved two water molecules that acted in a concerted process and utilized a Grotthuss mechanism of proton hopping through hydrogen bonding. The first step and rate determining step was the nucleophilic attack of the amide carbon and simultaneous protonation of the amide nitrogen [62].
Figure 6:
Elementary chemical mechanism for water assisted Hydrolysis of the amide bond.
The crystalline regions in PA11 were impermeable to water molecules: therefore, hydrolysis took place predominately in the molecularly mobile amorphous regions. Since GO-PA11 has a lower crystalline content, an increased percentage of amide bonds in the amorphous regions were expected to result in increased hydrolysis. However, the well dispersed 1-GO-PA11 showed unexpected decreases in the kH at both temperatures and a 40 % higher Mme than PA11, Figure 2.
From the amide bond hydrolysis elementary mechanisms for base hydrolysis Figure 4, acid hydrolysis Figure 5, and water assisted hydrolysis Figure 6, it was clear that both the availability of water molecules and hydrogen bonding were required for amide hydrolysis. Thus the BBSA’s disruption of inter-chain hydrogen bonding also inhibits hydrolysis. Changes in the hydrogen bonding behavior was another possible explanation for GO inhibiting the hydrolysis process in 1-GO-PA11, in addition to its large immobile nano-sheet structure that inhibited polymer chain and water mobility.
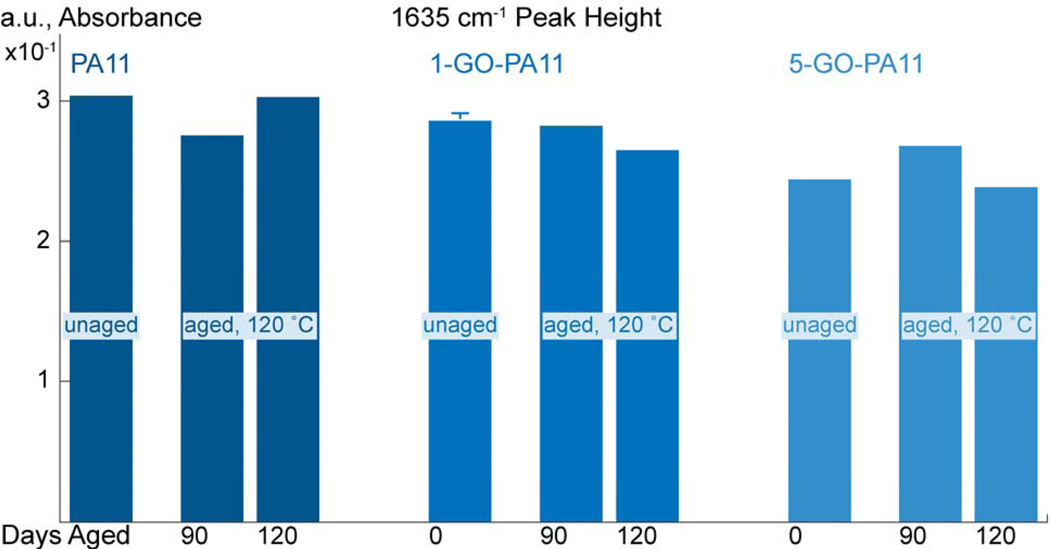
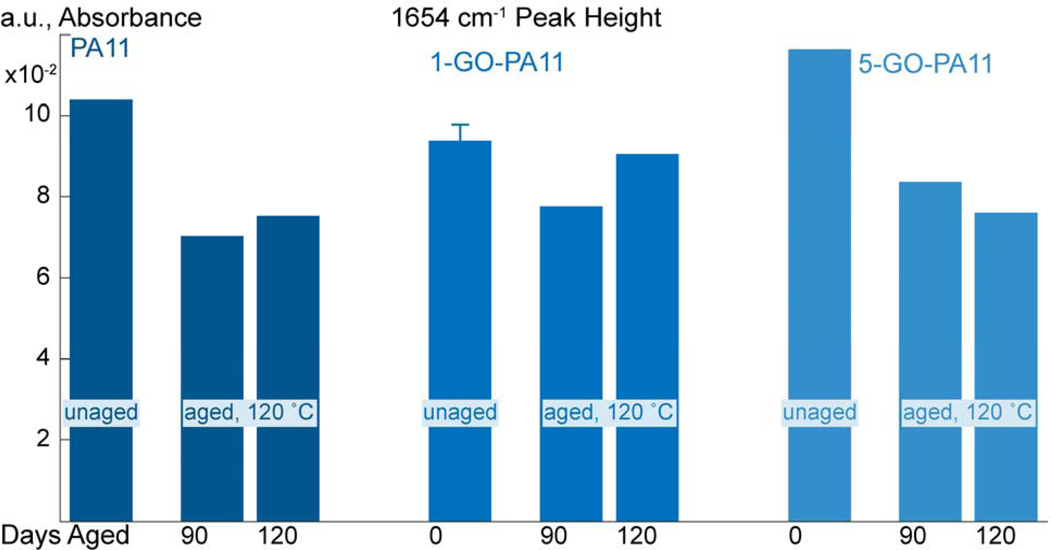
Skrovanek, Painter and Coleman [47] first studied the use of FTIR to detect hydrogen bonding interactions within a PA11 polymer. Skrovanek, Painter and Coleman [47] found de-convoluting the 1635 cm−1 peak of the carbonyl oxygen revealed three peaks that could be characterized at 1635, 1654, and 1684 cm−1. The 1635 cm−1 sub-peak was a lower energy carbonyl vibration correlated to aligned hydrogen bonding. The 1654 cm−1 peak was un-aligned amorphous hydrogen bound carbonyl oxygens. The 1684 cm−1 peak was correlated with carbonyl oxygen groups that were free of hydrogen bonding. The work of Skrovanek, Painter and Coleman [47] was followed to interpret the deconvoluted the amide bond 1635 cm−1 peak of the carbonyl oxygen. No difference was observed at the carbonyl oxygen peaks for PA11 and GO-PA11 from deconvolution of the 1635 cm−1 amide C=O. Further details were provided in the supplementary information.
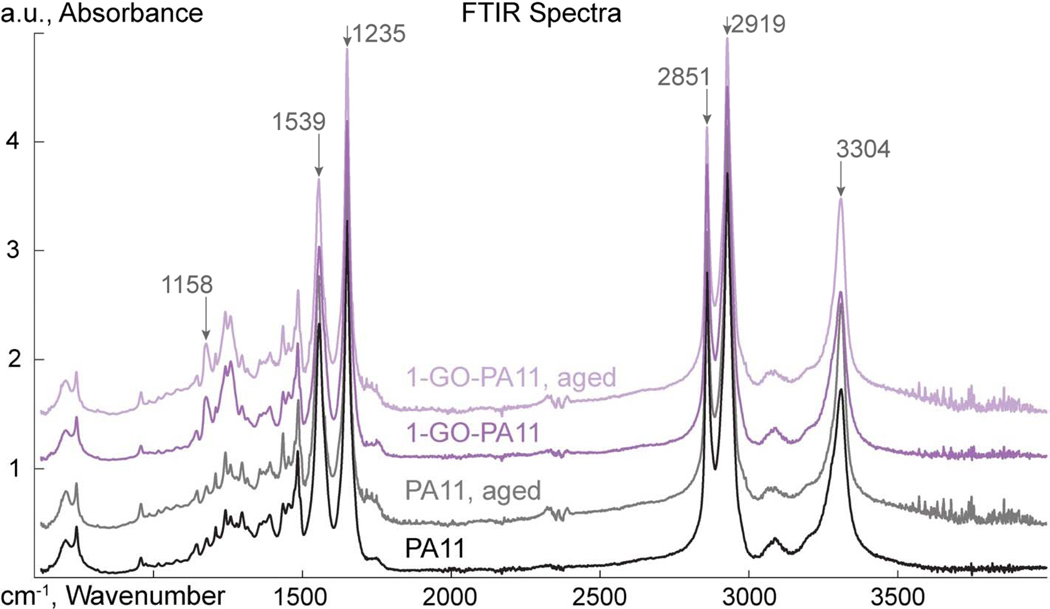
Infrared spectroscopy was used to probe the PA11 intermolecular interactions, and hydrogen bonding behavior at the amide bonds. Figure 7 shows the FTIR spectra for PA11 and 1-GO-PA11, pristine and aged. The characteristic peaks were: 1158 cm−1, an interaction of the N-H stretch and O=C-N deformation; 1539 cm−1, amide II C-N stretch; 1635 cm−1, amide I C=O stretch; 2851 cm−1, symmetric C-H aliphatic vibration; 2919 cm−1, asymmetric C-H aliphatic vibration; and 3304 cm−1, amide III N-H stretch.
Figure 7:
ATR-FTIR spectra of PA11 and 1-GO-PA11, and aged PA11 and aged 1-GO-PA11.
Figure 8 compared the half height peak widths of the 3304 cm−1 amide (N-H) stretching peak for the PA11 and 1-GO-PA11, pristine and aged. The peak widths were associated with the distribution of hydrogen bonding orientations of the amide bond hydrogen. With aging, PA11 showed a decline in the distribution of hydrogen bonding orientations; from 54 to 34 ± 2 cm−1. The 1-GO-PA11 showed less of a decline in the 3304 cm−1 peak widths; from 54 to 39 ± 2 cm−1. The broader distribution of hydrogen bonding orientations in the GO-PA11 had also been correlated previously to the lower overall crystallinity content [47].
Figure 8:
The peak widths centered at 3304 cm−1 for PA11, 1-GO-PA11, and 5-GO-PA11; and grouped by unaged and aged at 120 °C for 90 and 120 days, respectively. The 3304 cm−1 peak widths are associated with the distribution of hydrogen bonding orientations of the amide bond hydrogen.
In aged 1-GO-PA11 the N-H stretch had a broader distribution than aged PA11, Figure 8. Further 1-GO-PA11 had an increased intensity at the 1158 cm−1 peak, an interaction of the N-H stretch and O=C-N deformation. These results showed that the GO with C=O groups present on the surface [68] were interacting with the N-H amide hydrogen of polyamide. This interaction reduced the molecular mobility of the PA11 chain and thereby reduced the rate of hydrolysis and rate of the crystallization.
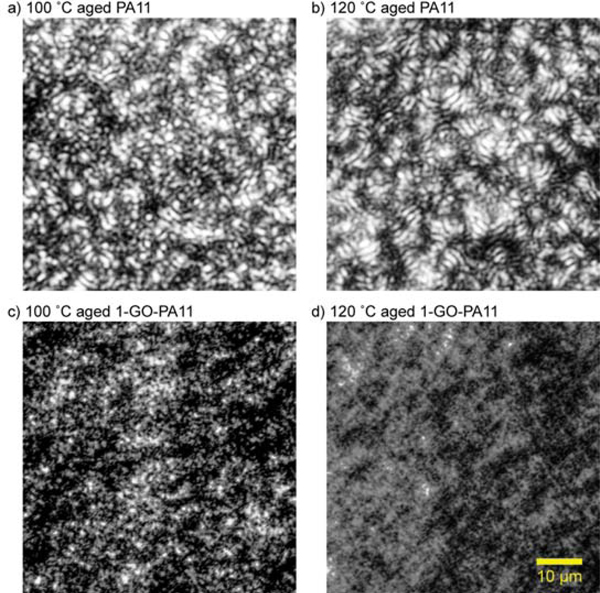
A transmission optical microscope was used in cross-polarization mode and the birefringence of the crystalline regions within PA11 and 1-GO-PA11 was observed. In transmission mode, the light passed through the sample. With cross polarizers, the birefringent and therefore visible crystalline regions of PA11 and 1-GO-PA11 were imaged. Figure 10 showed that well dispersed GO within the polymer matrix altered the crystalline morphology of PA11. The 1-GO-PA11 showed less birefringence than PA11. The aged PA11 showed the most birefringence, and banded spherulites, broader bands of birefringence, for both the 100 and 120 °C with widths of 0.94 ± 0.27 and 1.03 ± 0.15 μm, respectively. The banded spherulites were associated with bundling of laminar stacks and higher crystallinity [69, 70]. The larger bundled laminar stacks in aged PA11 were absent in the aged 1-GO-PA11 optical images. The bundles of laminar stacks in the 100 and 120 °C aged 1-GO-PA11 appeared much thinner with widths of 0.71 ± 0.18 and 0.67 ± 0.07 μm, respectively. Zhang, Yu and Fu [71] reported a similar crystalline behavior in montmorillonite-PA11 nanocomposites. These smaller crystalline domains agreed with the lower crystallinity DSC results for 1-GO-PA11 in Table 2.
Figure 10:
Cross polarized transmission optical microscopy images of 100 and 120 °C 80-90 days aged PA11 and 1-GO-PA11. Each image is equivalently sized at 60 × 60 μm.
Table 2:
Integration values of DSC heat flow peaks from 140 to 200°C for GO-PA11 and PA11, aged (80-90 days) and unaged samples. The error margin was 2.5 J/g per measurement and peak integration.
| Sample | GO Loading, mg/g | 1st Heat Ramp ΔHfus, J/g | Cooling Ramp ΔHc, J/g | 2nd Heat Ramp ΔHfus, J/g |
|---|---|---|---|---|
| Unaged | 0 | 47.5 | 50.0 | 48.0 |
| 1 | 46.5 | 42.5 | 49.0 | |
| 5 | 46.0 | 44.0 | 49.0 | |
| 100 °C | 0 | 63.0 | 60.0 | 60.0 |
| 1 | 53.0 | 50.0 | 55.0 | |
| 5 | 57.5 | 53.5 | 56.0 | |
| 120 °C | 0 | 91.0 | 65.5 | 61.0 |
| 1 | 82.0 | 53.5 | 59.0 | |
| 5 | 83.0 | 49.5 | 51.0 | |
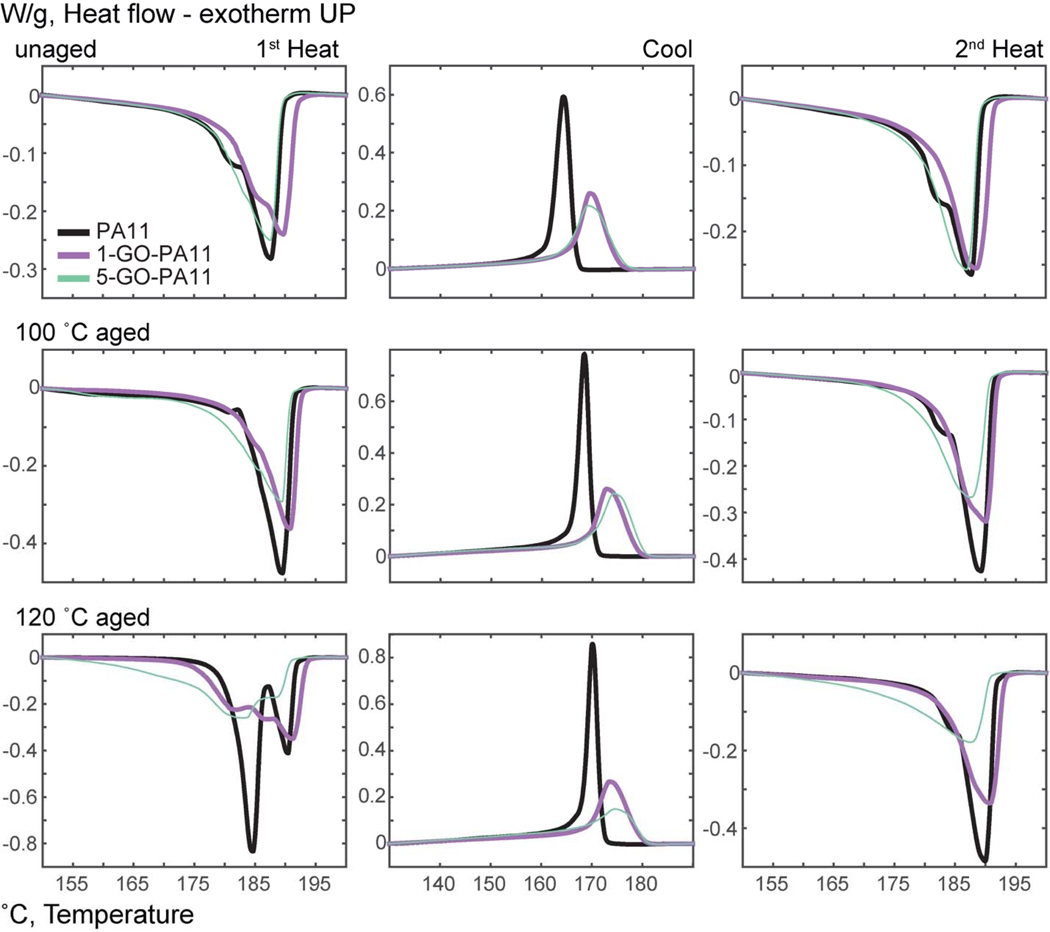
When fully dissociated and dispersed, the GO nanoparticles acted as large immobile 2-D nano-thin barriers within the PA11 matrix. Consequently, they were predicted to have inhibited molecular mobility within the polymer. As such, the results suggested that the GO nano-sheets reduced molecular mobility for both PA11 chains and water for less accessible hydrolysis sites. GO’s effect on the rate of crystallization was characterized in PA11 and GO-PA11 - unaged and aged using DSC, which provided evidence for GO’s role in reducing chain mobility. Nanoparticles had been known to affect the crystalline morphology of PA11 [44, 69, 72–80]. The DSC test was a heat, cool, heat sequence at 3 °C/min between 40 and 220 °C. Figure 11 showed the DSC curves of the unaged and 80-90 days aged samples in three columns from left to right to indicate the heat (fusion), cool (crystallization), and heat (fusion) curves. The peak integration values of specific heat of fusion (ΔHfus) and crystallization (ΔHc) were listed in Table 2.
Figure 11:
DSC scans for unaged, 100 °C, and 120 °C for 80-90 days aged PA11, 1-GO-PA11, and 5-GO-PA11. The 3 columns from left to right were 1st heat ramp from 40 °C to 220 °C, followed by a cool ramp to 40 °C, and a 2nd heat ramp to 220 °C. The rows top to bottom were unaged, 100 °C, and 120 °C aged samples.
The enthalpy of fusion, ΔHfus, is the heat required to melt the crystalline regions of PA11. In Table 2, a lower total ΔHfus indicated a decrease in the crystallinity of the GO-PA11 after heat, cool, and re-heat ramps. Peak and onset temperatures were respectively tabulated in Table 3 and Table 4 for the fusion and crystallization of PA11 and GO-PA11. The effect of the previous thermal history on the semicrystalline behavior of PA11 was revealed in the first heat ramp. The first heat ramp both revealed the previous thermal history on the semicrystalline behavior of PA11 and melted the PA11 to erase that previous thermal history. The 3 °C/min controlled cooling ramp measured the affect that GO has upon the crystallization behavior of PA11, both nucleation and growth. The second heating ramp compared how the total crystallization growth was affected by the GO loading.
Table 3:
DSC peak temperatures for GO-PA11 and PA11, aged (80-90 days) and unaged samples. The peak temperatures for melting(Tm,fus) and re-crystallization (Tm,c) were accurate within 0.5 °C.
| Sample | GO Loading, mg/g | 1st Heat Ramp Tm,fus, °C | Cooling Ramp Tm,c, °C | 2nd Heat Ramp Tm, fus, °C |
|---|---|---|---|---|
| Unaged | 0 | 187.5 | 166.5 | 187.5 |
| 1 | 190.0 | 169.5 | 188.5 | |
| 5 | 187.5 | 169.0 | 187.0 | |
| 100 °C | 0 | 189.5 | 168.5 | 189.5 |
| 1 | 191.0 | 173.0 | 190.0 | |
| 5 | 189.5 | 174.0 | 187.5 | |
| 120 °C | 0 | 184.5, 190.5 | 170.0 | 190.0 |
| 1 | 182.0, 187.0, 191.0 | 173.5 | 191.0 | |
| 5 | 183.0, 188.5 | 174.5 | 187.5 | |
Table 4:
DSC onset melting and formation temperatures for GO-PA11 and PA11, aged (80-90 days) and unaged samples. The onset melting(To,fus) and re-crystallization (To,c) temperatures were accurate within 0.5 °C.
| Sample | GO Loading, mg/g | 1st Heat Ramp To,fus, °C | Cooling Ramp To,c, °C | 2nd Heat Ramp To,fus, °C |
|---|---|---|---|---|
| Unaged | 0 | 175.5, 180.5 | 167.0 | 177.5, 178.5 |
| 1 | 178.5, 180.0 | 175.0 | 181.0 | |
| 5 | 175.0, 176.5 | 176.0 | 178.0 | |
| 100 °C | 0 | 182.5, 183.5 | 170.5 | 178.0, 183.0 |
| 1 | 179.5, 183.5 | 179.0 | 181.5 | |
| 5 | 177.5, 179.5 | 180.0 | 177.5 | |
| 120 °C | 0 | 181.0, 186.5 | 172.0 | 180.0, 184.5 |
| 1 | 174.0, 177.5, 181.5 | 179.5 | 182.5 | |
| 5 | 171.0 | 181.0 | 171.0 | |
During aging at 100 and 120 °C the PA11 matrix was annealed resulting in an increase in crystallinity. Quantified by the peak total area, the first heating ramp revealed the extent of annealing for the PA11 and GO-PA11 samples via their ΔHfus. Before aging, PA11 had 25% crystallinity, using 189 J/g as 100% crystalline PA11 [70]. Upon aging and annealing PA11 the crystallinity increased to 34 and 48% at 100 and 120 °C; a relative increase of 36 and 92%, respectively. The 1-GO-PA11 started with a crystallinity of 25% and had lower relative increases of 12 and 76% at the same annealing conditions.
These results showed that the GO nano-sheets hindered annealing in PA11 during aging at these temperatures. The 1-GO-PA11 samples had the lowest ΔHfus in both 100 and 120 °C conditions and indicated a large immobilizing effect on the polymer chains. The decreased effect of the 5-GO-PA11 was attributed to agglomeration and poor dispersion of 2-D nano- particles as previously described.
The melting temperatures (Tm,fus) in Table 3 for PA11 and GO-PA11 were indicative of the thermal stability of the polymer crystalline regions. A lower pre-peak Tm,fus, 184.5 °C, became increasingly prominent for the PA11 when aged at 120 °C. The 184.5 °C pre-peak was attributed to poorly formed crystalline structures [70, 71, 76, 81, 82]. As seen in Figure 11, the PA11 had the largest pre-peak at 184.5 °C in the first heating ramp after aging at 120 °C. Conversely, the poorly formed crystals were not favored in the 1-GO-PA11 and there was an additional intermediate melting peak at Tm,fus 187.0 °C. The highest Tm,fus of 191.5 °C indicated that the annealed GO-PA11 had the most stable crystalline structure. The increased annealed crystalline melt temperature after aging suggested intermolecular attractive interactions between the GO sheets and the polyamide matrix as was seen in the ATR-FTIR spectra.
After the first heating ramp on the DSC, the polymer sample melted and its thermal history erased. With controlled cooling the heat of re-crystallization (ΔHc) can be characterized. The decrease in the ΔHc for GO-PA11 compared to PA11 indicated that the chain mobility was inhibited by the inclusion of GO nanoparticles.
The GO-PA11 had a higher onset temperature of re-crystallization during the cooling ramp (To,c) and lower ΔHc value than PA11, Table 4. The pristine PA11 had a To,c of 167 °C that increased to 170 (+2%) and 172 (+3%) °C after aging at 100 and 120 °C. The increase in To,c after aging correlated to lower molecular weights. For a polyamide, crystalline regions form more quickly at lower molecular weights due to increased mobility and ease of alignment of the shorter polymer chains [83]. Both GO-PA11 showed a 9 °C higher To,c with a broader reaction peak than unloaded PA11. The 1-GO-PA11 samples initially had a To,c of 175 °C. After aging at 100 °C, the To,c increased to 179 (+2%) °C; and aging at 120 °C increased the To,c to 180 (+3%) °C. The increased To,c of the GO-PA11 samples were evidence that the GO nanoparticles were nucleating sites resulting in higher crystallization onset temperatures.
In summary the large immobile GO, a 2-dimensional sheet in the amorphous phase, in addition to inhibiting molecular mobility, competed for hydrogen bonding with the polyamide’s amide hydrogens. Both effects inhibited hydrolysis of the amide bond. It is the decrease in chain and water molecular mobility combined with hydrogen bonding interactions between GO and the N-H bonds of the polymer chains that led to a lower hydrolysis rate for the well dispersed 1-GO-PA11, Table 1. The effects of GO’s large sheet shape and its surface functional groups interacting with the polymer chain, were similarly shown to have reduced polymer chain mobility in polyimide [84].
Summary & Conclusion
A concentration of 1 mg/g GO in PA11 produced a 40% increase over PA11’s equilibrium molecular weight when aged in water at 100 and 120 °C, respectively. No change was observed in the 5 mg/g GO-PA11 due to GO agglomeration. A similar increased equilibrium molecular weight occurs in the plasticized commercial PA11. Fitting the previously reported kinetic model to aging results showed an increase in equilibrium molecular weight, when the GO particles were well dispersed. This was due to a reduction in the model’s hydrolytic rate constant relative that for re-polymerization.
Measured by the heat of fusion, GO-PA11’s decreased crystallization indicated that the GO decreased molecular mobility within the nanocomposite, specifically the polymer chain molecular mobility during the annealing process. Both 1-GO-PA11 and 5-GO-PA11 nanocomposites showed a slight decrease in the amount of PA11 crystallinity prior to aging. Upon aging at both 100 and 120 °C, the GO-PA11 had significantly less crystallinity and demonstrated a reduction in the rate of annealing. After removing the thermal history by heating above the melting temperature and cooling, the materials were nearly comparable and suggested no effect on the crystallinity. The decrease in the annealing rate of crystallization in the aged samples was attributed to GO’s large immobile nano thickness sheet structure, which inhibited chain molecular mobility within the polymer nano-composite.
ATR-FTIR spectra showed that the graphene oxide’s surface C=O groups hydrogen bond with the polyamide’s N-H groups. This interaction further inhibited polymer mobility.
Two factors, the large immobile nano thin GO sheets and the intermolecular interaction between the GO’s surface C=O groups with the polyamide’s N-H groups significantly reduced molecular mobility in the GO-polymer resulted in a reduction in the rate of crystallization and most importantly the rate of degradation by hydrolysis.
Supplementary Material
Figure 12:
The deconvoluted peak heights centered at 1635 cm−1 are grouped based on material; PA11, 1-GO-PA11, and 5-GO- PA11; then by unaged and aged at 120 °C for 90 and 120 days.
Figure 13:
The deconvoluted peak heights centered at 1654 cm−1 are grouped based on material; PA11, 1-GO-PA11, and 5-GO-PA11; then by unaged and aged at 120 °C for 90 and 120 days.
Figure 14:
The deconvoluted peak heights centered at 1684 cm−1are grouped based on material; PA11, 1-GO-PA11, and 5-GO-PA11; then by unaged and aged at 120 °C for 90 and 120 days.
Figure 15:
PA11, ATR-FTIR spectra between 1590 and 1800 cm−1 deconvoluted using Gaussian peak shapes at 1635, 1654, and 1684 cm−1.
Figure 16:
PA11 aged 90 days at 120 °C, ATR-FTIR spectra between 1590 and 1800 cm−1 deconvoluted using Gaussian peak shapes at 1635, 1654, and 1684 cm−1.
Figure 17:
PA11 aged 120 days at 120 °C, ATR-FTIR spectra between 1590 and 1800 cm−1 deconvoluted using Gaussian peak shapes at 1635, 1654, and 1684 cm−1.
Figure 18:
1-GO-PA11, ATR-FTIR spectra between 1590 and 1800 cm−1 deconvoluted using Gaussian peak shapes at 1635, 1654, and 1684 cm−1.
Figure 19:
1-GO-PA11 aged for 90 days at 120 °C, ATR-FTIR spectra between 1590 and 1800 cm−1 deconvoluted using Gaussian peak shapes at 1635, 1654, and 1684 cm−1.
Figure 20:
1-GO-PA11 aged 120 days at 120 °C, ATR-FTIR spectra between 1590 and 1800 cm−1 deconvoluted using Gaussian peak shapes at 1635, 1654, and 1684 cm−1.
Figure 21:
5-GO-PA11, ATR-FTIR spectra between 1590 and 1800 cm−1 deconvoluted using Gaussian peak shapes at 1635, 1654, and 1684 cm−1.
Figure 22:
5-GO-PA11 aged 90 days at 120 °C, ATR-FTIR spectra between 1590 and 1800 cm−1 deconvoluted using Gaussian peak shapes at 1635, 1654, and 1684 cm−1.
Figure 23:
5-GO-PA11 aged 120 days at 120 °C, ATR-FTIR spectra between 1590 and 1800 cm−1 deconvoluted using Gaussian peak shapes at 1635, 1654, and 1684 cm−1.
References
- [1].Meyer A, Jones N, Lin Y, Kranbuehl D, Characterizing and Modeling the Hydrolysis of Polyamide-11 in a pH 7 Water Environment, Macromolecules 35(7) (2002) 2784–2798. [Google Scholar]
- [2].API, Technical Report 17TR2, The Ageing of PA-11 in Flexible Pipes, American Petroleum Institute, Washington, DC, 2003. [Google Scholar]
- [3].Potts JR, Dreyer DR, Bielawski CW, Ruoff RS, Graphene-based polymer nanocomposites, Polymer 52(1) (2011) 5–25. [Google Scholar]
- [4].Usuki A, Kojima Y, Kawasumi M, Okada A, Fukushima Y, Kurauchi T, Kamigaito O, Synthesis of nylon 6-clay hybrid, Journal of Materials Research 8(5) (1993) 1179–1184. [Google Scholar]
- [5].Bunch JS, Verbridge SS, Alden JS, van der Zande AM, Parpia JM, Craighead HG, McEuen PL, Impermeable Atomic Membranes from Graphene Sheets, Nano Letters 8(8) (2008) 2458–2462. [DOI] [PubMed] [Google Scholar]
- [6].Leenaerts O, Partoens B, Peeters FM, Graphene: A perfect nanoballoon, Applied Physics Letters 93(19) (2008) 193107-4. [Google Scholar]
- [7].Dhand V, Rhee KY, Ju Kim H, Ho Jung D, A Comprehensive Review of Graphene Nanocomposites: Research Status and Trends, Journal of Nanomaterials 2013(1) (2013) 1–14. [Google Scholar]
- [8].Kim H, Abdala AA, Macosko CW, Graphene/Polymer Nanocomposites, Macromolecules 43(16) (2010) 6515–6530. [Google Scholar]
- [9].Mittal V, Functional Polymer Nanocomposites with Graphene: A Review, Macromolecular Materials and Engineering 299(8) (2014) 906–931. [Google Scholar]
- [10].Yoo BM, Shin HJ, Yoon HW, Park HB, Graphene and Graphene Oxide and Their Uses in Barrier Polymers, Journal of Applied Polymer Science 131(1) (2014) 39628–39651. [Google Scholar]
- [11].Dreyer DR, Park S, Bielawski CW, Ruoff RS, The chemistry of graphene oxide, Chem. Soc. Rev 39(1) (2010) 228–240. [DOI] [PubMed] [Google Scholar]
- [12].Brodie BC, On the Atomic Weight of Graphite, Phil. Trans. R. Soc. Lond 149 (1859) 249–259. [Google Scholar]
- [13].Kuila T, Khanra P, Mishra AK, Kim NH, Lee JH, Functionalized-graphene/ethylene vinyl acetate co-polymer composites for improved mechanical and thermal properties, Polymer Testing 31(2) (2012) 282–289. [Google Scholar]
- [14].Terrones M, Martín O, González M, Pozuelo J, Serrano B, Cabanelas JC, Vega-Díaz SM, Baselga J, Interphases in Graphene Polymer-based Nanocomposites: Achievements and Challenges, Advanced Materials 23(44) (2011) 5302–5310. [DOI] [PubMed] [Google Scholar]
- [15].Staudenmaier L, Verfahren zur Darstellung der Graphitsäure, Berichte der deutschen chemischen Gesellschaft 31(2) (1898) 1481–1487. [Google Scholar]
- [16].Hofmann U, König E, Untersuchungen über Graphitoxyd, Zeitschrift für anorganische und allgemeine Chemie 234(4) (1937) 311–336. [Google Scholar]
- [17].Hummers WS Jr, Offeman RE, Preparation of Graphitic Oxide, Journal of the American Chemical Society 80(6) (1958) 1339. [Google Scholar]
- [18].Kovtyukhova NI, Ollivier PJ, Martin BR, Mallouk TE, Chizhik SA, Buzaneva EV, Gorchinskiy AD, Layer-by-Layer Assembly of Ultrathin Composite Films from Micron-Sized Graphite Oxide Sheets and Polycations, Chemistry of Materials 11(3) (1999) 771–778. [Google Scholar]
- [19].Marcano DC, Kosynkin DV, Berlin JM, Sinitskii A, Sun Z, Slesarev A, Alemany LB, Lu W, Tour JM, Improved Synthesis of Graphene Oxide, ACS Nano 4(8) (2010) 4806–4814. [DOI] [PubMed] [Google Scholar]
- [20].Zhao J, Pei S, Ren W, Gao L, Cheng H-M, Efficient Preparation of Large-Area Graphene Oxide Sheets for Transparent Conductive Films, ACS Nano 4(9) (2010) 5245–5252. [DOI] [PubMed] [Google Scholar]
- [21].Robinson JT, Zalalutdinov M, Baldwin JW, Snow ES, Wei Z, Sheehan P, Houston BH, Wafer-scale Reduced Graphene Oxide Films for Nanomechanical Devices, Nano Letters 8(10) (2008) 3441–3445. [DOI] [PubMed] [Google Scholar]
- [22].Adelnia H, Gudarzi MM, Gavgani JN, Intumescent flame retardant polyurethane/reduced graphene oxide composites with improved mechanical, thermal, and barrier properties, Journal of Materials Science 49(1) (2013) 243–254. [Google Scholar]
- [23].Kim H, Miura Y, Macosko CW, Graphene/Polyurethane Nanocomposites for Improved Gas Barrier and Electrical Conductivity, Chemistry of Materials 22(11) (2010) 3441–3450. [Google Scholar]
- [24].Kim H, Macosko CW, Processing-property relationships of polycarbonate/graphene composites, Polymer 50(15) (2009) 3797–3809. [Google Scholar]
- [25].Liu H, Kuila T, Kim NH, Ku B-C, Lee JH, In situ synthesis of the reduced graphene oxide–polyethyleneimine composite and its gas barrier properties, J. Mater. Chem. A 1(11) (2013) 3739–3746. [Google Scholar]
- [26].Park O-K, Kim S-G, You N-H, Ku B-C, Hui D, Lee JH, Synthesis and properties of iodo functionalized graphene oxide/polyimide nanocomposites, Composites Part B 56 (2014) 365–371. [Google Scholar]
- [27].Stankovich S, Dikin DA, Dommett GHB, Kohlhaas KM, Zimney EJ, Stach EA, Piner RD, Nguyen ST, Ruoff RS, Graphene-based composite materials, Nature 442(7100) (2006) 282–286. [DOI] [PubMed] [Google Scholar]
- [28].Zheng D, Tang G, Zhang H-B, Yu Z-Z, Yavari F, Koratkar N, Lim S-H, Lee M-W, In situ thermal reduction of graphene oxide for high electrical conductivity and low percolation threshold in polyamide 6 nanocomposites, Composites Science and Technology 72(2) (2012) 284–289. [Google Scholar]
- [29].Zhu J, Lim J, Lee C-H, Joh H-I, Kim HC, Park B, You N-H, Lee S, Multifunctional polyimide/graphene oxide composites via in situ polymerization, Journal of Applied Polymer Science 131 (2014) 40177–40184. [Google Scholar]
- [30].Ding P, Su S, Song N, Tang S, Liu Y, Shi L, Highly thermal conductive composites with polyamide-6 covalently-grafted graphene by an in situ polymerization and thermal reduction process, Carbon 66(C) (2014) 576–584. [Google Scholar]
- [31].Ji W-F, Chang K-C, Lai M-C, Li C-W, Hsu S-C, Chuang T-L, Yeh J-M, Liu W-R, Preparation and comparison of the physical properties of PMMA/thermally reduced graphene oxides composites with different carboxylic group content of thermally reduced graphene oxides, Composites Part A 65 (2014) 108–114. [Google Scholar]
- [32].Chen W-Q, Li Q-T, Li P-H, Zhang Q-Y, Xu Z-S, Chu PK, Wang X-B, Yi C-F, In situ random co-polycondensation for preparation of reduced graphene oxide/polyimide nanocomposites with amino-modified and chemically reduced graphene oxide, Journal of Materials Science 50 (2015) 3860–3874. [Google Scholar]
- [33].Huang H-D, Ren P-G, Xu J-Z, Xu L, Zhong G-J, Hsiao BS, Li Z-M, Improved barrier properties of poly(lactic acid) with randomly dispersed graphene oxide nanosheets, Journal of Membrane Science 464(C) (2014) 110–118. [Google Scholar]
- [34].Mittal V, Chaudhry AU, Luckachan GE, Biopolymer - Thermally reduced graphene nanocomposites: Structural characterization and properties, Materials Chemistry and Physics 147(1-2) (2014) 319–332. [Google Scholar]
- [35].Ramanathan T, Abdala AA, Stankovich S, Dikin DA, Herrera-Alonso M, Piner RD, Adamson DH, Schniepp HC, Chen X, Ruoff RS, Nguyen ST, Aksay IA, Prud’Homme RK, Brinson LC, Functionalized graphene sheets for polymer nanocomposites, Nature Nanotech 3(6) (2008) 327–331. [DOI] [PubMed] [Google Scholar]
- [36].Compton OC, Kim S, Pierre C, Torkelson JM, Nguyen ST, Crumpled Graphene Nanosheets as Highly Effective Barrier Property Enhancers, Advanced Materials 22(42) (2010) 4759–4763. [DOI] [PubMed] [Google Scholar]
- [37].Etmimi HM, Mallon PE, Sanderson RD, Polymer/graphite nanocomposites: Effect of reducing the functional groups of graphite oxide on water barrier properties, European Polymer Journal 49(11) (2013) 3460–3470. [Google Scholar]
- [38].Jin J, Rafiq R, Gill YQ, Song M, Preparation and characterization of high performance of graphene/nylon nanocomposites, European Polymer Journal 49(9) (2013) 2617–2626. [Google Scholar]
- [39].Kim H, Macosko CW, Morphology and Properties of Polyester/Exfoliated Graphite Nanocomposites, Macromolecules 41(9) (2008) 3317–3327. [Google Scholar]
- [40].Chen J.-t., An Q-F, Lo S-C, Lee K-R, Zhong Y-Z, Lai J-Y, Hu C-C, Fu Y.-j., Enhancing polymer/graphene oxide gas barrier film properties by introducing new crystals, Carbon 75 (2014) 443–451. [Google Scholar]
- [41].Yousefi N, Gudarzi MM, Zheng Q, Lin X, Shen X, Jia J, Sharif F, Kim J-K, Highly aligned, ultralarge-size reduced graphene oxide/polyurethane nanocomposites: Mechanical properties and moisture permeability, Composites Part A 49(C) (2013) 42–50. [Google Scholar]
- [42].Li Y, Umer R, Samad YA, Zheng L, Liao K, The effect of the ultrasonication pre-treatment of graphene oxide (GO) on the mechanical properties of GO/polyvinyl alcohol composites, Carbon 55(C) (2013) 321–327. [Google Scholar]
- [43].Rafiq R, Cai D, Jin J, Song M, Increasing the toughness of nylon 12 by the incorporation of functionalized graphene, Carbon 48(15) (2010) 4309–4314. [Google Scholar]
- [44].Yuan D, Wang B, Wang L, Wang Y, Zhou Z, Unusual toughening effect of graphene oxide on the graphene oxide/nylon 11 composites prepared by in situ melt polycondensation, Composites Part B 55(C) (2013) 215–220. [Google Scholar]
- [45].Glover AJ, Schniepp HC, Kranbuehl DE, Cai M, Overdeep KR, In SituReduction of Graphene Oxide in Polymers, Macromolecules 44(24) (2011) 9821–9829. [Google Scholar]
- [46].Chen J, Radke W, Pasch H, Analysis of Polyamides by Size Exclusion Chromatography and Laser Light Scattering, Macromolecular Symposia 193 (2003) 107–118. [Google Scholar]
- [47].Skrovanek DJ, Painter PC, Coleman MM, Hydrogen-Bonding in Polymers. 2. Infrared Temperature Studies of Nylon-11, Macromolecules 19(3) (1986) 699–705. [Google Scholar]
- [48].Hocker S, Rhudy AK, Ginsburg G, Kranbuehl DE, Polyamide hydrolysis accelerated by small weak organic acids, Polymer 55(20) (2014) 5057–5064. [Google Scholar]
- [49].Jacques B, Werth M, Merdas I, Thominette F, Verdu J, Hydrolytic ageing of polyamide 11. 1. Hydrolysis kinetics in water, Polymer 43(24) (2002) 6439–6447. [Google Scholar]
- [50].Laidler KJ, Kinetics Chemical, 3 ed., Harper & Row, New York, NY, 1987. [Google Scholar]
- [51].Jarrin J, Driancourt A, Brunet R, Pierre B, Durability of polyamide 11 for offshore flexible pipe applications, MERL Oilfield engineering with polymers, London, UK, 1998. [Google Scholar]
- [52].De Groote PH, Rouxhet PG, Devaux J, Godard P, Infrared study of the hydrogen bonding association in polyamides plasticized by benzenesulfonamides. Part I: Self-association in amide and sulfonamide systems; Part II: Amide-sulfonamide interaction, Applied Spectroscopy 55(7) (2001) 877–887. [Google Scholar]
- [53].Zahn D, Car-Parrinello molecular dynamics simulation of base-catalyzed amide hydrolysis in aqueous solution, Chemical Physics Letters 383(1-2) (2004) 134–137. [Google Scholar]
- [54].Xiong Y, Zhan CG, Theoretical studies of the transition-state structures and free energy barriers for base-catalyzed hydrolysis of amides, Journal of Physical Chemistry A 110(46) (2006) 12644–12652. [DOI] [PMC free article] [PubMed] [Google Scholar]
- [55].Bender ML, Thomas RJ, Concurrent Alkaline Hydrolysis and Isotopic Oxygen Exchange of a Series of p-Substituted Acetanilides, Journal of the American Chemical Society 83(20) (1961) 4183–4189. [Google Scholar]
- [56].Brown RS, Bennet AJ, Slebockatilk H, Recent Perspectives Concerning the Mechanism of H3O+ Promoted and OH- Promoted Amide Hydrolysis, Acc. Chem. Res 25(11) (1992) 481–488. [Google Scholar]
- [57].Pollack RM, Bender ML, Alkaline Hydrolysis of Para Nitroacetanilide and Para Fromylacetanilide, Journal of the American Chemical Society 92(24) (1970) 7190–7194. [Google Scholar]
- [58].Bagno A, Lovato G, Scorrano G, Thermodynamics of Protonation and Hydration of Aliphatic Amides, J. Chem. Soc.-Perkin Trans 2 (6) (1993) 1091–1098. [Google Scholar]
- [59].Fersht AR, Acyl-Transfer Reactions of Amides and Esters with Alcohols and Thiols - Reference System for Serine and Cysteine Proteinases - Concerning N Protonation of Amides and Amide-Imidate Equilibria, Journal of the American Chemical Society 93(14) (1971) 3504–3515. [DOI] [PubMed] [Google Scholar]
- [60].Martin RB, O-Protonation of Amides in Dilute Acids, J. Chem. Soc.-Chem. Commun (13) (1972) 793–794. [Google Scholar]
- [61].Kresge AJ, Ph Fitzgera., Chiang Y, Position of Protonation and Mechanism of Hydrolysis of Simple Amides, Journal of the American Chemical Society 96(14) (1974) 4698–4699. [Google Scholar]
- [62].Zahn D, On the Role of Water in Amide Hydrolysis, Eur. J. Org. Chem 2004(19) (2004) 4020–4023. [Google Scholar]
- [63].Pan B, Ricci MS, Troutt BL, A Molecular Mechanism of Hydrolysis of Peptide Bonds at Neutral pH Using a Model Compound, Journal of Physical Chemistry B 115(19) (2011) 5958–5970. [DOI] [PubMed] [Google Scholar]
- [64].Duan PG, Dai LY, Savage PE, Kinetics and mechanism of N-substituted amide hydrolysis in high-temperature water, J. Supercrit. Fluids 51(3) (2010) 362–368. [Google Scholar]
- [65].Schowen RL, H Jayarama., Kershner L, Zuorick GW, Solvent Isotope Effects in Amide Hydrolysis, Journal of the American Chemical Society 88(17) (1966) 4008–4012. [DOI] [PubMed] [Google Scholar]
- [66].Schowen RL, Jayaraman H, Kershner L, Catalytic efficiencies in amide hydrolysis. The two-step mechanism., 88(14) (1966) 3373–3375. [DOI] [PubMed] [Google Scholar]
- [67].Zahn D, Theoretical study of the mechanisms of acid-catalyzed amide hydrolysis in aqueous solution, Journal of Physical Chemistry B 107(44) (2003) 12303–12306. [Google Scholar]
- [68].Oh YJ, Yoo JJ, Kim YI, Yoon JK, Yoon HN, Kim JH, Park SB, Oxygen functional groups and electrochemical capacitive behavior of incompletely reduced graphene oxides as a thin-film electrode of supercapacitor, Electrochimica Acta 116 (2014) 118–128. [Google Scholar]
- [69].Panaitescu DM, Frone AN, Nicolae C, Micro- and nano-mechanical characterization of polyamide 11 and its composites containing cellulose nanofibers, European Polymer Journal 49(12) (2013) 3857–3866. [Google Scholar]
- [70].Zhang QZ, Mo ZS, Liu SY, Zhang HF, Influence of annealing on structure of Nylon 11, Macromolecules 33(16) (2000) 5999–6005. [Google Scholar]
- [71].Zhang Q, Yu M, Fu Q, Crystal morphology and crystallization kinetics of polyamide- 11/clay nanocomposites, Polymer International 53(12) (2004) 1941–1949. [Google Scholar]
- [72].Yang Z, Huang S, Liu TX, Crystallization Behavior of Polyamide 11/Multiwalled Carbon Nanotube Composites, Journal of Applied Polymer Science 122(1) (2011) 551–560. [Google Scholar]
- [73].Kolesov I, Kaci M, Lebek W, Mileva D, Benhamida A, Focke W, Androsch R, Crystallization of a polyamide 11/organo-modified montmorillonite nanocomposite at rapid cooling, Colloid Polym Sci 291(11) (2013) 2541–2549. [Google Scholar]
- [74].Capsal J-F, Pousserot C, Dantras E, Dandurand J, Lacabanne C, Dynamic mechanical behaviour of polyamide 11/Barium titanate ferroelectric composites, Polymer 51(22) (2010) 5207–5211. [Google Scholar]
- [75].Lacrampe M-F, Prashantha K, Krawczak P, Highly dispersed polyamide-11/halloysite nanocomposites: Thermal, rheological, optical, dielectric, and mechanical properties, Journal of Applied Polymer Science 130(1) (2013) 313–321. [Google Scholar]
- [76].Mago G, Kalyon DM, Fisher FT, Nanocomposites of Polyamide-11 and Carbon Nanostructures: Development of Microstructure and Ultimate Properties Following Solution Processing, Journal of Polymer Science Part B-Polymer Physics 49(18) (2011) 1311–1321. [Google Scholar]
- [77].Ma YL, Hu GS, Ren XL, Wang BB, Nonisothermal crystallization kinetics and melting behaviors of nylon 11/tetrapod-shaped ZnO whisker (T-ZnOw) composites, Materials Science and Engineering a-Structural Materials Properties Microstructure and Processing 460 (2007) 611–618. [Google Scholar]
- [78].Wu M, Yang G, Wang M, Wang W, Zhang W-D, Feng J, Liu T, Nonisothermal crystallization kinetics of ZnO nanorod filled polyamide 11 composites, Materials Chemistry and Physics 109(2-3) (2008) 547–555. [Google Scholar]
- [79].Zhang G, Li Y, Yan D, Polymorphism in Nylon-11/Montmorillonite Nanocomposite, Journal of Polymer Science Part B: Polymer Physics 42 (2003) 253–259. [Google Scholar]
- [80].Liu T.-x., Chen D, Phang IY, Wei C, Studies on crystal transition of polyamide 11 nanocomposites by variable-temperature X-ray diffraction, Chin J Polym Sci 32(1) (2013) 115–122. [Google Scholar]
- [81].Latko P, Kolbuk D, Kozera R, Boczkowska A, Microstructural Characterization and Mechanical Properties of PA11 Nanocomposite Fibers, Journal of Materials Engineering and Performance 25(1) (2016) 68–75. [Google Scholar]
- [82].Kawaguchi A, Ikawa T, Fujiwara Y, Tabuchi M, Monobe K, Polymorphism in Lamellar Single-Crystals of Nylon-11, J. Macromol. Sci.-Phys B20(1) (1981) 1–20. [Google Scholar]
- [83].Fornes TD, Paul DR, Crystallization behavior of nylon 6 nanocomposites, Polymer 44(14) (2003) 3945–3961. [Google Scholar]
- [84].Hocker S, Hudson-Smith N, Schniepp HC, Kranbuehl DE, Enhancing polyimide’s water barrier properties through addition of functionalized graphene oxide, Polymer 93 (2016) 23–29. [Google Scholar]
Associated Data
This section collects any data citations, data availability statements, or supplementary materials included in this article.


