Abstract
Advanced Very High Resolution Radiometer (AVHRR) and Moderate Resolution Imaging Spectroradiometer (MODIS) data have been extensively applied for crop yield prediction because of their daily temporal resolution and a global coverage. This study investigated global crop yield using daily two band Enhanced Vegetation Index (EVI2) derived from AVHRR (1981–1999) and MODIS (2000–2013) observations at a spatial resolution of 0.05° (~5 km). Specifically, EVI2 temporal trajectory of crop growth was simulated using a hybrid piecewise logistic model (HPLM) for individual pixels, which was used to detect crop phenological metrics. The derived crop phenology was then applied to calculate crop greenness defined as EVI2 amplitude and EVI2 integration during annual crop growing seasons, which was further aggregated for croplands in each country, respectively. The interannual variations in EVI2 amplitude and EVI2 integration were combined to correlate to the variation in cereal yield from 1982–2012 for individual countries using a stepwise regression model, respectively. The results show that the confidence level of the established regression models was higher than 90% (P value < 0.1) in most countries in the northern hemisphere although it was relatively poor in the southern hemisphere (mainly in Africa). The error in the yield predication was relatively smaller in America, Europe and East Asia than that in Africa. In the 10 countries with largest cereal production across the world, the prediction error was less than 9% during past three decades. This suggests that crop phenology-controlled greenness from coarse resolution satellite data has the capability of predicting national crop yield across the world, which could provide timely and reliable crop information for global agricultural trade and policymakers.
Keywords: Global crop yield, Crop phenology, Crop greenness, Long-term satellite observations
1. Introduction
Global population continues to rise and will reach between 7.4 and 10.6 billion people on this planet by the year 2050 (United Nations, 2003). With growing population and rising per-capita consumption, the demand for cereals and grains is expected to increase 1.3% per year (Duvick and Cassman, 1999). During the twentieth century, agricultural productivity has greatly increased to keep pace with population growth through Green Revolution technologies, including the use of new high yielding varieties of rice, maize, and wheat, and through the application of fertilizers, irrigation, and pesticides (Kucharik and Ramankutty, 2005). With the increase of future food demand, the diminishing returns from advancements in agricultural technology, and the impacts of climate change on crop yield, global food security has become a great concern (Conway and Toenniessen, 1999; Rosegrant and Cline, 2003). Thus, monitoring of crop growing conditions and forecasting crop yield are significant for economic development and food security.
Satellite remote sensing has been demonstrated to be an effective tool in monitoring crop growth and yield over local, regional, national, and global extent (Alemu and Henebry, 2013; Beeri and Peled, 2009; Behmann et al., 2014; Gumma et al., 2014; Jiao et al., 2014; Steven, 1993; Tucker et al., 2005; Wagle et al., 2015; Wardlow and Egbert, 2008). The NOAA (National Oceanic and Atmospheric Administration) AVHRR (Advanced Very High Resolution Radiometer, available since 1981) and NASA (National Aeronautics and Space Administration) MODIS (Moderate Resolution Imaging Spectroradiometer, available since 2000) data are the most frequently used datasets for crop yield monitoring and predicting because of their daily observation and global coverage. Thus, such remote sensing data have been applied in various operational monitoring systems including the USAID Famine Early Warning System (FEWS-NET), the UN Food and Agriculture Organization (FAO) Global Information and Early Warning System (GIEWS), the Monitoring of Agriculture by Remote Sensing (MARS) Project of the Joint Research Centre in Europe (Csornai et al., 2003; ITA, 2002), Crop Watch Program in China, and the USDA Foreign Agricultural Service (FAS) Global Agriculture Monitoring (GLAM) System (Becker-Reshef et al., 2010).
Vegetation indices from satellites have been commonly used for the predication of crop production and yield because they provide a means for characterizing net primary productivity (NPP). Although various vegetation indices (such as ratio vegetation index, perpendicular vegetation index, and soil-adjusted vegetation index) have been investigated, Normalized Difference Vegetation Index (NDVI) is the most extensively used parameter to statistically correlate to crop growth and yield for spring and winter wheat, corn, rice, sorghum and soybeans across the world, such as the USA, Brazil, Argentina, Greece, Morocco, Zimbabwe, China, Mongolia, India, Poland and other countries (Groten, 1993; Gumma et al., 2014; Kogan et al., 2012; Maselli et al., 1993; Rasmussen, 1992; J.H. Zhang et al., 2014).
During a crop growing season, the integrated greenness and peak greenness are critical parameters in characterizing crop growth. The NDVI integrated during the crop growing season is an excellent measure of prevailing patterns of NPP, which is equivalent to a measure of the duration of green leaf area and gives a good description of the produced biomass and crop yield (Goward, 1987; Pinter et al., 1981; Tucker et al., 1983). NPP is a function of NDVI and photosynthetically active radiation (PAR) during a vegetation growing season because plant production of organic matter is proportionally related to both the absorbed radiation and reflected radiation by green vegetation (primarily leaves) (Running et al., 2000). Thus NDVI obtained over a growing season has been simply related to NPP (Chong et al., 1993; Loveland et al., 1991; Markon and Peterson, 2002; Paruelo et al., 1997). As a result, the NDVI integration during a growing season has been shown a better indicator of crop yield relative to the individual NDVI observations or average NDVI (Benedetti and Rossini, 1993; Esquerdo et al., 2011). On the other hand, several studies have demonstrated that the vegetation index reflecting peak greenness is the most effective parameter in forecasting crop yield (Bolton and Friedl, 2013; Groten, 1993; Rasmussen, 1992; Rembold et al., 2013). The crop peak NDVI occurs during the period between flowering and milky ripe (Shuai et al., 2013), which is a peak grain filling phase of crop growth (Funk and Budde, 2009). Moreover, some studies, such as Funk and Budde (2009), also suggest that the sum of NDVI increases during the mid-to-late season growing period should be a better indicator of crop yield. Evidently, the advantages of both NDVI integration and peak NDVI for crop yield prediction vary with crop types and geographic locations because parameters in statistical models are dependent on the quality of NDVI in representing crop growth and crop types in a given region (Rembold et al., 2013). Overall, AVHRR NDVI at a spatial resolution from 8 to 16 km and a temporal resolution from weekly to 16 days provided the crop yield predication with an accuracy of 8–15% at either entire country or administrative divisions (Dabrowska-Zielinska et al., 2002; Domenikiotis et al., 2004; Kogan et al., 2003, 2012, 2005; Liu and Kogan, 2002; Salazar et al., 2007; Singh et al., 2003). The limitation of the empirical prediction models is that it would be difficult to apply a model established in a specific geographic region across various environmental characteristics.
More recently, the Enhanced Vegetation Index (EVI), which is calculated from blue, red and near infrared reflectance (Huete et al., 2002), and a two-band variant of the Enhanced Vegetation Index (EVI2), which is calculated from red and near infrared reflectance (Jiang et al., 2008), have been demonstrated to be more effective in monitoring vegetation growth than NDVI. It is due to the fact that the EVI/EVI2 is less sensitive to different background soil reflectance and non-green winter land surface and remains sensitive to variation in dense canopy where NDVI becomes saturated (Huete et al., 2006; Rocha and Shaver, 2009). Specifically, EVI/ EVI2 is better than NDVI in discriminating land cover diversity (Mondal, 2011), monitoring maize area and yield (Bolton and Friedl, 2013; J.H. Zhang et al., 2014) and coffee yield in Brazil (Bernardes et al., 2012), estimating gross primary productivity (Xiao et al., 2005), capturing subtle change in vegetation condition and structure (Rocha and Shaver, 2009), and estimating the start of the green season (Zhang et al., 2004). From these studies, it is reasonable to suggest that EVI2 should be more effective in monitoring crop growth.
As the FAO indicated that timeliness is a major factor underlying agricultural statistics and associated monitoring systems globally (FAO, 2011), this study is expected to develop an approach for timely and reliable monitoring of global crop yield at national and international scales for global agricultural trade, policymakers, farmers, hedgers, and investors. Currently, the USDA FAS with its GLAM system is the only provider of regular, timely, objective crop production forecasts at a global scale (Becker-Reshef et al., 2010). The GLAM system is complex, which includes web-based technology, analysis tools, and satellite datasets, which enable FAS analysts to monitor crops and forecast yield and production of the major crops grown worldwide. On the other hand, simple models that directly link satellite vegetation indices to crop yield have been extensively established in a variety of local areas across the world (Bolton and Friedl, 2013; Dabrowska-Zielinska et al., 2002; Domenikiotis et al., 2004; Kogan et al., 2003, 2012, 2005; Liu and Kogan, 2002; Salazar et al., 2007; Singh et al., 2003). However, little study has been carried out to use the simple models for estimating crop yield across the world. Moreover, although crop phenology has been recognized as an effective index reflecting crop growth and yield, little research effort has been devoted to explicitly establishing crop growth trajectory for the accurate determination of crop greenness from daily satellite observation. Therefore, this study is to develop a simple approach for monitoring crop greenness which is a proxy of crop yield from long-term satellite data for individual countries across the world. To reach this goal, this study first simulated temporal trajectory of EVI2 from daily AVHRR (1981–1999) and MODIS (2000–2012) EVI2 data using a Hybrid Piecewise Logistic Model (HPLM), and then identified crop phenological metrics for each 0.05° (~5 km) pixel. The satellite crop phenology was further used to quantify interannual variation in both crop greenness at a peak season and integrated greenness during a growing season. By correlating satellite crop greenness to statistical crop yield data, the prediction models were finally established to predict national crop yield across the world.
2. Data and methods
2.1. Crop data
Cereal production and yield at a national scale from 1982–2012 were obtained from the World Bank (http://data.worldbank.org/indicator), which were originally from the FAO. The cereal crop types include wheat, rice, maize, barley, oats, rye, millet, sorghum, buckwheat, and mixed grains. Cereal yield is measured as kilograms per hectare of harvested land for dry grain only and production data are referred as to the total cereal crops harvested. Among the 214 counties or regions, there are 24 (such as Croatia, Estonia, Serbia, Russian Federation, and Ukraine) with data available after 1991–1999, respectively, and 39 without data (such as Singapore, Monaco, Kosovo, and Iceland).
The global cereal production on average is mainly produced from China, the United States of America (USA) and India, which accounts for 51.8% of global production (Fig. 1). During last three decades, the cereal production increased steadily with a rate of 3.68 × 10⁶ tons/y, 4.34 × 10⁶ tons/y, 4.67 × 10⁶ tons/y, and 32.88 × 10⁶ tons/y for India, the USA, China, and the world, respectively. There were more than 80% and 14% of countries with an increase of cereal yield more than 20% and 80%, respectively (Fig. 2). However, the cereal yield varies greatly worldwide from 416 to 8742 kg/hectare at a national scale (Fig. 3).
Fig. 1.
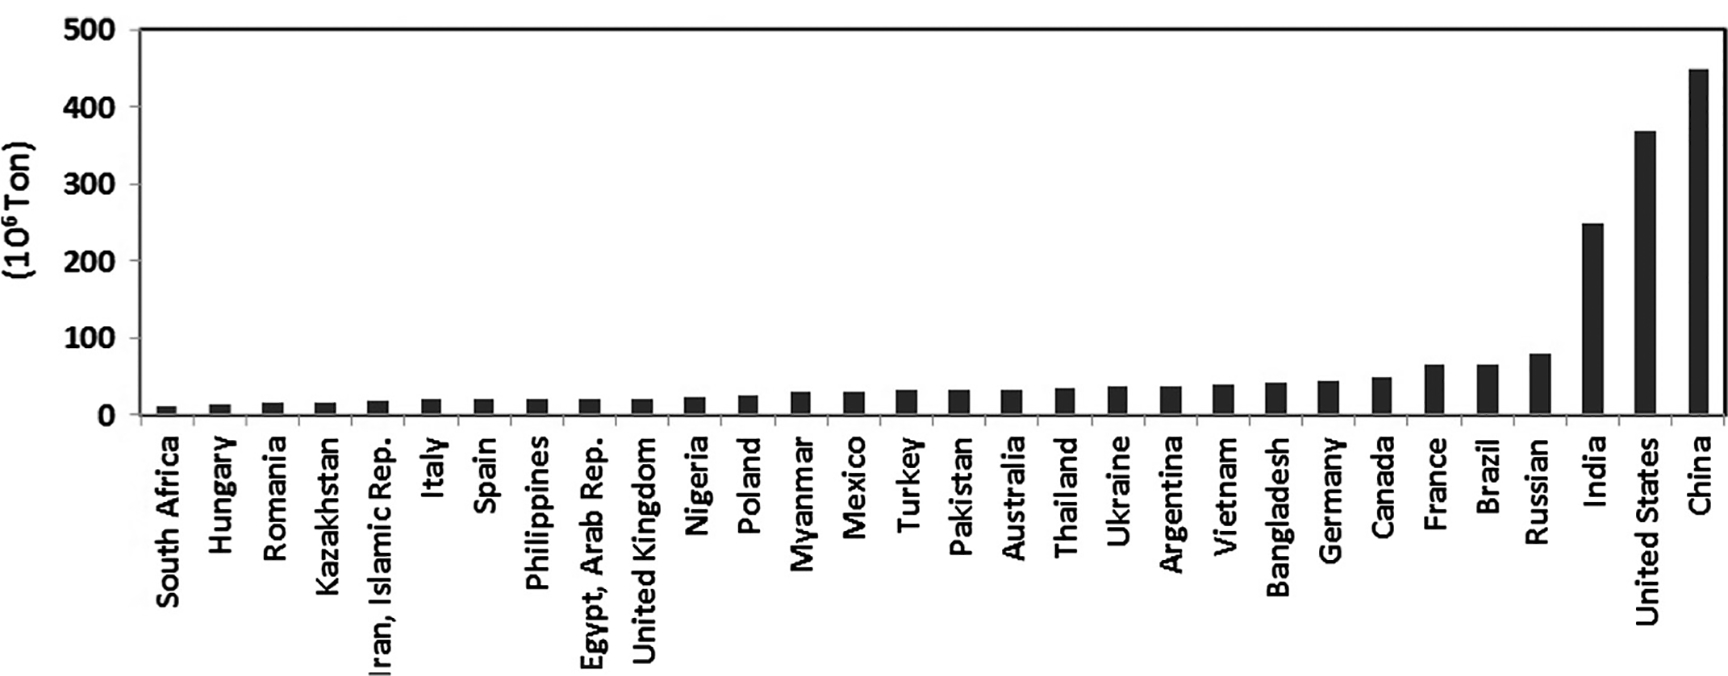
The 30 countries with largest cereal production in 2000 s.
Fig. 2.
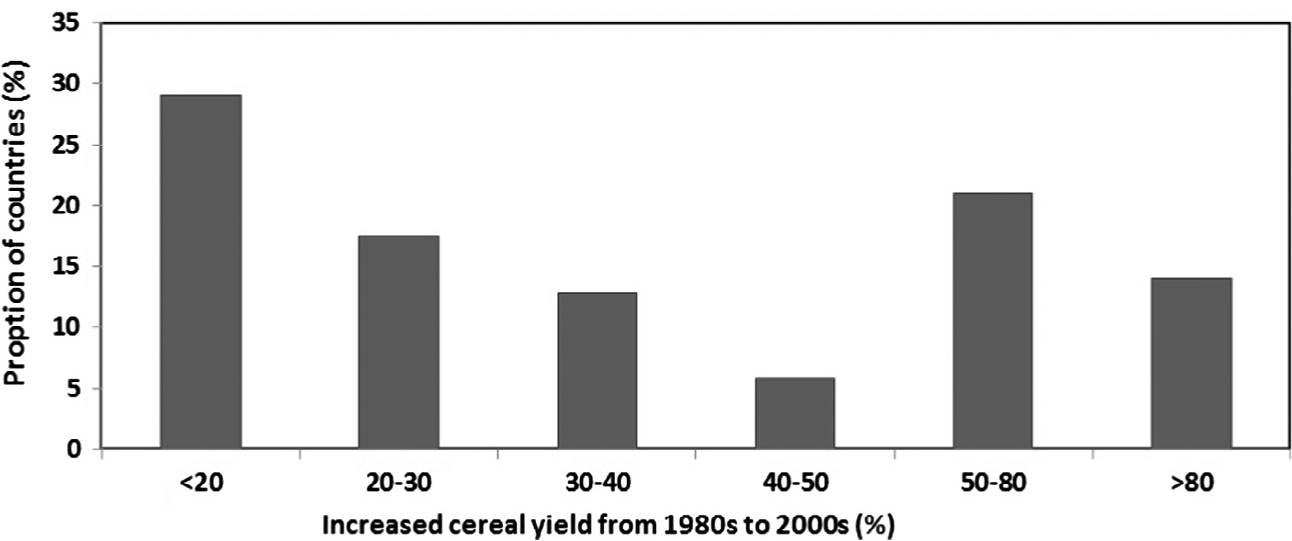
Proportion of countries varying with average increased rate of cereal yield from 1980 s to 2000 s.
Fig. 3.
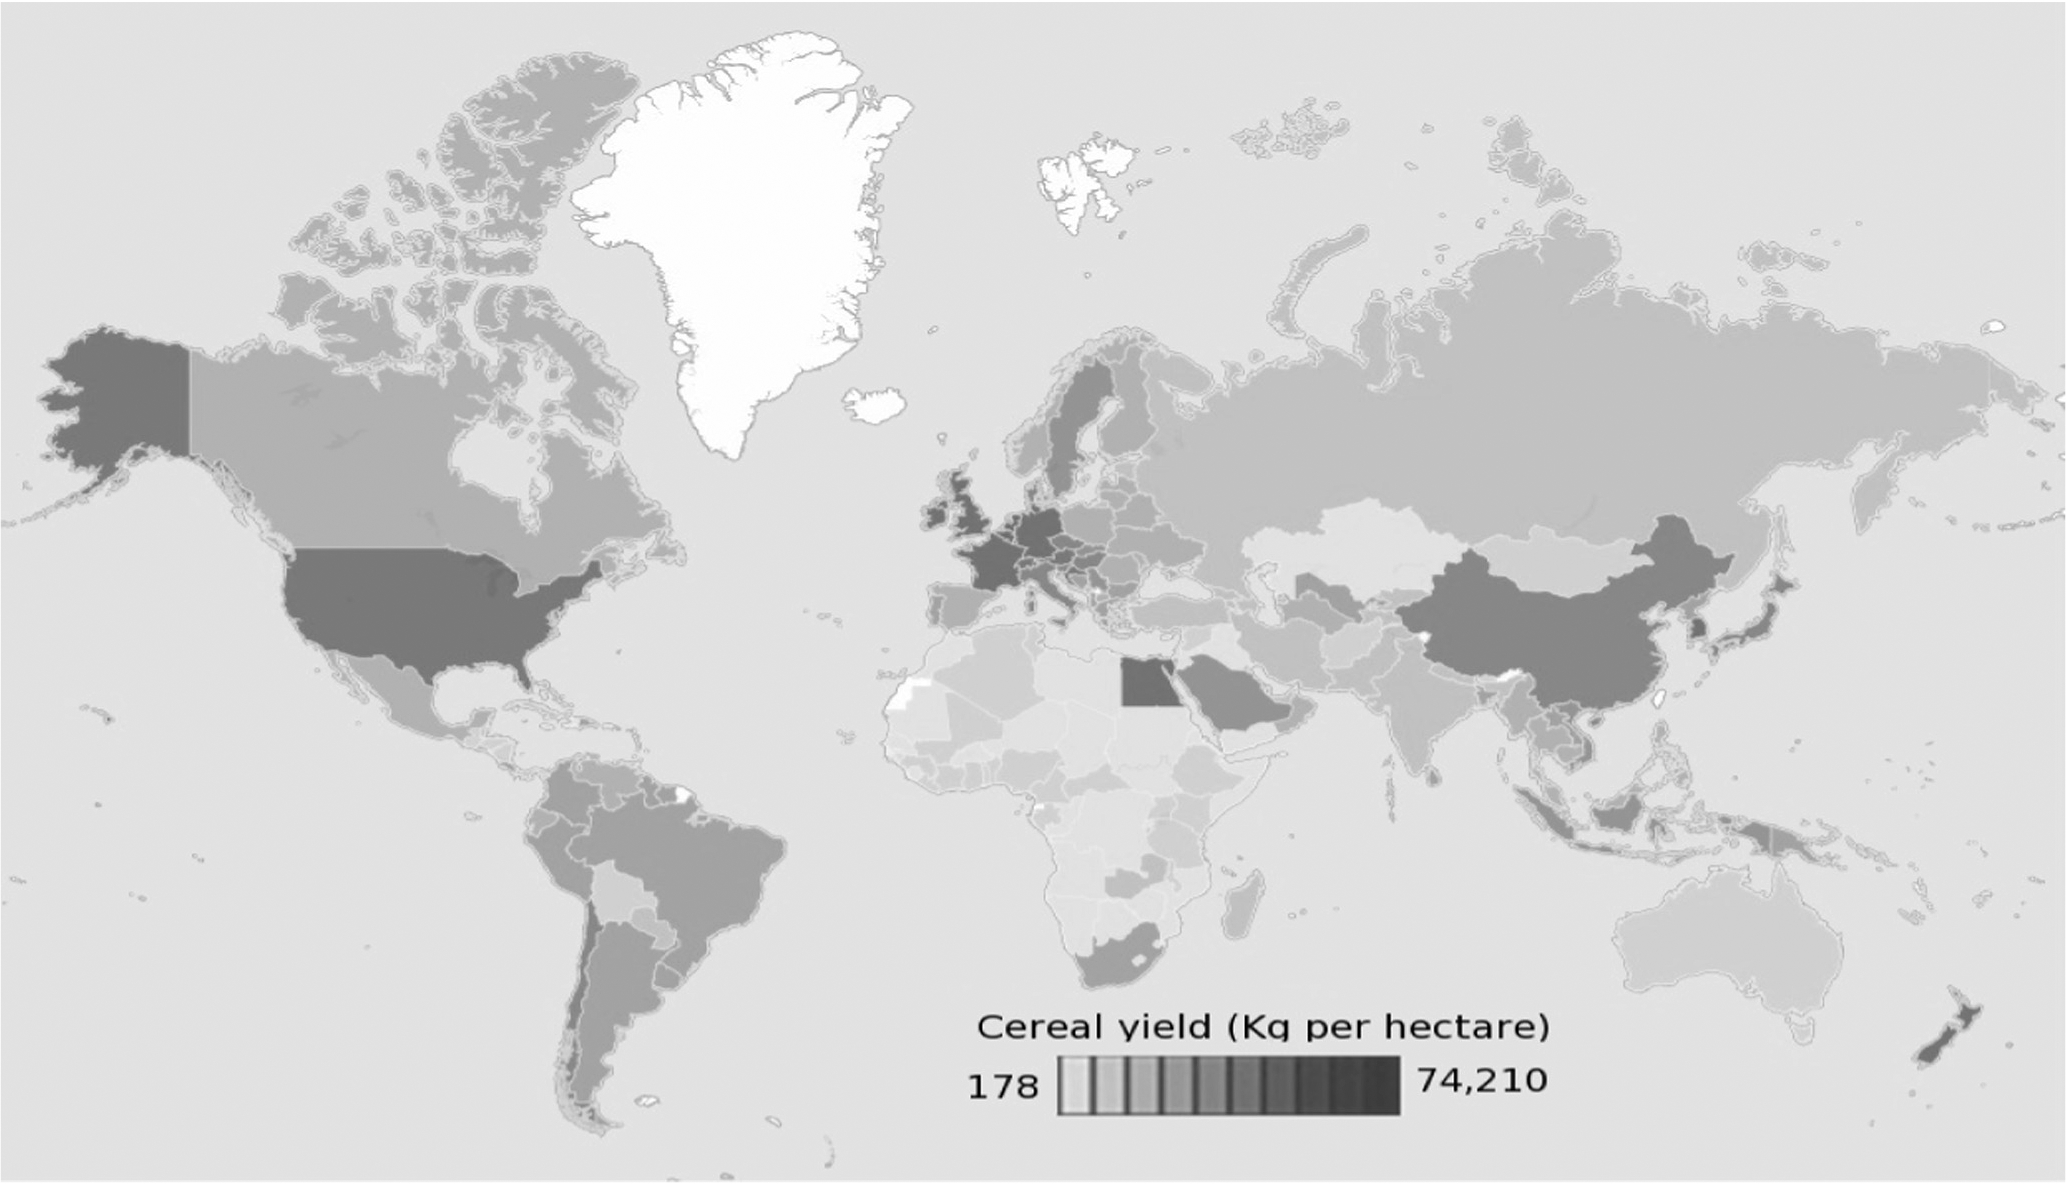
Spatial pattern of mean cereal yield across the countries from 2009–2012 (modified from http://data.worldbank.org/indicator).
Croplands were obtained from MODIS land cover product. This product provides croplands in 500 m pixels in 2010 s (Friedl et al., 2010). It could effectively delineate croplands for establishing models between vegetation index and crop yield (Bolton and Friedl, 2013). Since the MODIS land cover product does not differentiate crop types, this study included all pixels classified as agriculture and aggregated to a spatial resolution of 0.05° using a majority approach to match the spatial resolution of long-term AVHRR and MODS datasets.
2.2. Long-term satellite data and crop phenology detection
It has been demonstrated in previous studies that crop yield can be estimated and predicted using remote sensing data (e.g., Bolton and Friedl, 2013; Dabrowska-Zielinska et al., 2002; Domenikiotis et al., 2004; Kogan et al., 2012; Singh et al., 2003). The reliability of remotely-sensed estimation is strongly dependent on the quality of crop greenness extraction. This research was to calculate crop greenness from crop growth trajectory reconstructed from daily satellite observations according to the general structure summarized in Fig. 4.
Fig. 4.
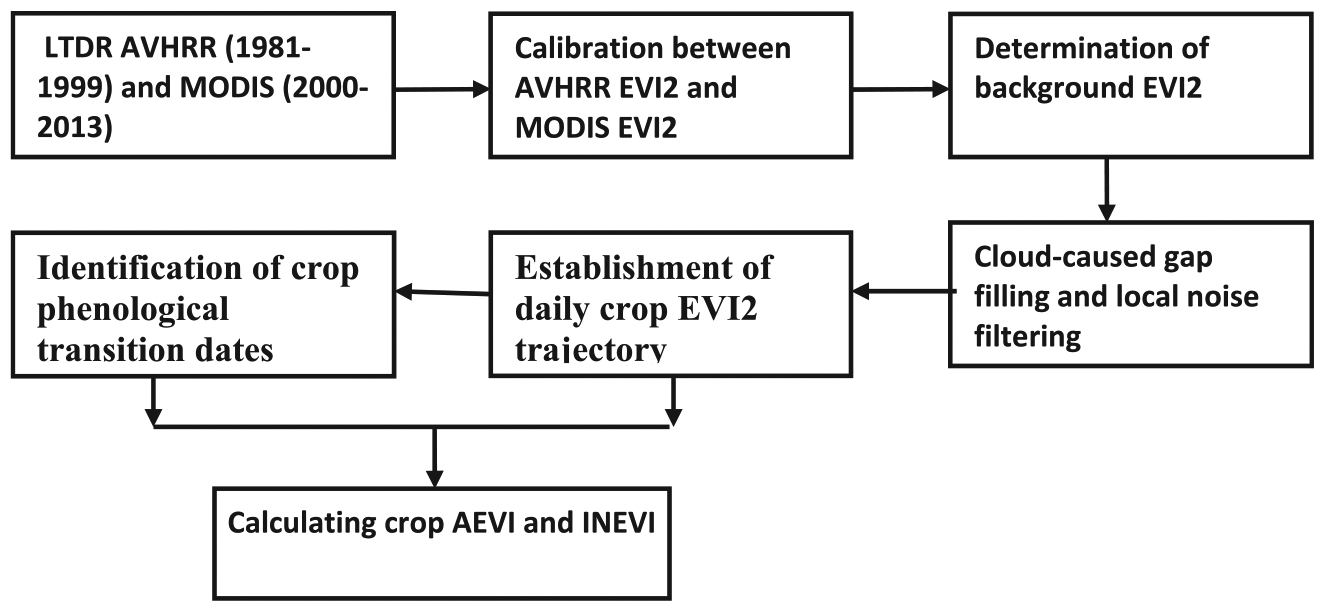
Flowchart of qualifying amplitude greenness and integrated greenness during a crop growing season.
2.2.1. Daily satellite vegetation index
AVHRR and MODIS data were collected from June 1981–June 2013 globally. AVHRR Long-Term Data Record (LTDR Version3) provides daily reflectance of 0.05° for the period from June 1981–December 1999. After the processing of atmospheric correction and sensor degradation calibration, the LTDR data were derived from a set of AVHRR sensors on NOAA-7, NOAA-9, NOAA-11, NOAA-14, and NOAA-16 (Vermote and Saleous, 2006). The MODIS CMG (Climate Modeling Grid) dataset provides daily surface reflectance (Collection 5.0) at a spatial resolution of 0.05°, which spans the period from March 2000 to June 2013 in this study. The CMG data were averaged from 250 m, 500 m, and 1 km on the basis of minimum values at band 3 (459–479 nm) after excluding pixels flagged for clouds and high solar zenith angles (Vermote and Kotchenova, 2011).
Daily EVI2 was calculated from red and near infrared reflectances using AVHRR LTDR and MODIS CMG. EVI2 remains functionally equivalent to EVI but can be derived from AVHRR data without blue band (Huete et al., 2006; Jiang et al., 2008). It is able to monitor vegetation phenology and activity across a variety of ecosystems (Rocha and Shaver, 2009), and is more effective than NDVI in crop yield monitoring (Bolton and Friedl, 2013). To bridge AVHRR and MODIS data, SPOT-4 VGT observations in 2001–2002 were calibrated to be comparable with MODIS data and then the calibrated SPOT-4 VGT data in 1998–1999 were used to adjust AVHRR NOAA-14 (Tsend-Ayush et al., 2012), because NOAA-14 AVHRR from 2000 to 2001 is not recommended for scientific uses due to significant orbital drift. After AVHRR LTDR dataset was calibrated to be continuous with MODIS data, the daily EVI2 during the last thirty years was generated by a NASA funded MEASURES project and is available at University of Arizona (http://vip.arizona.edu/viplab_data_explorer).
2.2.2. Detection of crop phenology
Crop phenology was detected using a Hybrid Piecewise Logistic Model (HPLM) based Land Surface Phenology Detection (LSPD) algorithm (Zhang et al., 2003, 2014), where the annual EVI2 time series was reconstructed using EVI2 observations from preceding half year, current year, and following half year. Briefly, the EVI2 time series was first smoothed after daily EVI2 data were composited to 3-day data by selecting the best quality data and using the maximum value composite. Then the observations of clouds and snow cover were removed from the temporal EVI2 data based on quality assurance. Specifically, the irregular snow cover EVI2 during a winter period was replaced using the background EVI2 value which represents the minimum EVI2 that consists of soil and seasonally-stable vegetation properties in an annual time series in each pixel. The data gaps caused by clouds were filled by linear interpolation using neighbour good quality data. The time series of EVI2 data at each pixel was finally smoothed using a Savitzky-Golay filter and a running local median filter. During data processing, EVI2 in preceding year was used to replace the data between September 1994 and February 1995 when the NOAA-11 AVHRR instrument unexpectedly failed. Similarly, EVI2 between January and March in 2000 was replaced using data in 2001 because MODIS data were not available until March 2000.
HPLM was developed to trace crop growth trajectory reflected from satellite vegetation index (Zhang, 2015). The logistic model was originally developed for monitoring crop growth based on field measurements (Ratkowsky, 1983; Richards, 1959) and adopted to simulate temporal satellite vegetation index (Zhang et al., 2003). By considering crop stress condition, HPLM was described as the followings:
| (1) |
where t is time in the day of year (DOY), a1 and a2 are related to the vegetation growth time, b1 and b2 are associated with the rate of plant leaf development, c1 and c2 are the amplitude of EVI2 variation, d is a vegetation stress factor, and EVI2b is the background EVI2 value.
HPLM was then used to derive phenological transition dates based on the extreme points in curvature change rate of the modeled temporal trajectories (Zhang et al., 2006, 2003). Crop phenological metrics were defined according to crop seasonal growing cycles. Briefly, a seasonal cycle of vegetation growth consists of a greenup phase, a maturity phase, a senescent phase, and a dormant phase. These four phases are characterized using four phenological transition dates in the time series of greenness data: (1) greenup onset: the date of onset of greenness increase (GIN); (2) maturity onset: the date of onset of greenness maximum (GMA); (3) senescence onset: the date of onset of greenness decrease (GDE); and (4) dormancy onset: the date of onset of greenness minimum (GMI). These transition dates correspond well to the timing of wheat (corn) greening (emergence), heading (teaseling), grain-filling, and maturity (or harvest), separately (Shuai et al., 2013). The four transition dates correspond to the day-of-year on which the curvature change rate along the EVI2 data exhibits local minima or maxima (Zhang et al., 2003).
Two critical parameters of crop greenness were calculated from HPLM using the following formula:
| (2) |
where AEVI is the growing season amplitude in EVI2; EVI2(GMA) and EVI2(GIN) are the EVI2 values at maturity onset and greenup onset, respectively, which were determined from HPLM.
Integrated EVI2 (IEVI) during a growing season was computed by summing the fitted daily EVI2 values throughout the period between the greenup onset and the dormancy onset:
| (3) |
These two greenness parameters minimize the impact of systematic uncertainty in the long time series of EVI2 data and remove the influence of seasonal shifts. For the pixels with multiple crop growing cycles, AEVI was selected from largest value and IEVI was the sum from all cycles during a year.
Crop greenness at a national scale was averaged from all cropland pixels. Practically, country boundary and MODIS land cover product (Friedl et al., 2010) were used to extract crop area for individual countries. Then AEVI and IEVI for crop pixels were calculated and averaged for each country across the world.
2.3. Establishment of relationship between crop phenology and cereal yield at national scales
Relative variation in interannual crop greenness was used to associate with cereal yield in this study although the magnitude value of crop greenness has frequently been directly applied in crop yield monitoring in previous studies (Benedetti and Rossini, 1993; Bolton and Friedl, 2013; Esquerdo et al., 2011; Rembold et al., 2013). It is due to the following reasons. First, crop yield presents the increased trends during past decades (see Section 2.1) with the improvement of agricultural practices which include cultivar advances, fertilizers, breeding, and crop protection (Edgerton, 2009; Kogan et al., 2012; Salazar et al., 2007). These agricultural practices would result in the change of the proportion of crop biomass partitioning to the crop yield, so that the relationship between the crop greenness and crop yield does not necessarily remain constant in a long time period. Secondly, crop growth conditions and yield are often affected by abiotic and biotic factors which mainly include weather (particularly drought), insect population, and disease incidence. When crops are impacted by the biotic and abiotic factors, the biochemical constituent of the crop changes and so would be the spectral signatures and greenness (Mirik et al., 2007; Moshou et al., 2004; Sudbrink et al., 2003; Williams et al., 2012). Therefore, the drought severity and yield variation are effectively monitored using interannual variation in crop greenness (Kogan, 1995; Zhang, 2015). Moreover, the degree of disease infection is strongly correlated to crop greenness over time because diseased plants react with changes in greenness or canopy structure (Ashourloo et al., 2014; Hatfield and Pinter, 1993; Williams et al., 2012). Thirdly, the continuity of greenness across satellite sensors is still an open issue even with careful sensor inter-calibration because self-consistency in a signal sensor and inter-calibration for various sensors are sophisticated (Wu and Yan, 2011). Particularly, the discrepancy between AVHRR and MODIS may still remain to some degree although the calibration was carefully performed. However, interannual variation in greenness could reduce some of the uncertainties by assuming that the instrument-impacts are limited within two consecutive years. As a result, MODIS greenness in 2000 was not compared with AVHRR greenness in 1999 because AVHRR EVI2 and MODIS EVI2 were from two different instruments.
It was therefore supposed that the interannual variation in cereal yield could be effectively reflected from that of vegetation greenness. Thus, the interannually normalized greenness and crop yield was first defined as the follows:
| (4) |
| (5) |
| (6) |
where Y is yield; IEVI is the EVI2 integration during a crop growing season; AEVI is the growing season amplitude in EVI2; Yr is interannually normalized cereal yield; AEVIr and IEVIr are the interannually normalized AEVI2 and IEVI2, respectively; i and i − 1 are current year and preceding year, respectively.
Secondly, a stepwise regression model was established using an ordinary least squares (OLS) method:
| (7) |
where α0, α1, and α2 are coefficients, and e is error.
Finally, the model of cereal yield prediction (Yp) was generated based on Eqs. (4)–(7):
| (8) |
Model accuracy was evaluated using the average of absolute relative error (Re). To calculate Re, a leave-one-out cross-validation approach was used (Bolton and Friedl, 2013; Mkhabela et al., 2011; Schut et al., 2009). Using this approach, the regression model (Eq. (7)) was repeatedly refitted by leaving out a single year observation and then used to derive a prediction for the left-out observation. This approach gives estimates of the prediction error for each observation. The Re in the model prediction during past three decades was calculated by comparing to the observed cereal yield at a national level:
| (9) |
where n is the total number of years, Y is the observation and Yp is the prediction in year i.
2.4. Verification of relationship between crop phenology and crop yield using data at a state scale
The relationship between crop greenness and crop yield was verified in four states in the Central United States. Crop yield and planted area at a state scale were obtained from the USDA (US Department of Agriculture) National Agricultural Statistics Service (NASS) database site (http://www.nass.usda.gov/). The crop yield (bushels per acre) and planted area (acre) in the four states were collected for barley, corn, oats, soybeans, and sorghum from 1982 to 2012, where corn and soybean accounted for more than 90% of planted area in most of the states. The overall crop yield in a state was determined using the crop yield in a given crop type and weighted by the planted area. Correspondingly, crop greenness (AEVI and INEVI) in these states was averaged from cropland pixels. Finally, the interannual variation in crop yield was associated with the interannually normalized crop greenness using Eq. (7).
3. Results
3.1. Reconstructed crop EVI2 time series
EVI2 temporal trajectory was reconstructed for individual crop pixels from 1982–2012. Fig. 5 shows an example of the time series of crop EVI2 simulated from AVHRR data. The seasonal cycle was distinctive in croplands because EVI2 varies from bare soil before sowing to fully covered canopy during maturity phases. However, winter snow cover effects were evident in mid-high latitudes, which reduced the EVI2 value dramatically, such as the winter periods in 1984 and 1989 (Fig. 5). In these cases, the background value, which was the average from the good EVI2 during the period after snow melting and before crop germination, was used to replace the snow EVI2. The EVI2 variation below background value was considered as noise in analyzing crop growth.
Fig. 5.
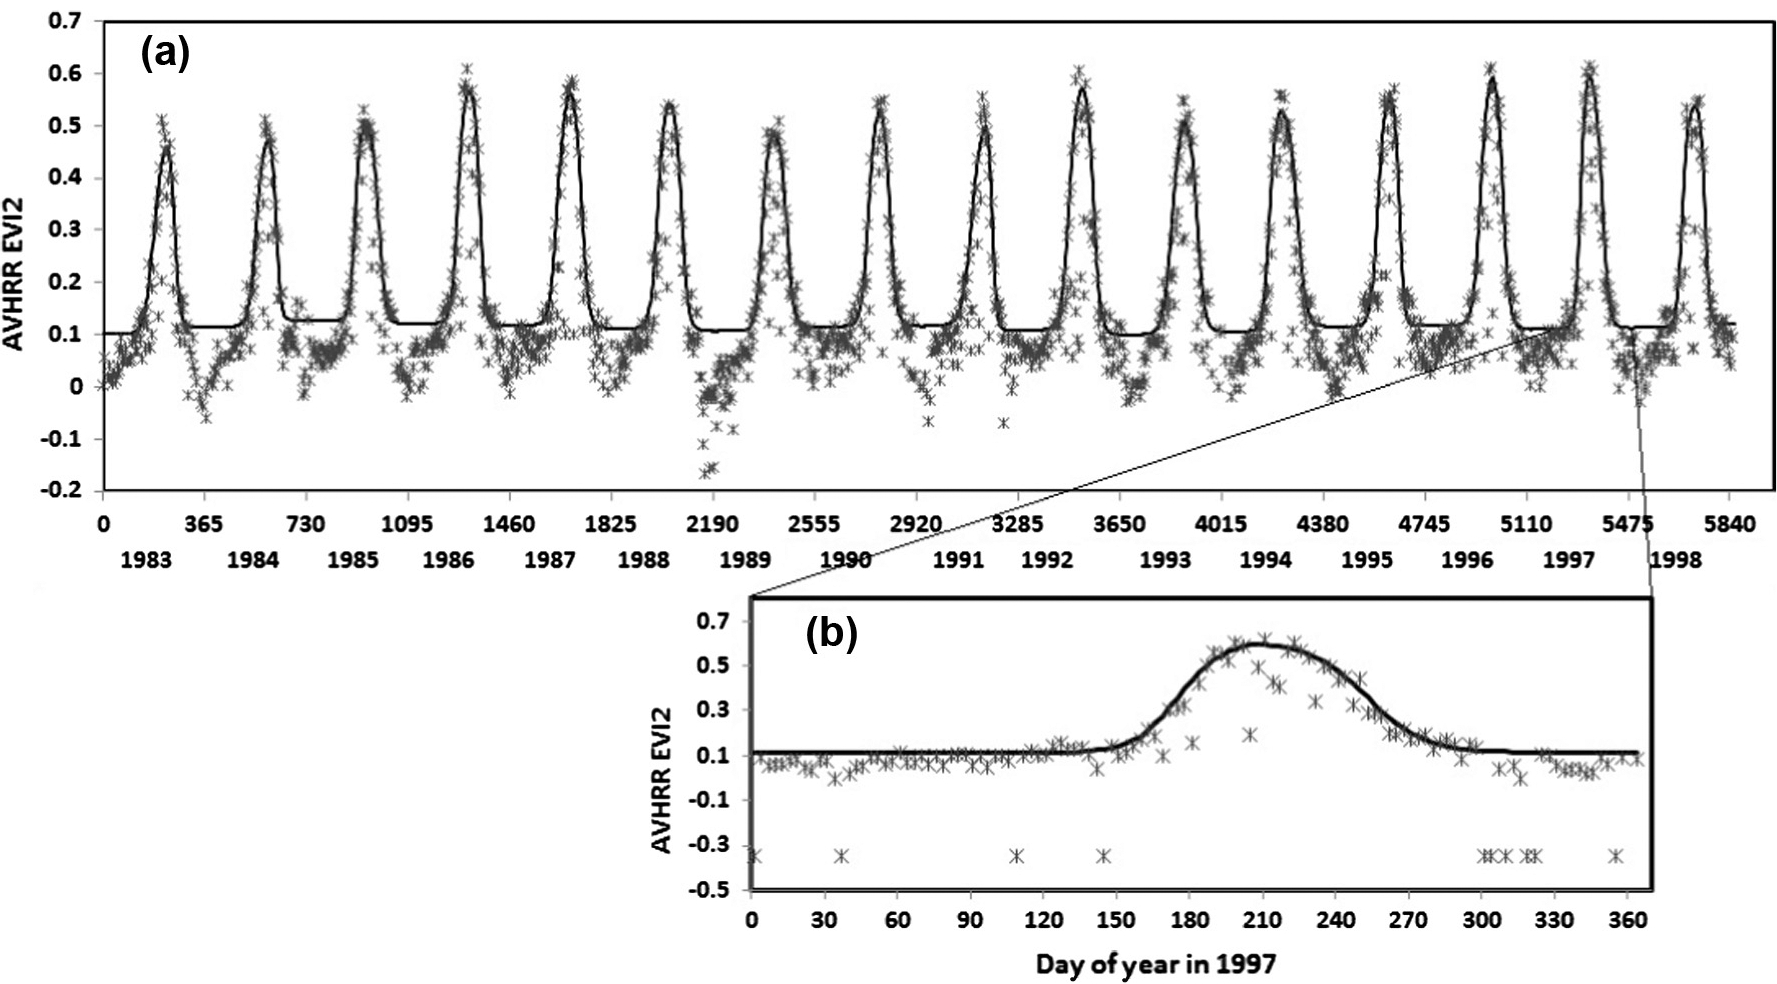
Resconstructed temporal trajectory of AVHRR EVI2 in a cropland pixel in the central United States. The solid line is the simulated curve using HPLM while the asterisks are original values (3-day composites). X-axis in (a) is the number days from January 1, 1983 (upper) and year (bottom), (b) is an example of an enlarged annual trajectory in 1997 for visualization purpose.
Fig. 6 presents examples of the reconstructed MODIS EVI2 temporal trajectories for double crops which are frequently planted in Asia such as China and India. However, daily satellite observations were noisy and missing observations always occurred because of cloud cover. The reconstructed temporal trajectories in double crop fields show that both the growing season amplitude in EVI2 and the growing season length varied greatly in individual cycles.
Fig. 6.
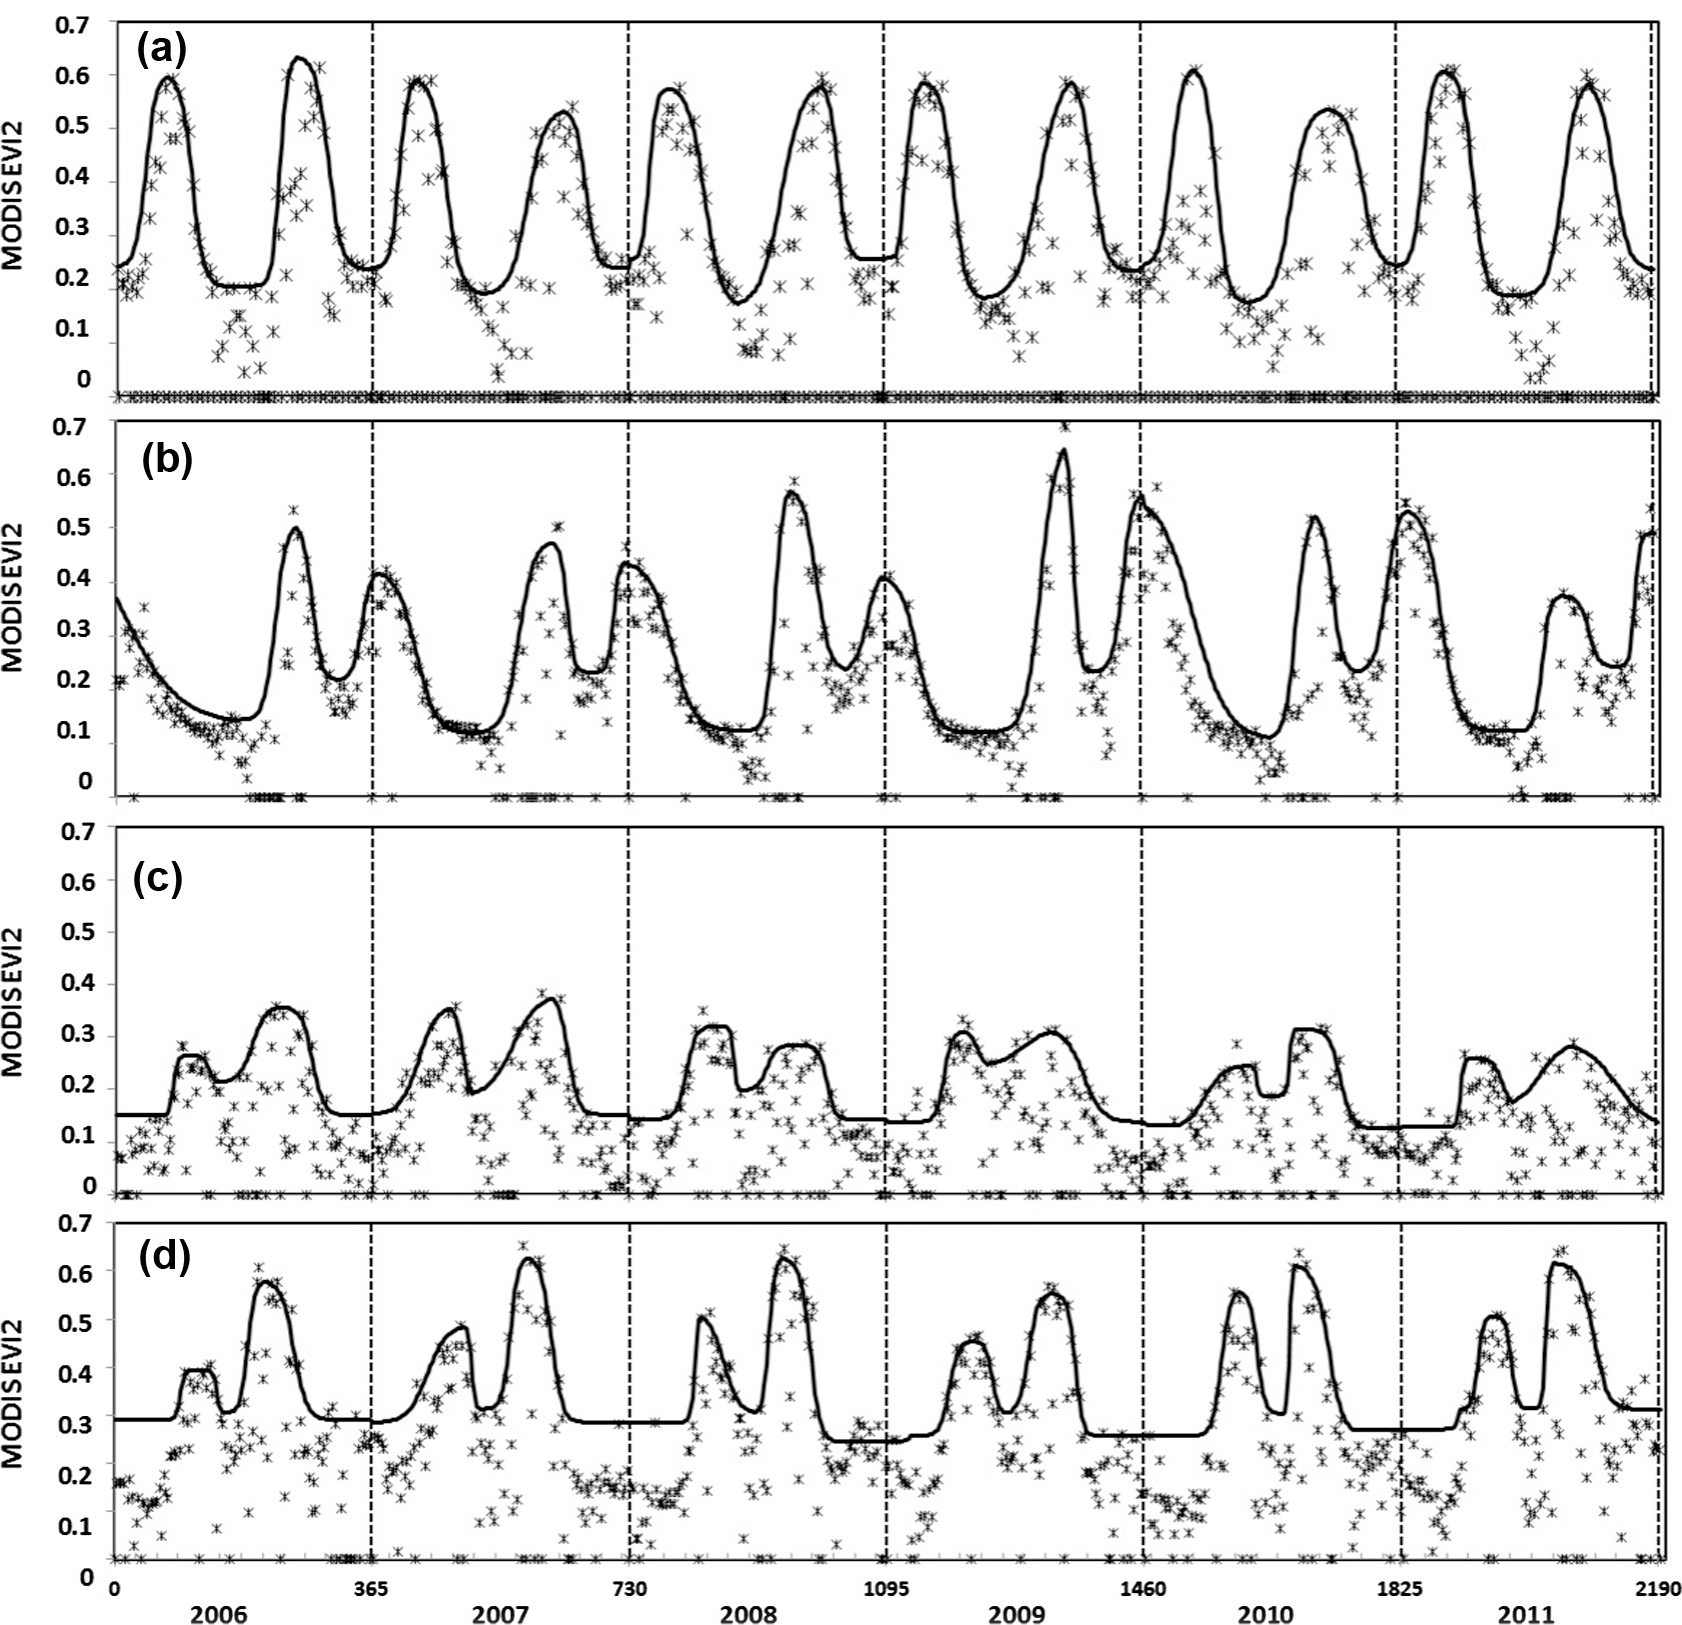
Resconstructed temporal trajectory of MODIS EVI2 in double cropland fields (randomly selected pixels). (a) Telangana in India (e.g. double rices), (b) Madhya Pradesh in India (e.g. maize and wheat or rice and wheat), (c) central China (double rices), (d) northern China (wheat and maize). The solid dark lines are reconstructed EVI2 trajectories while the asterisks are original values. All missing observations and negative EVI2 are set to zero. X-axis is the number days from Janurary 1, 2006 (upper) and year (bottom).
3.2. Temporal and spatial variation in AEVI2 and IEVI2
Fig. 7 presents the spatial pattern in average AEVI2 and IEVI2 in 2000s. The values were large in the central USA and northeastern China while they were smaller in Africa and South America. The histogram of pixels (5 km) indicates that the peak occurred at 0.2–0.25 AEVI2 in Europe, Asia, and Africa, 0.15–0.2 from South America, and 0.25–0.3 in North America (Fig. 8a). The proportion of pixel with AEVI2 larger than 0.25 was 67.6%, 86.8%, 65.6%,66.9%, 54.2%, and 38.9% in globe, North America, Europe, Asia, Africa, and South America, respectively (Fig. 8a). For IEVI2, the largest proportion of pixels appeared at 20–25 in Africa, 25–30 in Europe, Asia, and South America, 40–45 in North America (Fig. 8b). The pixel proportion with IEVI2 > 25 was 60.7% 74.1%, 57.5%,62.8%, 50.5%, 64.9% in globe, North America, Europe, Asia, Africa, and South America, respectively. Both IEVI2 and AEVI2 show that the largest value occurred in North America. Comparing the spatial pattern of cereal yield in Fig. 3, it was evident that large AEVI2 and IEVI2 values were in most cases associated with high cereal yield. This relationship from spatial pattern is consistent with previous findings that crop greenness performs well in reflecting crop yield (Benedetti and Rossini, 1993; Bolton and Friedl, 2013; Esquerdo et al., 2011) although agricultural practice could make it more complex.
Fig. 7.

Spatial pattern in crop greenness averaged from 2000–2010 at a spatial resolution of 0.05° (~5 km). (a) Greenness amplitude during a growing season (AEVI2), and (b) integrated crop greenness during growing seasons. (For interpretation of the references to color in this figure legend, the reader is referred to the web version of this article.)
Fig. 8.
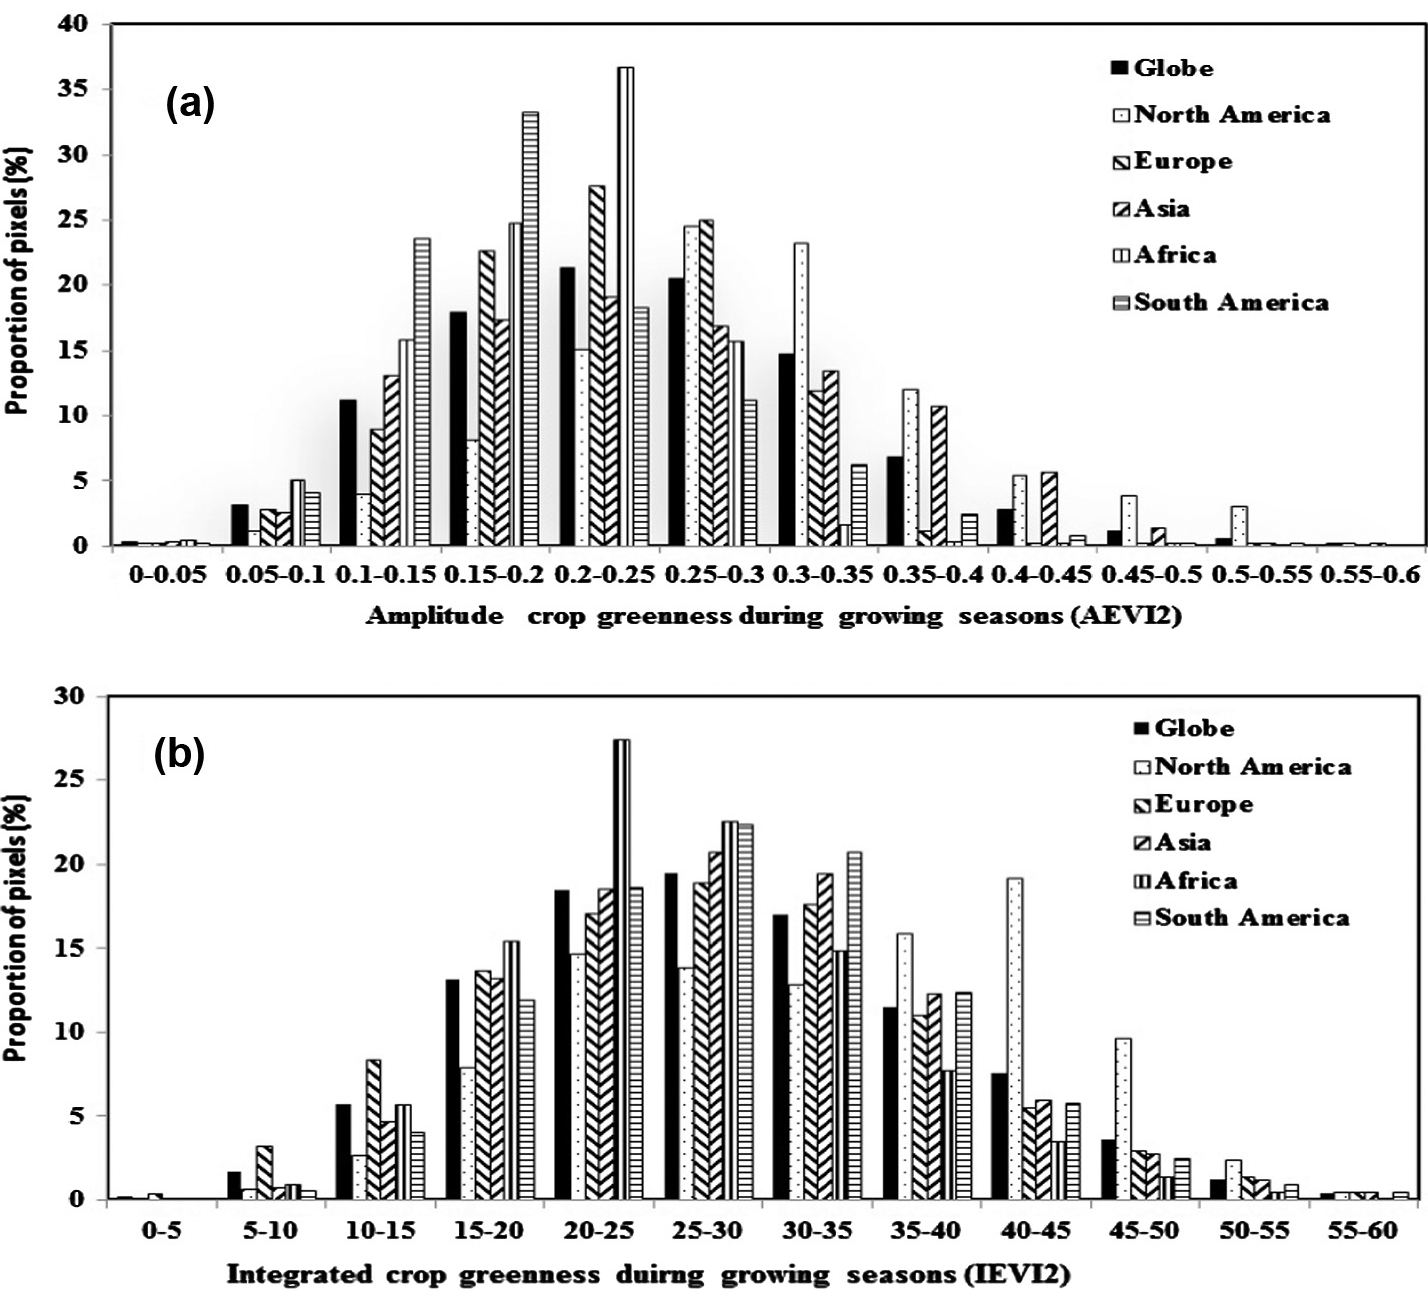
Proportion of crop pixels with the variation in AEVI2 (a) and IEVI2 (b) averaged from 2000–2010.
AEVI2 and IEVI2 varied considerably interannually during past 30 years. Fig. 9 illustrates the interannual variation in AEVI2 and IEVI2 for the three counties (the USA, China, and India) where cereal productions were the largest over the world. On average, both AEVI2 and IEVI2 were largest in the USA and followed by China and India. The greenness patterns were certainly associated with the variation in cereal yield which reflected the largest crop yield in the USA while smallest in India (Fig. 9b). The relationship between crop greenness and crop yield varies with countries considerably during past 30 years (Fig. 10). However, it is noted that EVI2 increase rapidly from 1990s to 2000s. It is likely that AVHRR data were not calibrated well with MODIS data although a set of equations were used to adjust AVHRR data (Tsend-Ayush et al., 2012). The discontinuity is likely related to the ineffective correction of water vapor which strongly absorbs LTDR AVHRR near infrared reflectance. Thus, the AVHRR EVI2 is considerably lower than MODIS EVI2 over humid regions. This systematic inconsistency would propagate some uncertainties in the models if cereal yield was directly correlated to the magnitude greenness (AEVI2 and IEVI2).
Fig. 9.
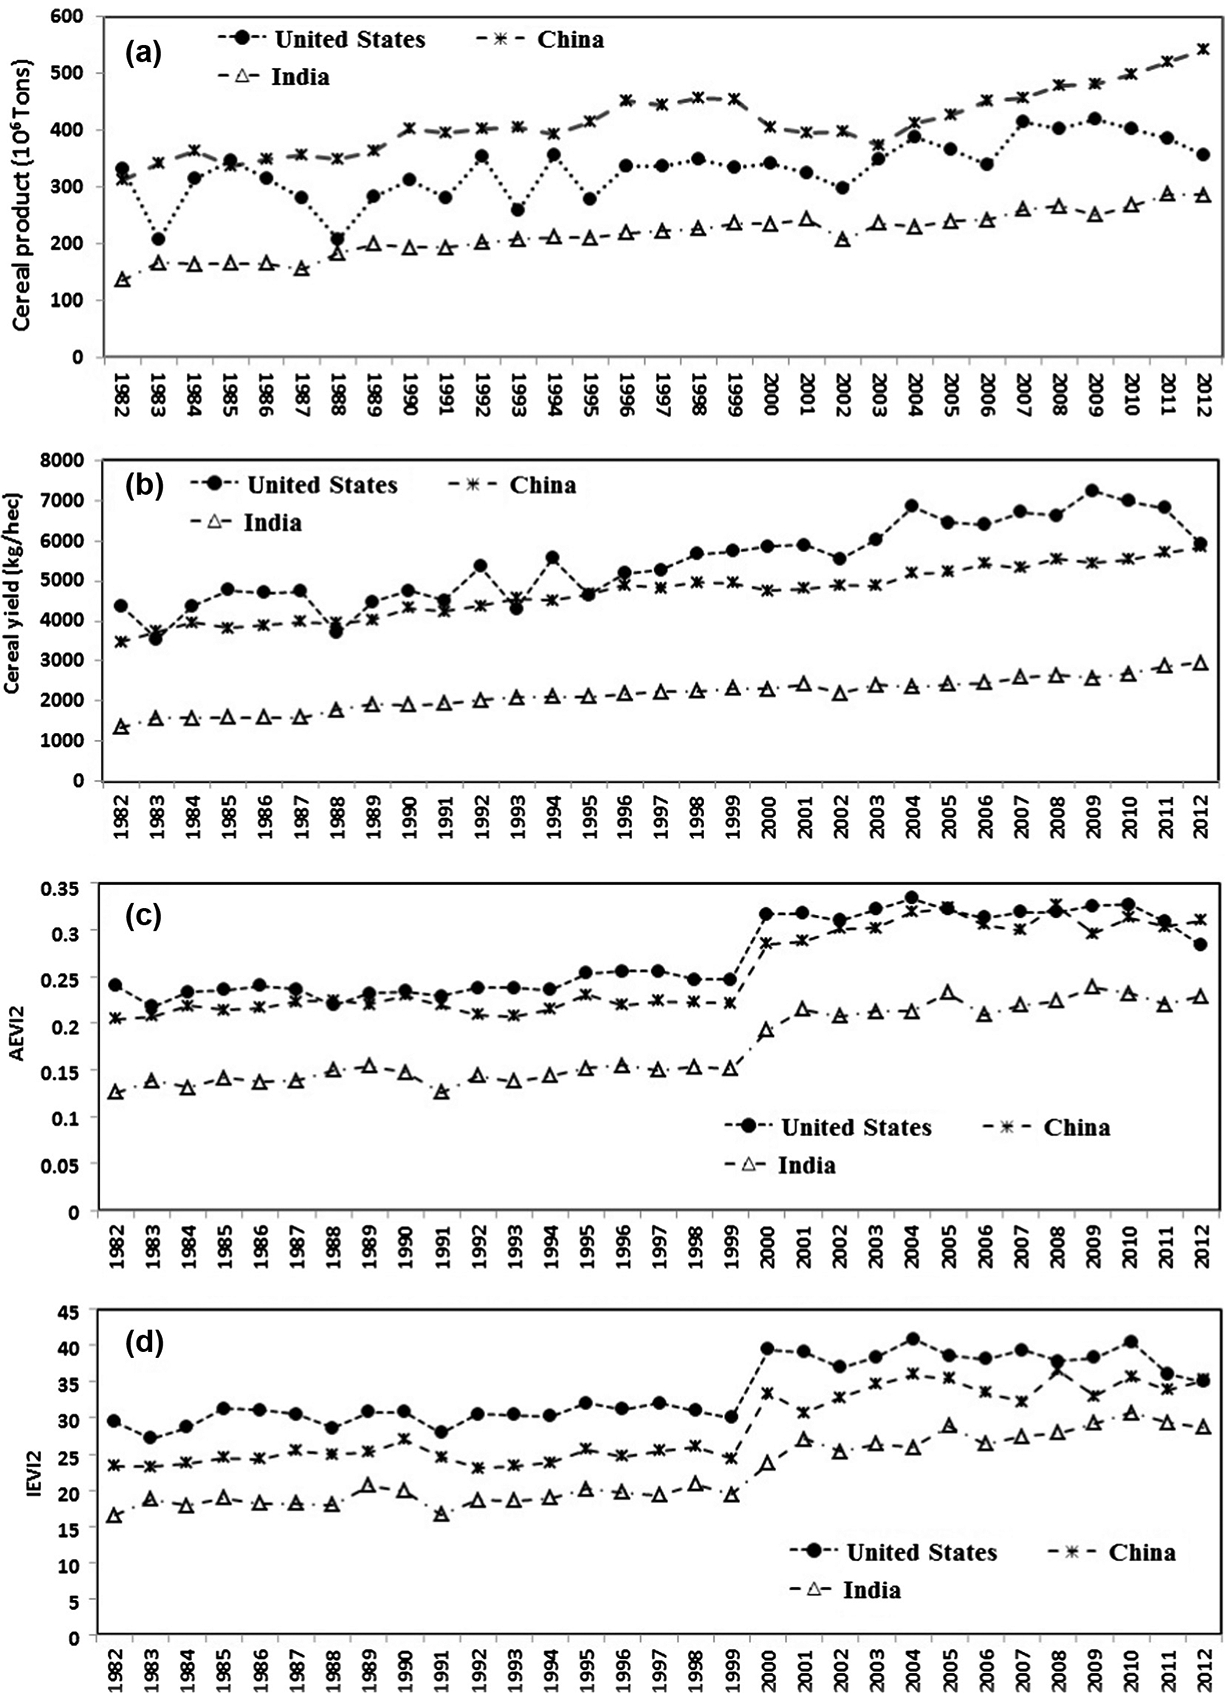
Interannual variation in cereal production (a), cereal yield (b), AEVI2 (c), and IEVI2 (d) in the United States, China, and India.
Fig. 10.
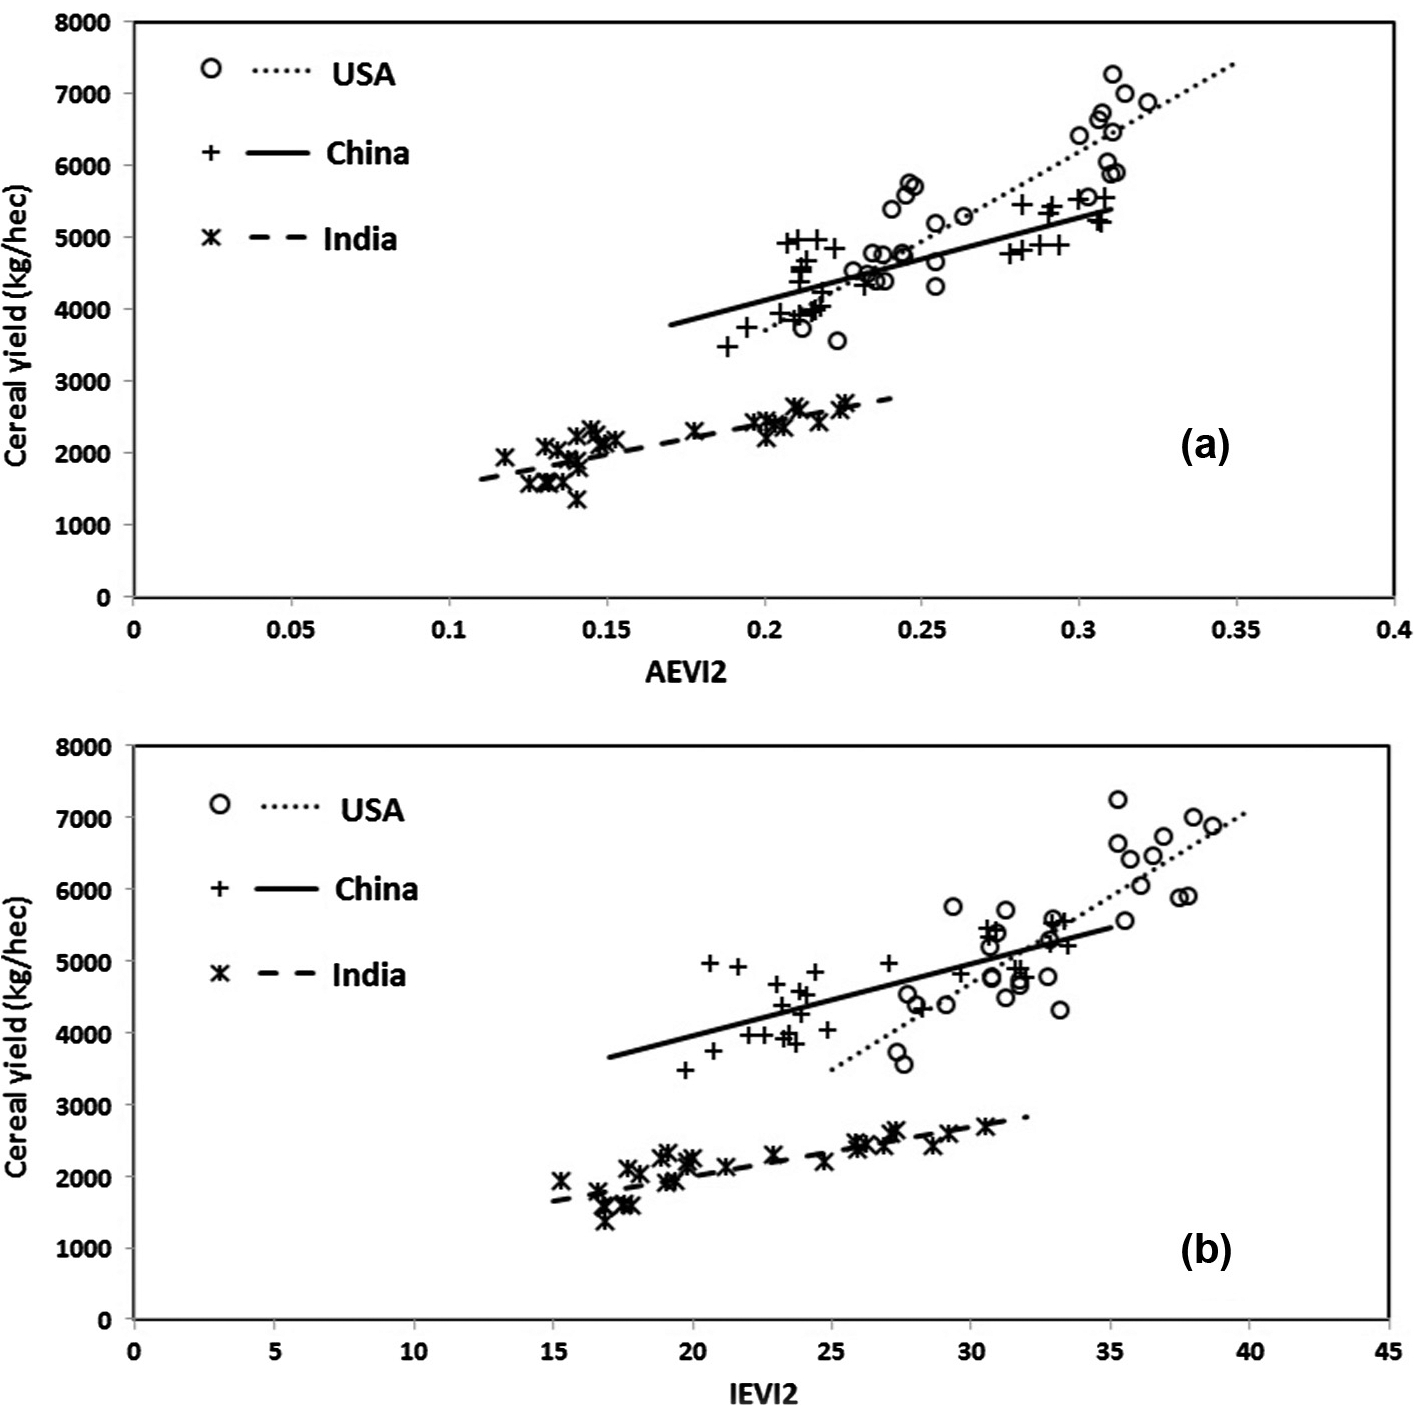
Correlation of cereal yield with (a) AEVI2 and (b) IEVI2. The lines show the linear regression values in USA, China, and India, respectively.
The correlation of cereal yield with AEVI2 and IEVI2 varied with time period and country (Table 1). The significant correlation (P value < 0.1) for both AEVI2 and IEVI2 appeared in two different periods for India, while it only occurred in 1982–1999 in the USA. In China, the significance only occurred for AEVI2 but not for IEVI2. In contrast, there was no significant correlation of cereal yield with either AEVI2 or IEVI2 in Brazil and Russia (except for AEVI2 in 1992–1999). This suggests that the magnitude greenness does not always reflect cereal yield well in a long time series.
Table 1.
Significance of correlation between crop greenness and crop yield (P values) in five countries with large cereal production. Note no data was included before 1992 in Russia.
| USA | India | China | Russia | Brazil | ||||||
|---|---|---|---|---|---|---|---|---|---|---|
| AEVI2 | IEVI2 | AEVI2 | IEVI2 | AEVI2 | IEVI2 | AEVI2 | IEVI2 | AEVI2 | IEVI2 | |
| 1982–1999 | 0.001 | 0.009 | 0.002 | 0.007 | 0.073 | 0.165 | 0.085 | 0.214 | 0.522 | 0.558 |
| 2000–2012 | 0.074 | 0.252 | 0.031 | 0.004 | 0.077 | 0.112 | 0.929 | 0.468 | 0.197 | 0.189 |
3.3. Relationship between interannually normalized greenness and cereal yield
Interannually normalized greenness is strongly correlated to the variation in cereal yield. Fig. 11 displays the correlation in six countries where the largest cereal productions were produced. IEVIr and AEVIr varied between −0.1 and 0.1, which reflects about 20% (difference/mean) of the interannual variation in IEVI and AEVI. The interannually normalized cereal yield was largest in the USA, changing between −0.12 and 0.1, while it was smallest in China, ranging between −0.02 and 0.036 among the six countries. Because IEVIr and AEVIr represent different crop growing characteristics, the stepwise regression models show strongly significant correlations with interannual variation in cereal yield (P < 0.01). Note that Russia, which is the fourth largest cereal producer during recent years, is not listed here because the statistics crop yield/production is not available before 1992.
Fig. 11.
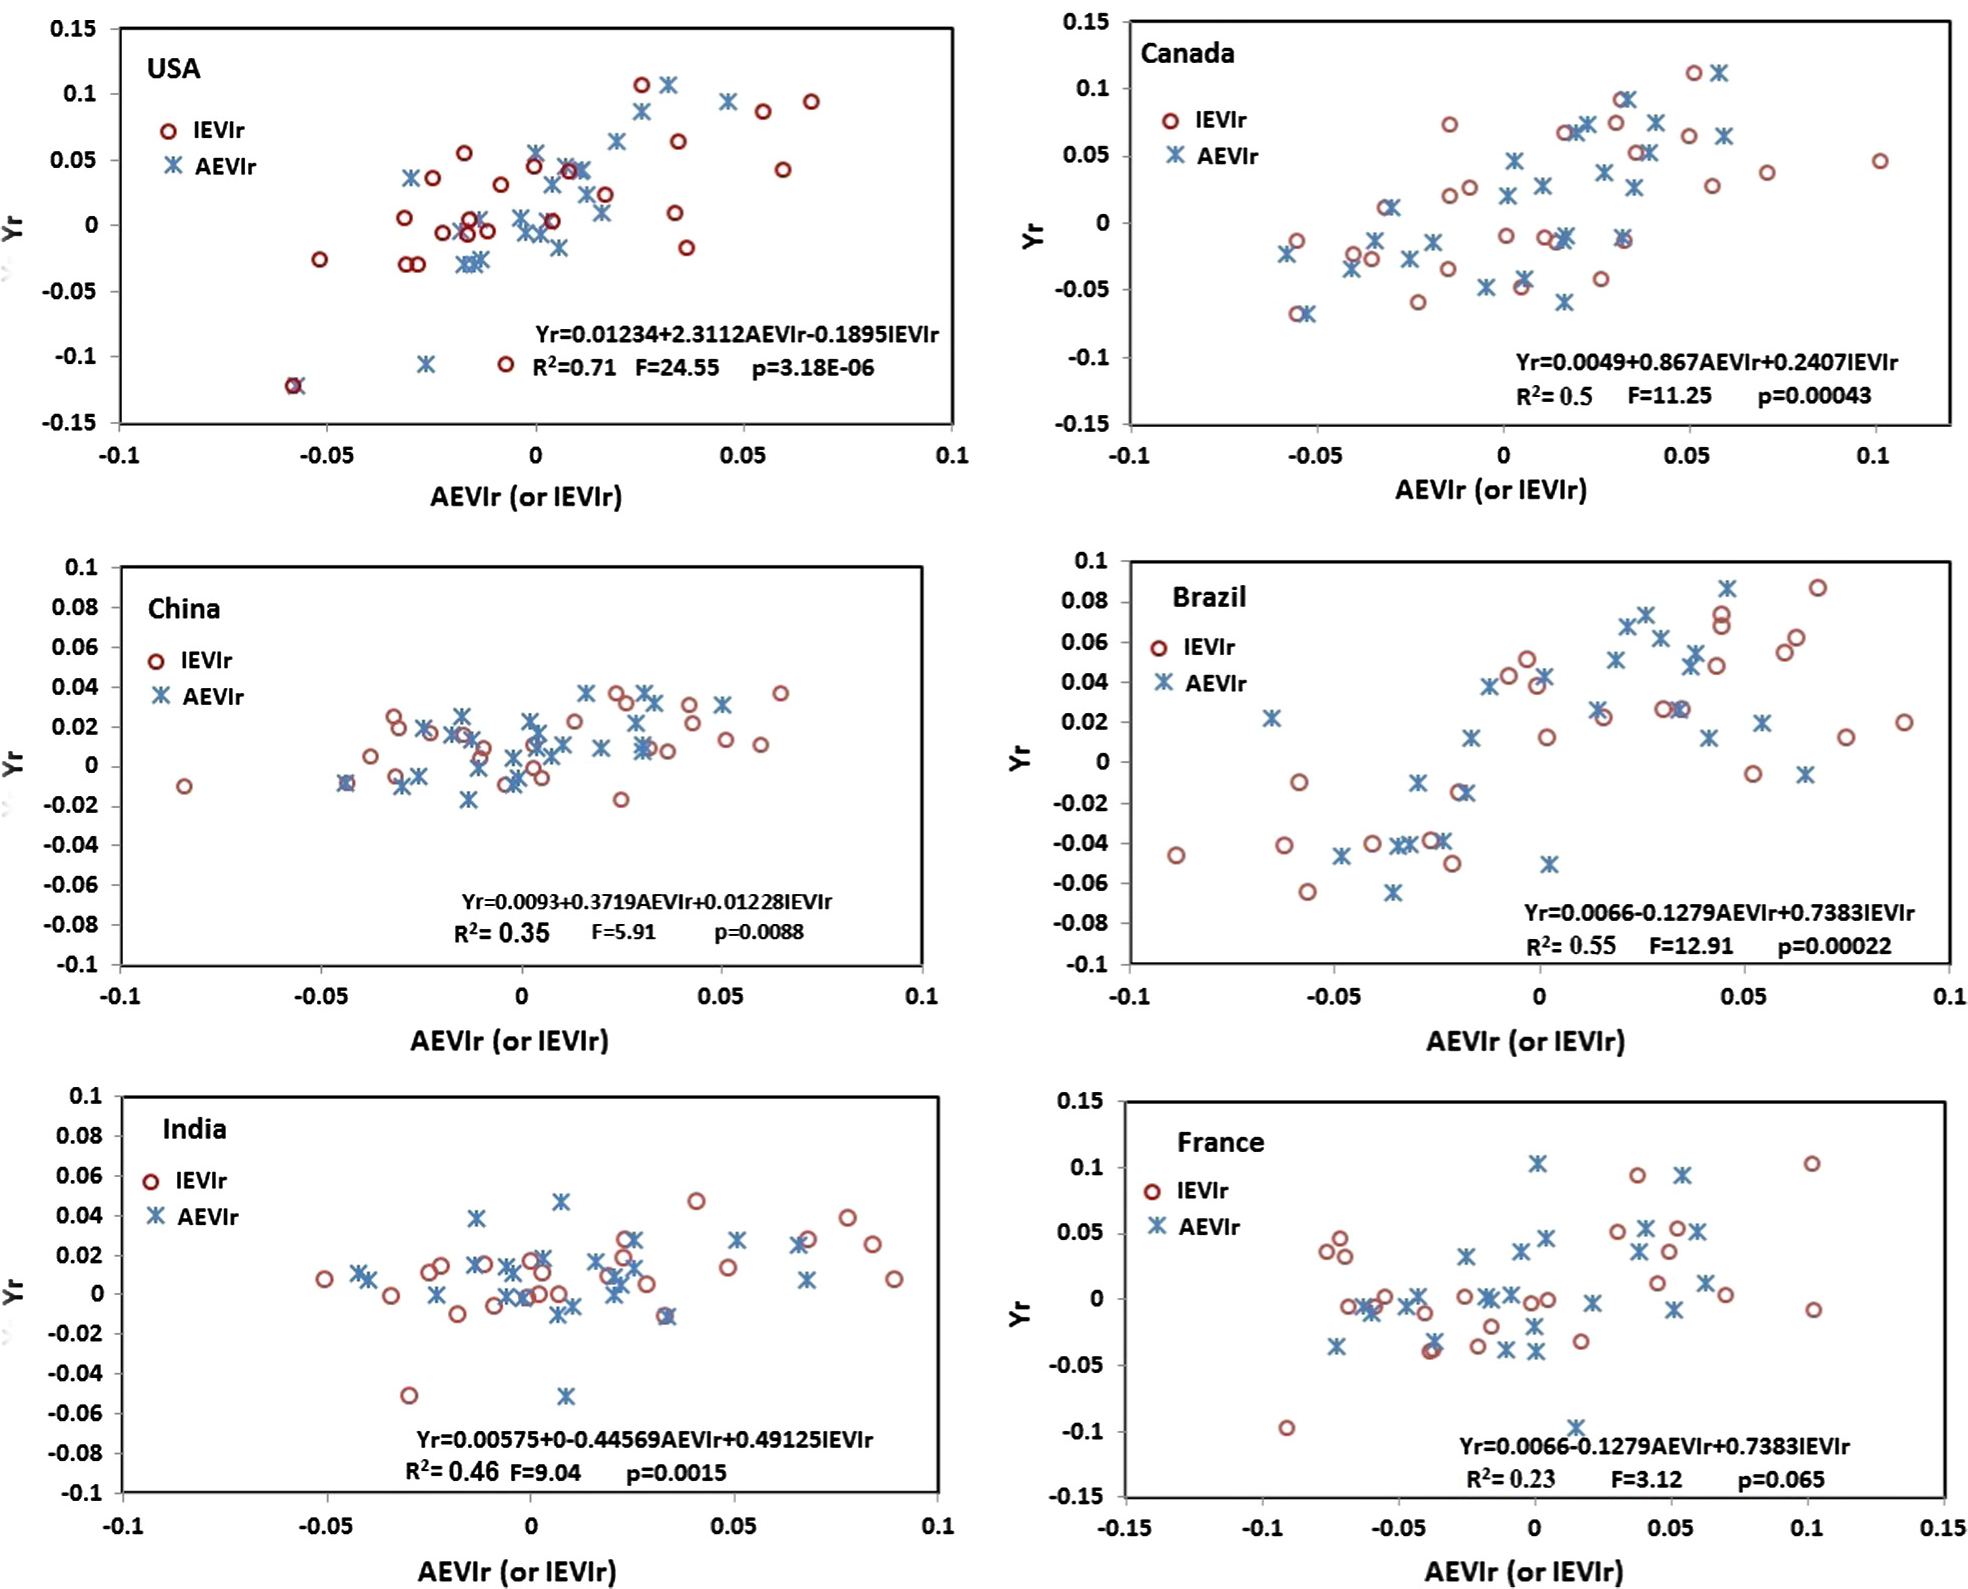
Scatter plots between Yr and both IEVIr and AEVIr for the countries with the largest cereal production across the globe.
Fig. 12 shows the spatial pattern in the relationship of interannually normalized cereal yield with IEVIr and AEVIr across the globe, respectively. The correlation was generally higher in the northern hemisphere than in the southern hemisphere (Fig. 12a and b). Overall, there were 38% and 35% of countries where the correlation coefficient was larger than 0.5 between Yr and AEVIr and between Yr and IEVIr, respectively. This suggests that AEVIr is generally a better indicator of cereal yield. The negative correlations between Yr and IEVIr or AEVIr also occurred in about 15 countries where the cereal production was low and located mainly in arid environment but correlation was generally insignificant. Clearly, a considerable amount of crop greenness in low-cropping density countries was not able to be detected accurately due to the mixed pixel effects in 0.05° satellite data and relatively poor cropland classification. In such regions, fine resolution data are certainly needed.
Fig. 12.

Correlation between interannually-normalized cereal yield and EVI2 greenness from 1982–2012. (a) Correlation coefficient (R2) between AEVI2 and cereal yield, (b) correlation coefficient (R2) between IEVI2 and cereal yield, (c) correlation coefficient (R2) between cereal yield and both IEVI2 and AEVI2, (d) Confidence level (%) of the stepwise regression models. (For interpretation of the references to color in this figure legend, the reader is referred to the web version of this article.)
The stepwise regression improves the correlation between cereal yield and both IEVIr and AEVIr (Fig. 12c and d). There were about 50% of countries where the correlation coefficient was larger than 0.5. The confidence level of the stepwise regression model was larger than 90% (P value < 0.1) in most countries in the northern hemisphere. It was over 95% in most of the countries with large cereal production. Poor correlation mainly appeared in Africa where croplands were basically sparsely distributed and hard to be captured from coarse resolution satellite data.
The average of absolute relative error in the yield predication was relatively smaller in America, Europe and East Asia (Fig. 13). In the countries of 10 largest cereal production, the prediction error was less than 9% during past three decades except Russia. For example, the prediction and observation of cereal yield from 1982–2012 were distributed along a 1:1 line in the USA, China, and India (Fig. 14). However, the model prediction was relatively poor in most of counties across Africa. This was likely associated the small areas in cereal croplands, where EVI2 at coarse resolution was contaminated by non-crop growth and was insufficient in extracting crop growth.
Fig. 13.
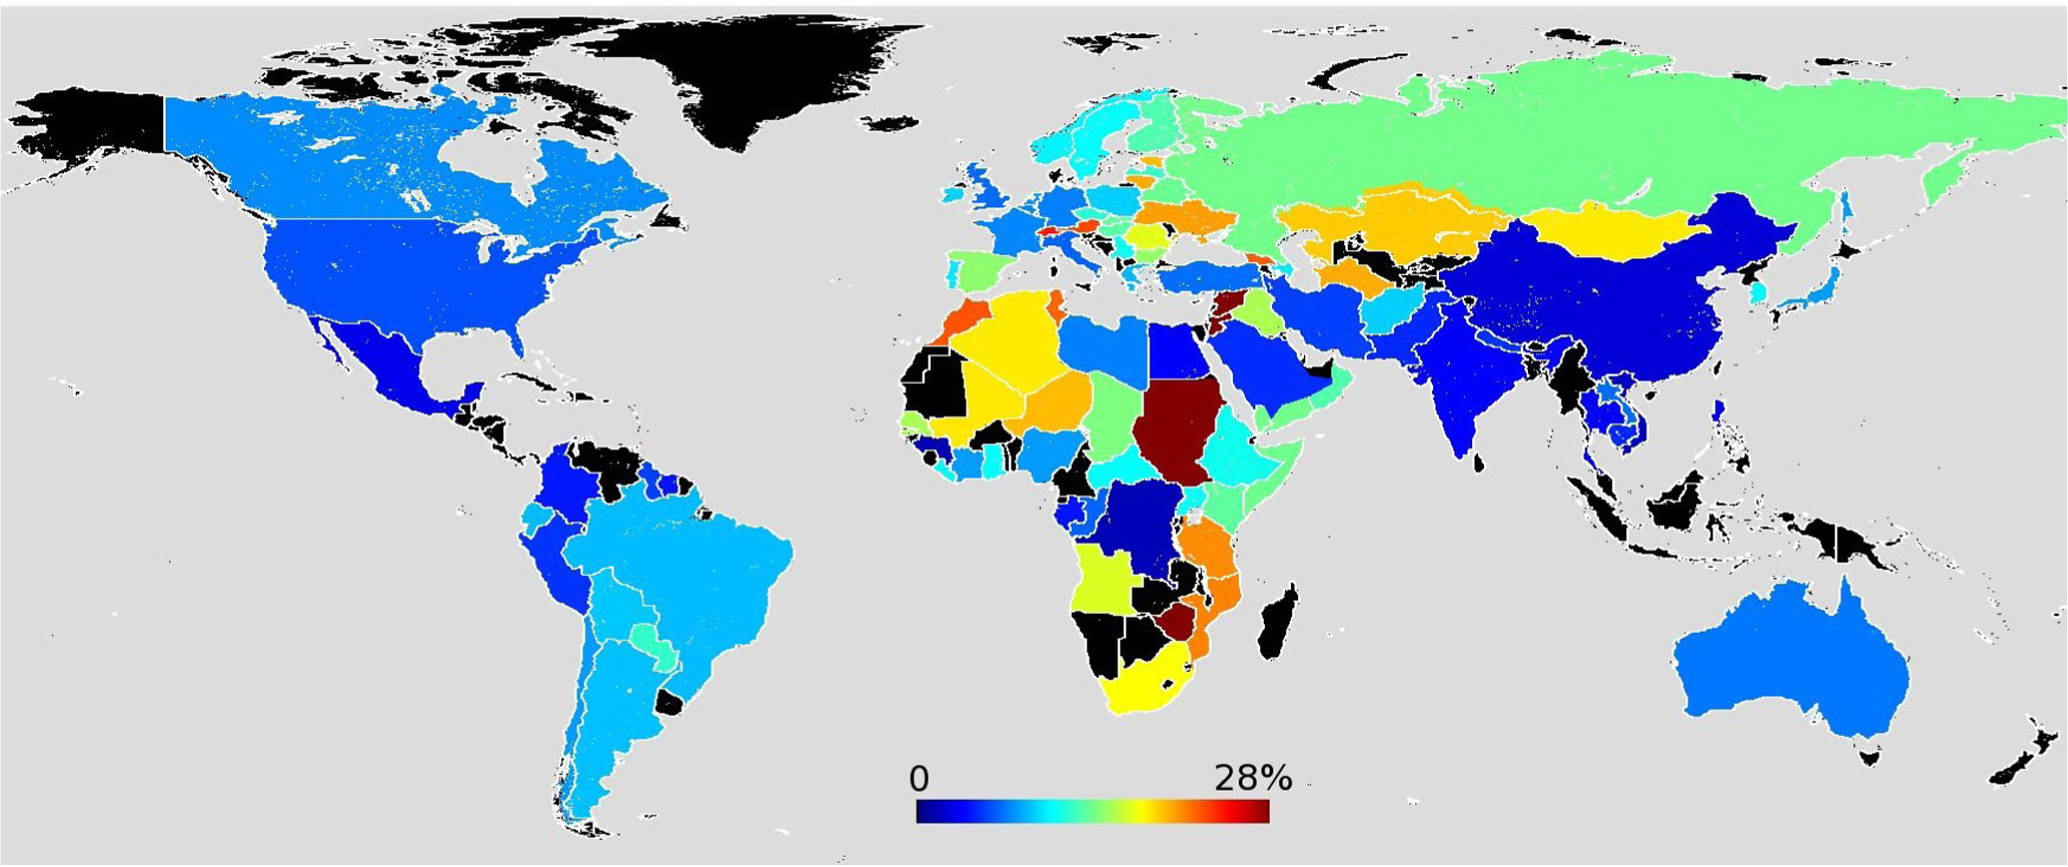
Average of absolute relative error from 1982–2012 calculated from a leave-one-out cross-validation approach.
Fig. 14.
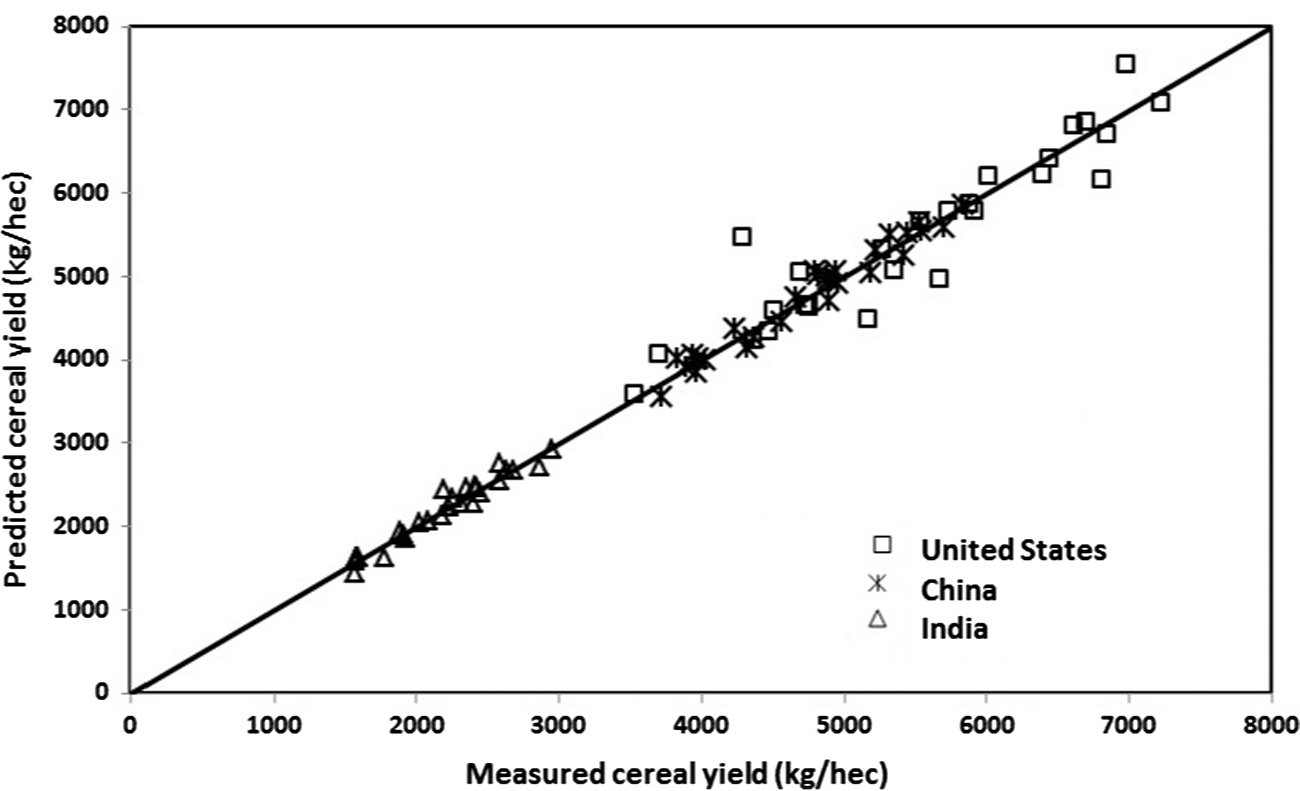
Scatterplot between observed and model predicted cereal yield from 1982–2012 in the USA, China, and India.
3.4. Evaluation of relationship between crop phenology and crop yield in the Central United States
Interannual variation in the crop greenness (AEVIr and IEVIr) effectively reflected the variation of crop yield in four states in the Central United States (Fig. 15). Specifically, the correlation models in Minnesota and Iowa were strongly significant (P < 0.0001) with the correlation coefficient higher than 0.8, respectively. When the established parameters were used for Eq. (8) to predict crop yield, the model in each state could produce a prediction accuracy of larger than 90%. Similarly, significant statistical models were found in Indiana and Ohio (P < 0.001), which were able to predict crop yield with an accuracy of 88%, respectively.
Fig. 15.
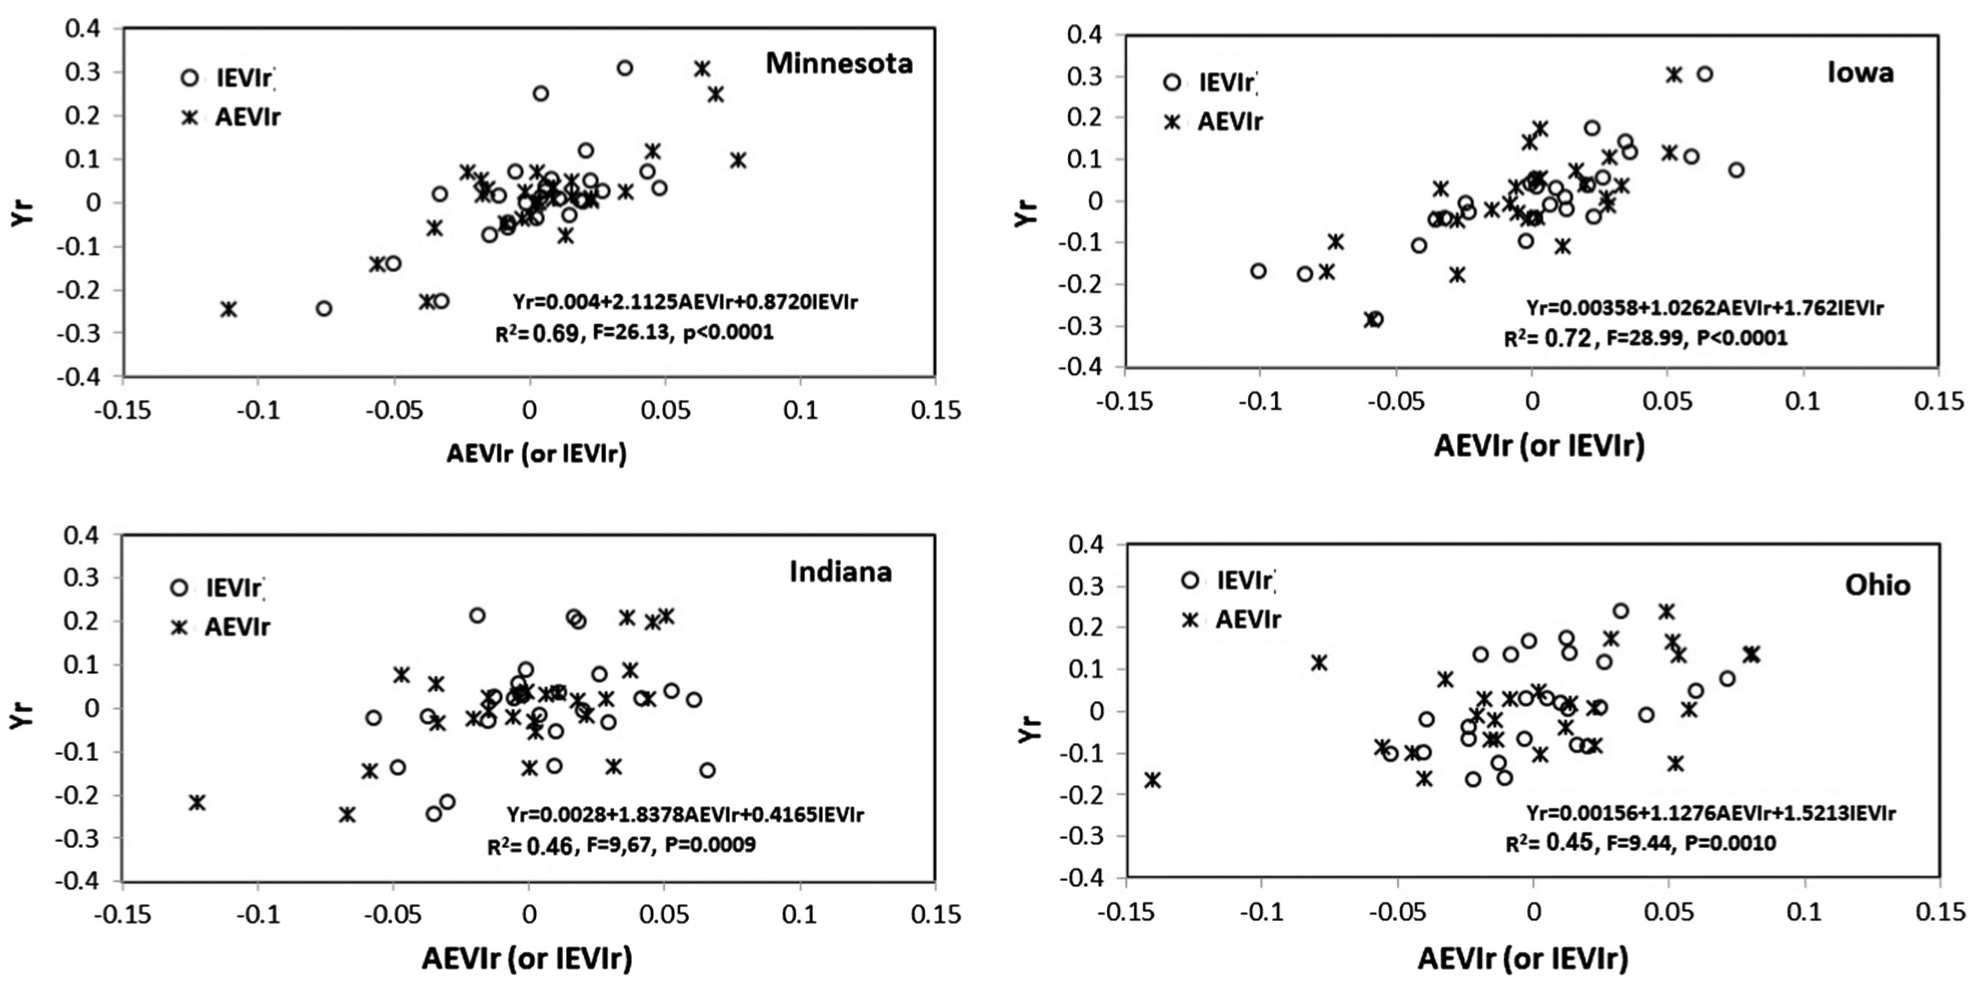
Scatter plots between interannual variations in crop yield (Yr) and vegetation greenness (IEVIr and AEVIr) at a state scale in central United States.
4. Discussion and conclusions
This study investigated global cereal yield using greenness derived from coarse resolution satellite data during last three decades. Crop greenness values in the EVI2 amplitude and EVI2 integration during a growing season were effectively calculated after temporal EVI2 trajectory had been reconstructed and crop phenological metrics had been detected. The crop phenology detection is particularly important to reduce effects from the noises in raw EVI2 data and the temporal shift in crop growing season spatially. The algorithm of reconstructing crop growth trajectory in this study has several advantages (Zhang, 2015) which include: (1) snow cover, cloud-caused gaps and local irregular EVI2 variation can be effectively removed; (2) HPLM provides a simple, bounded, continuous function for modeling growth and decay processes; (3) each parameter in HPLM can be assigned to a biophysical meaning related to crop growth; (4) the logistical model performs superiorly to both Fourier-based and asymmetric Gaussian functions for fitting remote sensing-based phenology development (Beck et al., 2006). Further, the phenological results detected from this approach have been verified in various studies. Indeed, the logistic model for detecting vegetation phenology has been validated using observations of forest leaf developments (Ahl et al., 2006; Ganguly et al., 2010; Liang et al., 2011; Zhang et al., 2006), where the satellite detections were closely related to field observations. Using MODIS EVI in croplands, this approach detected winter wheat turning green, heading, milky ripe, and harvest with an accuracy of less than 5 days in northern China (Shuai et al., 2013), and detected crop phenology from 2001–2009 which were comparable with ground observations in winter wheat (R2 = 0.90) and summer maize (R2 = 0.93) (Xiao et al., 2013). Moreover, the interannual variation in AVHRR EVI2 crop phenological trajectory at 0.05° was identical to the interannual tower-observed GPP trajectories in Bondville in Illinois (Zhang, 2015).
The results from this study suggest that interannual variation in EVI2 greenness is an effective indicator of interannual cereal yield changes although absolute satellite greenness is not always linearly correlated to cereal yield during last three decades. The EVI2 magnitude was a more effective predictor in cereal yield in some countries while EVI2 integration during annual growing seasons was better in other countries across the world. Combination of these two parameters significantly improved the predication of cereal yield, where the model confidence was generally higher than 95% and the prediction error was less than 9%, particularly in the countries with large cereal production. However, the model prediction was relatively poor in Africa, where crop greenness was difficult to extract accurately from coarse satellite data because croplands were sparsely distributed with small farm size and the census data of cereal yield for model establishment was also relatively poor.
The reliability of EVI2 greenness based models for monitoring crop yield is mainly affected by the following factors. First, the calculation of regional crop greenness is strongly dependent on the quality of cropland classification data. Currently, global croplands are commonly obtained from three land cover products which are the GLC2000 product (Bartholome and Belward, 2005), MODIS land cover product collection 5 (Friedl et al., 2010), and GlobCover (Arino et al., 2008). However, the overall accuracy of croplands from these products is less than 77% (Fritz et al., 2011) and the spatial discrepancy among these products is significant (Kaptue Tchuente et al., 2011; Ran et al., 2010; Vintrou et al., 2012; Wu et al., 2008). As a result, the accuracy of the crop yield models would vary with cropland data used.
Second, the purity of cropland in a pixel is closely related to the spatial resolution of satellite data. Crop yield has been successfully estimated in various studies using coarse resolution satellite images with high temporal frequency. However, each pixel at a coarse resolution (0.05°) generally represents mixed crop types or mixture between crops and natural vegetation, which would have considerable impacts on the estimation of crop yield. Certainly, the quality of crop monitoring will increase with the increase of the spatial resolution of satellite data. However, it is extremely difficult to quantitatively evaluate the impact of the spatial resolution of the crop phenology parameters on the capability of estimating crop yield at a global scale. It is due to the fact that spatial patterns in croplands play a fundamental role in defining the optimal resolution for a certain region (Rembold et al., 2013). In the Central United States, for example, crop is relatively homogeneously distributed, crop greenness in a 0.05° pixel is less contaminated by natural vegetation and the vegetation indices mainly reflect the crop growth condition. In contrast, for the crop areas with highly fragmented and heterogeneous patterns, such as African agriculture, parts of Europe, southern China and India, high resolution data would significantly reduce the pixels with mixed problem, which would improve greatly the estimation of crop yield. To monitor crop yield for specific crop types and locations precisely, high spatial and temporal resolution data are needed, but such data are currently not available. One potential approach is to fuse high spatial resolution Landsat observations and high temporal resolution MODIS data. In this study, crop yield was estimated by statistically linking to interannual variation in crop greenness. The statistic model of interannual variation could greatly minimize the influences from the coarse spatial resolution data on the predication of crop yield at state or national scales. It is because interannual variation (anomalies) of crop greenness relates to local meteorological condition (e.g., droughts), which limits the spatial resolution impacts on crop yield estimation.
Third, the reliability of crop yield varies with the choices of vegetation indices. Both NDVI and EVI/EVI2 are commonly used for monitoring crop growth and yield. NDVI could work more effectively in some regions or crop types while EVI/EVI2 might be better in others. Moreover, some other vegetation indices may also have advantages in specific regions. For example, Normalized Difference Water Index (NDWI) is more sensitive to irrigation in semi-arid areas with low-density agriculture than both EVI2 and NDVI (Bolton and Friedl, 2013).
The coarse resolution satellite data, particularly AVHRR and MODIS data, have been widely used for the estimation of crop yield in local areas (Doraiswamy et al., 2003; Kogan et al., 2013, 2012; Maselli and Rembold, 2001) and applied in a large number of operational national and international agricultural monitoring systems for providing critical agricultural information (Becker-Reshef et al., 2010). The estimation of crop yield from coarse resolution data is impacted by various factors and is incapable to provide detailed spatial pattern, but it can provide timely information on global crop production which is indispensable for combating the growing stress on the world’s crop production and for securing both short-term and long-term stable and reliable supply of food. The simple models established in this study have the capability of monitoring national cereal yield from coarse resolution satellite data with a reasonable accuracy for individual countries across the world. This approach is expected to monitor global crop growth and yield in near real time using Visible/Infrared Imager/Radiometer Suite (VIIRS) observations. VIIRS onboard the Suomi National Polar-orbiting Partnership (S-NPP) satellite was launched in October 2011 and is the primary instrument for a suite of Environmental Data Records (EDR), including vegetation indices. Daily global VIIRS products are operationally produced and available at NOAA’s Comprehensive Large Array-Data Stewardship System (CLASS) web site (http://www.class.ngdc.noaa.gov/saa/products/welcome) with a latency of 6 h (Vargas et al., 2013). The operational VIIRS data make it practicable to estimate crop yield in near real time. The timely prediction could provide critical information for worldwide crop monitoring, cereal trade and food management and it has direct impact on year-to-year national and international economies (Hayes and Decker, 1996).
Acknowledgements
This work was supported by NASA contracts NNX15AB96A and NOAA contract JPSS_PGRR2_14. The reviewers are thanked for the constructive comments during the review process of the manuscript.
References
- Ahl DE, Gower ST, Burrows SN, Shabanov NV, Myneni RB, Knyazikhin Y, 2006. Monitoring spring canopy phenology of a deciduous broadleaf forest using MODIS. Remote Sens. Environ 104, 88–95. [Google Scholar]
- Alemu WG, Henebry GM, 2013. Land surface phenologies and seasonalities using cool earthlight in mid-latitude croplands. Environ. Res. Lett 8. [Google Scholar]
- Arino O, Bicheron P, Achard F, Latham J, Witt R, Weber JL, 2008. GLOBCOVER the most detailed portrait of earth. ESA Bull. – Eur. Space Agency, 24–31. [Google Scholar]
- Ashourloo D, Mobasheri MR, Huete A, 2014. Evaluating the effect of different wheat rust disease symptoms on vegetation indices using hyperspectral measurements. Remote Sens. 6, 5107–5123. [Google Scholar]
- Bartholome E, Belward AS, 2005. GLC2000: a new approach to global land cover mapping from Earth observation data. Int. J. Remote Sens 26, 1959–1977. [Google Scholar]
- Beck PSA, Atzberger C, Hogda KA, Johansen B, Skidmore AK, 2006. Improved monitoring of vegetation dynamics at very high latitudes: a new method using MODIS NDVI. Remote Sens. Environ 100, 321–334. [Google Scholar]
- Becker-Reshef I, Justice C, Sullivan M, Vermote E, Tucker C, Anyamba A, Small J, Pak E, Masuoka E, Schmaltz J, Hansen M, Pittman K, Birkett C, Williams D, Reynolds C, Doorn B, 2010. Monitoring global croplands with coarse resolution earth observations: the global agriculture monitoring (GLAM) project. Remote Sens. 2, 1589–1609. [Google Scholar]
- Beeri O, Peled A, 2009. Geographical model for precise agriculture monitoring with real-time remote sensing. ISPRS J. Photogrammetry Remote Sens 64, 47–54. [Google Scholar]
- Behmann J, Steinrucken J, Plumer L, 2014. Detection of early plant stress responses in hyperspectral images. Isprs J. Photogrammetry Remote Sens 93, 98–111. [Google Scholar]
- Benedetti R, Rossini P, 1993. On the use of ndvi profiles as a tool for agricultural statistics – the case-study of wheat yield estimate and forecast in Emilia-Romagna. Remote Sens. Environ 45, 311–326. [Google Scholar]
- Bernardes T, Moreira MA, Adami M, Giarolla A, Rudorff BFT, 2012. Monitoring biennial bearing effect on coffee yield using MODIS remote sensing imagery. Remote Sens. 4, 2492–2509. [Google Scholar]
- Bolton DK, Friedl MA, 2013. Forecasting crop yield using remotely sensed vegetation indices and crop phenology metrics. Agric. For. Meteorol 173, 74–84. [Google Scholar]
- Chong DLS, Mougin E, Gastelluetchegorry JP, 1993. Relating the global vegetation index to net primary productivity and actual evapotranspiration over Africa. Int. J. Remote Sens 14, 1517–1546. [Google Scholar]
- Conway G, Toenniessen G, 1999. Feeding the world in the twenty-first century.Nature 402, C55–C58. [DOI] [PubMed] [Google Scholar]
- Csornai G, Wirnhardt C, Suba Z, Nador G, Martinovich L, Tikasz L, Lelkes L, Kocsis A, Zelei G, 2003. The operational crop monitoring and production forecast program (CROPMON 1997) and other RS based applications In: Bebes (Ed.), Geoinformation for European-Wide Integration. Mill Press, Rotterdam. [Google Scholar]
- Dabrowska-Zielinska K, Kogan F, Ciolkosz A, Gruszczynska M, Kowalik W, 2002. Modelling of crop growth conditions and crop yield in Poland using AVHRR-based indices. Int. J. Remote Sens 23, 1109–1123. [Google Scholar]
- Domenikiotis C, Spiliotopoulos M, Tsiros E, Dalezios NR, 2004. Early cotton yield assessment by the use of the NOAA/AVHRR derived vegetation condition index (VCI) in Greece. Int. J. Remote Sens 25, 2807–2819. [Google Scholar]
- Doraiswamy PC, Moulin S, Cook PW, Stern A, 2003. Crop yield assessment from remote sensing. Photogrammetric Eng. Remote Sens 69, 665–674. [Google Scholar]
- Duvick DN, Cassman KG, 1999. Post-green revolution trends in yield potential of temperate maize in the north-central United States. Crop Sci. 39, 1622–1630. [Google Scholar]
- Edgerton MD, 2009. Increasing crop productivity to meet global needs for feed, food, and fuel. Plant Physiol. 149, 7–13. [DOI] [PMC free article] [PubMed] [Google Scholar]
- Esquerdo JCDM, Zullo J, Antunes JFG, 2011. Use of NDVI/AVHRR time-series profiles for soybean crop monitoring in Brazil. Int. J. Remote Sens 32, 3711–3727. [Google Scholar]
- FAO, 2011. Global Strategy to Improve Agricultural and Rural Statistics. Rome, Italy. [Google Scholar]
- Friedl MA, Sulla-Menashe D, Tan B, Schneider A, Ramankutty N, Sibley A, Huang XM, 2010. MODIS Collection 5 global land cover: algorithm refinements and characterization of new datasets. Remote Sens. Environ 114, 168–182. [Google Scholar]
- Fritz S, See L, McCallum I, Schill C, Obersteiner M, van der Velde M, Boettcher H, Havlik P, Achard F, 2011. Highlighting continued uncertainty in global land cover maps for the user community. Environ. Res. Lett 6. [Google Scholar]
- Funk C, Budde ME, 2009. Phenologically-tuned MODIS NDVI-based production anomaly estimates for Zimbabwe. Remote Sens. Environ 113, 115–125. [Google Scholar]
- Ganguly S, Friedl MA, Tan B, Zhang XY, Verma M, 2010. Land surface phenology from MODIS: characterization of the collection 5 global land cover dynamics product. Remote Sens. Environ 114, 1805–1816. [Google Scholar]
- Goward SNDDG, 1987. Evaluating North American net primary productivity with satellite observations. Adv. Space Res 7, 165–174. [Google Scholar]
- Groten SME, 1993. Ndvi – crop monitoring and early yield assessment of burkinafaso. Int. J. Remote Sens 14, 1495–1515. [Google Scholar]
- Gumma MK, Thenkabail PS, Maunahan A, Islam S, Nelson A, 2014. Mapping seasonal rice cropland extent and area in the high cropping intensity environment of Bangladesh using MODIS 500 m data for the year 2010. Isprs J. Photogrammetry Remote Sens 91, 98–113. [Google Scholar]
- Hatfield JL, Pinter PJ, 1993. Remote-sensing for crop protection. Crop Prot. 12,403–413. [Google Scholar]
- Hayes MJ, Decker WL, 1996. Using NOAA AVHRR data to estimate maize production in the United States Corn Belt. Int. J. Remote Sens 17, 3189–3200. [Google Scholar]
- Huete A, Didan K, Miura T, Rodriguez EP, Gao X, Ferreira LG, 2002. Overview of the radiometric and biophysical performance of the MODIS vegetation indices. Remote Sens. Environ 83, 195–213. [Google Scholar]
- Huete AR, Didan K, Shimabukuro YE, Ratana P, Saleska SR, Hutyra LR, Yang WZ, Nemani RR, Myneni R, 2006. Amazon rainforests green-up with sunlight in dry season. Geophys. Res. Lett 33. [Google Scholar]
- ITA, 2002. ICARE: Integrated Crop Area Estimates, Final MARS/JRC Report. [Google Scholar]
- Jiang ZY, Huete AR, Didan K, Miura T, 2008. Development of a two-band enhanced vegetation index without a blue band. Remote Sens. Environ 112, 3833–3845. [Google Scholar]
- Jiao XF, Kovacs JM, Shang JL, McNairn H, Walters D, Ma BL, Geng XY, 2014. Object-oriented crop mapping and monitoring using multi-temporal polarimetric RADARSAT-2 data. Isprs J. Photogrammetry Remote Sens 96, 38–46. [Google Scholar]
- Kaptue Tchuente AT, Roujean JL, De Jong SM, 2011. Comparison and relative quality assessment of the GLC2000, GLOBCOVER, MODIS and ECOCLIMAP land cover data sets at the African continental scale. Int. J. Appl. Earth Obs. Geoinf 13, 207–219. [Google Scholar]
- Kogan F, Gitelson A, Zakarin E, Spivak L, Lebed L, 2003. AVHRR-based spectral vegetation index for quantitative assessment of vegetation state and productivity: calibration and validation. Photogrammetric Eng. Remote Sens 69, 899–906. [Google Scholar]
- Kogan F, Kussul NN, Adamenko TI, Skakun SV, Kravchenko AN, Krivobok AA, Shelestov AY, Kolotii AV, Kussul OM, Lavrenyuk AN, 2013. Winter wheat yield forecasting: a comparative analysis of results of regression and biophysical models. J. Autom. Inf. Sci 45, 68–81. [Google Scholar]
- Kogan F, Salazar L, Roytman L, 2012. Forecasting crop production using satellite-based vegetation health indices in Kansas, USA. Int. J. Remote Sens 33, 2798–2814. [Google Scholar]
- Kogan F, Yang BJ, Wei G, Pei ZY, Jiao XF, 2005. Modelling corn production in China using AVHRR-based vegetation health indices. Int. J. Remote Sens 26, 2325–2336. [Google Scholar]
- Kogan FN, 1995. Droughts of the Late 1980s in the united-states as derived from Noaa polar-orbiting satellite data. Bull. Am. Meteorol. Soc 76, 655–668. [Google Scholar]
- Kucharik CJ, Ramankutty N, 2005. Trends and variability in U.S. corn yields over the twentieth century. Earth Interact. 9. [Google Scholar]
- Liang LA, Schwartz MD, Fei SL, 2011. Validating satellite phenology through intensive ground observation and landscape scaling in a mixed seasonal forest. Remote Sens. Environ 115, 143–157. [Google Scholar]
- Liu WT, Kogan F, 2002. Monitoring Brazilian soybean production using NOAA/AVHRR based vegetation condition indices. Int. J. Remote Sens 23, 1161–1179. [Google Scholar]
- Loveland TR, Merchant JW, Ohlen DO, Brown JF, 1991. Development of a land-cover characteristicsed database for the conterminous U.S. Photogrammetric Eng. Remote Sens. Lett 57, 1453–1463. [Google Scholar]
- Markon CJ, Peterson KM, 2002. The utility of estimating net primary productivity over Alaska using baseline AVHRR data. Int. J. Remote Sens 23, 4571–4596. [Google Scholar]
- Maselli F, Conese C, Petkov L, Gilabert MA, 1993. Environmental monitoring and crop forecasting in the Sahel through the use of Noaa Ndvi data – a case-study – Niger 1986–89. Int. J. Remote Sens 14, 3471–3487. [Google Scholar]
- Maselli F, Rembold F, 2001. Analysis of GAC NDVI data for cropland identification and yield forecasting in Mediterranean African countries. Photogrammetric Eng. Remote Sens 67, 593–602. [Google Scholar]
- Mirik M, Michels GJ, Kassymzhanova-Mirik S, Elliott NC, 2007. Reflectance characteristics of Russian wheat aphid (Hemiptera: Aphididae) stress and abundance in winter wheat. Comput. Electron. Agric 57, 123–134. [Google Scholar]
- Mkhabela MS, Bullock P, Raj S, Wang S, Yang Y, 2011. Crop yield forecasting on the Canadian Prairies using MODIS NDVI data. Agric. For. Meteorol 151, 385–393. [Google Scholar]
- Mondal P, 2011. Quantifying surface gradients with a 2-band enhanced vegetation index (EVI2). Ecol. Ind 11, 918–924. [Google Scholar]
- Moshou D, Bravo C, West J, Wahlen T, McCartney A, Ramon H, 2004. Automatic detection of ‘yellow rust’ in wheat using reflectance measurements and neural networks. Comput. Electron. Agric 44, 173–188. [Google Scholar]
- Paruelo JM, Epstein HE, Lauenroth WK, Burke IC, 1997. ANPP estimates from NDVI for the central grassland region of the United States. Ecology 78, 953–958. [Google Scholar]
- Pinter PJ Jr., Jackson RD, Idso SB, Reginato RJ, 1981. Multi date spectral reflectance as predictors of yield in water stressed wheat and barley. Int. J. Remote Sens 2, 43–48. [Google Scholar]
- Ran YH, Li X, Lu L, 2010. Evaluation of four remote sensing based land cover products over China. Int. J. Remote Sens 31, 391–401. [Google Scholar]
- Rasmussen MS, 1992. Assessment of millet yields and production in Northern Burkina-Faso using integrated Ndvi from the Avhrr. Int. J. Remote Sens 13, 3431–3442. [Google Scholar]
- Ratkowsky DA, 1983. Nonlinear Regression Modeling – A Unified Practical Approach. Marcel Dekker, New York and Basel. [Google Scholar]
- Rembold F, Atzberger C, Savin I, Rojas O, 2013. Using low resolution satellite imagery for yield prediction and yield anomaly detection. Remote Sens. 5, 1704–1733. [Google Scholar]
- Richards FJ, 1959. A flexible growth function for empirical use. J. Exp. Bot 10, 290–300. [Google Scholar]
- Rocha AV, Shaver GR, 2009. Advantages of a two band EVI calculated from solar and photosynthetically active radiation fluxes. Agric. For. Meteorol 149, 1560–1563. [Google Scholar]
- Rosegrant MW, Cline SA, 2003. Global food security: challenges and policies.Science 302, 1917–1919. [DOI] [PubMed] [Google Scholar]
- Running SW, Thornton PE, Nemani RR, Glassy JM, 2000. Global terrestrial gross and net primary productivity from the earth observing system In: Sala O, Jackson R, Mooney H (Eds.), Methods in Ecosystem Science. Springer-Verlag, New York, pp. 44–57. [Google Scholar]
- Salazar L, Kogan F, Roytman L, 2007. Use of remote sensing data for estimation of winter wheat yield in the United States. Int. J. Remote Sens 28, 3795–3811. [Google Scholar]
- Schut AGT, Stephens DJ, Stovold RGH, Adams M, Craig RL, 2009. Improved wheat yield and production forecasting with a moisture stress index, AVHRR and MODIS data. Crop Pasture Sci. 60, 60–70. [Google Scholar]
- Shuai YM, Schaaf C, Zhang XY, Strahler A, Roy D, Morisette J, Wang ZS, Nightingale J, Nickeson J, Richardson AD, Xie DH, Wang JD, Li XW, Strabala K, Davies JE, 2013. Daily MODIS 500 m reflectance anisotropy direct broadcast (DB) products for monitoring vegetation phenology dynamics. Int. J. Remote Sens 34, 5997–6016. [Google Scholar]
- Singh RP, Roy S, Kogan F, 2003. Vegetation and temperature condition indices from NOAA AVHRR data for drought monitoring over India. Int. J. Remote Sens 24, 4393–4402. [Google Scholar]
- Steven MD, 1993. Satellite remote-sensing for agricultural management – opportunities and logistic constraints. Isprs J. Photogrammetry nd Remote Sens 48, 29–34. [Google Scholar]
- Sudbrink DL, Harris FA, Robbins JT, English PJ, Willers JL, 2003. Evaluation of remote sensing to identify variability in cotton plant growth and correlation with larval densities of beet armyworm and cabbage looper (Lepidoptera: Noctuidae). Florida Entomol. 86, 290–294. [Google Scholar]
- Tsend-Ayush J, Miura T, Didan K, Barreto-munoz A, 2012. Compatibility analysis of Spot-4 vegetation and terra modis vegetation index products for long-term data records In: Proceedings of IEEE International Geoscience and Remote Sensing Symposium. Munich, Germany. [Google Scholar]
- Tucker CJ, Pinzon JE, Brown ME, Slayback DA, Pak EW, Mahoney R, Vermote EF, El Saleous N, 2005. An extended AVHRR 8-km NDVI dataset compatible with MODIS and SPOT vegetation NDVI data. Int. J. Remote Sens 26, 4485–4498. [Google Scholar]
- Tucker CJVC, Boerwinkel E, Gaston A, 1983. Satellite remote sensing of total dry matter production in the Senegalese Sahel. Remote Sens. Environ 13, 461–474. [Google Scholar]
- United Nations, 2003. World Population Prospects: The 2002 Revision. In: Division UP (Ed.), <http://www.un.org/esa/population/publications/wpp2002/WPP2002-HIGHLIGHTSrev1.PDF>.
- Vargas M, Miura T, Shabanov N, Kato A, 2013. An initial assessment of Suomi NPP VIIRS vegetation index EDR. J. Geophys. Res. – Atmos 118, 12301–12316. [Google Scholar]
- Vermote E, Kotchenova SY, 2011. MODIS directional surface reflectance product: method, error estimates and validation In: Ramachandran B, Justice CO, Abrams MJ (Eds.), Land Remote Sensing and Global Environmental Change: NASA’s Earth Observing System and the Science of ASTER and MODIS. Springer, New York, pp. 533–548. [Google Scholar]
- Vermote EF, Saleous NZ, 2006. Calibration of NOAA16 AVHRR over a desert site using MODIS data. Remote Sens. Environ 105, 214–220. [Google Scholar]
- Vintrou E, Desbrosse A, Begue A, Traore S, Baron C, Lo Seen D, 2012. Crop area mapping in West Africa using landscape stratification of MODIS time series and comparison with existing global land products. Int. J. Appl. Earth Obs. Geoinf 14, 83–93. [Google Scholar]
- Wagle P, Xiao XM, Suyker AE, 2015. Estimation and analysis of gross primary production of soybean under various management practices and drought conditions. Isprs J. f Photogrammetry Remote Sens 99, 70–83. [Google Scholar]
- Wardlow BD, Egbert SL, 2008. Large-area crop mapping using time-series MODIS 250 m NDVI data: an assessment for the US Central Great Plains. Remote Sens. Environ 112, 1096–1116. [Google Scholar]
- Williams R, Borges LF, Lacoste M, Andersen R, Nesbitt H, Johansen C, 2012. On-farm evaluation of introduced maize varieties and their yield determining factors in East Timor. Field Crops Res. 137, 170–177. [Google Scholar]
- Wu W, Shibasaki R, Yang P, Ongaro L, Zhou Q, Tang H, 2008. Validation and comparison of 1 km global land cover products in China. Int. J. Remote Sens 29, 3769–3785. [Google Scholar]
- Wu X, Yan JJ, 2011. Estimating the outgoing long wave radiation from the FY-3B satellite visible infrared radiometer Channel 5 radiance observations. Chin. Sci. Bull 56, 3480–3485. [Google Scholar]
- Xiao WW, Sun ZG, Wang QX, Yang YH, 2013. Evaluating MODIS phenology product for rotating croplands through ground observations. J. Appl. Remote Sens 7. [Google Scholar]
- Xiao XM, Zhang QY, Saleska S, Hutyra L, De Camargo P, Wofsy S, Frolking S, Boles S, Keller M, Moore B, 2005. Satellite-based modeling of gross primary production in a seasonally moist tropical evergreen forest. Remote Sens. Environ 94, 105–122. [Google Scholar]
- Zhang JH, Feng LL, Yao FM, 2014. Improved maize cultivated area estimation over a large scale combining MODIS-EVI time series data and crop phenological information. Isprs J. Photogrammetry Remote Sens 94, 102–113. [Google Scholar]
- Zhang X, Tan B, Yu Y, 2014. Interannual variations and trends in global land surface phenology derived from enhanced vegetation index during 1982–2010. Int. J. Biometeorol 58, 547–564. [DOI] [PubMed] [Google Scholar]
- Zhang XY, 2015. Reconstruction of a complete global time series of daily vegetation index trajectory from long-term AVHRR data. Remote Sens. Environ 156, 457–472. [Google Scholar]
- Zhang XY, Friedl MA, Schaaf CB, 2006. Global vegetation phenology from Moderate resolution imaging spectroradiometer (MODIS): evaluation of global patterns and comparison with in situ measurements. J. Geophys. Res. – Biogeosci 111. [Google Scholar]
- Zhang XY, Friedl MA, Schaaf CB, Strahler AH, 2004. Climate controls on vegetation phenological patterns in northern mid- and high latitudes inferred from MODIS data. Glob. Change Biol 10, 1133–1145. [Google Scholar]
- Zhang XY, Friedl MA, Schaaf CB, Strahler AH, Hodges JCF, Gao F, Reed BC, Huete A, 2003. Monitoring vegetation phenology using MODIS. Remote Sens. Environ 84, 471–475. [Google Scholar]


