Abstract
Purpose
To evaluate the diagnostic accuracy of the four standardized categories for CT reporting proposed by the Radiological Society of North America (RSNA) to support a faster triage compared with real-time reverse-transcription polymerase chain reaction (RT-PCR), which is the reference standard for suspected coronavirus disease 2019 (COVID-19), but has long reporting time (6–48 hours).
Materials and Methods
A retrospective analysis of 569 thin-section CT examinations performed for patients suspected of having COVID-19 from February 27 to March 27, 2020 (peak of infection in Italy) was conducted. The imaging pattern was classified according to the statement by the RSNA as “typical,” “indeterminate,” “atypical,” and “negative” and compared with RT-PCR for 460 patients. Interobserver variability in reporting between a senior and a junior radiologist was evaluated. Use of the vascular enlargement sign in indeterminate cases was also assessed.
Results
The diagnosis of COVID-19 was made in 45.9% (211/460) of patients. The “typical” pattern (n = 172) showed a sensitivity of 71.6%, a specificity of 91.6%, and a positive predictive value of 87.8% for COVID-19. The “atypical” (n = 67) and “negative” (n = 123) pattern demonstrated a positive predictive value of 89.6% and 86.2% for non–COVID-19, respectively. The “indeterminate” (n = 98) pattern was nonspecific, but vascular enlargement was most frequently found in patients with COVID-19 (86.1%; P < .001). Interobserver agreement was good for the “typical” and “negative” pattern and fair for “indeterminate” and “atypical” (κ = 0.5; P = .002).
Conclusion
In an epidemic setting, the application of the four categories proposed by the RSNA provides a standardized diagnostic hypothesis, strongly linked to the RT-PCR results for the “typical,” “atypical,” and “negative” pattern. In the “indeterminate” pattern, the analysis of the vascular enlargement sign could facilitate the interpretation of imaging features.
© RSNA, 2020
Summary
For suspected COVID-19, real-time reverse-transcription polymerase chain reaction is the reference standard but has a long reporting time; application of the four standardized categories for CT reporting proposed by the RSNA could support a faster triage of patients in a setting of high community disease burden.
Key Points
■ In this retrospective analysis, categorization of the radiologic pattern for COVID-19 into the four CT categories proposed by the RSNA is strongly predictive of reverse-transcription polymerase chain reaction results.
■ In an epidemic setting, the “typical” pattern showed a high positive predictive value for COVID-19 (87.8%), while the “atypical” and “negative” pattern showed a high positive predictive value for non–COVID-19 infection (89.6% and 86.2%, respectively).
■ The “indeterminate” pattern was mainly observed in older adults and is the most challenging category; in this category, the detection of subsegmental vascular enlargement was most frequently observed in COVID-19 and could be considered as an ancillary sign to guide the diagnostic hypothesis.
Introduction
In January 2020, a novel coronavirus named severe acute respiratory syndrome coronavirus 2 was identified as responsible for several cases of pneumonia referred to as coronavirus disease 2019 (COVID-19) in Wuhan. Italy was the first Western country where the epidemic spread; the first case was detected on February 20, 2020, followed by a rapid increase in the number of cases, especially in Northern Italy, reaching 236 989 cases by June 15 (1). In this setting, early detection and containment became crucial.
The standard of reference for diagnosis is real-time reverse-transcription polymerase chain reaction (RT-PCR). However, this test has shown several limitations: (a) limited testing capacity owing to insufficient kits or laboratory supplies; (b) long reporting time (from 6 to 48 hours) that is hardly compatible with urgent decision making; (c) great variability in sensitivity, ranging from 37% to 71% (2–4). In clinical practice, one negative RT-PCR test does not exclude COVID-19, and multiple repeat tests may be required to make the final diagnosis. Thus, imaging has emerged as an important tool to guide diagnosis in case of clinical-laboratory discordance (2).
Imaging protocols greatly vary depending on local public health directives: chest radiography is widely used, although it’s not accurate in mild or early COVID-19 infection (5); there is an interest in bedside lung US, but limited experiences are reported (6,7); among imaging modalities, CT is the most sensitive (sensitivity of 60%–98%) but is also affected by low specificity and possible false-negatives in the first stage of the disease (8). For these reasons, most radiologic societies do not recommend performing screening CT (9,10). Nevertheless, the number of CT examinations performed for suspected COVID-19 has increased. Indeed, CT better demonstrates early pulmonary manifestation of COVID-19 infection, with reported findings consistent with COVID-19, even in false-negative RT-PCR tests and in asymptomatic patients (11,12). Moreover, it could highlight some ancillary findings frequently associated with COVID-19 infection, such as the recently reported “vascular enlargement” (13).
To provide guidance to radiologists, a standardized language was proposed by the Radiological Society of North America (RSNA) to reduce variability in reporting (8), but data on its application in clinical practice are lacking. The aim of this study was to evaluate the diagnostic accuracy of each category proposed (“typical,” “indeterminate,” “atypical,” and “negative”) versus RT-PCR and to assess the interobserver variability between a senior and a junior radiologist. The use of a vascular enlargement sign in indeterminate cases was also assessed.
Materials and Methods
Patient Population and Study Design
This study is an observational, retrospective single-center study and was approved by our local institution review board. Informed consent was waived by the institutional review board owing to the retrospective nature of the study.
We consecutively selected all patients, both those who were hospitalized or those who accessed the emergency department, who underwent CT for pneumonia related to suspected COVID-19 infection, from February 27 to March 27, 2020, which was during the peak period of the infection in Italy.
In case of suspected COVID-19, the imaging workflow in our hospital consists of the execution of chest radiography, followed by a CT scan if radiography provides negative or uncertain findings. Lung US could be performed depending on the skill of the operator, but it is not routinely recommended.
Inclusion criteria were (a) symptomatic patients presenting fever (of unknown origin) or respiratory symptoms such as cough or dyspnea and (b) patients undergoing CT at our institute.
The exclusion criteria were (a) patients with suspected COVID-19–related interstitial pneumonia but investigated with only other imaging techniques (radiography or US); (b) patients suspected of having COVID-19 –related interstitial pneumonia with CT performed outside our hospital; and (c) severe motion artifact at chest CT (n = 46).
Overall, a total of 569 CT scans were collected.
Clinical Data
RT-PCR results were considered as the standard of reference and were extracted from the patients’ electronic medical records in our hospital information system. As some patients had more than one test, only RT-PCR tests performed within 24 hours from the CT scan were considered.
RT-PCR was a two-site test, performed using oropharyngeal and nasopharyngeal swabs; patients with RT-PCR results not available or not carried out were excluded from the analysis (n = 109) (Fig 1).
Figure 1:

Flowchart of the study.
CT Acquisition Technique
Chest CT acquisitions were obtained with the patients in supine position during end-inspiration without intravenous contrast medium injection. An expiration scan was not performed.
CT scans were performed using two CT scanners dedicated only to patients suspected of having COVID-19. The first scanner was a 64-slice CT scanner (LightSpeed VCT; GE Medical System), with the following technical parameters: tube voltage, 120 kV; tube current modulation, 100–250 mAs; spiral pitch factor, 0.98; collimation width, 64 × 0.625. Reconstructions were made with the convolution kernel BONEPLUS at a slice thickness of 1.25 mm (n = 391). The second scanner was a 128-slice CT scanner (Ingenuity; Philips), with the following technical parameters: tube voltage, 120 kV; tube current modulation, 100–250 mAs; spiral pitch factor, 1.224; collimation width, 64 × 0.625. Reconstructions were obtained with the convolution kernel Y-SHARP at a slice thickness of 1 mm (n = 178).
After each patient chest CT examination, passive air exchange and a decontamination of the CT room was performed with surface disinfection using 62% to 71% ethanol or 01% sodium hypochlorite.
CT Image Analysis
All CT examinations were reviewed by accessing the picture archiving and communication system of our hospital by two radiologists involved in the study, blind to each other and to the RT-PCR results, with different levels of experience: a senior reader (F.C.), with more than 10 years of experience in thoracic imaging, and a junior reader (D.S.), with 1 year experience in thoracic imaging.
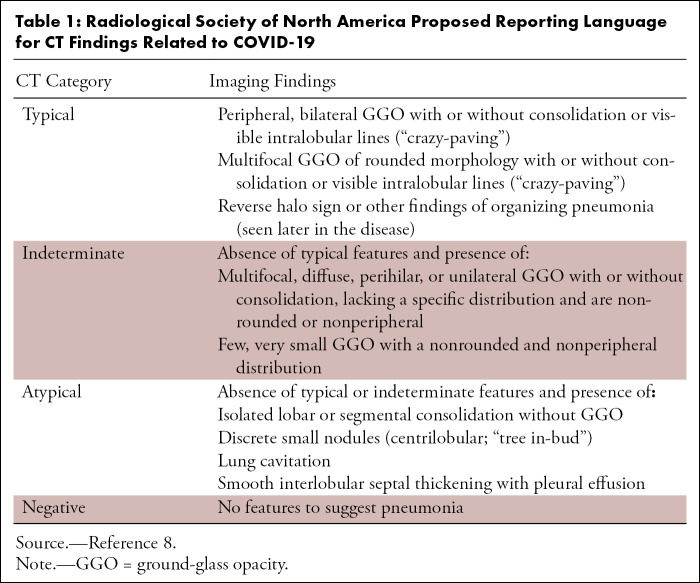
Radiologic findings were classified according to the four categories proposed by the RSNA (Table 1) (8). Interobserver variability in assessing the radiologic pattern was evaluated. All data were anonymized and collected in a shared database.
Table 1:
Radiological Society of North America Proposed Reporting Language for CT Findings Related to COVID-19
Statistical Analysis
Data were expressed as means, ranges, and frequencies. The diagnostic performance of CT was evaluated with sensitivity, specificity, positive predictive value (PPV), and negative predictive value considering RT-PCR as the standard of reference. We considered the “typical” and “indeterminate” pattern to predict COVID-19 disease and “atypical” and “negative” pattern to predict non–COVID-19 disease.
Cohen kappa was used to evaluate interrater reliability; the analysis of variance was performed to assess age differences between the groups, and Fisher exact test was used when appropriate (comparison between CT categories among COVID-19 and non–COVID-19; the presence of vascular enlargement; and differences in age and sex).
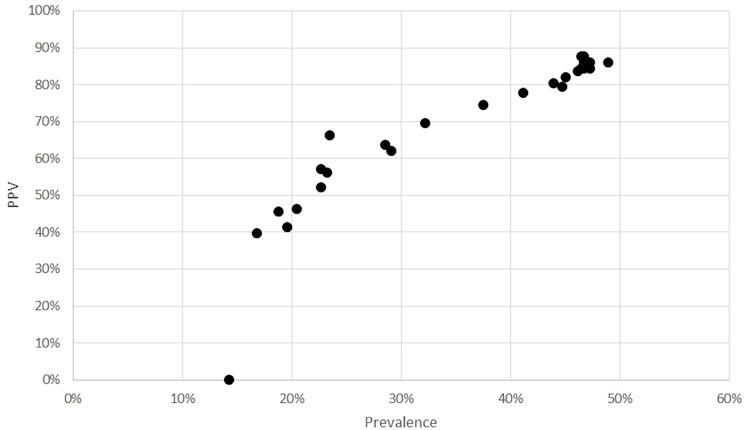
A scatterplot was used to assess the relation between PPV and prevalence for the “typical” pattern. Two-tailed P values < .05 were considered statistically significant. Statistical analysis was performed using SPSS version 13.0 (Chicago, Ill).
Results
The demographics of patients and CT results are summarized in Table 2.
Table 2:
Summary of Demographics and CT Results
Patients with COVID-19
Diagnosis of COVID-19 infection was made in 45.9% (211/460) of patients, with a mean age of 63 years (range, 21–94 years). Men were more frequently affected: 144 cases (68.2%) compared with 67 (31.8%) cases in women.
The analysis of distribution of pattern documented that “typical” (n = 151) showed a sensitivity of 71.6%, a specificity of 91.6%, and a PPV of 87.8% for COVID-19 (Fig 2).
Figure 2:
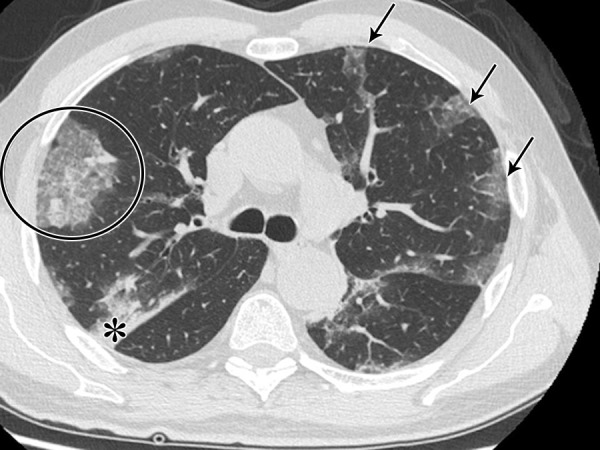
The “typical” pattern in a 62-year-old man with COVID-19, characterized by bilateral ground-glass opacities peripheral in distribution (arrows), consolidations (*), and crazy paving (circle).
The “indeterminate” pattern (n = 36) was particularly nonspecific, with low sensitivity (17.1%) and PPV (36.7%). This pattern was most frequently detected in older adults (mean age of 68 years vs 63 years of patients with other patterns; P = .016). In this group of patients, we conducted a further analysis by evaluating subsegmental vascular enlargement (defined as more than 3 mm in diameter). This sign was found in 86.1% (31/36) of patients with COVID-19 versus 37.1% (23/62) of patients without COVID-19, involving both arteries and veins, with a difference that was statistically significant (P < .001) (Figs 3, 4).
Figure 3a:

A 74-year-old man arriving at the emergency department with fever. (a) The CT scan documented a focal ground-glass opacity in the superior segment of the lingula (circle), classified as an “indeterminate” pattern. Notably, there was a vascular enlargement in the pulmonary artery branch afferent to the lesion, as (b) the maximum intensity projection better demonstrated (arrow). The real-time reverse-transcription polymerase chain reaction test was positive for severe acute respiratory syndrome coronavirus 2 infection.
Figure 4a:
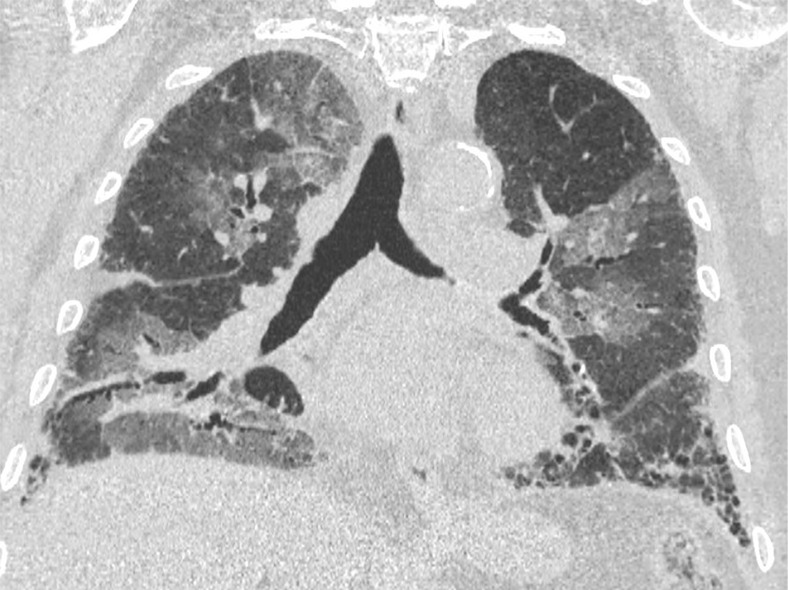
An 89-year-old man with a known interstitial lung disease, arriving at the emergency department with dyspnea. (a) The CT scan documented a diffuse ground-glass opacity, without a specific distribution, an “indeterminate” pattern. The real-time reverse-transcription polymerase chain reaction test was positive for severe acute respiratory syndrome coronavirus 2. In addition, in this case, (b) dilatation of pulmonary vessels was seen (arrow).
Figure 3b:
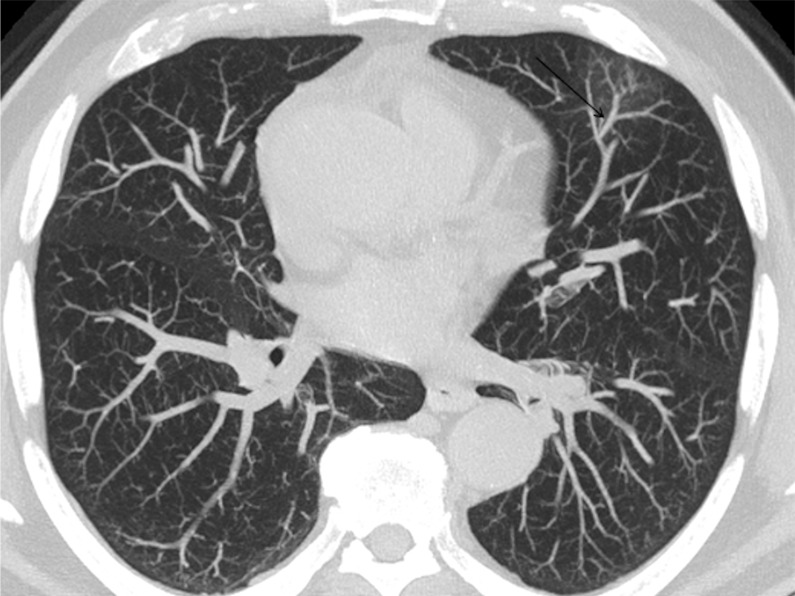
A 74-year-old man arriving at the emergency department with fever. (a) The CT scan documented a focal ground-glass opacity in the superior segment of the lingula (circle), classified as an “indeterminate” pattern. Notably, there was a vascular enlargement in the pulmonary artery branch afferent to the lesion, as (b) the maximum intensity projection better demonstrated (arrow). The real-time reverse-transcription polymerase chain reaction test was positive for severe acute respiratory syndrome coronavirus 2 infection.
Figure 4b:

An 89-year-old man with a known interstitial lung disease, arriving at the emergency department with dyspnea. (a) The CT scan documented a diffuse ground-glass opacity, without a specific distribution, an “indeterminate” pattern. The real-time reverse-transcription polymerase chain reaction test was positive for severe acute respiratory syndrome coronavirus 2. In addition, in this case, (b) dilatation of pulmonary vessels was seen (arrow).
The “atypical” (n = 7) and “negative” (n = 17) pattern counted only for 11.4% of total patients with COVID-19.
Patients without COVID-19
There were 249 of 460 (54.1%) patients with no COVID-19 infection. In these patients, the most prevalent patterns were “atypical” (n = 60) and “negative” (n = 106), representing the 66.7% of patterns observed and demonstrating a really strong PPV for non–COVID-19 infection, 89.6% and 86.2%, respectively (Figs 5, 6). None of the “atypical” pattern was related to a viral infection.
Figure 5a:
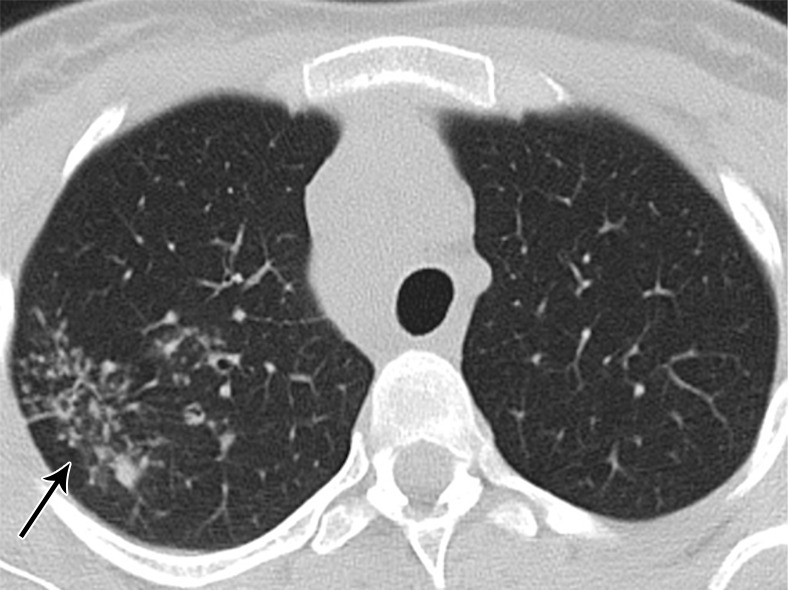
A 26-year-old woman arriving at the emergency department with persistent cough. (a) The CT scan demonstrated an “atypical” pattern characterized by small peribronchial consolidations with a tree-in-bud appearance located in the apical segment of the superior right lobe (arrow) and (b) multiple right hilar and mediastinal lymphadenopathy (circle). The final diagnosis was of lung and nodal tuberculosis.
Figure 6a:
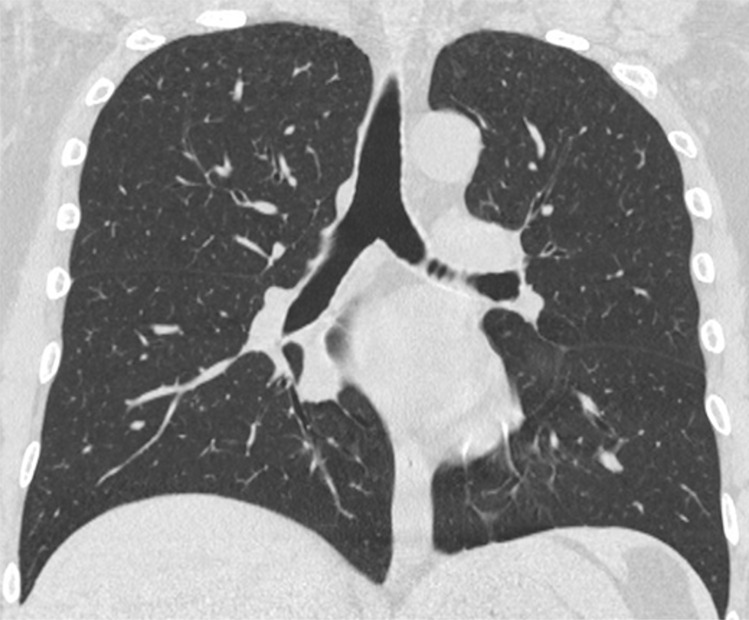
A 47-year-old man arriving at the emergency department with fever and diarrhea. (a) The baseline CT scan did not show findings suggestive for a pneumonia-“negative” pattern, but the real-time polymerase chain reaction test was positive for severe acute respiratory syndrome coronavirus 2 infection. (b) After 5 days, owing to a worsening of the clinical conditions, CT was repeated, revealing a “typical” pattern characterized by bilateral ground-glass opacities (circle). (c) After 12 days (17 days from the onset of symptoms), further radiologic progression with development of diffuse alveolar damage and acute respiratory distress syndrome would lead to the death of the patient.
Figure 5b:

A 26-year-old woman arriving at the emergency department with persistent cough. (a) The CT scan demonstrated an “atypical” pattern characterized by small peribronchial consolidations with a tree-in-bud appearance located in the apical segment of the superior right lobe (arrow) and (b) multiple right hilar and mediastinal lymphadenopathy (circle). The final diagnosis was of lung and nodal tuberculosis.
Figure 6b:
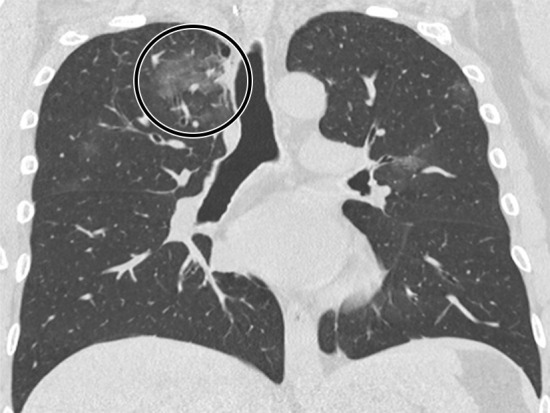
A 47-year-old man arriving at the emergency department with fever and diarrhea. (a) The baseline CT scan did not show findings suggestive for a pneumonia-“negative” pattern, but the real-time polymerase chain reaction test was positive for severe acute respiratory syndrome coronavirus 2 infection. (b) After 5 days, owing to a worsening of the clinical conditions, CT was repeated, revealing a “typical” pattern characterized by bilateral ground-glass opacities (circle). (c) After 12 days (17 days from the onset of symptoms), further radiologic progression with development of diffuse alveolar damage and acute respiratory distress syndrome would lead to the death of the patient.
Figure 6c:
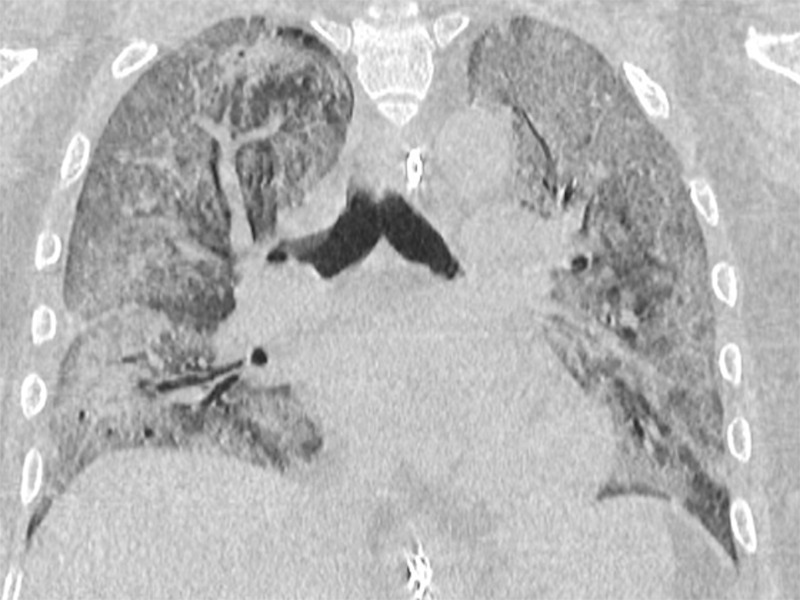
A 47-year-old man arriving at the emergency department with fever and diarrhea. (a) The baseline CT scan did not show findings suggestive for a pneumonia-“negative” pattern, but the real-time polymerase chain reaction test was positive for severe acute respiratory syndrome coronavirus 2 infection. (b) After 5 days, owing to a worsening of the clinical conditions, CT was repeated, revealing a “typical” pattern characterized by bilateral ground-glass opacities (circle). (c) After 12 days (17 days from the onset of symptoms), further radiologic progression with development of diffuse alveolar damage and acute respiratory distress syndrome would lead to the death of the patient.
The “typical” pattern was observed in 21 cases which represented the false-positives of our population. In these patients, the final diagnosis was other viral pneumonia in 81.0% (17/21), bacterial pneumonia in 9.5% (2/21), and drug toxicity in 9.5% (2/21).
Regarding the distribution of patterns, “typical” was most frequently detected in COVID-19, while “atypical” and “negative” were detected in non–COVID-19 infection, with a difference that was statistically significant (P < .001). There was no statistically significant difference among COVID-19 and non–COVID-19 groups only for the “indeterminate” pattern, although it was most often observed in the non–COVID-19 group (P = .052).
The comparison between senior and junior radiologist documented a very high agreement for the “typical” and “negative” pattern (84.7% and 93.1%, respectively), while a fair agreement for “indeterminate” (13.1%) and “atypical” (30.9%) was observed. Overall, we observed a moderate agreement: κ = 0.500 (P = .002).
For a better interpretation of the PPV for the “typical” pattern in relation with the prevalence of COVID-19 in our population, we also performed an analysis of the PPV over time, and we found that on March 3, 2020, there was a prevalence of 16.7% and a PPV of 40.0%; an increasing prevalence was found among time up to the peak on March 27, 2020, with 46.4% and a PPV of 87.8% (Fig 7).
Figure 7:
Positive predictive value for a “typical” pattern in relation with prevalence.
Discussion
The exact role of CT in the diagnosis of COVID-19 remains debatable. Sensitivity of CT is influenced by temporal changes of radiologic appearance: CT can be negative in the first stage of the disease; early CT features consist of ground-glass opacities, with predominantly bilateral and peripheral distribution, followed by a progressive transformation into multifocal consolidations, crazy paving, bandlike pattern, perilobular opacities, and reversed halo sign (14–17); the interpretation of imaging findings is further complicated as some patients could develop diffuse alveolar damage, while others could show persistent reticulations and bronchial distortions in the late stage of the disease (18,19). Moreover, specificity of CT was reported to be low (3,20); Bai et al proposed some criteria to differentiate COVID-19 from other viral pneumonia (21), although this distinction could be difficult in clinical practice. Indeed, CT features of COVID-19 are similar to those reported for other coronavirus, H1N1, and other rhinovirus A (22–24), but COVID-19 could also be associated with other infections or pathologies (25).
However, in our series, the “typical” pattern showed a specificity of 91.6%. This is probably due to the specific setting of high community disease burden. In this setting, application of the categories proposed by the RSNA demonstrated a really strong link to RT-PCR results: the “typical” pattern had a high PPV (87.8%) for COVID-19, while “atypical” and “negative” demonstrated high PPV for non–COVID-19 infection (89.6% and 86.2%, respectively). Recognition of the “atypical” pattern is particularly important because it could provide a differential diagnosis.
However, a small percentage of false-negatives and false-positives was detected: specifically, 11.4% of patients with COVID-19 had a “negative” or an “atypical” pattern. Thus, these patterns could not exclude COVID-19. On the other hand, 8.4% of patients with negative RT-PCR showed a “typical” pattern at CT.
In addition, recognition of the pattern should be provided by expert radiologists, as the interobserver agreement analysis demonstrated, while a “typical” pattern is easy to identify, interpretation of an “indeterminate” and “atypical” pattern requires greater skills.
The application of a radiologic algorithm to triage the massive load of acute respiratory referral has been recently proposed (26). This proposal is in agreement with the position of Fleischner Society that identified a specific clinical scenario where imaging is advised to support a more rapid triage that concerns patients with moderate-to-severe features of COVID-19 in a resource-constrained environment (2). In addition, Dangis et al demonstrated that CT could play a complementary role to RT-PCR for the early triage of patients, as CT results were rapidly available, with an accuracy that reached 94.4% (25).
The main diagnostic challenge remains to be the “indeterminate” pattern. The indeterminate pattern consisted of ground-glass opacities without typical distribution (multifocal, diffuse, perihilar, or unilateral), nonrounded and nonperipheral. Patients belonging to this category were older than the general population, and this could be associated with a more complex clinical-radiologic scenario. A further analysis demonstrated that subsegmental vascular enlargement was observed in most of these patients with COVID-19 (86.1%), as also observed by other authors (13,27–29). To our knowledge, the exact meaning of this sign is still unclear but could be related to the mechanism of action of the virus; severe acute respiratory syndrome coronavirus 2 infects the host using the angiotensin converting enzyme 2 receptor, which is expressed in several organs including the lung and endothelial cells (30). Ye et al hypothesized that vascular enlargement could be attributed to the damage of the endothelial wall caused by proinflammatory factors (27), while Albarello et al found that this sign could precede the development of new lung infiltrates (29). Pathologic postmortem studies demonstrated both capillary congestion and platelet-fibrin thrombi in small arterial vessels, suggesting pulmonary thrombotic microangiopathy (31). However, further pathologic studies are needed to clarify the exact pathogenesis of this sign.
The development of faster laboratory tests could limit the role of CT in the diagnostic assessment of COVID-19. However, the baseline CT scan has other applications; Colombi et al demonstrated that the extent of CT lung abnormalities at admission was the predictor of intensive care unit recovery (32). Moreover, CT could be involved in several research scenarios through the application of structured reporting and radiomics (33,34).
The various roles of CT justify the increase in the number of requests, even to rule out COVID-19 infection.
Our study had several limitations: (a) it was a retrospective analysis influenced by the high prevalence of COVID-19 in our population and (b) RT-PCR was considered as the standard of reference, although several limitations of this test have been reported (2–4).
In conclusion, our experience demonstrated that the application of the diagnostic categories proposed by the RSNA could provide a correct diagnosis in most patients, in a setting of epidemic spread, with high pretest probability of COVID-19.
RT-PCR remains to be the hallmark for diagnosis and could not be replaced by CT; however, we strongly recommend the application of a standardized report to all patients suspected of having COVID-19 as a first useful method to support a more rapid triage.
Acknowledgments
Acknowledgments
The authors thank Massimo Sammons, MD, for the technical assistance in the supervision of the manuscript.
Disclosures of Conflicts of Interest: F. Ciccarese disclosed no relevant relationships. F. Coppola disclosed no relevant relationships. D.S. disclosed no relevant relationships. G.L.G. disclosed no relevant relationships. V.L. disclosed no relevant relationships. A.P. disclosed no relevant relationships. C.D.B. disclosed no relevant relationships. C.B. disclosed no relevant relationships. R.G. disclosed no relevant relationships.
Abbreviations:
- COVID-19
- coronavirus disease 2019
- PPV
- positive predictive value
- RSNA
- Radiological Society of North America
- RT-PCR
- reverse-transcription polymerase chain reaction
References
- 1.WHO Coronavirus disease (COVID-2019) situation reports-147 . World Health Organization website. https://www.who.int/emergencies/diseases/novel-coronavirus-2019/situation-reports. Published June 15, 2020.
- 2.Rubin GD, Ryerson CJ, Haramati LB, et al. The Role of Chest Imaging in Patient Management During the COVID-19 Pandemic: A Multinational Consensus Statement From the Fleischner Society. Chest 2020;158(1):106–116. [DOI] [PMC free article] [PubMed] [Google Scholar]
- 3.Ai T, Yang Z, Hou H, et al. Correlation of Chest CT and RT-PCR Testing in Coronavirus Disease 2019 (COVID-19) in China: A Report of 1014 Cases. Radiology 2020;296(2):E32–E40. [DOI] [PMC free article] [PubMed] [Google Scholar]
- 4.Li Y, Yao L, Li J, et al. Stability issues of RT-PCR testing of SARS-CoV-2 for hospitalized patients clinically diagnosed with COVID-19. J Med Virol 2020;92(7):903–908. [DOI] [PMC free article] [PubMed] [Google Scholar]
- 5.Wong HYF, Lam HYS, Fong AH, et al. Frequency and Distribution of Chest Radiographic Findings in COVID-19 Positive Patients. Radiology 2020;296(2):E72–E78. [DOI] [PMC free article] [PubMed] [Google Scholar]
- 6.Soldati G, Smargiassi A, Inchingolo R, et al. Is There a Role for Lung Ultrasound During the COVID-19 Pandemic? J Ultrasound Med 2020;39(7):1459–1462. [DOI] [PMC free article] [PubMed] [Google Scholar]
- 7.Soldati G, Smargiassi A, Inchingolo R, et al. Proposal for International Standardization of the Use of Lung Ultrasound for Patients With COVID-19: A Simple, Quantitative, Reproducible Method. J Ultrasound Med 2020;39(7):1413–1419. [DOI] [PMC free article] [PubMed] [Google Scholar]
- 8.Simpson S, Kay FU, Abbara S, et al. Radiological Society of North America Expert Consensus Statement on Reporting Chest CT Findings Related to COVID-19. Endorsed by the Society of Thoracic Radiology, the American College of Radiology, and RSNA - Secondary Publication. J Thorac Imaging 2020;35(4):219–227. [DOI] [PMC free article] [PubMed] [Google Scholar]
- 9.ACR Recommendations for the use of Chest Radiography and Computed Tomography (CT) for Suspected COVID-19 Infection . American College of Radiology website. https://www.acr.org/Advocacy-and-Economics/ACR-Position-Statements/Recommendations-for-Chest-Radiography-and-CT-for-Suspected-COVID19-Infection. Published March 11, 2020. Updated 2020. Accessed March 22, 2020.
- 10.Revel MP, Parkar AP, Prosch H, et al. COVID-19 patients and the radiology department - advice from the European Society of Radiology (ESR) and the European Society of Thoracic Imaging (ESTI). Eur Radiol 2020. 10.1007/s00330-020-06865-y. Published online April 20, 2020. [DOI] [PMC free article] [PubMed] [Google Scholar]
- 11.Fang Y, Zhang H, Xie J, et al. Sensitivity of Chest CT for COVID-19: Comparison to RT-PCR. Radiology 2020;296(2):E115–E117. [DOI] [PMC free article] [PubMed] [Google Scholar]
- 12.Inui S, Fujikawa A, Jitsu M, Kunishima N, Watanabe S, Suzuki Y, Umeda S, Uwabe Y. Chest CT Findings in Cases from the Cruise Ship “Diamond Princess” with Coronavirus Disease 2019 (COVID-19). Radiol Cardiothorac Imaging 2020;2(2):e200110. [DOI] [PMC free article] [PubMed] [Google Scholar]
- 13.Caruso D, Zerunian M, Polici M, et al. Chest CT Features of COVID-19 in Rome, Italy. Radiology 2020;296(2):E79–E85. [DOI] [PMC free article] [PubMed] [Google Scholar]
- 14.Salehi S, Abedi A, Balakrishnan S, Gholamrezanezhad A. Coronavirus Disease 2019 (COVID-19): A Systematic Review of Imaging Findings in 919 Patients. AJR Am J Roentgenol 2020;215(1):87–93. [DOI] [PubMed] [Google Scholar]
- 15.Song F, Shi N, Shan F, et al. Emerging 2019 Novel Coronavirus (2019-nCoV) Pneumonia. Radiology 2020;295(1):210–217. [DOI] [PMC free article] [PubMed] [Google Scholar]
- 16.Bernheim A, Mei X, Huang M, et al. Chest CT Findings in Coronavirus Disease-19 (COVID-19): Relationship to Duration of Infection. Radiology 2020;295(3):200463. [DOI] [PMC free article] [PubMed] [Google Scholar]
- 17.Pan F, Ye T, Sun P, et al. Time Course of Lung Changes at Chest CT during Recovery from Coronavirus Disease 2019 (COVID-19). Radiology 2020;295(3):715–721. [DOI] [PMC free article] [PubMed] [Google Scholar]
- 18.Hu Q, Guan H, Sun Z, et al. Early CT features and temporal lung changes in COVID-19 pneumonia in Wuhan, China. Eur J Radiol 2020;128:109017. [DOI] [PMC free article] [PubMed] [Google Scholar]
- 19.Zhou S, Wang Y, Zhu T, Xia L. CT Features of Coronavirus Disease 2019 (COVID-19) Pneumonia in 62 Patients in Wuhan, China. AJR Am J Roentgenol 2020;214(6):1287–1294. [DOI] [PubMed] [Google Scholar]
- 20.Wen Z, Chi Y, Zhang L, et al. Coronavirus Disease 2019: Initial Detection on Chest CT in a Retrospective Multicenter Study of 103 Chinese Subjects. Radiol Cardiothorac Imaging 2020;2(2):e200092. [DOI] [PMC free article] [PubMed] [Google Scholar]
- 21.Bai HX, Wang R, Xiong Z, et al. AI Augmentation of Radiologist Performance in Distinguishing COVID-19 from Pneumonia of Other Etiology on Chest CT. Radiology 2020. 10.1148/radiol.2020201491. Published online April 27, 2020. [DOI] [PMC free article] [PubMed] [Google Scholar]
- 22.Koo HJ, Lim S, Choe J, Choi SH, Sung H, Do KH. Radiographic and CT Features of Viral Pneumonia. RadioGraphics 2018;38(3):719–739. [DOI] [PubMed] [Google Scholar]
- 23.Ajlan AM, Ahyad RA, Jamjoom LG, Alharthy A, Madani TA. Middle East respiratory syndrome coronavirus (MERS-CoV) infection: chest CT findings. AJR Am J Roentgenol 2014;203(4):782–787. [DOI] [PubMed] [Google Scholar]
- 24.Li P, Su DJ, Zhang JF, Xia XD, Sui H, Zhao DH. Pneumonia in novel swine-origin influenza A (H1N1) virus infection: high-resolution CT findings. Eur J Radiol 2011;80(2):e146–e152. [DOI] [PMC free article] [PubMed] [Google Scholar]
- 25.Dangis A, Gieraerts C, De Bruecker Y, et al. Accuracy and reproducibility of low-dose submillisievert chest CT for the diagnosis of COVID-19. Radiol Cardiothorac Imaging 2020;2(2):e200196. [DOI] [PMC free article] [PubMed] [Google Scholar]
- 26.Sverzellati N, Milanese G, Milone F, Balbi M, Ledda RE, Silva M. Integrated Radiologic Algorithm for COVID-19 Pandemic. J Thorac Imaging 2020;35(4):228–233. [DOI] [PMC free article] [PubMed] [Google Scholar]
- 27.Ye Z, Zhang Y, Wang Y, Huang Z, Song B. Chest CT manifestations of new coronavirus disease 2019 (COVID-19): a pictorial review. Eur Radiol 2020;30(8):4381–4389. [DOI] [PMC free article] [PubMed] [Google Scholar]
- 28.Xie X, Zhong Z, Zhao W, Zheng C, Wang F, Liu J. Chest CT for Typical 2019-nCoV Pneumonia: Relationship to Negative RT-PCR Testing. Radiology 2020;296(2):E41–E45. [DOI] [PMC free article] [PubMed] [Google Scholar]
- 29.Albarello F, Pianura E, Di Stefano F, et al. 2019-novel Coronavirus severe adult respiratory distress syndrome in two cases in Italy: An uncommon radiological presentation. Int J Infect Dis 2020;93:192–197. [DOI] [PMC free article] [PubMed] [Google Scholar]
- 30.Varga Z, Flammer AJ, Steiger P, et al. Endothelial cell infection and endotheliitis in COVID-19. Lancet 2020;395(10234):1417–1418. [DOI] [PMC free article] [PubMed] [Google Scholar]
- 31.Carsana L, Sonzogni A, Nasr A, et al. Pulmonary post-mortem findings in a series of COVID-19 cases from northern Italy: a two-centre descriptive study. Lancet Infect Dis 2020. 10.1016/S1473-3099(20)30434-5. Published online June 8, 2020. [DOI] [PMC free article] [PubMed] [Google Scholar]
- 32.Colombi D, Bodini FC, Petrini M, et al. Well-aerated Lung on Admitting Chest CT to Predict Adverse Outcome in COVID-19 Pneumonia. Radiology 2020;296(2):E86–E96. [DOI] [PMC free article] [PubMed] [Google Scholar]
- 33.Prokop M, van Everdingen W, van Rees Vellinga T, et al. CO-RADS: A Categorical CT Assessment Scheme for Patients Suspected of Having COVID-19-Definition and Evaluation. Radiology 2020;296(2):E97–E104. [DOI] [PMC free article] [PubMed] [Google Scholar]
- 34.Neri E, Miele V, Coppola F, Grassi R. Use of CT and artificial intelligence in suspected or COVID-19 positive patients: statement of the Italian Society of Medical and Interventional Radiology. Radiol Med (Torino) 2020;125(5):505–508. [DOI] [PMC free article] [PubMed] [Google Scholar]


