

Abstract
Fluorizoline (FLZ) binds to prohibitin-1 and -2 (PHB1/2), which are pleiotropic scaffold proteins known to affect signaling pathways involved in several intracellular processes. However, it is not yet clear how FLZ exerts its effect. Here, we show that exposure of three different human cancer cell lines to FLZ increases the phosphorylation of key translation factors, particularly of initiation factor 2 (eIF2) and elongation factor 2 (eEF2), modifications that inhibit their activities. FLZ also impaired signaling through mTOR complex 1, which also regulates the translational machinery, e.g. through the eIF4E-binding protein 4E-BP1. In line with these findings, FLZ potently inhibited protein synthesis. We noted that the first phase of this inhibition involves very rapid eEF2 phosphorylation, which is catalyzed by a dedicated Ca2+-dependent protein kinase, eEF2 kinase (eEF2K). We also demonstrate that FLZ induces a swift and marked rise in intracellular Ca2+ levels, likely explaining the effects on eEF2. Disruption of normal Ca2+ homeostasis can also induce endoplasmic reticulum stress, and our results suggest that induction of this stress response contributes to the increased phosphorylation of eIF2, likely because of activation of the eIF2-modifying kinase PKR-like endoplasmic reticulum kinase (PERK). We show that FLZ induces cancer cell death and that this effect involves contributions from the phosphorylation of both eEF2 and eIF2. Our findings provide important new insights into the biological effects of FLZ and thus the roles of PHBs, specifically in regulating Ca2+ levels, cellular protein synthesis, and cell survival.
Keywords: prohibitin, elongation, eEF2, initiation, eIF2, calcium, protein synthesis, cell death, cancer, translation elongation factor, eukaryotic translation initiation, eukaryotic initiation factor 2 (eIF2), endoplasmic reticulum stress (ER stress)
Dysregulation of protein synthesis (mRNA translation) plays an important roles in many diseases, in particular, cancers (1). The rate of protein synthesis can be modulated by changes in the phosphorylation of proteins involved in the initiation and elongation stages of the process of mRNA translation; these are termed eukaryotic initiation or elongation factors (eIFs, eEFs), respectively. For example, phosphorylation of the heterotrimer eIF2 on its α-subunit (eIF2α) leads to inhibition of translation initiation and thus general protein synthesis (2). Several kinases can perform this modification and are generally activated by stress conditions such as the accumulation of unfolded proteins in the endoplasmic reticulum or absence of a given amino acid. eEF2 also undergoes phosphorylation, which inhibits its activity and thus slows down translation elongation (3, 4). This event is catalyzed by a single kinase, eEF2 kinase (eEF2K), which is activated under certain stress conditions. Its activity is normally dependent on calcium ions that activate it through calmodulin, which binds to and stimulates eEF2K, thereby inhibiting translation elongation (5, 6).
Several signaling pathways can regulate the phosphorylation of translation factors, including the mechanistic (or mammalian) target of rapamycin complex 1 (mTORC1) and ERK (classical MAP kinase) pathways (7, 8). Among other effects, ERK activates the MAP kinase-interacting kinases (MNKs) which phosphorylate eIF4E (9). mTORC1 phosphorylates the eIF4E-binding proteins (4E-BPs) which, in their hypophosphorylated state, bind to and inhibit eIF4E (10). Phosphorylation of 4E-BP1 by mTORC1 induces its release from eIF4E, thereby alleviating its inhibitory effect. mTORC1 signaling negatively regulates the activity of eEF2K (11), in part through the ribosomal protein kinases (S6Ks), which phosphorylate and inactivate eEF2K (12).
Prohibitins-1 and -2 (PHB1/2) are pleiotropic scaffold proteins that act as a major hub for many signaling pathways involved in metabolism, survival, differentiation, proliferation, and mitochondrial dynamics (13–19). PHBs may be valid therapeutic targets in a number of diseases. PHBs are expressed in many types of cancers and play diverse roles in tumor cell biology (for a recent review, see Ref. 20). For example, they affect cell proliferation, tumor metastasis, and cell survival (20, 21). PHBs regulate the activation of RAF1 (C-RAF) by Ras, and consequently the oncogenic MEK/ERK/MNK/eIF4E pathway, which has multiple downstream effectors including components of the protein synthesis machinery. However, whether PHBs regulate mRNA translation by additional mechanisms remains unexplored.
Several classes of PHB ligands displaying diverse profiles of pharmacological activities, such as FL3, Mel6, Mel41, JI130, and fluorizoline (FLZ), have been reported. Because the genetic deletion of PHB is lethal, these ligands are invaluable to examine the cellular function of PHBs. FL3 binds to PHBs to block the activation of C-RAF (Raf-1) and KRAS (22, 23). In addition to PHBs, FL3 also directly interacts with the helicase eIF4A to inhibit eIF4F-dependent translation and displays potent anticancer effects (24, 25).
Mel6 and Mel41, respectively, inhibit and induce melanogenesis through the regulation of the mitophagic factor LC3-II and the kinase ERK (26). FLZ is a cytotoxic PHB ligand that induces mitochondrial fragmentation and apoptosis in cancer cells (27–31). FLZ kills chronic lymphocytic leukemia cells in vitro, but is unfortunately inactive in a murine model of leukemia (31). It also inhibits the PHB-dependent activation of C-RAF (23) and promotes melanogenesis similarly to Mel41 (26). JI130 binds to PHB2 to inhibit the transcription factor Hes1 (32). PHBs may be useful targets for cancer therapy (33); however, there remains a paucity of information about the effects of FLZ and of its targets, the PHBs.
Here we built upon earlier data indicating that PHBs (in particular PHB2) interact with certain components of the translational (protein synthesis) machinery, including ribosomal proteins, or kinases that act upon them (RRID:SCR_018711), and with some signaling proteins involved in the regulation of translation such as ERK (MAP kinase), the AMP-activated protein kinase (AMPK) or mTORC1. We now show that FLZ induces the phosphorylation of two key components of the protein synthetic machinery, initiation factor eIF2 and elongation factor eEF2. The phosphorylation of each of these general translation factors inhibits its function. Consistent with this, FLZ induces the inhibition of overall protein synthesis. FLZ also elicits a marked increase in intracellular calcium ion levels, which activate eEF2 kinase and evoke endoplasmic reticulum (ER) stress, which causes enhanced phosphorylation of eIF2. FLZ also inhibits of mTORC1 signaling and thus affects S6K and eIF4E-BP1, all of which effects likely contribute to the inhibition of overall protein synthesis caused by FLZ. FLZ also induces cell death, and this appears to involve the phosphorylation of both eEF2 and eIF2. Our data substantially extend understanding of the physiological roles of PHBs.
Results
FLZ increases the phosphorylation of eIF2 and eEF2
We began by testing a range of PHB-binding compounds for their effects, in A549 lung carcinoma cells, on translation factors or signaling pathways linked to them. As shown in Fig. 1A, FLZ caused a very marked increase in the phosphorylation of eEF2 rapidly by 15 min, whereas the other compounds had little or no effect, even after 60-min exposure. By 15 min, FLZ also elicited a rise in the phosphorylation of the AMPK, a metabolic sensor which can activate eEF2K (34, 35). The effect on phosphorylated (P)-eEF2 occurred at concentrations lower than 20 μM, but the increased phosphorylation of AMPK did not (Fig. S1A), suggesting the change in eEF2 phosphorylation was not because of activation of AMPK. Further experiments to test the role of eEF2K are described below.
Figure 1.

FLZ evokes eEF2 and eIF2α phosphorylation. A, A549 cells were treated with indicated concentrations of different PHB ligands for 15 or 60 min. Lysate proteins were analyzed by SDS-PAGE/Western blotting using indicated antibodies. B–D, A549 (B), MDA-MB-231 (C), and HeLa (D) cells were treated with 20 μm FLZ for the indicated periods of times. Protein lysates were subjected to SDS-PAGE and Western blot analysis using the indicated antibodies. * = eEF2 band.
At 60 min, FLZ did not exert a noticeable effect on other proteins tested, apart from causing a small shift in the electrophoretic behavior of 4E-BP1 toward faster-migrating species, which correspond to less phosphorylated variants of this protein (cf. decrease in signal for P–Ser-65 in 4E-BP1 (Fig. 1A). This suggests that FLZ causes mild impairment of mTORC1 signaling, which was confirmed by a large decrease in the phosphorylation of p70 S6 kinase, a direct substrate for mTORC1 (Fig. 1A and Fig. S1B). However, little if any change was seen for S6, a substrate for p70 S6K (Fig. 1A and Fig. S1B). A slight increase in the phosphorylation of ERK was consistently observed (Fig. 1A), which likely accounts for the small rise in the phosphorylation of the translation initiation factor eIF4E, which is linked to ERK signaling via the eIF4E kinases, the MNKs (9, 36).
When treatment with FLZ was extended to 120 min, it was clear that the increased phosphorylation of eEF2 was sustained (Fig. 1B and Fig. S2, A–C) and that FLZ also induced, albeit more slowly, the phosphorylation of eIF2α (Fig. 1B). Activation of AMPK (as judged from P-ACC (acetyl-CoA carboxylase) levels) declined by the final time point (Fig. 1B). The FLZ-induced rise in the phosphorylation of eEF2 was very fast, being evident as early as 1 min (Fig. S2A).
Given these striking effects of FLZ on phosphorylation of regulators of mRNA translation in A549 cells, we considered it important to assess its effects in other cancer cell lines. In MDA-MB-231 breast cancer cells FLZ also increased the phosphorylation of eEF2 and eIF2 (Fig. 1C and Fig. S2, D and E), but had little or no effect on P-ERK or P-eIF4E. Other compounds tested had little, if any, effect on the proteins studied in MDA-MB-231 cells, apart from some activation of ERK by FL3 (and FLZ) (Fig. S3A). The FLZ-induced phosphorylation of eEF2 was transient, being maximum at 30-60 min (Fig. 1C and Fig. S2, D and E); eIF2α phosphorylation again rose markedly but more slowly; it was still elevated at 120 min (Fig. 1, B–D). FLZ had little effect on the AKT/mTORC1 pathway in MDA-MB-231 cells, apart from a minor inhibitory effect on P-AKT (Ser-473), a substrate for mTORC2 (Fig. S3B). FL3 but not the other PHB ligands inhibited the phosphorylation of S6K1 (Fig. S3, A and B), a readout of mTORC1 activity in MDA-MB-231 cells, concomitant with a reduction in the phosphorylated levels of eEF2 (Fig. S3, A and B).
A broadly similar pattern of changes in the phosphorylation of eEF2 and eIF2 was also observed in a third cell line, cervical cancer HeLa cells (Fig. 1D and Fig. S2, F and G). These data show that FLZ rapidly enhances the phosphorylation of eIF2 and eEF2 in all three cell lines, with the effect on P-eEF2 being considerably faster (already higher at 5 min in all three lines) than the rise in P-eIF2 (evident by 30 min).
FLZ inhibits protein synthesis
Because FLZ increases the phosphorylation of eIF2α and eEF2 and these modifications impair the functions in the elongation and initiation phases of mRNA translation (2, 37), we asked whether FLZ affected the rate of protein synthesis. To do this, we employed the widely used SunSET assay (38), whereby cells are incubated with puromycin, which becomes incorporated into newly made proteins. Proteins are then resolved by SDS-PAGE and analyzed by immunoblotting using an anti-puromycin antibody. The signal observed reports newly made proteins. The assay was configured such that puromycin was added after a 15- or 45-min pretreatment of the cells with FLZ to allow us to assess effects of protein synthesis over two different time windows, 15–30 or 45–60 min. FLZ modestly reduced puromycin incorporation over the 15- to 30-min interval in A549, MDA-MB-231 or HeLa cells (Fig. 2, A–C) and more markedly decreased it over the 45- to 60-min time period. Indeed, when corrected for nonspecific labeling by comparing with the signal seen in the presence of an inhibitor of translation, cycloheximide (CHX), net puromycin incorporation was very low over the 45- to 60-min time period in FLZ-treated A549 or HeLa cells (Fig. 2, A–C).
Figure 2.

FLZ inhibits protein synthesis in cancer cell lines. A–C, A549 (A), MDA-MB-231 (B), or HeLa cells (C) were treated with vehicle (DMSO) control (C), 20 μm FLZ, or 10 μm CHX for 15 min or 45 min. Cells were labeled with puromycin (SunSET assay) to assess the rate of protein synthesis (analyzed by immunoblotting). Puromycin was then added for a further 15 min. The time windows indicated the periods during which puromycin was present, i.e. 15–30 min and 45–60 min. D, eEF2K+/+ and eEF2K−/− MDA-MB-231 cells were treated with 20 μm FLZ; puromycin was present for the indicated time windows, after which cells were lysed and samples subjected to immunoblot analysis. E, eEF2K−/− MDA-MB-231 cells were treated with 20 μm FLZ for the indicated periods of time before being subjected to SunSET assays. F, quantification of E. For A–C and F, results are shown as mean ± S.D., n = 3. *, 0.01 ≤ P < 0.05; **, 0.001 ≤ P < 0.01; ***, P < 0.001.
Thus, FLZ inhibits protein synthesis and does so more strongly at time points later than the initial increase in eEF2 phosphorylation. The timing of this inhibition correlates with the increased phosphorylation of eIF2, which is well-known to cause a general inhibition of translation (2). This suggested that the inhibition of protein synthesis caused by FLZ was not only, or not primarily, because of the rise in P-eEF2.
To assess whether the inhibition of protein synthesis caused by FLZ did indeed involve the phosphorylation of eEF2, we made use of MDA-MB-231 cells in which the gene for eEF2K had been knocked out (39); in such cells, as expected, no phosphorylation of eEF2 was observed (Fig. 2D). When compared with WT MDA-MB-231 cells, it was evident that the rapid phase of FLZ-induced inhibition was essentially lost, whereas the inhibition seen at later times was hardly affected (Fig. 2, E and F; compare quantification with that in Fig. 2B). Taken together, these data are consistent with the conclusion that the rapid phase of the inhibition of protein synthesis by FLZ involves the phosphorylation of eEF2, and the longer-term inhibition (at 45-60 min) involves additional effects, which likely include the increased phosphorylation of eIF2α and/or accumulation of 4E-BPs (see below).
Lastly, we noted that the early phase of the inhibition of protein synthesis caused by FLZ was stronger in HeLa cells than in A549 cells (Fig. 2, A and C). Interestingly, direct comparison on the same immunoblots showed that FLZ induced higher levels of P-eEF2 in HeLa than in A549 cells, which is consistent with eEF2 phosphorylation being largely responsible for the rapid inhibition of translation by FLZ in HeLa cells but playing a lesser role in A549 cells (Fig. S4).
FLZ can also inhibit 4E-BP1 phosphorylation over longer (i.e. 60 min) periods of time (Fig. 1 and Fig. S1), dephosphorylated 4E-BP1 associates with eIF4E and hence interferes with cap-dependent translation. It was therefore important to determine whether FLZ affected 4E-BP1–eIF4E binding. There was an increase in the signal for total 4E-BP1 in response to FLZ in A549 cells, which probably reflects an accumulation of dephosphorylated 4E-BP1 (cf. decreased phosphorylation of 4E-BP1 at Thr-37/46) (Fig. 3A). Dephosphorylated 4E-BP1 is stabilized by its association with eIF4E (40) and the collapse of multiple differentially phosphorylated bands into one major hypophosphorylated species. As shown by m7GTP affinity chromatography, although FLZ did not alter the association of 4E-BP1 with eIF4E at 15 min, it did increase 4E-BP1-eIF4E binding after 60 min (Fig. 3, B–D). However, FLZ did not alter levels of 4E-BP1 phosphorylation or total 4E-BP1 in MDA-MB-231 cells (Fig. S3, C and D). These data imply that inhibition of 4E-BP1 phosphorylation, and increased binding of this protein to eIF4E are likely to contribute to the inhibitory effect of FLZ, at least in A549 cells, on the late (60 min) but not the rapid (15 min) phase of protein synthesis, the latter being controlled mainly by the induction of P-eEF2 (Fig. 3E).
Figure 3.

FLZ increased the affinity of 4E-BP1 to m7GTP. A, A549 cells were treated with vehicle (DMSO) or 20 μm FLZ for 15 or 60 min. 4E-BP1 and eIF4E were then isolated by affinity chromatography on immobilized m7GTP, followed by analysis using SDS-PAGE/Western blot analysis. C = control. B, 4E-BP1/eIF4E ratio in m7GTP beads eluate. C, P-4E-BP1/actin ratio (input). D, 4E-BP1/actin ratio (input). E, P-eEF2/actin ratio (input) from A are quantified. Results are shown as mean ± S.D., n = 3. *, 0.01 ≤ P < 0.05; **, 0.001 ≤ P < 0.01; ***, P < 0.001.
FLZ evokes eEF2K activation and induces ISR
As noted above, FLZ stimulated signaling through AMPK (Fig. S1A), an enzyme which activates eEF2K (34, 35), albeit more slowly than the rise in P-eEF2. Nonetheless, we tested its role in regulating eEF2 in this setting using a recently reported inhibitor of AMPK, A-8715, which is also termed SBI-0206965 (41). As expected, this compound clearly blunted the effect of FLZ on P-ACC, indicating it did indeed block AMPK function (Fig. S5A). However, it had no effect on the levels of P-eEF2 (Fig. S5A). It also had no consistent effect on P-eIF2α levels, suggesting that AMPK does not mediate the effects of FLZ on eEF2 or eIF2.
FLZ may increase the cellular levels of reactive oxygen species (ROS) (29). To assess whether this was involved in its effects on P-eEF2 levels, we pretreated cells with a ROS scavenger, N-acetylcysteine (NAC). NAC did not consistently attenuate the increase in P-eEF2 caused by FLZ, indicating that ROS do not mediate this response (Fig. S5B). The ER-resident eIF2α kinase PERK is activated by ER stress, which can be evoked by disturbances in ER Ca2+ ion levels (2). This suggests that FLZ might induce such stress thereby activating PERK and phosphorylation of eIF2α.
The experiments had so far only tested the effects of FLZ up to 2 h of treatment; we felt it important to also examine its effects over longer times (up to 24 h). By 8 h, FLZ induced a sustained increase in P-eEF2 and P-eIF2α (Fig. 4, A–C); it also induced altered splicing of the mRNA for the transcription factor XBP1 (Fig. 4D). Note that the levels of eEF2K and P-eEF2 were lower at 16 and 24 h after FLZ treatment than at earlier times; this likely reflects the fact that the activation of eEF2K leads to its degradation (42, 43). It is not immediately clear why P-eEF2 levels rise again (albeit not to maximal levels) by 24 h.
Figure 4.

FLZ evokes eEF2K activation and induces ISR. A, A549 cells were cultured in the absence or presence of 20 μm FLZ for the indicated periods of time. Cells were then lysed and proteins were subjected to SDS-PAGE and Western blot analysis. B and C, data were quantified in B (P-eEF2:eEF2 ratio) and C (P-eIF2α:eIF2α ratio). D, splicing of XBP1 mRNA upon FLZ (20 μm) and Tg (1 μm) treatment in A549 and MDA-MB-231 cells was assessed by RT-PCR. E, MDA-MB-231 cells were cultured in the absence or presence of 20 μm FLZ for the indicated periods of time. Cells were then lysed and proteins were subjected to SDS-PAGE and Western blot analysis. F, quantification of P-eIF2α:eIF2α ratio from E. B, C, and F, results are given as mean ± S.D.; n = 3. *, 0.01 ≤ P < 0.05; **, 0.001 ≤ P < 0.01; ***, P < 0.001.
The effects on P-eIF2α (which is phosphorylated by the ER-stress–activated kinase PERK) and XBP1 (another well-known arm of the ISR) indicate that FLZ induces ER stress (44). The transcription factor ATF4 is a marker of ER stress because its synthesis is greatly enhanced (at the level of mRNA translation) in response to phosphorylation of eIF2 during ER stress (2). In MDA-MB-231 cells, FLZ induced the phosphorylation of eIF2α (Fig. 4, E and F) and markedly increased the levels of ATF4, indicative of ER stress. We were unable to detect elevated ATF4 levels in FLZ-treated A549 cells (data not shown) despite the rise in P-eIF2α.
FLZ increases intracellular levels of Ca2+
Given that FLZ induces activation of eEF2K (a Ca2+/CaM-dependent kinase) (5, 6) and ER stress (which is also linked to changes in intracellular Ca2+ levels) (45), we asked whether FLZ affected cellular Ca2+ levels, by using the cell-permeable Ca2+-sensitive fluorescent dye, Fluo-4 AM. Treating A549 cells with FLZ caused a rapid and sustained increase in Fluo-4 fluorescence above the otherwise steady baseline (Fig. 5, A and B). We then assessed whether this rise in cellular calcium ion levels originated from extracellular or intracellular sources. The bathing medium contained CaCl2 (2 mm). In some cases, to remove extracellular Ca2+ while maintaining Ca2+ availability from intracellular stores, the cells were temporarily perfused with medium without CaCl2. The data show a very similar increase in Fluo-4 fluorescence with or without CaCl2 in the medium and thus indicate that FLZ-mediated calcium rises do not require extracellular Ca2+ but instead stem from intracellular stores of Ca2+ (Fig. 5, C and D). Additional control experiments without cells showed that FLZ did not itself trigger fluorescence from the Fluo-4 dye (Fig. S6).
Figure 5.

FLZ increases intracellular calcium levels. Intracellular calcium changes were assessed in A549 cells. Fluorescence from the Fluo-4 calcium sensor was measured with time-lapse image sequences (1 image every 2 min) under 40× magnification while alternating perfusates with or without 20 μm FLZ. Time-lapse image sequences were recorded across 528 cells from 12 FOV in three independent experiments. ROI were drawn over the cell bodies and then averaged to determine changes in fluorescence intensity over time in different perfusates. A, the mean intracellular calcium sensor fluorescence (n = 168 cells from four FOV) in basal medium containing 2 mm CaCl2 was stable over time in the absence of FLZ. B, the mean intracellular calcium sensor fluorescence (n = 186 cells from four FOVs) in basal medium containing 2 mm CaCl2 was monitored after applying 20 μm FLZ. FLZ was washed out after 30 min. C, As in (B), but using medium lacking CaCl2. A–C, data shown as mean ± S.E. Dotted lines represent the time at which the perfusate reached the bath (left) and the time taken to fill the bath entirely (right). Baseline Fluo-4 fluorescence measurements shown between −10 (before addition of FLZ) and 0 min. D, representative images of Fluo-4 fluorescence at 40× magnification in basal medium with and without 2 mm CaCl2, before and after application of 20 μm FLZ. E, A549 cells were cultured in KRB buffer in the absence or presence of CaCl2 for 30 min, before incubated with vehicle (DMSO) or 20 μm FLZ. After 15 min of FLZ treatment, cells were lysed and proteins were subjected to SDS-PAGE and Western blot analysis. F, quantified results are given as mean ± S.D.; n = 3. ***, P < 0.001.
If the rise in intracellular Ca2+ levels observed here reflected Ca2+ from intracellular, not extracellular, sources and was responsible for the FLZ-induced increase in the phosphorylation of eEF2, then we would expect that FLZ should still increase P-eEF2 levels in cells in medium lacking Ca2+. As shown in Fig. 5E, and graphed from replicate experiments (Fig. 5F), FLZ increased P-eEF2 levels to similar extents in A549 cells in media containing or lacking calcium, in agreement with our expectation. In contrast, the increase in P-ACC elicited by FLZ was greatly blunted in cells kept in Ca2+-free medium (Fig. 5E). This indicates that FLZ's effect on AMPK is not because of elevated intracellular Ca2+-levels, because in that case it would be the same in medium containing or lacking Ca2+. The finding that the effects of FLZ on eEF2K and AMPK differ in this regard concurs with the lack of effect of A8715 on FLZ-induced eEF2 phosphorylation (Fig. S5A).
In A549 cells, FLZ begins to evoke eEF2 phosphorylation by 1 min, although P-eEF2 does not attain maximal levels until 15 min (Fig. S2, A and B). We noted that the Fluo-4 AM fluorescence signal only became clearly evident after about 10 min of FLZ treatment. However, there is a >3-min delay in the perfusion system from adding drug to the medium until it reaches the cells; this likely contributes to this lag period. It should also be noted that the Fluo-4 signal (and thus Ca2+ levels) continue to rise for some time, likely to well above the submicromolar concentrations needed to activate CaM/eEF2K (12). The sustained increase in Ca2+ levels also likely maintains the activity of eEF2K at later times, when other mechanisms that may stimulate eEF2K (e.g. inhibition of mTORC1) arise.
Agents which interfere with Ca2+ uptake into the ER elicit ER stress (by raising cytoplasmic Ca2+ levels), resulting in the activation of PERK and phosphorylation of eIF2α (2). One such agent is thapsigargin, which inhibits the sarco/endoplasmic reticulum Ca2+-ATPase (46), and is widely used to induce ER stress. By blocking Ca2+ uptake into the ER, it also increases cytoplasmic calcium levels which would be expected to promote phosphorylation of eEF2. As shown in Fig. S7A, thapsigargin treatment of A549 cells led to a rapid increase in P-eEF2, similarly to FLZ, which was maximum about 15 min, although in this case the rise was rather less sustained (quantified in Fig. S7B). It also caused, as expected, a rise in P-eIF2α, although this effect was slower, which again resembles the effect of FLZ (data quantified in Fig. S7C). These data are consistent with the idea that at least part of FLZ's effect may be because of effects on ER calcium handling, although further work is needed to assess this, including whether FLZ actually affects the sarco/endoplasmic reticulum Ca2+-ATPase.
To assess the effects of extended exposure to FLZ on cell function, we performed MTT assays, which involves conversion of MTT, a water-soluble yellow dye, to an insoluble purple formazan by mitochondrial reductase and is one of the most widely used cell viability assays (47). FLZ strongly inhibited metabolic activity in A549, MDA-MB-231, and HeLa cells (Fig. S8, A–C), suggesting a reduction in cell number and thus proliferation (although other explanations are possible). Consistent with this, FLZ strongly decreased the numbers of viable cells at 24 h (Fig. S8D). To a lesser extent, it also decreased cell viability as assessed by trypan blue exclusion (Fig. S8E). However, FLZ did not increase caspase 7 activity (Fig. S8F). These data indicate that FLZ impairs cell number and probably viability.
It has previously been reported that exposure to FLZ leads to increased mRNA and protein levels of Bcl-2 in acute myeloid leukemia cells (30); however, we could not detect any changes in Bcl-2 protein levels in A549 cells in response to FLZ (Fig. S9A). To explore whether the phosphorylation of eEF2 and/or eIF2α contributes to the ability of FLZ to induce cell death, we conducted additional experiments using cells in which eEF2K had been knocked down or knocked out (39) sometimes in combination with ISR inhibitor (ISRIB), a compound that inhibits the ISR by alleviating the inhibitory effect of eIF2 phosphorylation on the translational machinery (44). (It should be noted that ISRIB does not work by interfering with the phosphorylation of eIF2α.) IPTG (isopropyl β-d-1-thiogalactopyranoside)-induced knockdown, or genetic KO, of eEF2K eliminated the phosphorylation of eEF2, but had little or no effect on basal or FLZ-stimulated phosphorylation of eIF2α, whereas ISRIB did not affect the phosphorylation of eEF2 or eIF2α in A549 cells, it reduced the levels of P-eIF2α in eEF2K−/− MDA-MB-231 cells (Fig. S9A). As shown by Annexin V–propidium iodide staining and CellTox green cytotoxicity assays, FLZ induced a large increase in early and late apoptosis in both WT and eEF2K knocked down (A549) or knockout (MDA-MB-231) cells (Fig. 6, A–C and Fig. S9, B and C). Neither knockdown nor knockout of eEF2K or ISRIB alone affected FLZ-induced apoptosis in the WT cells. However, ISRIB was able to partially reverse the apoptotic effect of FLZ in eEF2K knockdown (A549) or knockout (MDA-MB-231) cells (Fig. 6, A–C and Fig. S9, B and C). Importantly, these data imply that the induction both of eEF2 phosphorylation and of the ISR was required for the pro-apoptotic effect of FLZ; interfering with just either eEF2K or the ISR alone does not rescue cells. Interestingly, we consistently saw that ISRIB increased basal P-eEF2 in both cell lines and that P-eIF2α was decreased in eEF2K−/− MDA-MB-231 cells; this may well explain the cytoprotective effect of ISRIB in the absence of eEF2K in MDA-MB-231 cells. However, ISRIB did not alter levels of P-eIF2α in A549 cells. The mechanisms underlying these effects are unclear and may merit further investigation, beyond the scope of this study.
Figure 6.
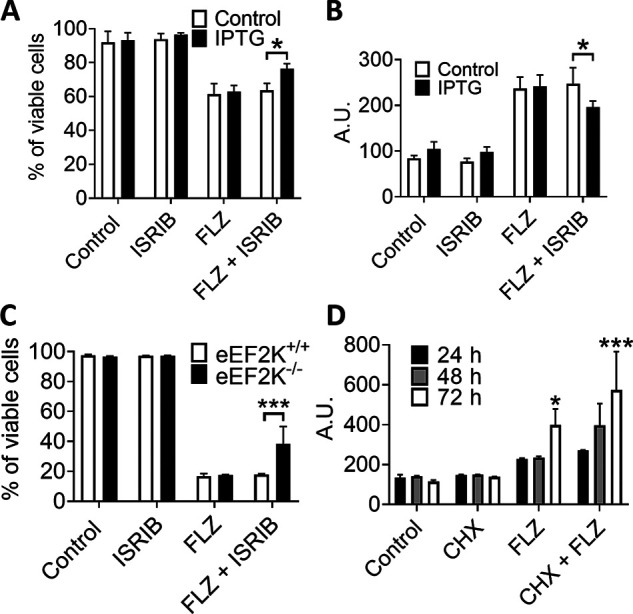
FLZ evokes eEF2K activation and induces ISR to promote cell death. A, A549 cells were pretreated with IPTG (to induce shRNA expression to knock down eEF2K) for 5 days before experiment. Cells were then cultured in the absence or presence of 1 μm ISRIB or/and 20 μm FLZ. 48 h later cells were dispersed, stained with Annexin V (FITC-A) and PI (PI-A), and then analyzed by flow cytometry. B, A549 cells were treated as described for A, and then subjected to cytotoxicity assay using CellTox Green kit. C, eEF2K+/+ and eEF2K−/− MDA-MB-231 cells were cultured in the absence or presence of 1 μm ISRIB or/and 20 μm FLZ. 48 h later cells were dispersed, stained with Annexin V (FITC-A) and PI (PI-A), and then analyzed by flow cytometry. D, A549 cells were treated with vehicle (DMSO, control), 20 μm FLZ, or/and 10 μm CHX for the indicated periods of time before subjected to cytotoxicity assay using CellTox Green kit. Results are given as mean ± S.D.; n = 3. *, 0.01 ≤ P < 0.05; **, 0.001 ≤ P < 0.01; ***, P < 0.001.
These data indicate that the ability of FLZ to induce the death of MDA-MB-231 or A549 cells involves the increased phosphorylation of eEF2 and eIF2α, and, in the latter case, the downstream ISR, which is well-known to be able to cause cell death (48). FLZ may induce cell death by inhibiting protein synthesis. To study this, we cultured A549 cells with CHX, FLZ, or both, over a 72-h period (Fig. 6D). As assessed by CellTox green cytotoxicity assays, CHX alone was unable to cause cell death; however, the cytotoxicity of FLZ was further enhanced upon the addition of CHX (Fig. 6D). These data imply that the inhibitory effect of FLZ on protein synthesis is unlikely to be the sole mechanism by which it induces cell death, although our data do indicate that phosphorylation of eEF2 and eIF2 do contribute to this. Please note that FLZ can induce cell death by additional mechanisms (23, 29).
PHBs do not interact with eEF2, eEF2K, or AMPK
Lastly, because PHBs interact with proteins in the nucleus, cytosol, and mitochondria (18, 19), we wondered whether PHBs could bind to eEF2, eEF2K, or AMPK. To assess this, we transfected A549 or HEK293T cells with vectors encoding FLAG-tagged PHB1 or PHB2 and treated some cells with FLZ. (HEK293 cells were also used here as they can be transfected at particularly high efficiency.) After immunoprecipitation with anti-FLAG, samples were subjected to SDS-PAGE and immunoblotting. The FLAG-tagged PHBs were clearly seen in the immunoprecipitates, but eEF2, eEF2K, and AMPK were not detected, with or without FLZ treatment, for either cell type (Fig. S10).
Discussion
Fluorizoline is a prohibitin-binding ligand that has multiple bioactivities; the PHBs, PHB1 and PHB2, are scaffold proteins that regulate cell functions, e.g. cell proliferation, metabolism, and inflammation by affecting cell signaling pathways (18). For example, FLZ can induce cell apoptosis by up-regulating the protein level of NOXA (28) and Bim in CLL cells (29). It also induces the activation of melanogenesis in melanocytes through the activation of the autophagy factor LC3 (26). In this study we demonstrate that FLZ has profound effects on protein synthesis and the protein synthesis machinery, inducing phosphorylation events in two key translation factors, eIF2 and eEF2, which inhibit their activities (schematized in Fig. 7). Consistent with this, FLZ inhibited protein synthesis in all three cancer cells tested. Further analysis, including the use of cells in which eEF2K has been knocked out, indicated that phosphorylation of eEF2 is involved in the initial phase of FLZ-induced inhibition of protein synthesis whereas the later phase likely involved phosphorylation of eIF2α, a key component of ISR. eEF2 is phosphorylated by a highly specific, Ca2+/CaM-activated protein kinase, eEF2K (49), and eIF2α can be phosphorylated in conditions of low pH, hypoxia, energy, and ER stress. Given that the effect of FLZ on P-eEF2 was particularly striking, probing the potential mechanisms by which it does this offered the potential to gain insight into the effects of FLZ on cell signaling pathways, as well as casting light on its effect on eEF2 phosphorylation. Although eEF2K is controlled by mTORC1 signaling, the apparent changes in this pathway induced by FLZ were much too slow, and probably too small, to account for the increase in P-eEF2.
Figure 7.

Schematic presentation of intracellular signaling pathways evoked by FLZ to promote cell death. The figure recognizes the possibility that the effects of FLZ observed might reflect the interaction of FLZ with targets other than PHBs, although the available data indicate PHBs are the only binding partners for FLZ (27).
Of interest, FLZ but no other tested PHB ligands was able to induce the phosphorylation of eEF2. Affinity chromatographic analysis indicates that FLZ's only binding partners are PHB1 and PHB2 (27), indicating that effects of FLZ are likely to be mediated through its binding to one or both PHBs. We did attempt to test the dependence on PHB1/2 further by knocking down or overexpressing PHB1/2. Repeated attempts to deplete PHBs by siRNA only induced a partial knockdown and did not attenuate the induction of P-eEF2 by FLZ; although PHB overexpression modestly increased basal P-eEF2 levels it did not alter the response to FLZ (data not shown). Some ligands may be selective for PHB1 or PHB2, the various posttranslational modifications are expected to modulate the interactions of PHBs with their ligands, and the ligands may stabilize the PHB in different conformations. Indeed, a recent review (50) extensively discussed why various PHB ligands may induce different pharmacological responses.
We also show that FLZ can modulate the phosphorylation of certain other cellular regulators, including ACC, eIF4E, and 4E-BP1 in A549, MDA-MB-231, and/or HeLa cells. These factors involved in the process of cell metabolism, cell survival, mRNA translation, and cell proliferation. Although AMPK and mTORC1 signaling both modulate the activity of eEF2K (8), our data indicate that neither pathway accounts for the effects of FLZ on the phosphorylation of eEF2. Rather, we show that FLZ induces a marked rise in intracellular Ca2+ levels, which likely activate eEF2K, thereby inducing the very rapid increase in P-eEF2.
Changes in cellular Ca2+ levels also induce ER stress, which leads to activation of the eIF2α kinase PERK; this likely accounts for the rise in eIF2α phosphorylation, a conclusion supported by our observation that FLZ also induces altered splicing of the XBP1 mRNA, which represents another arm of the cellular response to ER stress. eIF2α kinases sense and respond to specific cellular stresses such as ER stress, hypoxia, nutrient deprivation, and oxidative stress (51). It remains to be established how FLZ induces elevated cellular Ca2+ levels; our data imply they come from intracellular rather than extracellular sources. There are several reports of interactions, physical or functional, between PHBs and Ca2+-ion fluxes, e.g. the inositol 1,4,5-triphosphate receptor, type 1 (52), voltage-dependent anion channel 2 (53) or spleen-associated tyrosine kinase (54). Extensive additional work would be required to establish which, if any, of these proteins mediates the effects of FLZ on Ca2+ion levels in the cells used here.
Also our results show that extended exposure to FLZ induces cancer cell death and that this involves both the phos-phorylation of eEF2 (as assessed using eEF2K-KO cells) and the eIF2α-mediated arm of the ISR (demonstrated using ISRIB, and antagonist of the inhibitory effect of phosphorylated eIF2α on protein synthesis). Because that arm of the ISR, and indeed FLZ itself, induces the transcription factor ATF4, which can act to promote death of cancer cells, it is possible that FLZ-induced cell death involves elevated levels of ATF4 (55).
Our data thus provide several key new insights into the actions of FLZ and the mechanisms by which it affects cell function and cell survival. More importantly, it reveals that PHBs regulate Ca2+ levels in addition to the other signaling pathways identified in previous studies. Considering the importance of Ca2+ signaling in physiology and pathophysiology, the detailed mechanisms by which PHBs regulate Ca2+ influx merits further investigation. Further studies are also required into the potential application of drugs that target PHBs as agents to tackle cancers and other diseases.
Experimental procedures
Chemicals and reagents
Compounds FL3, Mel 6, Mel 4, JI130, and FLZ were synthesized following described procedures (26, 27, 32, 56). NAC, ISRIB (57), CHX, thapsigargin, and DMSO were purchased from Merck (Castle Hill, NSW, Australia). A-8715 was purchased from Assay Matrix.
Cell culture and treatment
Human A549 cells, HeLa and HEK293T cells were maintained in Dulbecco's modified Eagle's medium (DMEM) (4.5 g/liter glucose) containing 10% (v/v) fetal bovine serum and 1% penicillin/streptomycin (growth medium). Cells were cultured at 37°C in a humidified atmosphere of 5% (v/v) CO2. A549 cells expressing IPTG-inducible shRNA against eEF2K were kindly provided by Janssen Pharmaceutica (Beerse, Belgium) (58). WT and CRISPR/Cas9-directed eEF2K−/− MDA-MB-231 cells were described in Xie et al. (59). For experiments performed in Krebs-Ringer bicarbonate buffer (KRB), cells were serum starved for 16 h; the media were then removed and the cells were washed twice and incubated with modified KRB (115 mm NaCl, 5 mm KCl, 10 mm NaHCO3, 2.5 mm MgCl2, 20 mm HEPES, pH 7.4, 1× MEM amino acids, 1× MEM nonessential amino acids solution and 1× GlutaMAX) with or without 2.5 mm CaCl2 for 30 min, before being treated with FLZ (20 μm) for 15 min.
SDS-PAGE and Western blot analysis
Cells were treated with FLZ at the indicated times. Cells were lysed in RIPA buffer (50 mm Tris-HCl, pH 7.5, with 1% (v/v) Nonidet P-40, 0.5% (m/v) sodium deoxycholate, 0.05% (m/v) SDS, 1 mm EDTA, pH 8.0, 150 mm NaCl, supplemented with protease and phosphatase inhibitors, 0.5 mm Na3VO4). Cell lysates were centrifuged for 10 min. The supernatants were collected, and protein concentrations were quantified by Bradford assay (60). Equal amounts of protein were loaded and separated by SDS-PAGE. After transfer to a nitrocellulose membrane, membranes were blocked with 5% (m/v) milk in PBS containing 0.1% (v/v) Tween 20 for 30 min and were then probed for respective primary and secondary antibodies. Blots were scanned using a Li-COR Odyssey imaging system (Millenium Science, Mulgrave, Victoria, Australia). Fluorescently tagged antibodies were from Thermo Fisher. Data were quantified using the Li-COR Image Studio Lite 4.0 software (Li-COR, Lincoln, NE, USA). Primary antibodies used in this study are listed on Table S1. Fluorescently tagged secondary antibodies were from Thermo Fisher Scientific (Thebarton, SA, Australia).
m7GTP pulldown
After treatments, cells were lysed in ice-cold Triton lysis buffer [1% (v/v) Triton X-100, 20 mm Tris-HCl pH 7.5, 150 mm NaCl, 1 mm EDTA, 1 mm EGTA, 2.5 mm Na2H2P2O7, 1 mm beta-glycerophosphate, 1 mm Na3VO4, 1 mm dithiothreitol and protease inhibitor cocktail] and precleared by centrifugation for 10 min at 16,000 × g, before binding to γ-AH-m7GTP agarose (Jena Bioscience, Jena, Germany) for 1 h at 4°C. The beads were then washed thrice with Triton lysis buffer and resuspended in 2× Laemmli sample buffer before SDS-PAGE/Western blot analysis.
Transfection
For the transfection of DNA constructs, A549 cells were transfected using Lipofectamine® 3000 (Thermo Fisher Scientific) according to the manufacturer's instructions. HEK293T cells were transfected using the calcium phosphate method (61) with plasmids encoding FLAG-PHB1 or FLAG-PHB2 (a kind gift from Valerie Bosch, DKFZ, Heidelberg, Germany, as described in Ref. 62). Cells were lysed 48 h after transfection.
Immunoprecipitation
Cells were grown in 10-cm plates until 90% confluent. Cells were then lysed in 200 μl ice-cold lysis buffer (1% (v/v) Triton X-100, 20 mm Tris-HCl, pH 7.5, 150 mm NaCl, 1 mm EDTA, 1 mm EGTA, 2.5 mm Na2H2P2O7, 1 mm β-glycerophosphate, 1 mm Na3VO4, 1 mm DTT, and protease inhibitor mixture). Antibody-bound proteins were immunoprecipitated using DynabeadsTM protein G (Thermo Fisher Scientific). Briefly, 1 μg FLAG antibody was covalently linked to 20 μl magnetic beads in 250 μl PBST (PBS containing 0.05% Tween 20) for 45 min at room temperature, then, after washing the beads twice with PBST and then once with lysis buffer. 100 μl cell lysates (∼250 μg protein) plus 250 μl lysis buffer were then added and the material was mixed for 2 h at 4°C. Immunoprecipitates from cells transfected with an empty vector were used as a negative control. Beads were washed twice with lysis buffer (1 ml per sample, twice for a few seconds); proteins were removed from the beads by the addition of 2× Laemmli sample buffer and boiling; samples were then subjected to SDS-PAGE/Western blot analysis.
XBP-1 splicing analysis
After treatment, total RNA from cells were extracted using TRIzol reagent (Thermo Fisher Scientific). cDNA was produced using the QuantiNova Reverse Transcription Kit (Qiagen, Chadstone, VIC, Australia). For PCR analysis of XBP-1 splicing, the following primers were used: Forward: CCTTGTAGTTGAGAACCAGG; reverse: GGGGCTTGGTATATATGTGG, as described previously in Ref. 63.
Protein synthesis (SunSET) assay
Protein synthesis rates were evaluated by measuring the incorporation of puromycin into newly synthesized proteins. Cells were treated with DMSO (vehicle control), FLZ (20 μm) or CHX (10 μm) for 15 min or 45 min, puromycin (10 μm) was then added for another 15 min. Newly synthesized proteins were assessed by SDS-PAGE and Western blot analyses using the anti-puromycin antibody (38).
Calcium imaging
Calcium dye Fluo-4 AM (Life Technologies, Thebarton, SA, Australia) was dissolved in DMSO and 1% pluronic acid-127 (50 μl, Molecular Probes) to create a 1-mm stock solution. A549 cells were seeded on glass coverslips. The cells were cultured until they reached 90% confluency (3-4 days). A549 cells were incubated with 5 μM Fluo-4 AM solution in basal medium (D-PBS, 1 mm MgCl2, 15 mm HEPES, 2 mm CaCl2) for 20 min at 37°C with 5% (v/v) CO2 and 21% (v/v) O2. Excess dye was removed by washing the A549 cells three times with basal medium, before being transferred into a room temperature recording chamber. The cells were continually perfused with basal medium for an additional 30 min to allow de-esterification. Subsequently the cells were perfused at a rate of 0.32 ml/min with basal media with or without 2 mm CaCl2 and with or without 20 μM FLZ. Fluorescence images were taken every 30 s (0.03 Hz) for up to 2 h with a 40× objective (Olympus BX51) and recorded via a pco.panda 4.2 camera. A minimum of four fields-of-view (FOV) were taken for each independent experiment while switching perfusate. Using Micro-Manager v1.4.2 software, contrast and exposure settings were kept constant between time-lapse image sequences. Baseline fluorescence readings were recorded for at least 10 min before applying FLZ. The calcium activity in each perfusate with or without FLZ was subsequently analyzed. To assess cellular calcium levels, regions of interest (ROI) were drawn around the cell bodies using ImageJ software in each FOV. The fluorescence intensity change of each ROI was adjusted for fluctuations by subtracting the average background intensity. Subsequently, the Fluo-4 fluorescence intensity per ROI was normalized to their corresponding 10-min baseline fluorescence reading (ΔF/F0).
MTT assays
Cells were seeded on a 96-well cell culture plate with or without FLZ at indicated concentrations in 100 μl of complete growth medium. After 24-72 h, 10 μl of 5 mg/ml MTT solution was added to each well. 4 h later, 150 μl DMSO was added to each well and the cells were further incubated for 30 min. Absorbance of the solubilized MTT was then measured by GloMax Discover multimode detection system (Promega, Alexandria, NSW, Australia) at 490 nm.
Cell viability assays
Cells were seeded in 6-well plates and were incubated overnight. 24 h after treatment, cells were stained with 0.4% trypan blue as a vital dye, and the numbers of viable and dead cells were counted using a hemocytometer. Percentage of dead cells (%) was defined as 100× the number of dead cells/(the number of viable cells + the number of dead cells). For the measurement of changes in cell membrane integrity, cells were cultured in 96-well plates for 48 h, cytotoxicity was determined using the CellToxTM Green assay (catalog number G8741; Promega).
Caspase 3/7 activity assays
Caspase 3/7 activity was detected using a Caspase-Glo® 3/7 activity assay kit (Promega). Cells were seeded at a density of 1.5–2 × 10⁴ cells/well on a 96-well plate and were then incubated overnight at 37°C in a humidified atmosphere of 5% (v/v) CO2. FLZ was added at indicated concentrations and incubated for 24 h. 20 μl Caspase 3/7 reagent was then added to each well and incubated for 30 min to 1 h at room temperature. Luminescence was measured using a GloMax Discover multimode detection system (Promega) with an excitation wavelength at 485 nm and an emission wavelength at 530 nm.
Annexin V/propidium iodide (PI) staining
Following removal of culture media, the cells were washed once with PBS and then incubated in 1× trypsin/EDTA (0.5%; v/v) for 1 min at 37°C. Growth medium was added, and the cells were gently dispersed by pipetting and centrifuged at 200 × g for 5 min at room temperature. The medium was removed, and Annexin V/PI staining was performed using the Annexin-V-FLUOS Staining kit (Sigma-Aldrich) according to the manufacturer's instructions. The intensity of fluorescence signals was recorded using a FACSCantoTM II flow cytometer (BD Biosciences), and data were analyzed using FlowJo software version 10.2 (BD Biosciences).
Statistical analysis
Statistical analyses were performed using an unpaired Student's t test with the means of three independent experiments. GraphPad Prism (GraphPad Software, San Diego, CA, USA) software package was used to calculate P-values. Results are means ± S.D. *, 0.01 ≤ p < 0.05; **, 0.001 ≤ p < 0.01; ***, p < 0.001.
Data availability
All data of this publication have been contained within this manuscript or are available from the corresponding author (Chris Proud; SAHMRI, Adelaide, Australia; E-mail: Christopher.Proud@sahmri.com) upon reasonable request.
Supplementary Material
Acknowledgments
We thank Dr. Randall H. Grose from the Australian Cancer Research Foundation (ACRF) Innovative Cancer Imaging Facility at SAHMRI for technical support.
This article contains supporting information.
Author contributions—X. J., J. X., M. Z., and C. G. P. data curation; X. J., J. X., and M. Z. formal analysis; X. J., J. X., M. Z., and C. B. investigation; X. J., X. W., L. D., and C. G. P. writing-original draft; J. X. validation; J. X., X. W., L. D., and C. G. P. writing-review and editing; M. Z., D. W., L. D., C. B., and C. G. P. methodology; X. W., L. D., C. B., and C. G. P. conceptualization; X. W., T. J., L. D., C. B., and C. G. P. supervision; X. W. and C. G. P. project administration; D. W., L. D., C. B., and C. G. P. resources; C. G. P. funding acquisition.
Funding and additional information—This work was supported by South Australian Health and Medical Research Institute (SAHMRI) funding and by a SAHMRI early/mid-career seed funding grant (to J. X.). National Natural Science Foundation of China Grant 81673296 (to L. D.) and National Science and Technology Major Project of China Grant 2018ZX09735-004 (to J. T.).
Conflict of interest—The authors declare that they have no conflicts of interest with the contents of this article.
- FLZ
- fluorizoline
- MTT
- 3-(4,5-dimethylthiazol-2-yl)-2,5-diphenyltetrazolium bromide
- PERK
- PKR-like endoplasmic reticulum kinase
- PHB
- prohibitin
- ERK
- extracellular signal-regulated kinase
- MNK
- MAP kinase-interacting kinases
- BP
- binding protein
- AMPK
- AMP-activated protein kinase
- ER
- endoplasmic reticulum
- P-ACC
- acetyl-CoA carboxylase
- CHX
- cycloheximide
- ISR
- integrated stress response
- ROS
- reactive oxygen species
- NAC
- N-acetylcysteine
- ISRIB
- ISR inhibitor
- IPTG
- isopropyl β-d-1-thiogalactopyranoside
- KRB
- Krebs-Ringer bicarbonate buffer
- FOV
- field of view
- ROI
- regions of interest
- PI
- propidium iodide.
References
- 1. Robichaud N., Sonenberg N., Ruggero D., and Schneider R. J. (2019) Translational control in cancer. Cold Spring Harb. Perspect. Biol. 11, a032896 10.1101/cshperspect.a032896 [DOI] [PMC free article] [PubMed] [Google Scholar]
- 2. Wek R. C. (2018) Role of eIF2α kinases in translational control and adaptation to cellular stress. Cold Spring Harb. Perspect. Biol. 10, a032870 10.1101/cshperspect.a032870 [DOI] [PMC free article] [PubMed] [Google Scholar]
- 3. Kenney J. W., Moore C. E., Wang X., and Proud C. G. (2014) Eukaryotic elongation factor 2 kinase, an unusual enzyme with multiple roles. Adv.Biol.Regul. 55, 15–27 10.1016/j.jbior.2014.04.003 [DOI] [PubMed] [Google Scholar]
- 4. Carlberg U., Nilsson A., and Nygard O. (1990) Functional properties of phosphorylated elongation factor 2. Eur. J. Biochem. 191, 639–645 10.1111/j.1432-1033.1990.tb19169.x [DOI] [PubMed] [Google Scholar]
- 5. Ryazanov A. G. (1987) Ca2+/calmodulin-dependent phosphorylation of elongation factor 2. FEBS Lett. 214, 331–334 10.1016/0014-5793(87)80081-9 [DOI] [PubMed] [Google Scholar]
- 6. Nairn A. C., and Palfrey H. C. (1987) Identification of the major Mr 100,000 substrate for calmodulin-dependent protein kinase III in mammalian cells as elongation factor-2. J. Biol. Chem. 262, 17299–17303 [PubMed] [Google Scholar]
- 7. Proud C. G. (2007) Signalling to translation: How signal transduction pathways control the protein synthetic machinery. Biochem. J. 403, 217–234 10.1042/BJ20070024 [DOI] [PubMed] [Google Scholar]
- 8. Proud C. G. (2019) Phosphorylation and signal transduction pathways in translational control. Cold Spring Harb. Perspect. Biol. 11, a033050 10.1101/cshperspect.a033050 [DOI] [PMC free article] [PubMed] [Google Scholar]
- 9. Waskiewicz A. J., Flynn A., Proud C. G., and Cooper J. A. (1997) Mitogen-activated kinases activate the serine/threonine kinases Mnk1 and Mnk2. EMBO J. 16, 1909–1920 10.1093/emboj/16.8.1909 [DOI] [PMC free article] [PubMed] [Google Scholar]
- 10. Gingras A.-C., Raught B., and Sonenberg N. (2001) Control of translation by the target of rapamycin proteins. Prog. Mol. Subcell. Biol. 27, 143–174 10.1007/978-3-662-09889-9_6 [DOI] [PubMed] [Google Scholar]
- 11. Redpath N. T., Foulstone E. J., and Proud C. G. (1996) Regulation of translation elongation factor-2 by insulin via a rapamycin-sensitive signalling pathway. EMBO J. 15, 2291–2297 10.1002/j.1460-2075.1996.tb00582.x [DOI] [PMC free article] [PubMed] [Google Scholar]
- 12. Wang X., Li W., Williams M., Terada N., Alessi D. R., and Proud C. G. (2001) Regulation of elongation factor 2 kinase by p90RSK1 and p70 S6 kinase. EMBO J. 20, 4370–4379 10.1093/emboj/20.16.4370 [DOI] [PMC free article] [PubMed] [Google Scholar]
- 13. Ande S. R., Xu Y. X. Z., and Mishra S. (2017) Prohibitin: A potential therapeutic target in tyrosine kinase signaling. Signal. Transduct. Target Ther. 2, 17059 10.1038/sigtrans.2017.59 [DOI] [PMC free article] [PubMed] [Google Scholar]
- 14. Chowdhury D., Kumar D., Sarma P., Tangutur A. D., and Bhadra M. P. (2017) PHB in cardiovascular and other diseases: Present knowledge and implications. Curr. Drug Targets 18, 1836–1851 10.2174/1389450117666160824161225 [DOI] [PubMed] [Google Scholar]
- 15. Koushyar S., Jiang W. G., and Dart D. A. (2015) Unveiling the potential of prohibitin in cancer. Cancer Lett. 369, 316–322 10.1016/j.canlet.2015.09.012 [DOI] [PubMed] [Google Scholar]
- 16. Peng Y. T., Chen P., Ouyang R. Y., and Song L. (2015) Multifaceted role of prohibitin in cell survival and apoptosis. Apoptosis 20, 1135–1149 10.1007/s10495-015-1143-z [DOI] [PMC free article] [PubMed] [Google Scholar]
- 17. Theiss A. L., and Sitaraman S. V. (2011) The role and therapeutic potential of prohibitin in disease. Biochim. Biophys. Acta 1813, 1137–1143 10.1016/j.bbamcr.2011.01.033 [DOI] [PMC free article] [PubMed] [Google Scholar]
- 18. Thuaud F., Ribeiro N., Nebigil C. G., and Desaubry L. (2013) Prohibitin ligands in cell death and survival: Mode of action and therapeutic potential. Chem. Biol. 20, 316–331 10.1016/j.chembiol.2013.02.006 [DOI] [PMC free article] [PubMed] [Google Scholar]
- 19. Signorile A., Sgaramella G., Bellomo F., and De Rasmo D. (2019) Prohibitins: A critical role in mitochondrial functions and implication in diseases. Cells 8, 71 10.3390/cells8010071 [DOI] [PMC free article] [PubMed] [Google Scholar]
- 20. Yang J., Li B., and He Q. Y. (2018) Significance of prohibitin domain family in tumorigenesis and its implication in cancer diagnosis and treatment. Cell Death Dis. 9, 580 10.1038/s41419-018-0661-3 [DOI] [PMC free article] [PubMed] [Google Scholar]
- 21. Bentayeb H., Aitamer M., Petit B., Dubanet L., Elderwish S., Desaubry L., de Gramont A., Raymond E., Olivrie A., Abraham J., Jauberteau M. O., and Troutaud D. (2019) Prohibitin (PHB) expression is associated with aggressiveness in DLBCL and flavagline-mediated inhibition of cytoplasmic PHB functions induces anti-tumor effects. J. Exp. Clin. Cancer Res. 38, 450 10.1186/s13046-019-1440-4 [DOI] [PMC free article] [PubMed] [Google Scholar]
- 22. Polier G., Neumann J., Thuaud F., Ribeiro N., Gelhaus C., Schmidt H., Giaisi M., Kohler R., Muller W. W., Proksch P., Leippe M., Janssen O., Desaubry L., Krammer P. H., and Li-Weber M. (2012) The natural anticancer compounds rocaglamides inhibit the Raf-MEK-ERK pathway by targeting prohibitin 1 and 2. Chem. Biol. 19, 1093–1104 10.1016/j.chembiol.2012.07.012 [DOI] [PubMed] [Google Scholar]
- 23. Yurugi H., Marini F., Weber C., David K., Zhao Q., Binder H., Desaubry L., and Rajalingam K. (2017) Targeting prohibitins with chemical ligands inhibits KRAS-mediated lung tumours. Oncogene 36, 4778–4789 10.1038/onc.2017.93 [DOI] [PubMed] [Google Scholar]
- 24. Boussemart L., Malka-Mahieu H., Girault I., Allard D., Hemmingsson O., Tomasic G., Thomas M., Basmadjian C., Ribeiro N., Thuaud F., Mateus C., Routier E., Kamsu-Kom N., Agoussi S., Eggermont A. M., et al. (2014) eIF4F is a nexus of resistance to anti-BRAF and anti-MEK cancer therapies. Nature 513, 105–109 10.1038/nature13572 [DOI] [PubMed] [Google Scholar]
- 25. Basmadjian C., Thuaud F., Ribeiro N., and Désaubry L. (2013) Flavaglines: Potent anticancer drugs that target prohibitins and the helicase eIF4A. Future Med. Chem. 5, 2185–2197 10.4155/fmc.13.177 [DOI] [PubMed] [Google Scholar]
- 26. Djehal A., Krayem M., Najem A., Hammoud H., Cresteil T., Nebigil C. G., Wang D., Yu P., Bentouhami E., Ghanem G. E., and Desaubry L. (2018) Targeting prohibitin with small molecules to promote melanogenesis and apoptosis in melanoma cells. Eur. J. Med. Chem. 155, 880–888 10.1016/j.ejmech.2018.06.052 [DOI] [PubMed] [Google Scholar]
- 27. Perez-Perarnau A., Preciado S., Palmeri C. M., Moncunill-Massaguer C., Iglesias-Serret D., Gonzalez-Girones D. M., Miguel M., Karasawa S., Sakamoto S., Cosialls A. M., Rubio-Patino C., Saura-Esteller J., Ramon R., Caja L., Fabregat I., et al. (2014) A trifluorinated thiazoline scaffold leading to pro-apoptotic agents targeting prohibitins. Angew Chem. Int. Ed. Engl. 53, 10150–10154 10.1002/anie.201405758 [DOI] [PubMed] [Google Scholar]
- 28. Cosialls A. M., Pomares H., Iglesias-Serret D., Saura-Esteller J., Nunez-Vazquez S., Gonzalez-Girones D. M., de la Banda E., Preciado S., Albericio F., Lavilla R., Pons G., Gonzalez-Barca E. M., and Gil J. (2017) The prohibitin-binding compound fluorizoline induces apoptosis in chronic lymphocytic leukemia cells through the upregulation of NOXA and synergizes with ibrutinib, 5-aminoimidazole-4-carboxamide riboside or venetoclax. Haematologica 102, 1587–1593 10.3324/haematol.2016.162958 [DOI] [PMC free article] [PubMed] [Google Scholar]
- 29. Moncunill-Massaguer C., Saura-Esteller J., Perez-Perarnau A., Palmeri C. M., Nunez-Vazquez S., Cosialls A. M., Gonzalez-Girones D. M., Pomares H., Korwitz A., Preciado S., Albericio F., Lavilla R., Pons G., Langer T., Iglesias-Serret D., et al. (2015) A novel prohibitin-binding compound induces the mitochondrial apoptotic pathway through NOXA and BIM upregulation. Oncotarget 6, 41750–41765 10.18632/oncotarget.6154 [DOI] [PMC free article] [PubMed] [Google Scholar]
- 30. Pomares H., Palmeri C. M., Iglesias-Serret D., Moncunill-Massaguer C., Saura-Esteller J., Núñez-Vázquez S., Gamundi E., Arnan M., Preciado S., Albericio F., Lavilla R., Pons G., González-Barca E. M., Cosialls A. M., and Gil J. (2016) Targeting prohibitins induces apoptosis in acute myeloid leukemia cells. Oncotarget 7, 64987–65000 10.18632/oncotarget.11333 [DOI] [PMC free article] [PubMed] [Google Scholar]
- 31. Wierz M., Pierson S., Chouha N., Desaubry L., Francois J. H., Berchem G., Paggetti J., and Moussay E. (2018) The prohibitin-binding compound fluorizoline induces apoptosis in chronic lymphocytic leukemia cells ex vivo but fails to prevent leukemia development in a murine model. Haematologica 103, e154–e157 10.3324/haematol.2017.175349 [DOI] [PMC free article] [PubMed] [Google Scholar]
- 32. Perron A., Nishikawa Y., Iwata J., Shimojo H., Takaya J., Kobayashi K., Imayoshi I., Mbenza N. M., Takenoya M., Kageyama R., Kodama Y., and Uesugi M. (2018) Small-molecule screening yields a compound that inhibits the cancer-associated transcription factor Hes1 via the PHB2 chaperone. J. Biol. Chem. 293, 8285–8294 10.1074/jbc.RA118.002316 [DOI] [PMC free article] [PubMed] [Google Scholar]
- 33. Ortiz M. V., Ahmed S., Burns M., Henssen A. G., Hollmann T. J., MacArthur I., Gunasekera S., Gaewsky L., Bradwin G., Ryan J., Letai A., He Y., Naranjo A., Chi Y. Y., LaQuaglia M., et al. (2019) Prohibitin is a prognostic marker and therapeutic target to block chemotherapy resistance in Wilms' tumor. JCI Insight 4, e127098 10.1172/jci.insight.127098 [DOI] [PMC free article] [PubMed] [Google Scholar]
- 34. Horman S., Browne G. J., Krause U., Patel J. V., Vertommen D., Bertrand L., Lavoinne A., Hue L., Proud C. G., and Rider M. H. (2002) Activation of AMP-activated protein kinase leads to the phosphorylation of elongation factor 2 and an inhibition of protein synthesis. Curr. Biol. 12, 1419–1423 10.1016/S0960-9822(02)01077-1 [DOI] [PubMed] [Google Scholar]
- 35. Browne G. J., Finn S. G., and Proud C. G. (2004) Stimulation of the AMP-activated protein kinase leads to activation of eukaryotic elongation factor 2 kinase and to its phosphorylation at a novel site, serine 398. J. Biol. Chem. 279, 12220–12231 10.1074/jbc.M309773200 [DOI] [PubMed] [Google Scholar]
- 36. Wang X., Flynn A., Waskiewicz A. J., Webb B. L. J., Vries R. G., Baines I. A., Cooper J., and Proud C. G. (1998) The phosphorylation of eukaryotic initiation factor eIF4E in response to phorbol esters, cell stresses and cytokines is mediated by distinct MAP kinase pathways. J. Biol. Chem. 273, 9373–9377 10.1074/jbc.273.16.9373 [DOI] [PubMed] [Google Scholar]
- 37. Proud C. G. (2000) Control of the elongation phase of protein synthesis. in Translational control of gene expression (Sonenberg N., Hershey J. W. B., and Mathews M. B., eds), pp. 719–739 Cold Spring Harbor Laboratory Press, Cold Spring Harbor, NY [Google Scholar]
- 38. Schmidt E. K., Clavarino G., Ceppi M., and Pierre P. (2009) SUnSET, a nonradioactive method to monitor protein synthesis. Nat. Methods 6, 275–277 10.1038/nmeth.1314 [DOI] [PubMed] [Google Scholar]
- 39. Xie J., Shen K., Lenchine R. V., Gethings L. A., Trim P. J., Snel M. F., Zhou Y., Kenney J. W., Kamei M., Kochetkova M., Wang X., and Proud C. G. (2018) Eukaryotic elongation factor 2 kinase upregulates the expression of proteins implicated in cell migration and cancer cell metastasis. Int. J. Cancer 142, 1865–1877 10.1002/ijc.31210 [DOI] [PubMed] [Google Scholar]
- 40. Yanagiya A., Suyama E., Adachi H., Svitkin Y. V., Aza-Blanc P., Imataka H., Mikami S., Martineau Y., Ronai Z. A., and Sonenberg N. (2012) Translational homeostasis via the mRNA cap-binding protein, eIF4E. Mol. Cell. 46, 847–858 10.1016/j.molcel.2012.04.004 [DOI] [PMC free article] [PubMed] [Google Scholar]
- 41. Dite T. A., Langendorf C. G., Hoque A., Galic S., Rebello R. J., Ovens A. J., Lindqvist L. M., Ngoei K. R. W., Ling N. X. Y., Furic L., Kemp B. E., Scott J. W., and Oakhill J. S. (2018) AMP-activated protein kinase selectively inhibited by the type II inhibitor SBI-0206965. J. Biol. Chem. 293, 8874–8885 10.1074/jbc.RA118.003547 [DOI] [PMC free article] [PubMed] [Google Scholar]
- 42. Wang X., Xie J., da Mota S. R., Moore C. E., and Proud C. G. (2015) Regulated stability of eukaryotic elongation factor 2 kinase requires intrinsic but not ongoing activity. Biochem. J. 467, 321–331 10.1042/BJ20150089 [DOI] [PubMed] [Google Scholar]
- 43. Kruiswijk F., Yuniati L., Magliozzi R., Low T. Y., Lim R., Bolder R., Mohammed S., Proud C. G., Heck A. J., Pagano M., and Guardavaccaro D. (2012) Coupled activation and degradation of eEF2K regulates protein synthesis in response to genotoxic stress. Sci. Signal. 5, ra40 10.1126/scisignal.2002718 [DOI] [PMC free article] [PubMed] [Google Scholar]
- 44. Hetz C. (2012) The unfolded protein response: controlling cell fate decisions under ER stress and beyond. Nat. Rev. Mol. Cell Biol. 13, 89–102 10.1038/nrm3270 [DOI] [PubMed] [Google Scholar]
- 45. Zhang K., and Kaufman R. J. (2006) The unfolded protein response: A stress signaling pathway critical for health and disease. Neurology 66, S102–S109 10.1212/01.wnl.0000192306.98198.ec [DOI] [PubMed] [Google Scholar]
- 46. Lytton J., Westlin M., and Hanley M. R. (1991) Thapsigargin inhibits the sarcoplasmic or endoplasmic reticulum Ca-ATPase family of calcium pumps. J. Biol. Chem. 266, 17067–17071 [PubMed] [Google Scholar]
- 47. Kumar P., Nagarajan A., and Uchil P. D. (2018) Analysis of cell viability by the MTT assay. Cold Spring Harb. Protoc. 2018 10.1101/pdb.prot095505 [DOI] [PubMed] [Google Scholar]
- 48. Pakos-Zebrucka K., Koryga I., Mnich K., Ljujic M., Samali A., and Gorman A. M. (2016) The integrated stress response. EMBO Rep. 17, 1374–1395 10.15252/embr.201642195 [DOI] [PMC free article] [PubMed] [Google Scholar]
- 49. Liu R., and Proud C. G. (2016) Eukaryotic elongation factor 2 kinase as a drug target in cancer, and in cardiovascular and neurodegenerative diseases. Acta Pharmacol. Sin. 37, 285–294 10.1038/aps.2015.123 [DOI] [PMC free article] [PubMed] [Google Scholar]
- 50. Wang D., Tabti R., Elderwish S., Abou-Hamdan H., Djehal A., Yu P., Yurugi H., Rajalingam K., Nebigil C. G., and Desaubry L. (2020) Prohibitin ligands: A growing armamentarium to tackle cancers, osteoporosis, inflammatory, cardiac and neurological diseases. Cell. Mol. Life Sci. 10.1007/s00018-020-03475-1 [DOI] [PMC free article] [PubMed] [Google Scholar]
- 51. Clarke H. J., Chambers J. E., Liniker E., and Marciniak S. J. (2014) Endoplasmic reticulum stress in malignancy. Cancer Cell 25, 563–573 10.1016/j.ccr.2014.03.015 [DOI] [PubMed] [Google Scholar]
- 52. Sripathi S. R., Sylvester O., He W., Moser T., Um J. Y., Lamoke F., Ramakrishna W., Bernstein P. S., Bartoli M., and Jahng W. J. (2016) Prohibitin as the molecular binding switch in the retinal pigment epithelium. Protein J. 35, 1–16 10.1007/s10930-015-9641-y [DOI] [PMC free article] [PubMed] [Google Scholar]
- 53. Kasashima K., Ohta E., Kagawa Y., and Endo H. (2006) Mitochondrial functions and estrogen receptor-dependent nuclear translocation of pleiotropic human prohibitin 2. J. Biol. Chem. 281, 36401–36410 10.1074/jbc.M605260200 [DOI] [PubMed] [Google Scholar]
- 54. Gross B. S., Melford S. K., and Watson S. P. (1999) Evidence that phospholipase C-γ2 interacts with SLP-76, Syk, Lyn, LAT and the Fc receptor γ-chain after stimulation of the collagen receptor glycoprotein VI in human platelets. Eur. J. Biochem. 263, 612–623 10.1046/j.1432-1327.1999.00560.x [DOI] [PubMed] [Google Scholar]
- 55. Wortel I. M. N., van der Meer L. T., Kilberg M. S., and van Leeuwen F. N. (2017) Surviving stress: Modulation of ATF4-mediated stress responses in normal and malignant cells. Trends Endocrinol. Metab. 28, 794–806 10.1016/j.tem.2017.07.003 [DOI] [PMC free article] [PubMed] [Google Scholar]
- 56. Thuaud F., Bernard Y., Türkeri G., Dirr R., Aubert G., Cresteil T., Baguet A., Tomasetto C., Svitkin Y., Sonenberg N., Nebigil C. G., and Désaubry L. (2009) Synthetic analogue of rocaglaol displays a potent and selective cytotoxicity in cancer cells: Involvement of apoptosis inducing factor and caspase-12. J. Med. Chem. 52, 5176–5187 10.1021/jm900365v [DOI] [PubMed] [Google Scholar]
- 57. Sidrauski C., Acosta-Alvear D., Khoutorsky A., Vedantham P., Hearn B. R., Li H., Gamache K., Gallagher C. M., Ang K. K., Wilson C., Okreglak V., Ashkenazi A., Hann B., Nader K., Arkin M. R., Renslo A. R., Sonenberg N., and Walter P. (2013) Pharmacological brake-release of mRNA translation enhances cognitive memory. Elife 2, e00498 10.7554/eLife.00498 [DOI] [PMC free article] [PubMed] [Google Scholar]
- 58. Moore C. E., Mikolajek H., Regufe da Mota S., Wang X., Kenney J. W., Werner J. M., and Proud C. G. (2015) Elongation factor 2 kinase is regulated by proline hydroxylation and protects cells during hypoxia. Mol. Cell. Biol. 35, 1788–1804 10.1128/MCB.01457-14 [DOI] [PMC free article] [PubMed] [Google Scholar]
- 59. Xie J., de Souza Alves V., von der Haar T., O'Keefe L., Lenchine R. V., Jensen K. B., Liu R., Coldwell M. J., Wang X., and Proud C. G. (2019) Regulation of the elongation phase of protein synthesis enhances translation accuracy and modulates lifespan. Curr. Biol. 29, 737–749.e735 10.1016/j.cub.2019.01.029 [DOI] [PubMed] [Google Scholar]
- 60. Bradford M. M. (1976) A rapid and sensitive method for the quantitation of microgram quantities of protein utilizing the principle of protein-dye binding. Anal. Biochem. 72, 248–254 10.1016/0003-2697(76)90527-3 [DOI] [PubMed] [Google Scholar]
- 61. Hall-Jackson C. A., Cross D. A., Morrice N., and Smythe C. (1999) ATR is a caffeine-sensitive, DNA-activated protein kinase with a substrate specificity distinct from DNA-PK. Oncogene 18, 6707–6713 10.1038/sj.onc.1203077 [DOI] [PubMed] [Google Scholar]
- 62. Emerson V., Holtkotte D., Pfeiffer T., Wang I. H., Schnolzer M., Kempf T., and Bosch V. (2010) Identification of the cellular prohibitin 1/prohibitin 2 heterodimer as an interaction partner of the C-terminal cytoplasmic domain of the HIV-1 glycoprotein. J. Virol. 84, 1355–1365 10.1128/JVI.01641-09 [DOI] [PMC free article] [PubMed] [Google Scholar]
- 63. Yoshida H., Matsui T., Yamamoto A., Okada T., and Mori K. (2001) XBP1 mRNA is induced by ATF6 and spliced by IRE1 in response to ER stress to produce a highly active transcription factor. Cell 107, 881–891 10.1016/S0092-8674(01)00611-0 [DOI] [PubMed] [Google Scholar]
Associated Data
This section collects any data citations, data availability statements, or supplementary materials included in this article.
Supplementary Materials
Data Availability Statement
All data of this publication have been contained within this manuscript or are available from the corresponding author (Chris Proud; SAHMRI, Adelaide, Australia; E-mail: Christopher.Proud@sahmri.com) upon reasonable request.