

Abstract
Huntington disease (HD) is a neurodegenerative disorder caused by expanded CAG repeats in the Huntingtin gene. Results from previous studies have suggested that transcriptional dysregulation is one of the key mechanisms underlying striatal medium spiny neuron (MSN) degeneration in HD. However, some of the critical genes involved in HD etiology or pathology could be masked in a common expression profiling assay because of contamination with non-MSN cells. To gain insight into the MSN-specific gene expression changes in presymptomatic R6/2 mice, a common HD mouse model, here we used a transgenic fluorescent protein marker of MSNs for purification via FACS before profiling gene expression with gene microarrays and compared the results of this “FACS-array” with those obtained with homogenized striatal samples (STR-array). We identified hundreds of differentially expressed genes (DEGs) and enhanced detection of MSN-specific DEGs by comparing the results of the FACS-array with those of the STR-array. The gene sets obtained included genes ubiquitously expressed in both MSNs and non-MSN cells of the brain and associated with transcriptional regulation and DNA damage responses. We proposed that the comparative gene expression approach using the FACS-array may be useful for uncovering the gene cascades affected in MSNs during HD pathogenesis.
Keywords: Huntington disease, fluorescence-activated cell sorting (FACS), microarray, medium spiny neuron (MSN), R6/2 mouse model, neurodegeneration, transcriptomics, DNA damage, transcription regulation, striatum
Huntington disease (HD) is an autosomal-dominant neurodegenerative disease characterized by chorea, psychiatric disturbances, and cognitive dysfunction (1). Neuropathological changes in HD are most notable in caudate and putamen, with prominent loss of striatal medium spiny neurons (MSNs) (2). Genetically, HD is caused by the expansion of CAG repeats encoding polyglutamine (polyQ) in exon 1 of Huntingtin (HTT) (3). Extensive experimental evidence shows that the truncated mutant huntingtin protein (mHTT) causes transcriptional dysregulation via disruption of transcriptional regulators, such as transcription factors (4–6) and chromatin status changes (7, 8). Human HD brains exhibit a large number of gene expression changes, and the representative dysregulated genes, such as SCN4B, PENK, RGS4, and CNR1, substantially correspond to those of HD model mice (7, 9, 10), suggesting that transcriptional dysregulation is a central machinery of HD pathogenesis.
Gene expression profiling can be a potential tool for understanding disease phenotypes and identifying therapeutic targets in HD (9–13). Previous transcriptome analysis using whole brains and whole striatal samples revealed a large number of dysregulated genes and affected biological pathways in HD (14). In the dysregulated genes, more than 80% of down-regulated genes are strongly expressed in striatal MSNs (e.g. D1R, D2R, SCN4B, and PPP1R1B) (15), and affected biological pathways are related to the function of striatum (e.g. neurotransmitter receptors, calcium signaling, and G-protein signaling) (14). On the other hand, gene expression alterations in non-MSN cells were also reported. Up-regulation of GFAP expression, an astrocytic inflammatory gene expression, was shown in the brain of HD model mice and HD patients (9, 11). In addition, transcriptional activation of pro-inflammatory genes in microglia occurs in the brain of HD mice and HD patients (16). These results suggest that gene expression profiling using whole brains or whole striatal samples is affected by glial cell responses, and that critical genes contributing to MSN degeneration may be masked in common profiling assays.
Here, we report comparative analysis of gene expression profiling between purified MSNs and whole striatal samples derived from presymptomatic R6/2 mice, which are the well-characterized and widely used HD model mice (17). The R6/2 expresses the 5′ end of the human HD gene (HTT) containing an ∼120-CAG repeat expansion. The transgene expression is driven by the human HTT promoter, and the expression levels of transgene are around 75% of the endogenous levels. R6/2 mice display loss of body weight and progressive neurological phenotypes, such as motor deficits and tremor (17). To avoid incorporation of non-MSN cells, striatal MSNs were genetically labeled (18) and purified by FACS (19–21). To identify differentially expressed probes/genes (DEPs/DEGs) from purified MSNs and whole striatal samples, we performed microarray analysis using these two samples (FACS-array and STR-array). We identified a number of FACS-enriched DEPs/DEGs showing enhanced detection in FACS-array compared with STR-array. FACS-enriched DEPs/DEGs contained genes that were ubiquitously expressed in the brain rather than specifically expressed in the MSNs. Those FACS-enriched DEPs/DEGs could be masked in a common profiling assay by the changes of their expression in non-MSN cells. Gene ontology (GO) enrichment analysis revealed that FACS-enriched DEPs/DEGs were associated with “transcriptional regulation” and “DNA damage” that were distinct from the results of other gene sets (FACS-nonenriched DEPs/DEGs, STR-enriched DEPs/DEGs, STR-nonenriched DEPs/DEGs). Thus, the novel gene set, generated from contrast analysis between FACS-array and STR-array, provided masked disease cascade in a common profiling assay. We propose that the study of vulnerable cell-specific transcriptome analysis provides information valuable for understanding pathological cascades in neurodegenerative disorders.
Results
Generation and characterization of R6/2;Scn4b-Venus mouse
To label MSNs in R6/2 mice with Venus fluorescence protein genetically, we crossed R6/2 with a Scn4b-Venus mouse expressing Venus in MSNs under the control of a Scn4b-promoter (18). Double staining using anti-GFP, which recognizes Venus protein, and anti-DARPP-32, an established marker of MSNs, showed colocalization of these two signals (Fig. S1). This result indicates that Venus was definitely expressed in the MSNs of Scn4b-Venus mice. Next, we examined mRNA and protein levels of Venus in R6/2;Scn4b-Venus mice. Because Venus expression is driven by the promoter of Scn4b, which is one of the early down-regulated genes in HD (10), it is possible that Venus expression is also affected by mHTT. The results of in situ hybridization (ISH) showed that, in addition to Scn4b mRNA, mRNA levels of Venus in MSNs of 4-week-old R6/2;Scn4b-Venus mice were already down-regulated to half of control levels (Fig. 1A), suggesting that Venus expression is affected by mHTT through the promoter. Consistent results were obtained by quantitative PCR (qPCR) using whole striatal samples (Fig. 1B). On the other hand, the immunohistochemical analysis showed that protein levels of Venus were mostly preserved in MSNs of 4-week-old R6/2;Scn4b-Venus mice, although the Venus protein expression was clearly reduced in 8- and 12-week-old R6/2;Scn4b-Venus mice compared with control (Fig. 1, C and D). These results indicate that even though Venus mRNA expression was affected by mHTT, protein levels of Venus were preserved in MSNs until 4 weeks in R6/2;Scn4b-Venus. Double staining with anti-GFP and anti-Htt (EM48), generated against the first 256 amino acids of truncated huntingtin protein (22), showed that GFP-positive MSNs contained intranuclear diffuse Htt-positive signals in 4-week-old R6/2;Scn4b-Venus mice (Fig. 1C and Fig. S2). These diffuse Htt signals are called “nuclear accumulations” (NAs), which are distinct from the neuronal intranuclear inclusions (NIIs) observed in the degenerating neurons of HD mouse models and HD patients (4, 23). Indeed, at 4 weeks, EM48- and ubiquitin-positive aggregates are mainly NAs or small-size NIIs in the striatum of R6/2, whereas the NIIs became obvious in association with a decrease in NAs at 8 weeks (Fig. S3). The percentage of NA-positive MSNs was more than 99% (n = 417 NA+Venus+ out of 418 Venus+) at 4 weeks. We thus decided to use the MSNs of 4-week-old R6/2;Scn4b-Venus and its control (WT;Scn4b-Venus) mice for array profiling for the following reasons: 1) mRNA levels of Scn4b, a representative DEG in HD, were already altered at this stage; 2) protein levels of Venus in MSNs of R6/2 mice were similar to those of control mice; and 3) secondary effects of transcriptional disruption would be small at this early stage.
Figure 1.
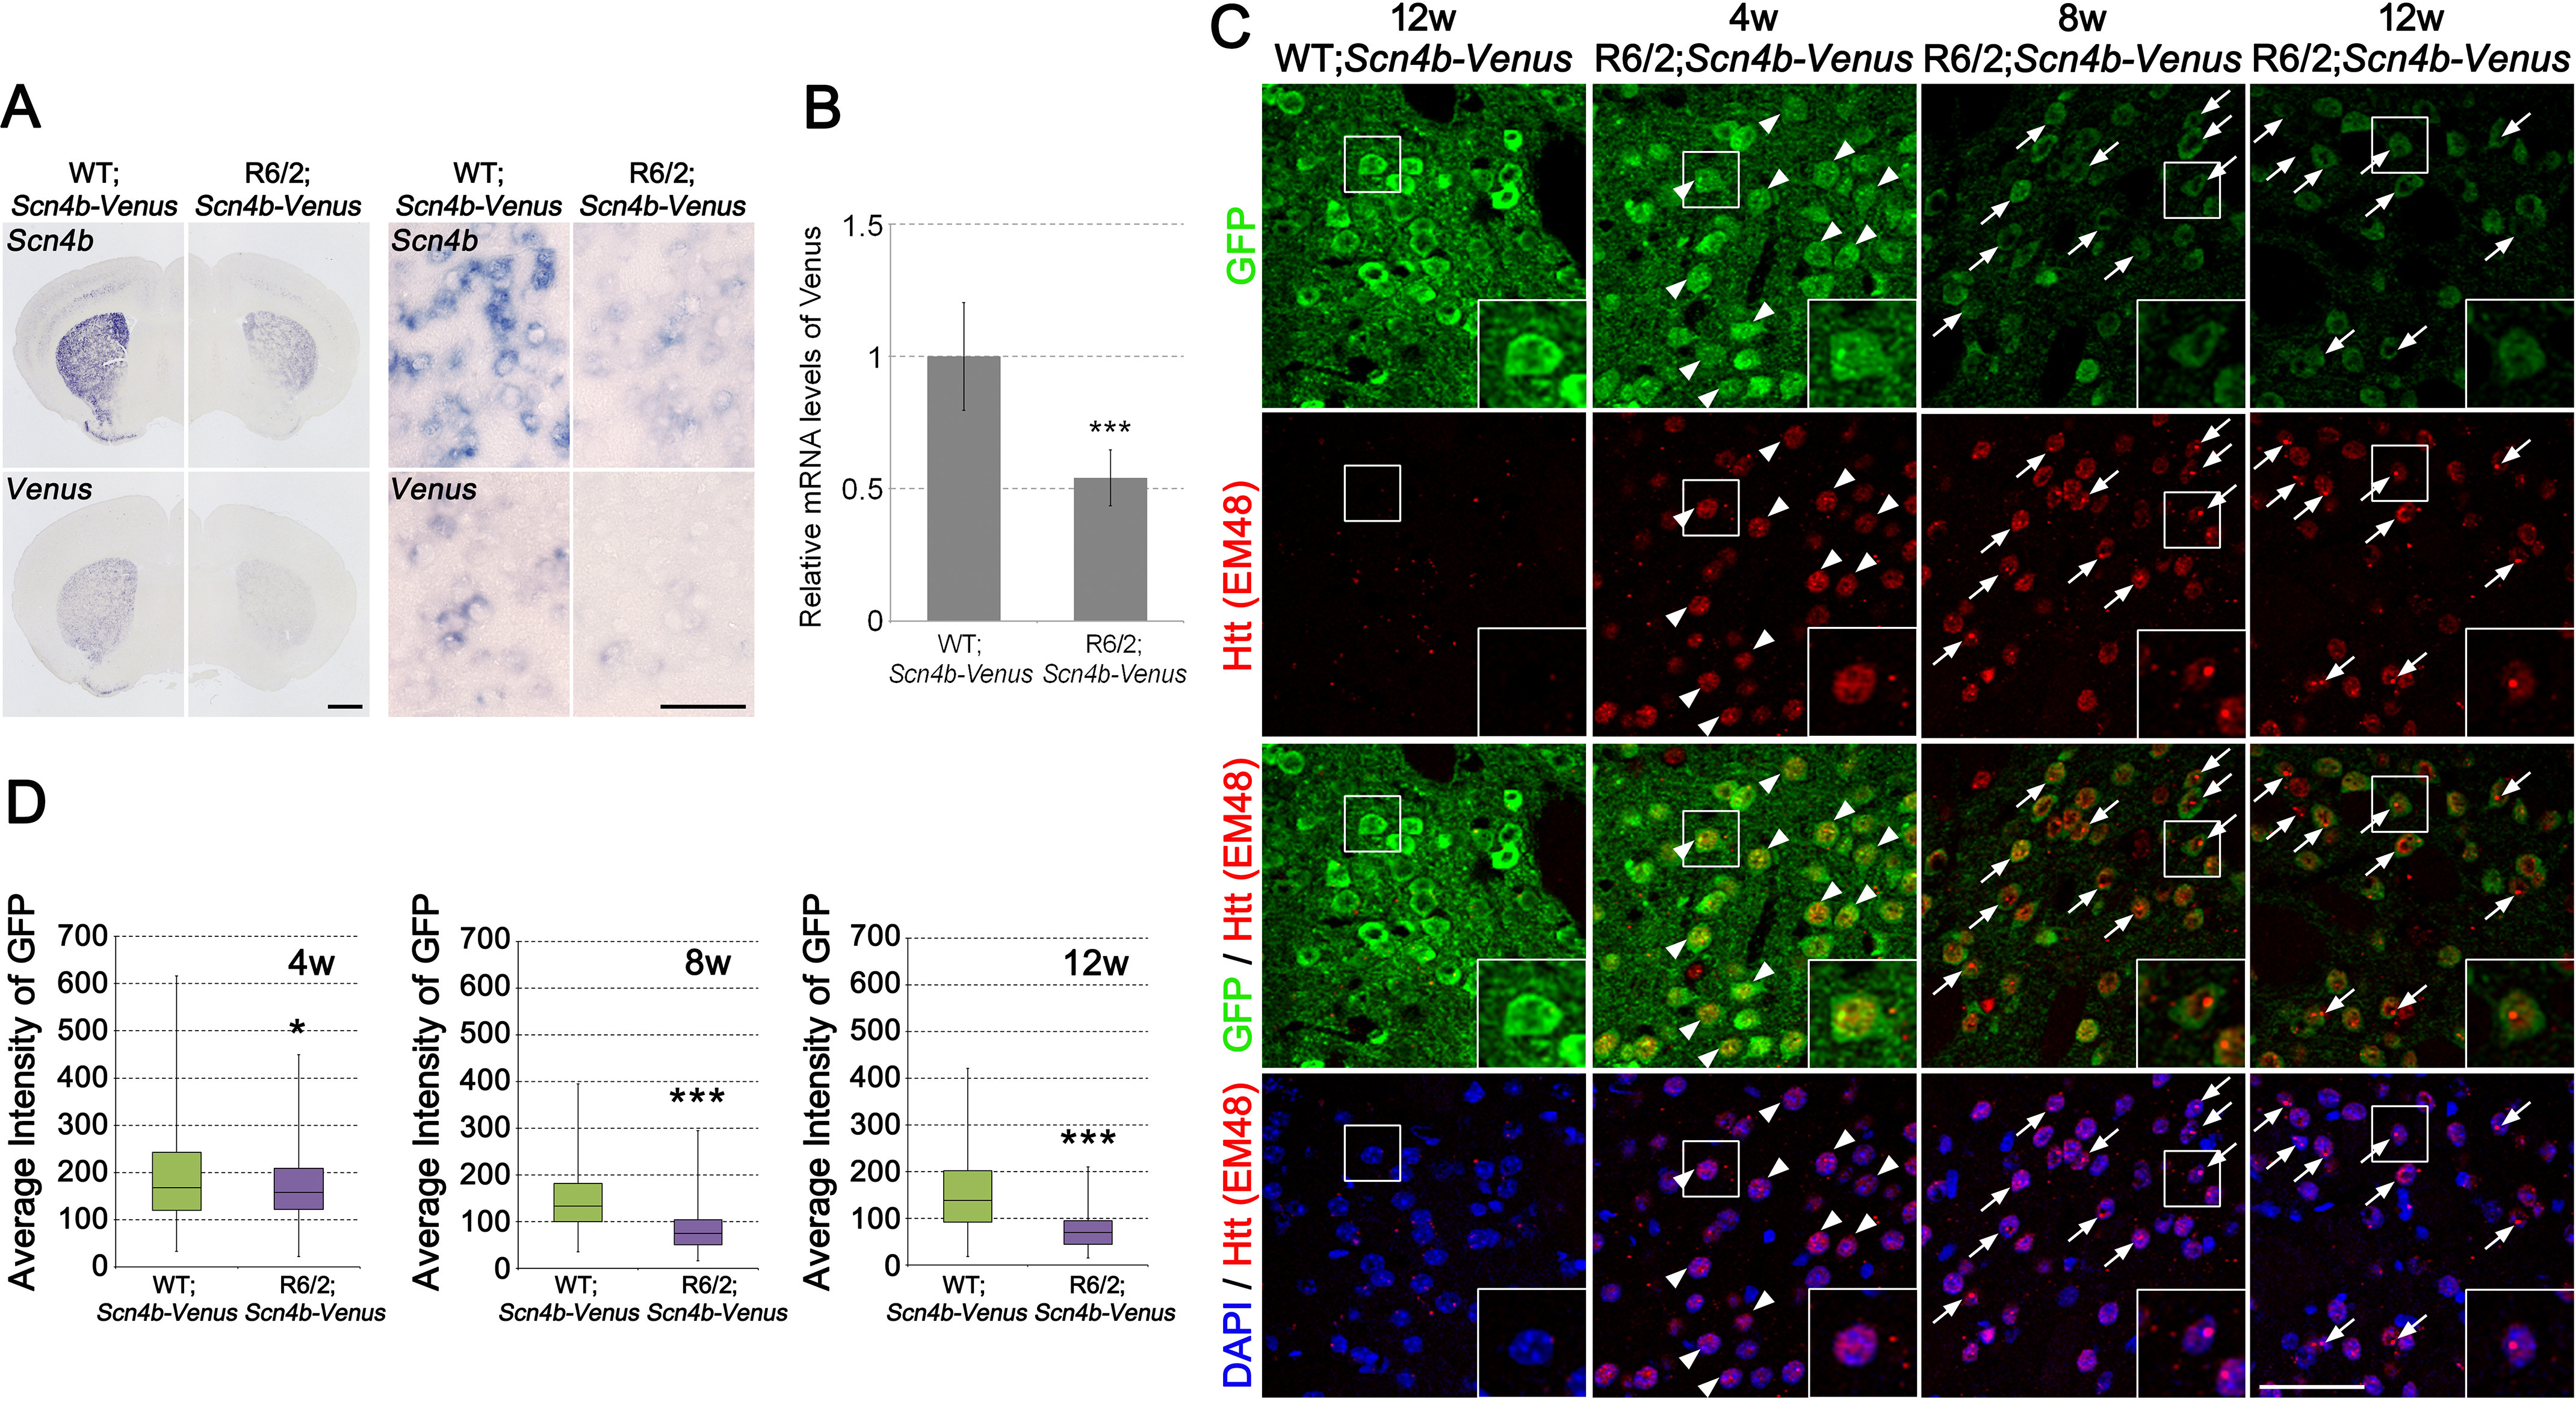
Characterization of Venus expressing cells in the striatum of WT; and R6/2;Scn4b-Venus mouse. A, images of ISH using Scn4b and Venus probes in the brain of 4-week-old WT; and R6/2;Scn4b-Venus mouse. The right panels show higher magnification of the striatum in the left panels. B, relative mRNA levels of Venus in the striatum of 4-week-old WT; and R6/2;Scn4b-Venus mice (n = 4 from each genotype). Gapdh was used to normalize mRNA levels of Venus. Data are presented as mean ± S.D. ***, p < 0.001, unpaired Student's t test. C, coronal striatal sections of 12-week-old WT;Scn4b-Venus and 4-, 8-, and 12-week-old R6/2;Scn4b-Venus mice were stained with anti-GFP (green) and anti-Huntingtin (Htt, clone EM48) (red). Nuclei were stained with 4′,6-diamidino-2-phenylindole (DAPI) (blue). Arrowheads reveal Htt-positive nuclear accumulations (NAs) in the striatal MSNs. Arrows reveal Htt-positive NIIs. Large images of the boxed areas are shown in the inset boxes. Large images of C are displayed in Fig. S2. D, box plot showing average immunofluorescence intensity of GFP per cell. The box plot displays the median (line across the box), interquartile range (box), and maximum and minimum values (whiskers). GFP intensity of individual MSNs is calculated by ArrayScan HCS Reader (4 weeks old, n = 445 for WT;Scn4b-Venus and n = 418 for R6/2;Scn4b-Venus; 8 weeks old, n = 390 for WT;Scn4b-Venus and n = 417 for R6/2;Scn4b-Venus; 12 weeks old, n = 404 for WT;Scn4b-Venus and n = 435 for R6/2;Scn4b-Venus). *, p < 0.05; ***, p < 0.001, unpaired Student's t test. Scale bars, 1 mm (A, left) and 50 μm (A (right) and C).
Gene expression profiling of MSNs and whole striatal samples from HD mice
To purify MSNs, we dissected striatal regions from the brains of 4-week-old R6/2;Scn4b-Venus and its control mice and dissociated them with papain. After staining with propidium iodide (PI) to detect dead cells, the dissociated cells were sorted with FACS, and finally 5,000–10,000 Venus-positive MSNs were obtained (Fig. 2 (A–C) and Fig. S4). RNA quality of the sorted MSNs was assessed using Agilent Bioanalyzer to confirm no clear degradation (RIN > 7.0) (Fig. S5). Amplified and labeled MSN cDNAs were generated from the total RNA and hybridized to an Agilent SurePrint G3 Mouse GE 8x60K Microarray (FACS-array) (Fig. 2A). To compare DEPs between purified MSNs and whole striatum, we performed microarray analysis using whole striatal samples from 4-week-old R6/2 and control mice (STR-array) (Fig. 2A). No degradation of total RNA of the striatal samples was confirmed by Agilent Bioanalyzer (RIN > 8.0) (Fig. S6).
Figure 2.
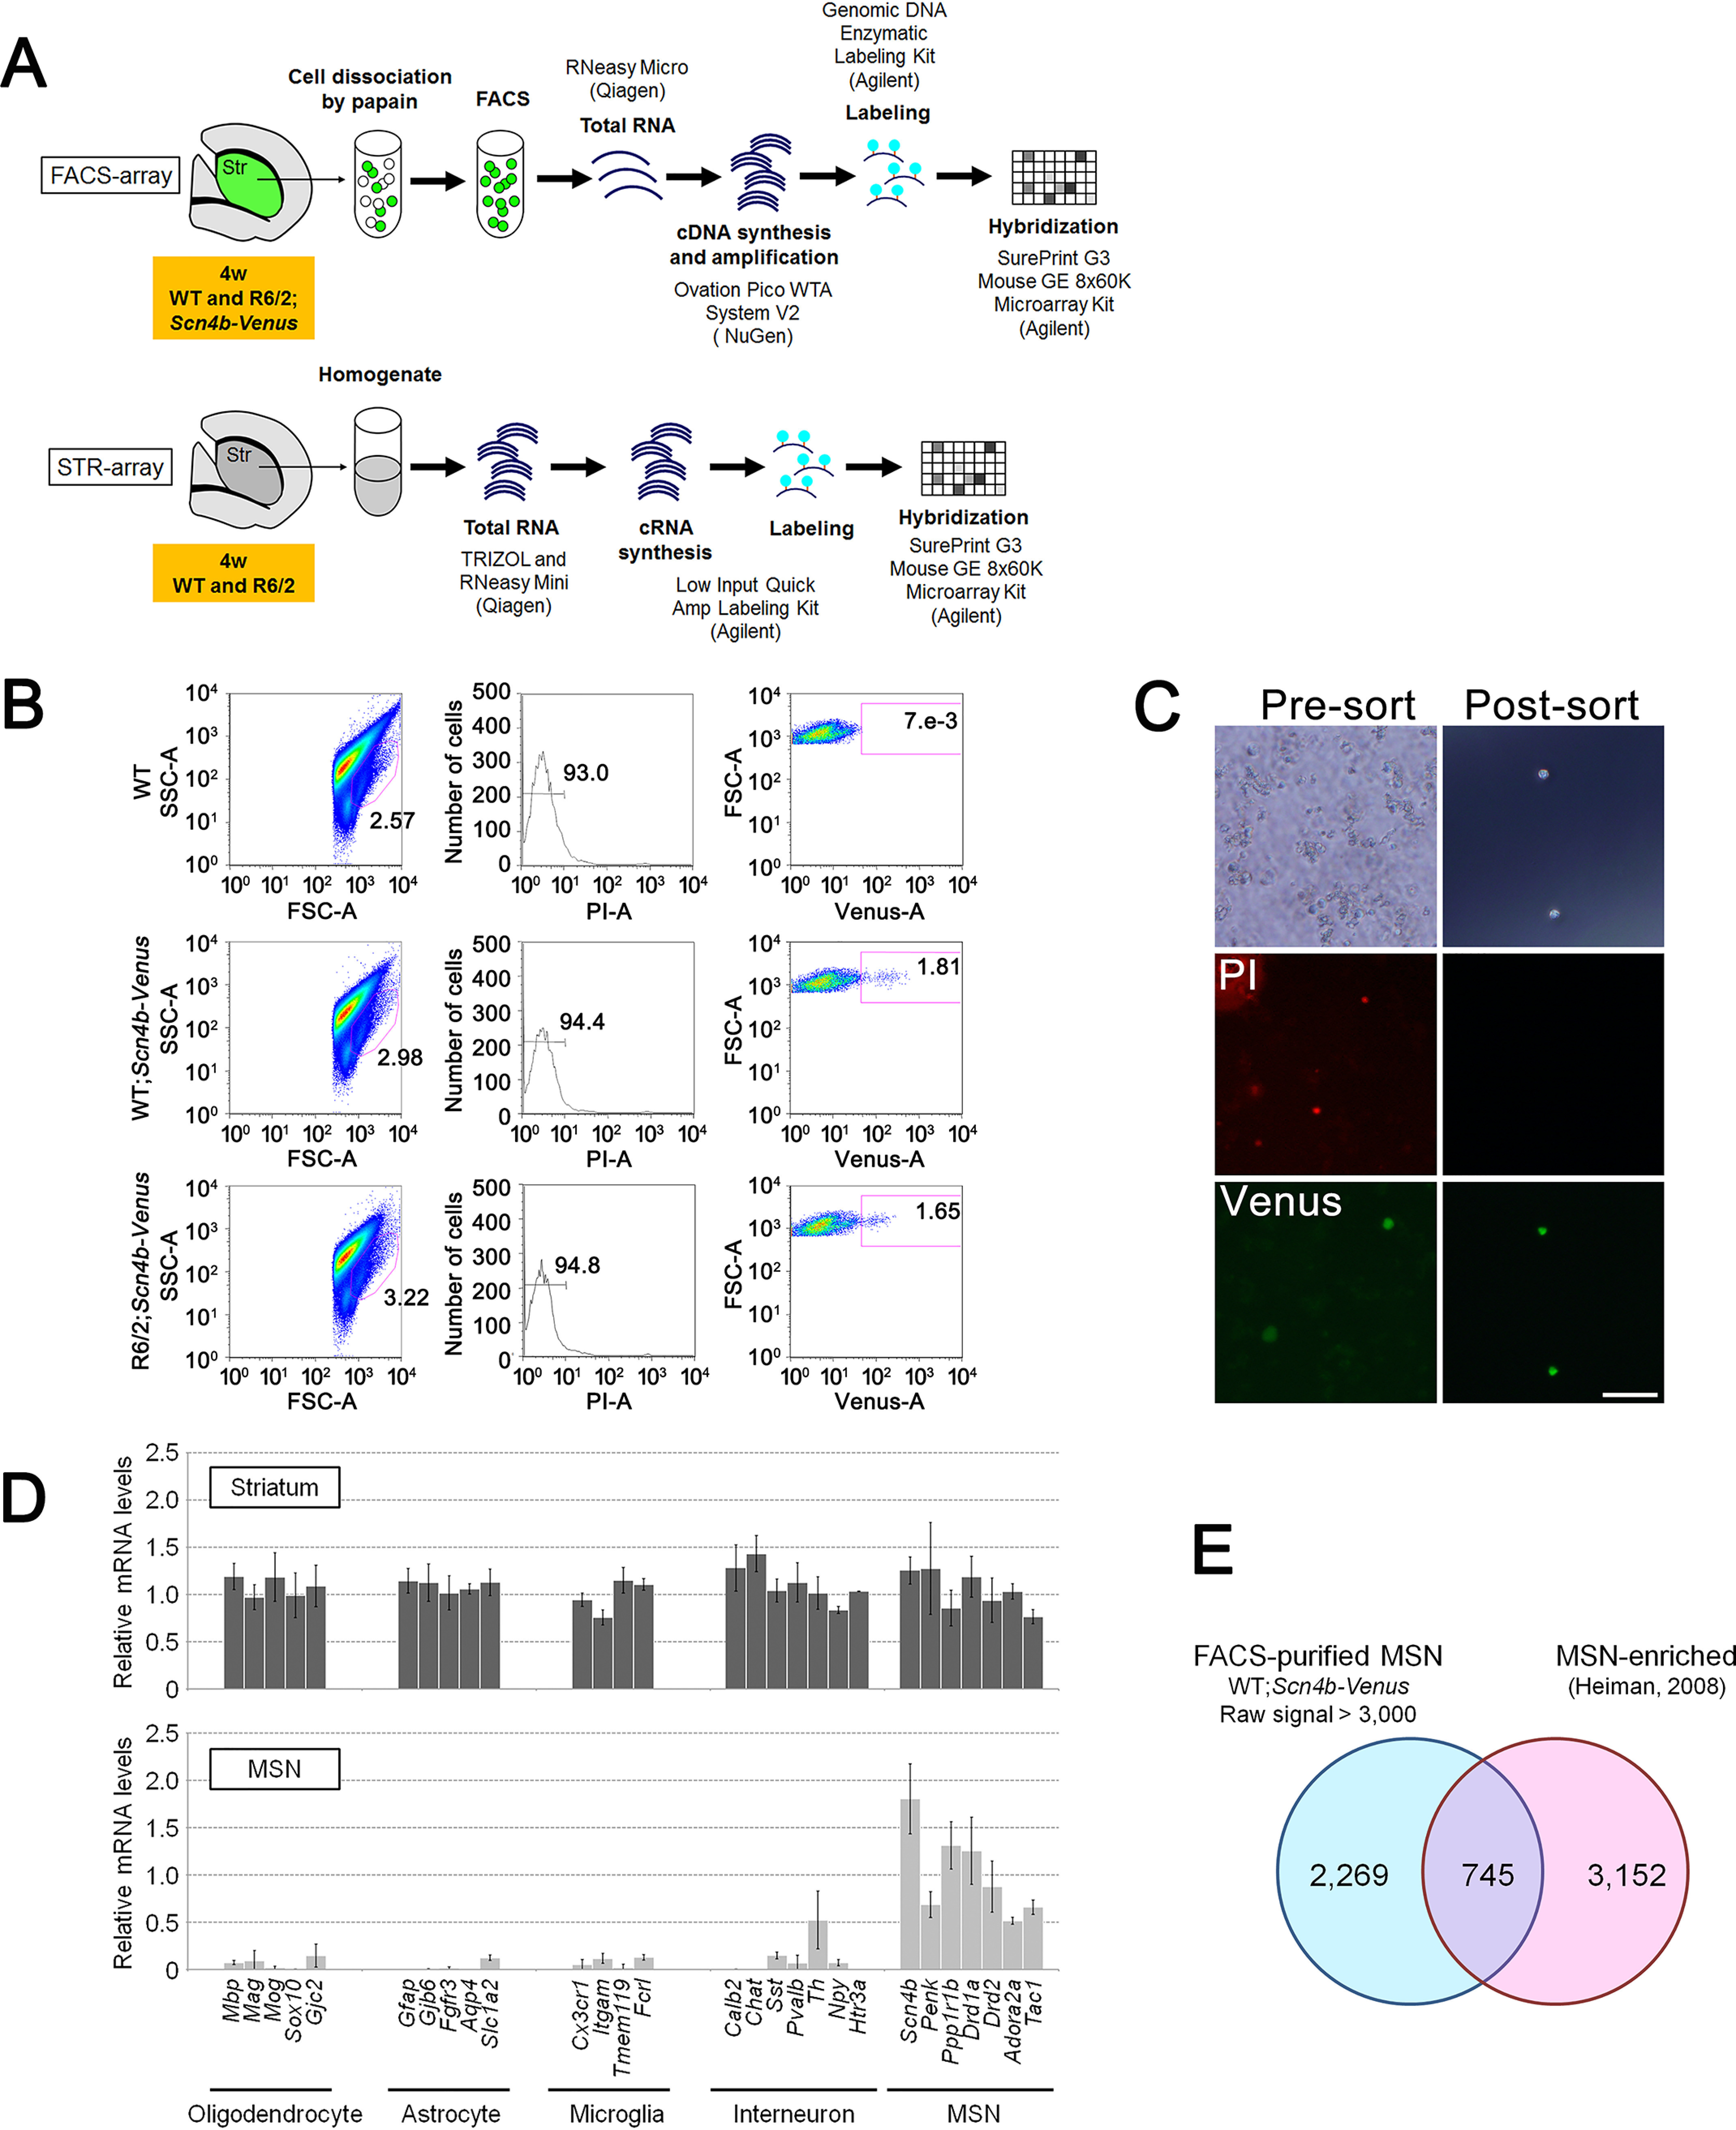
Purification of MSNs from striatum of WT; and R6/2;Scn4b-Venus mouse. A, experimental procedure of FACS-array and STR-array. B, example of flow cytometric data of Venus-positive and PI-negative cells from striatum of WT (negative control) and WT; and R6/2;Scn4b-Venus mouse. C, images of bright-field (top), PI staining (middle), and native Venus expression (bottom) of presorted and postsorted striatal sample from WT;Scn4b-Venus mouse. D, relative mRNA levels of cell type–specific markers for oligodendrocyte, astrocyte, microglia, interneuron, and MSN in FACS-purified MSNs and whole striatal samples. Data are presented as mean ± S.D. (error bars) (n = 6 for MSNs, n = 4 for whole striatal samples). Gapdh was used to normalize the gene expression data. E, Venn diagram of the probe sets, which are FACS-purified MSN (WT;Scn4b-Venus, raw signal cut-off >3,000, at least 1 of 4 samples have the value within range) and Heiman's MSN-enriched probe set (26). Scale bar, 50 μm (C).
To validate purification of FACS-sorted MSNs, we performed qPCR using cell type–specific markers. The expression levels of cell type–specific markers for oligodendrocyte (Mbp, Mag, Mog, Sox10, and Gjc2), astrocyte (Gfap, Gjb6, Egfr3, Aqp4, and Slc1a2), microglia (Cx3cr1, Itgam, Tmem119, and Fcrl), and striatal interneurons (Calb2, Chat, Sst, Pvalb, Npy, and Htr3a) (24) were very low in the FACS-purified MSNs compared with whole striatal samples (Fig. 2D). Only the expression of Th, a marker of the striatal interneuron subtype, was detected in purified MSNs (Fig. 2D). The result suggests that a subset of Th-expressing interneurons could remain in FACS-purified MSN fractions or detect local expression of TH mRNA in the terminals of nigrostriatal projection fibers (25). In contrast, the expression of MSN subtype markers, such as Drd1a and Tac1 (striatonigral MSN markers) and Drd2 and Penk (striatopallidal MSN markers), was detected in the FACS-purified MSNs (Fig. 2D). Comparative analysis between FACS-purified MSNs gene expression data (WT;Scn4b-Venus, raw signal > 3,000, 3,014 probes) (Table S1) and Heiman's MSN-enriched gene expression data (3,897 genes) (26) revealed that 745 probes (24.7%) in our data overlapped with their MSN-enriched gene expression data (Fig. 2E). Furthermore, well-known striatal-enriched genes, Ppp1r1b, Ptpn5, Arpp19, Arpp21, Gnal, Rasd2, Rgs9, Adcy5, Gng7, Rasgrp2, Pde1b, Pde10a, Gpr88, Rarb, Strn4, Foxp1, and Zfp503 (26), were contained in our FACS-purified MSN gene expression data (Table S1). These results indicate that we obtained an MSN-enriched fraction containing both striatonigral and striatopallidal MSN subtypes by FACS. Microarray data for FACS-purified MSNs and whole striatal samples are available in the GEO database under accession numbers GSE113928, GSE113929, and GSE113930.
Identification of FACS- and STR-array DEPs in HD mice
First, we performed qPCR validation for FACS- and STR-array data. The qPCR results of known dysregulated genes (14) showed consistent results with log2 -fold change (FC) values of the microarray data (Fig. 3, A and B). This result indicates that both FACS- and STR-array data certainly include mHTT-associated differentially expressed genes. Next, to identify differentially expressed probes of FACS-array (FACS-array DEPs), microarray data were statistically analyzed using GeneSpring software. We identified 1,014 probes showing different signals in R6/2 MSNs (absolute (abs) FC > 1.5, p < 0.05, raw signal > 100) (Table S2). To find DEPs showing enrichment in FACS-array compared with STR-array, we examined the ratio of absolute FC of FACS-array DEPs to corresponding probes in STR-array (FACS-FC/STR-FC). The FACS-array DEPs showing FACS-FC/STR-FC > 1.5 were selected as FACS-enriched DEPs. The FACS-enriched DEPs referred to more detectable DEPs by FACS-array than STR-array due to their higher FC. On the other hand, the FACS-array DEPs showing similar FC and the same directional change as STR-array (FACS-FC/STR-FC < 1.5) were selected as FACS-nonenriched DEPs (Fig. S7A). Because FACS-“enriched” DEPs should include “dramatically changed” DEPs compared with STR-array, we included the DEPs showing opposite expression change compared with corresponding STR-probes (up and down or down and up). Those probes were also considered “dramatically changed” DEPs and included in the FACS-enriched DEP set (Fig. S7A). To obtain an overview of the array data, we plotted the log2 FCs of the FACS-array DEPs against those of corresponding probes in STR-array (Fig. 3C and Fig. S8A). DEPs located on the positive direction area of the x axis (from 0 to 5) are up-regulated genes in R6/2 MSNs, and DEPs located on the negative direction area of the x axis (from 0 to −5) are down-regulated genes in R6/2 MSNs. Likewise, DEPs located on the positive direction area of the y axis (from 0 to 5) are up-regulated genes in R6/2 striatum, and DEPs located on the negative direction area of the y axis (from 0 to −5) are down-regulated genes in R6/2 striatum (Fig. 3, C and D). In addition, DEPs located on the opposite direction area (x axis, 0–5; y axis, 0 to −5; x axis, 0 to −5; y axis, 0–5) are the DEPs showing opposite expression regulation between FACS-array and STR-array. We identified 677 FACS-enriched DEPs (pink dots in Fig. 3C) and 337 FACS-nonenriched DEPs (blue dots in Fig. 3C) (Table S2). Notably, known dysregulated genes such as Scn4b (FC = −2.22, p = 0.0068) and Rgs4 (FC = −1.63, p = 0.0076) were mostly found in FACS-nonenriched DEPs (red dots in Fig. 3C).
Figure 3.
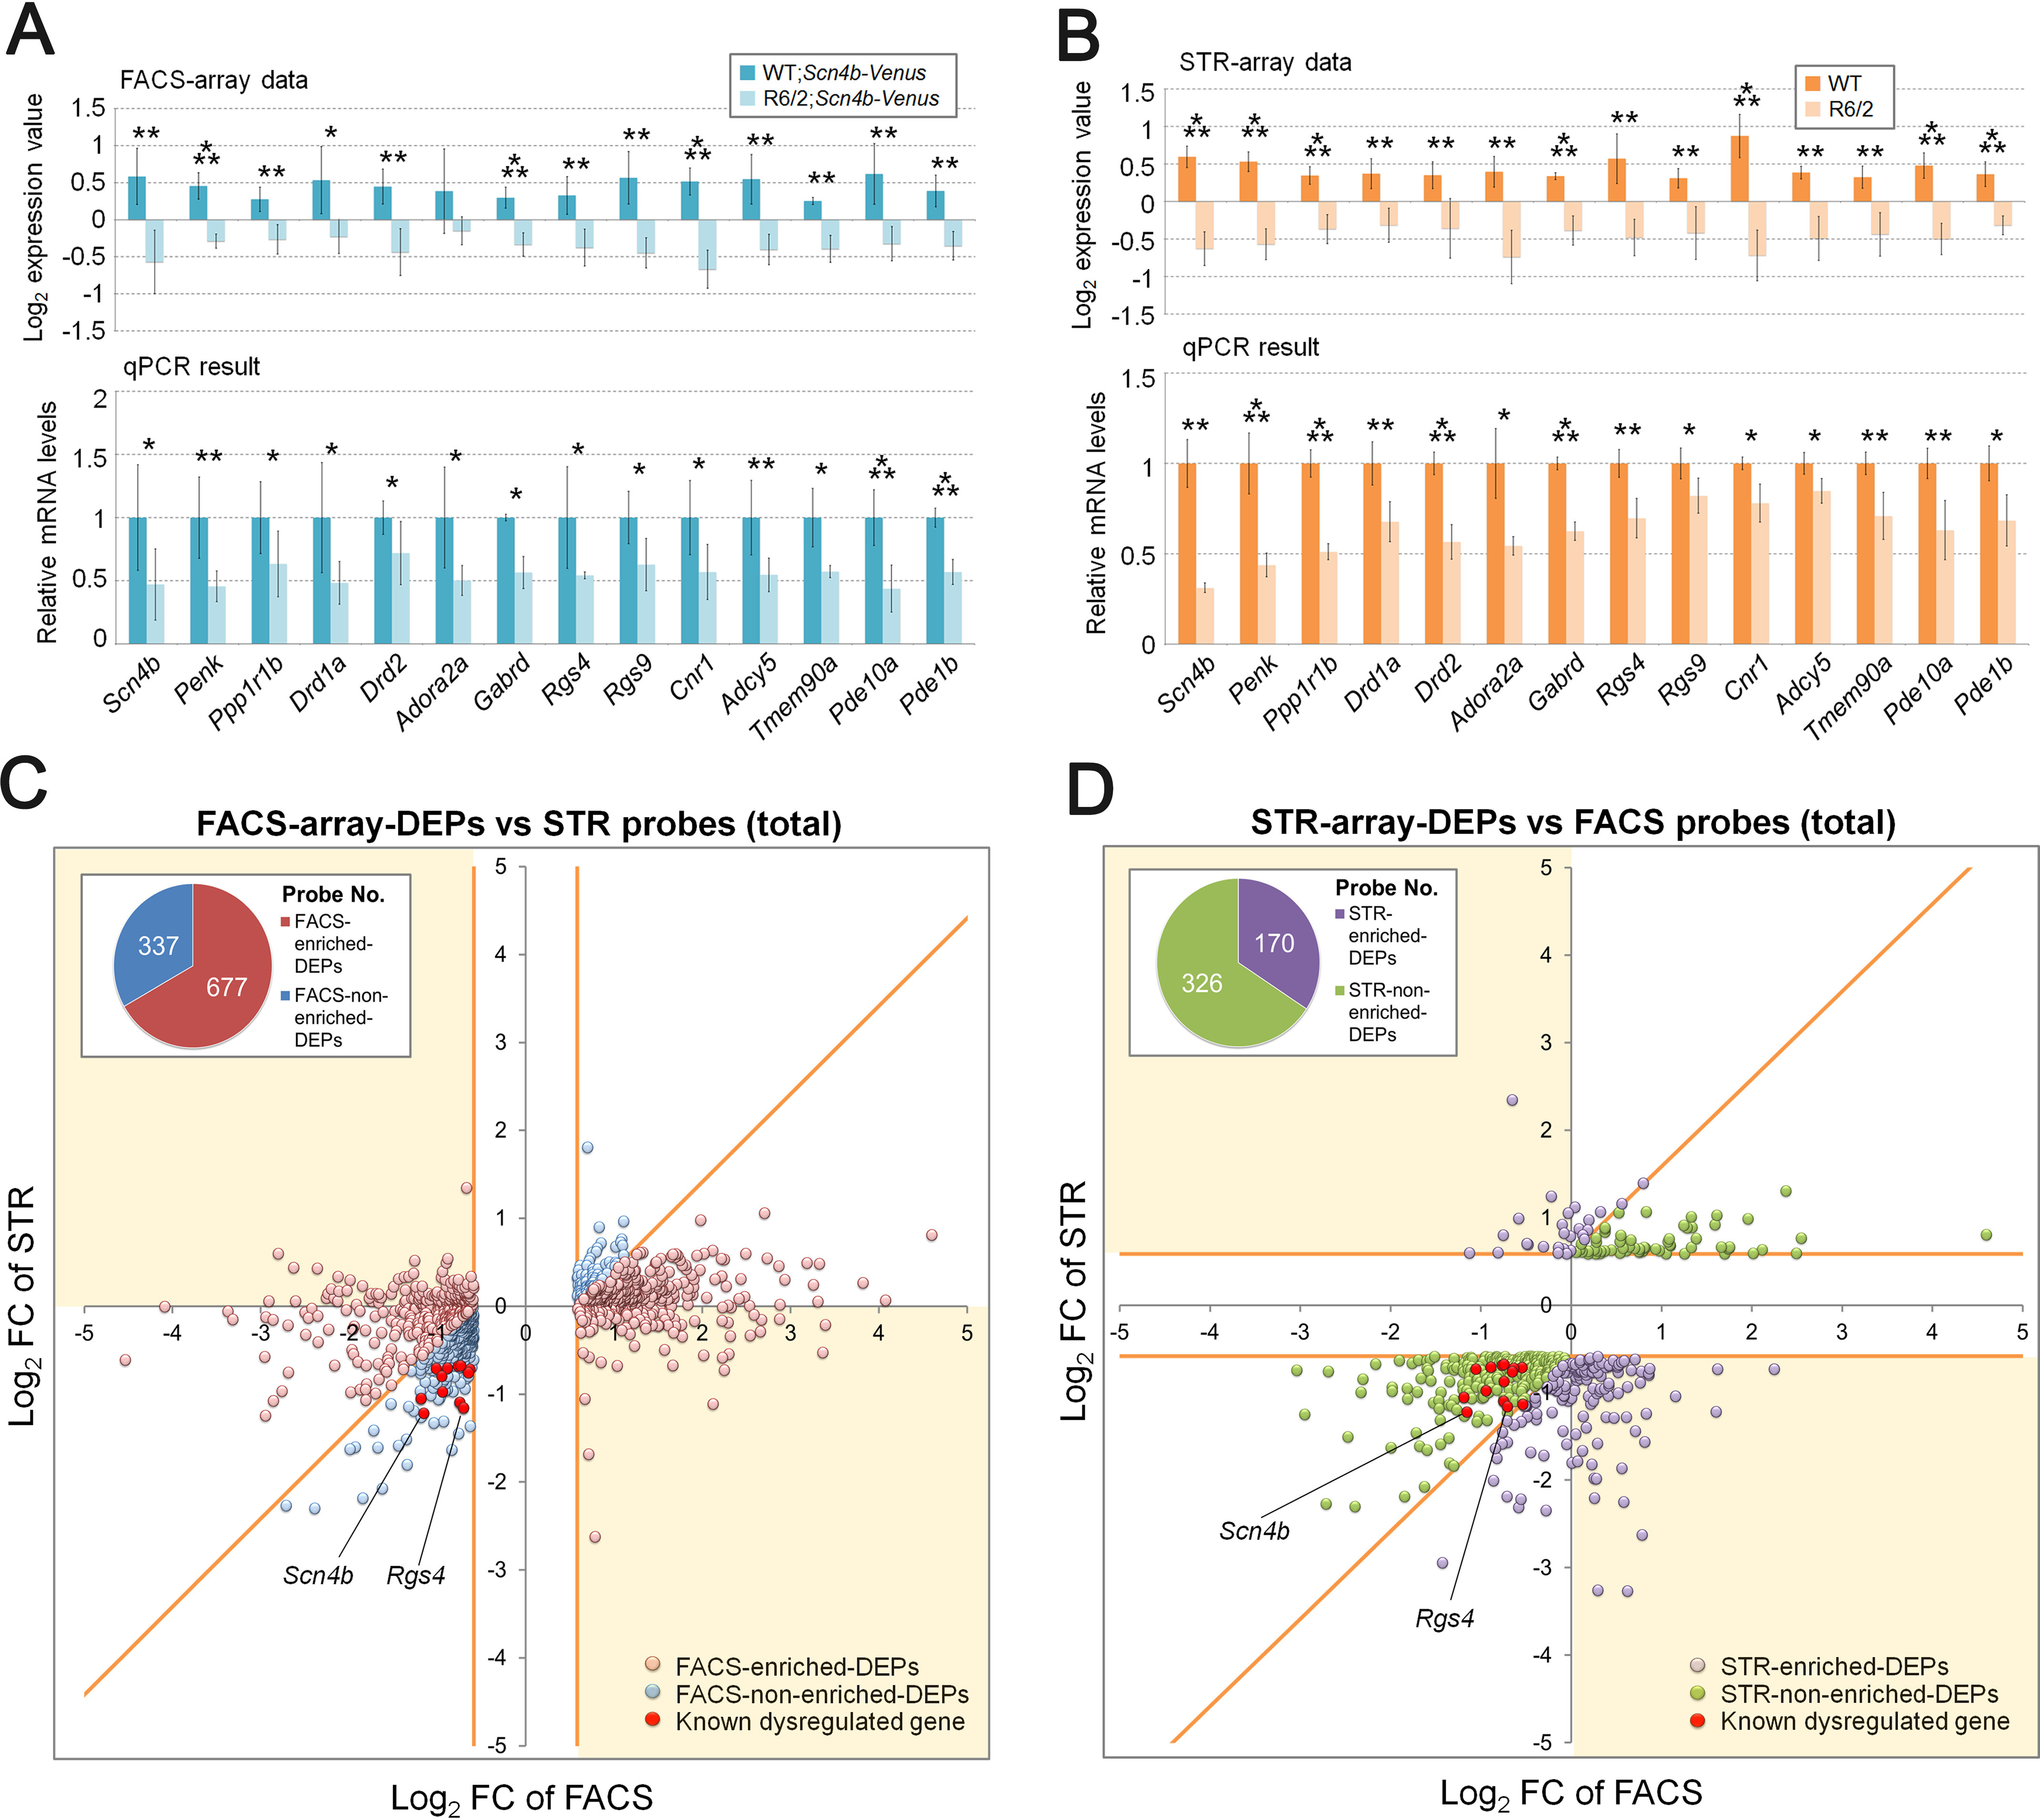
Comparison of DEPs between FACS-array and STR-array. A and B, validation of expression changes of known HD dysregulated genes in FACS-purified MSNs (A) and striatal samples (B). The top panels show normalized log2 expression value of the genes. The bottom panels show relative mRNA levels in qPCR data. Gapdh was used to normalize the gene expression data. Data are presented as mean ± S.D. (error bars) (n = 6 for WT; and R6/2;Scn4b-Venus and n = 4 for WT and R6/2). *, p < 0.05; **, p < 0.01; ***, p < 0.001, unpaired Student's t test. C, scatter plot of log2 FC value between 1,014 FACS-array DEPs (abs FC > 1.5, p < 0.05, raw signal > 100, x axis) and their corresponding probes in STR-array (y axis). FACS-array DEPs are divided into two groups, either FACS-enriched DEPs (pink dots) or FACS-nonenriched DEPs (blue dots), according to the FC ratio (FACS-FC/STR-FC > 1.5 or FACS-FC/STR-FC < 1.5, respectively). The DEPs showing opposite expression change between FACS-array and STR-array were included in FACS-enriched DEPs (yellow area). D, scatter plot of log2 FC value between 496 STR-array DEPs (abs FC > 1.5, p < 0.05, raw signal > 100, y axis) and their corresponding probes in FACS-array (x axis). STR-array DEPs are divided into two groups: either STR-enriched DEPs (purple dots) or STR-nonenriched DEPs (green dots) according to the FC ratio (STR-FC/FACS-FC > 1.5 or STR-FC/FACS-FC < 1.5, respectively). The DEPs showing opposite expression change between FACS-array and STR-array were included in STR-enriched DEPs (yellow area). C and D, border lines of two probe sets are shown by a yellow line. Red dots indicate known dysregulated genes, which are displayed in A and B (Scn4b, Penk, Ppp1r1b, Drd1a, Drd2, Adora2a, Gabrd, Rgs4, Rgs9, Cnr1, Adcy5, Tmem90a, Pde10a, and Pde1b). The pie chart indicates the number of DEPs in each probe set.
We next identified DEPs strongly detected by STR-array (STR-enriched DEPs) in the same way as the FACS-array DEPs. To extract STR-enriched DEPs, we examined the ratio of absolute FC of STR-array DEPs to corresponding probes in FACS-array (STR-FC/FACS-FC). The STR-array DEPs showing STR-FC/FACS-FC > 1.5 were selected as STR-enriched DEPs, and the STR-array DEPs showing similar FC to FACS-array (FACS-FC/STR-FC < 1.5) were selected as STR-nonenriched DEPs (Fig. S7A). The DEPs showing opposite expression change with corresponding FACS-probes (up and down or down and up) were included as STR-enriched DEPs in the same way as the FACS-enriched DEPs (Fig. S7A). We identified 170 STR-enriched DEPs (purple dots in Fig. 3D) and 326 STR-nonenriched DEPs (green dots in Fig. 3D) (Table S3). Log2 FCs of the STR-array DEPs against those of corresponding probes in FACS-array (Fig. 3D and Fig. S8B) showed that known dysregulated genes, Scn4b (FC = −2.33, p = 0.0003) and Rgs4 (FC = −2.24, p = 0.0031), were contained in STR-nonenriched DEPs (red dots in Fig. 3D). Taken together, we created four probe set from FACS- and STR-array DEPs according to enrichment of the two different arrays: FACS-enriched DEPs, FACS-nonenriched DEPs, STR-enriched DEPs, and STR-nonenriched DEPs. Because known dysregulated genes were enriched in the FACS-nonenriched DEPs, FACS-enriched DEPs could contain DEPs that are masked in commonly used profiling analyses.
To explore the biological implications for each probe set, we carried out GO enrichment analysis using DAVID 6.8 (RRID:SCR_001881), which is a web-accessible program to investigate functional associations among differentially expressed genes (27). The top 5 annotation clusters in each probe set produced by a functional annotation clustering tool are presented in Fig. 4 (genes of all clusters are listed in Table S4). Notably, FACS-enriched DEPs were associated with “regulation of transcription,” “DNA damage,” and “DNA repair,” whereas the other three probe sets were associated with neuronal functions and properties such as “ion transport,” “calcium signaling pathway,” and “synapse.” These results suggest that FACS-enriched DEPs may be more relevant to basic cellular function rather than neuronal function.
Figure 4.
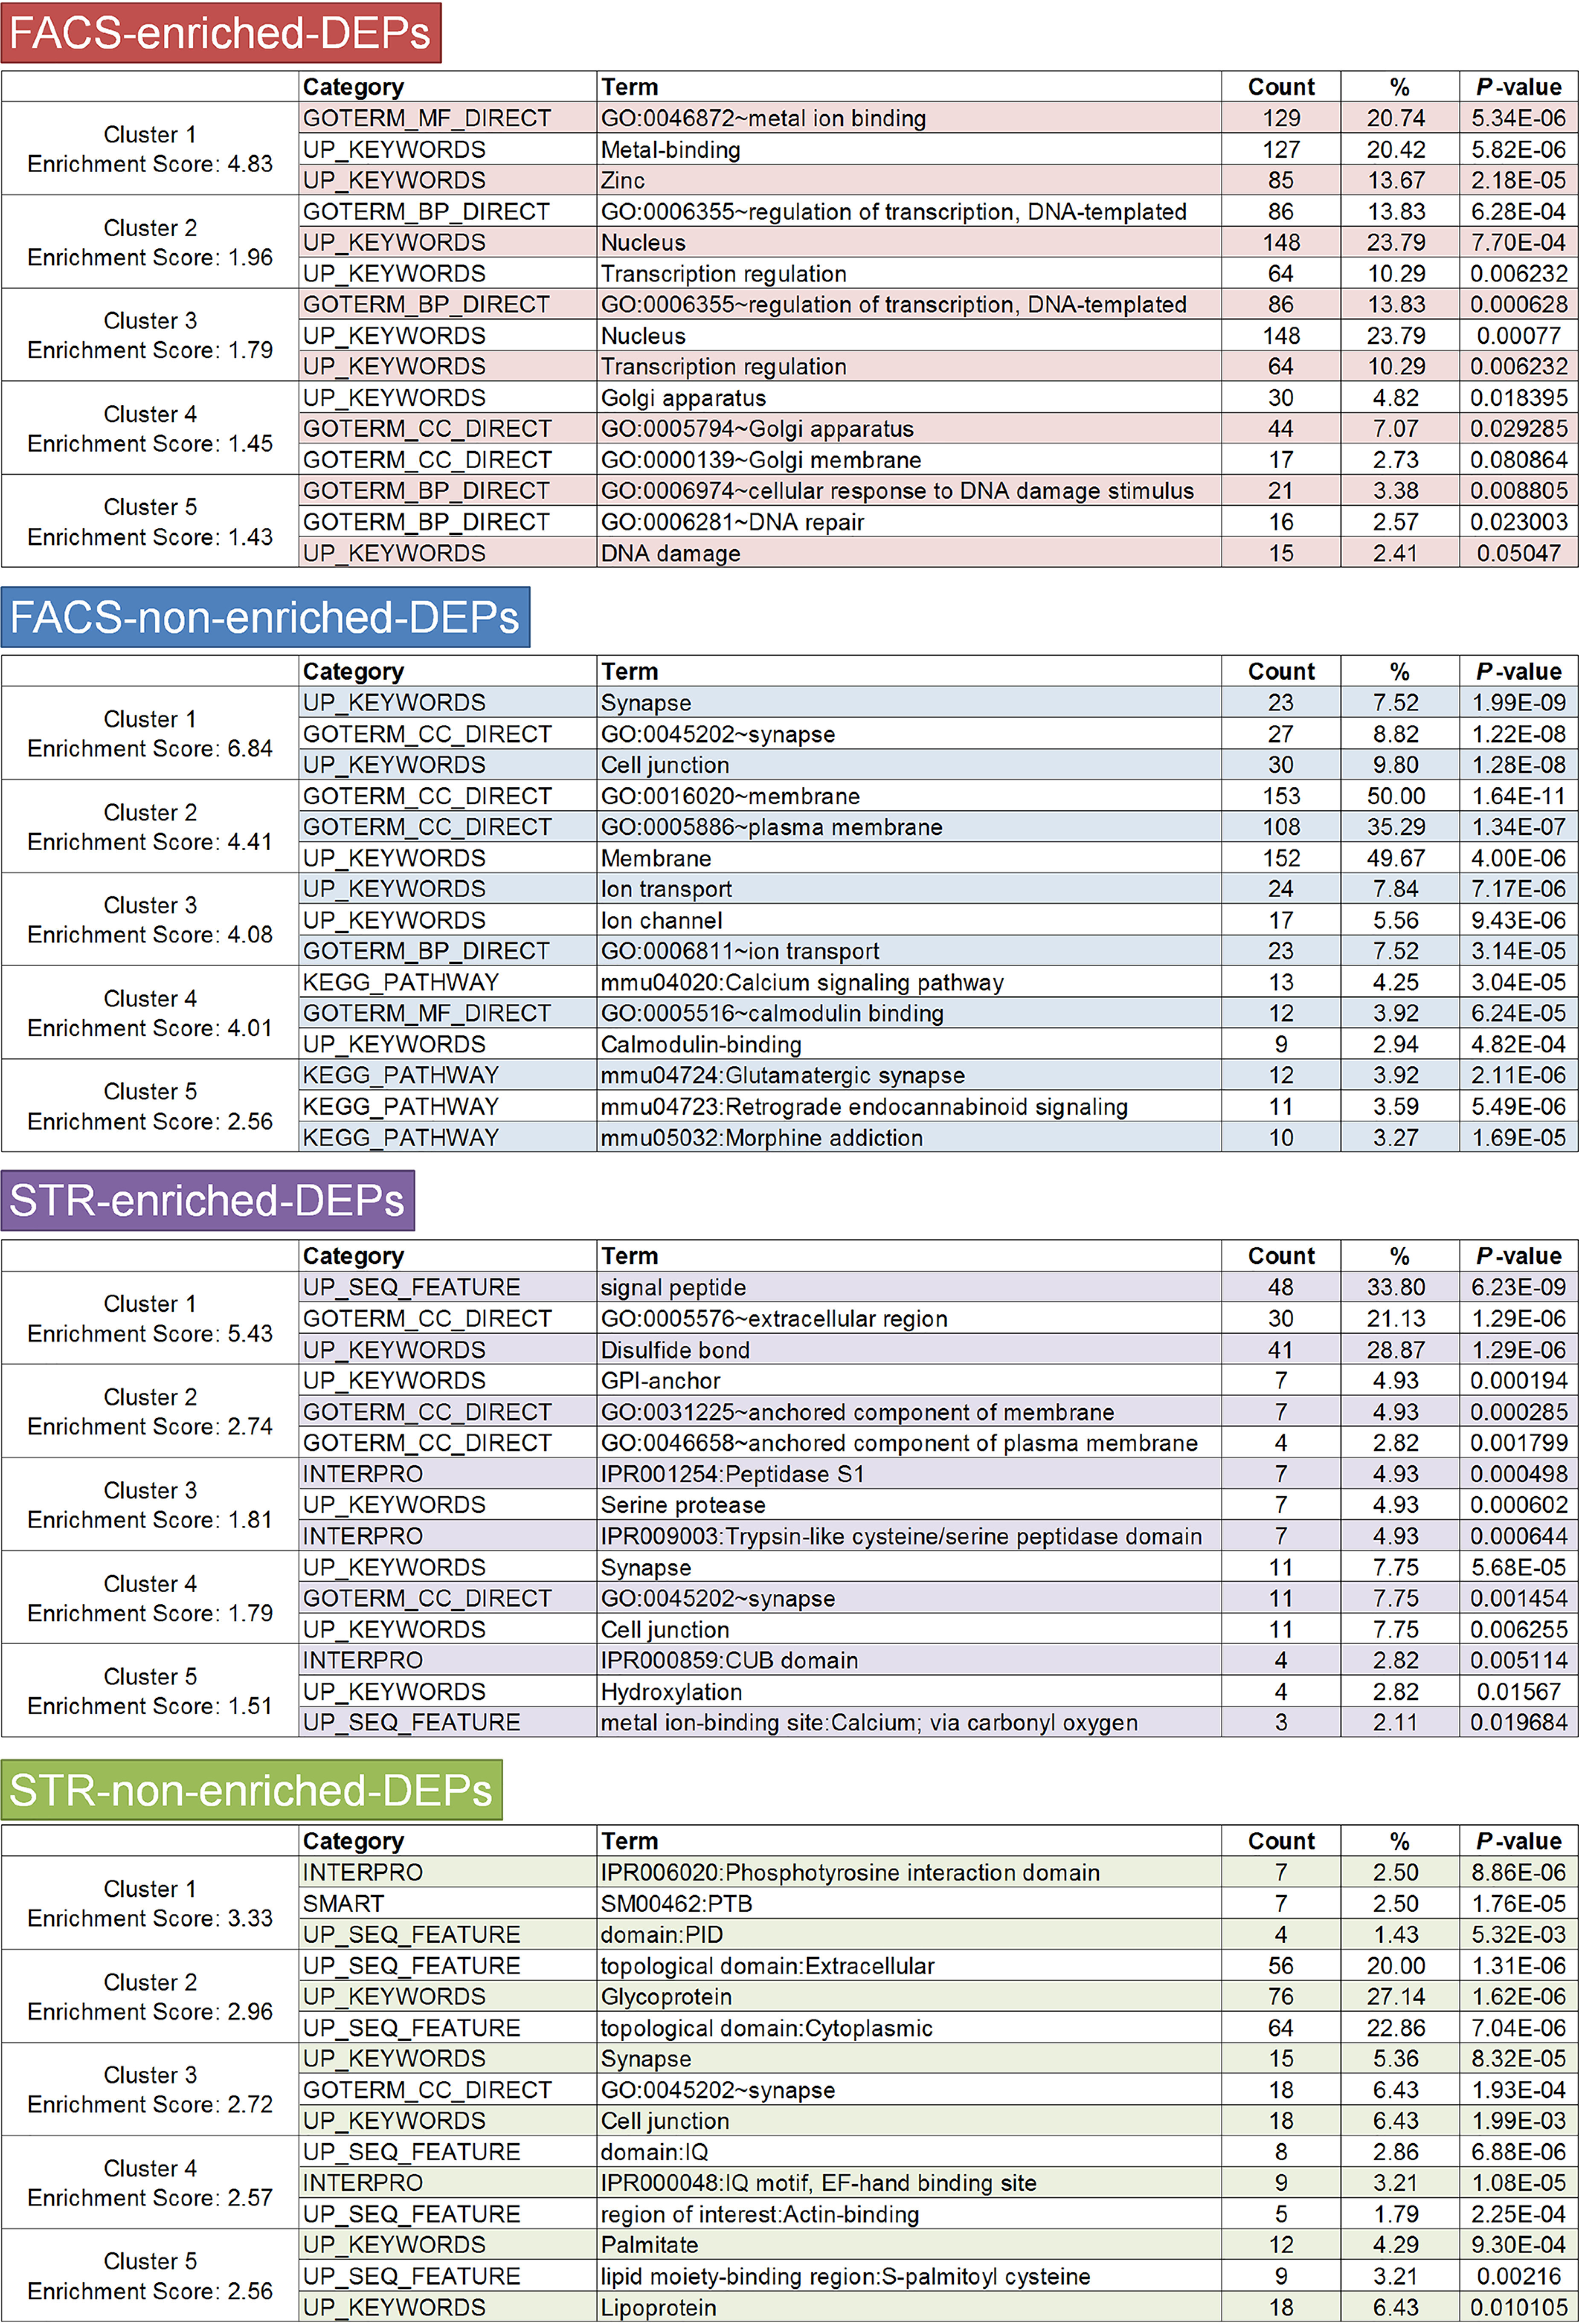
GO enrichment analysis of the probe sets of FACS- and STR-array DEPs. Significantly enriched GO terms of the top 5 clusters are displayed. Ranking is according to p value. The genes in each cluster are listed in Table S4.
Analysis of FACS-array DEGs
Next, we performed further selection using more stringent criteria, because some of the probes with low signal value (less than 500 in microarray data) were difficult to verify by qPCR (data not shown). To select more verifiable DEPs, we eliminated the probes with raw signal < 500 from the normalized FACS-array data. Then we selected DEPs with the FC and p value cut-off (absolute FC > 1.5, p < 0.01) (Fig. S7B). Furthermore, multiple probes recognizing identical genes were consolidated to carry out further analysis (regional expression pattern analysis). To consolidate multiple probes to one probe, we selected the probe showing the highest average signal value in control samples. After gene extraction, we retrieved 181 genes as FACS-array DEGs (Table S5), To find DEGs showing enrichment in the FACS-array compared with the STR-array, we examined the ratio of absolute FC of FACS-array DEGs to corresponding genes in STR-array (FACS-FC/STR-FC). The selection method was the same as that for the selection of the FACS-array DEPs. The FACS-array DEGs showing FACS-FC/STR-FC > 1.5 were selected as FACS-enriched DEGs, and the FACS-array DEGs showing similar FC to STR-array (FACS-FC/STR-FC < 1.5) were selected as FACS-nonenriched DEGs (Fig. 5A and Fig. S7B). We included FACS-array DEGs showing opposite expression change to corresponding STR-array DEG (up and down or down and up) in FACS-enriched DEGs (Fig. 5A and Fig. S7B). Among the FACS-array DEGs, 91 genes were identified as FACS-enriched DEGs and 90 genes were identified as FACS-nonenriched DEGs (Fig. 5A and Table S5).
Figure 5.
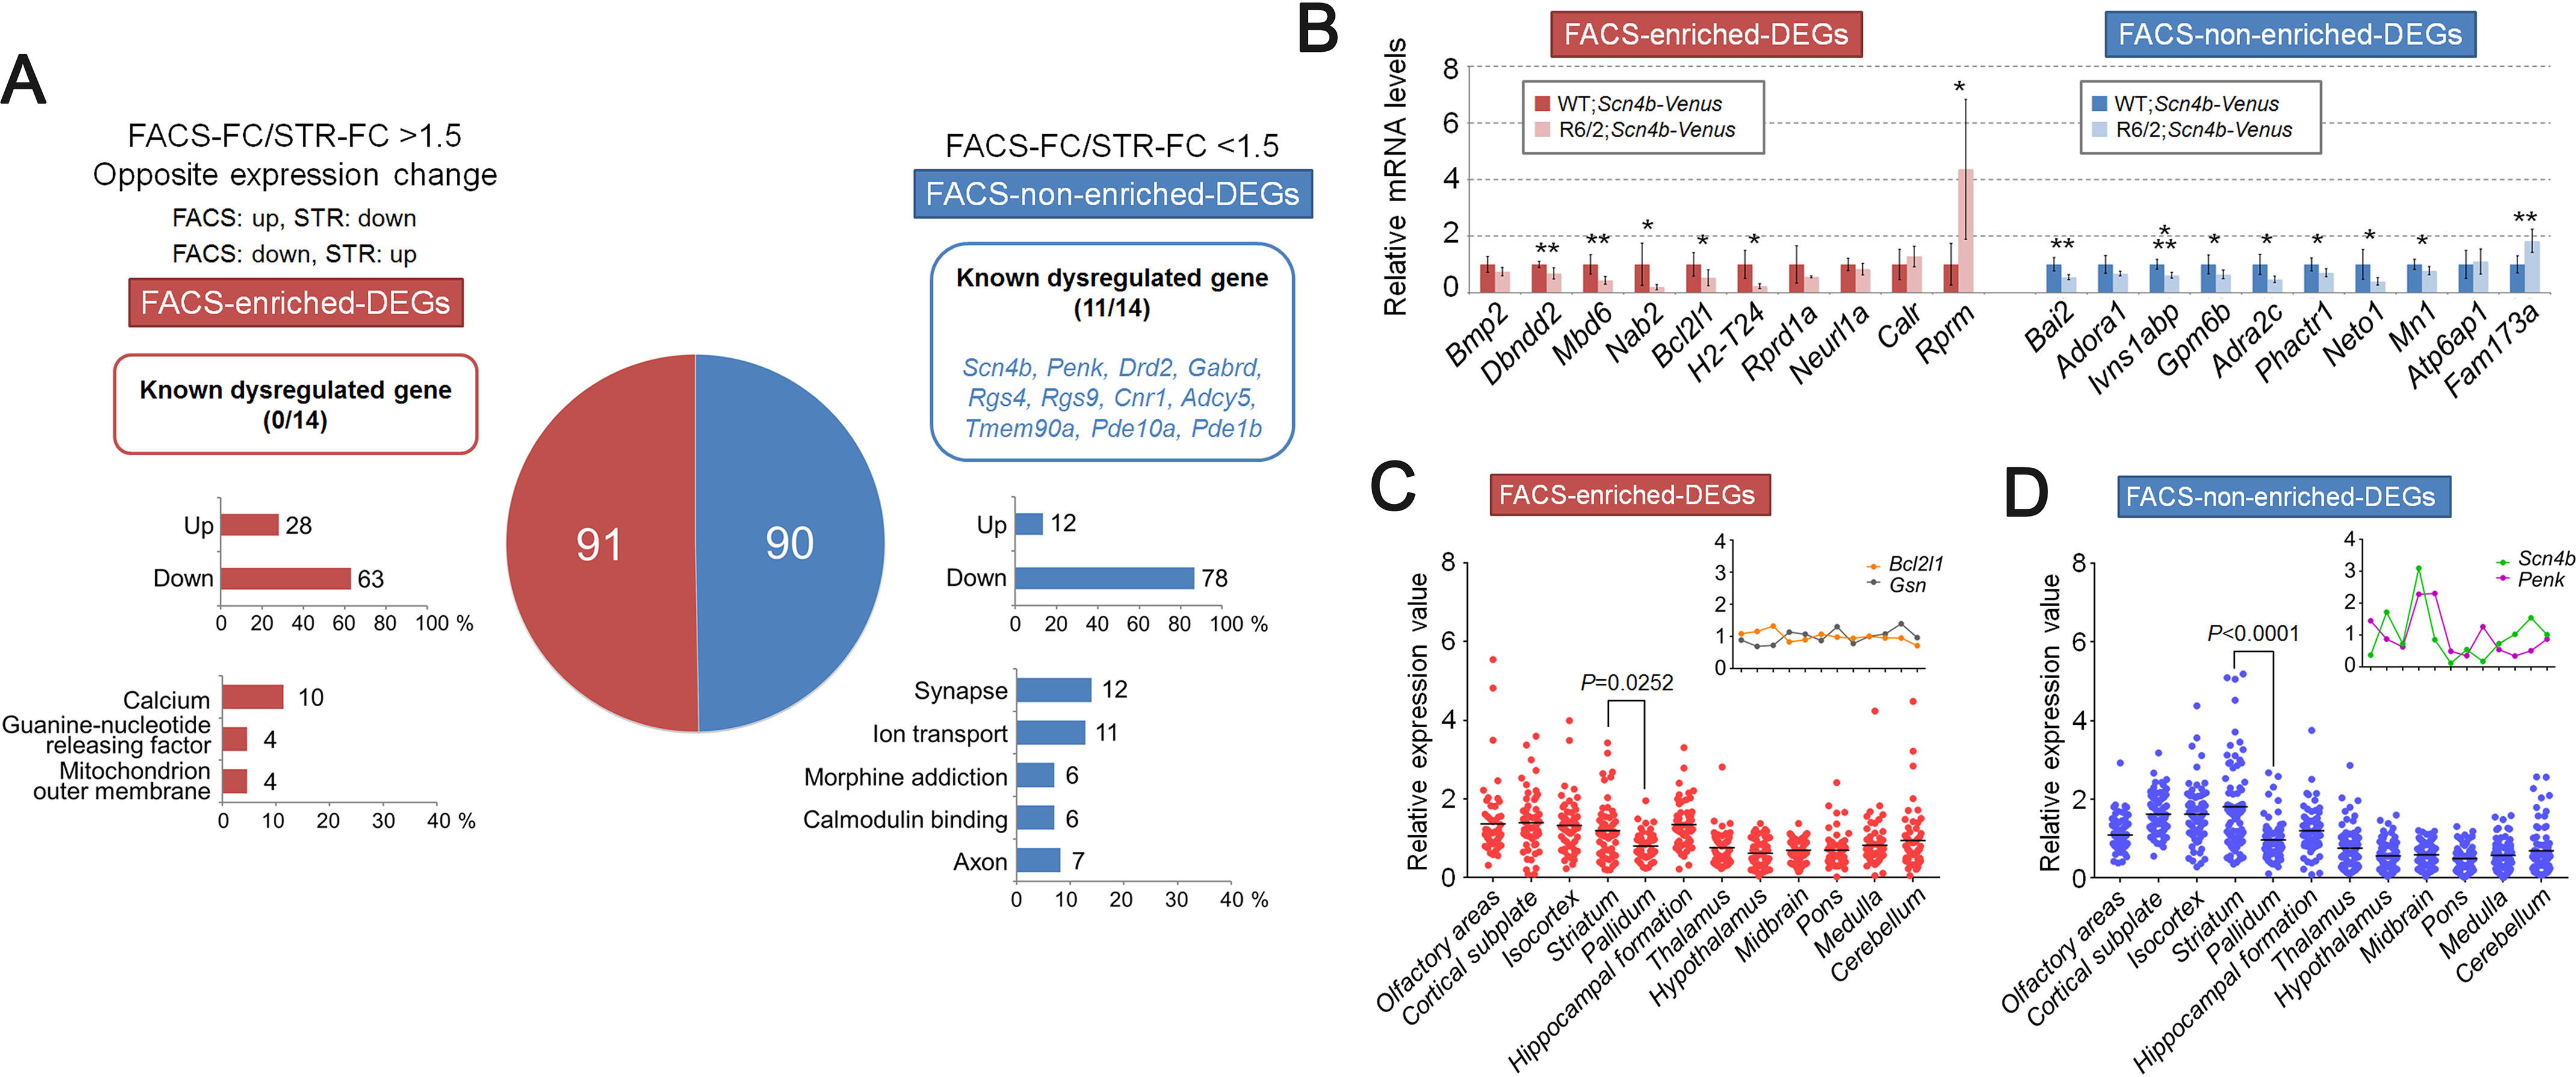
Gene expression analysis and regional expression pattern analysis of FACS-array DEGs. A, FACS-array DEGs, which are extracted from FACS-array DEPs with more stringent criteria (abs FC > 1.5, p < 0.01, raw signal > 500, 181 genes) are divided into two groups, either FACS-enriched DEGs (red) or FACS-nonenriched DEGs (blue), according to the FC ratio (FACS-FC/STR-FC > 1.5 or FACS-FC/STR-FC < 1.5, respectively). The DEGs showing opposite expression change between FACS-array and STR-array were included into FACS-enriched DEGs. The pie chart indicates the gene number of each gene set. The number and gene symbol of known dysregulated genes (Scn4b, Penk, Ppp1r1b, Drd1a, Drd2, Adora2a, Gabrd, Rgs4, Rgs9, Cnr1, Adcy5, Tmem90a, Pde10a, and Pde1b) are displayed at the top. The number and percentage of up-regulated or down-regulated genes are displayed in the middle. The number and percentage of genes annotated to enriched GO term are displayed at the bottom. B, relative mRNA levels of selected genes from FACS-array DEGs are verified by qPCR (FACS-enriched DEGs, red; FACS-nonenriched DEGs, blue). Gapdh was used to normalize the gene expression data. Data are presented as mean ± S.D. (error bars) (n = 6 for each genotype). *, p < 0.05; **, p < 0.01; ***, p < 0.001, unpaired Student's t test. C and D, regional expression pattern analysis of FACS-array DEGs in 12 brain regions of mouse. ISH expression data were obtained from the ABA (57 of 91 genes in FACS-enriched DEGs and 76 of 90 genes in FACS-nonenriched DEGs are available). Relative expressions are calculated by average expression value of 12 brain regions (raw expression value/average expression value). The inset line graph shows the typical gene expression pattern. Data are analyzed by one-way ANOVA followed by Tukey's multiple-comparison test.
We found that known dysregulated genes in HD were enriched in the FACS-nonenriched DEGs (Fig. 5A). The percentage of up-regulated genes in FACS-enriched DEGs (up, 30.77%; down, 69.23%) was slightly higher than FACS-nonenriched DEGs (up, 13.33%; down, 86.67%) (Fig. 5A). Functional annotation clustering analysis of FACS-enriched DEGs did not show the enrichment of GO terms related to basic cellular function, such as “regulation of transcription” and “DNA damage,” which were observed in the FACS-enriched DEPs. After gene extraction, the genes associated with “regulation of transcription” and “DNA damage” were eliminated, probably due to their low expression. In contrast, the terms related to neuronal functions and properties, such as “synapse,” “axon,” and “ion transport,” were preserved in FACS-nonenriched DEGs (Fig. 5A, Fig. S9, and Table S7). This result suggests that characteristics of the probe sets were partly preserved in the gene sets. Next, we verified the expression of FACS-array DEGs by qPCR. We confirmed that the expression of 14 of 20 (70%) genes in FACS-array DEGs was significantly dysregulated in R6/2 mice (Fig. 5B).
Cell type–specific gene expression profiling in human HD brain revealed that up-regulated genes in HD were more highly represented in glia than in MSNs, whereas down-regulated genes were preferentially observed in MSNs (28). This gave rise to speculation that gene expression alterations in non-MSN cells may affect the detection of DEGs in MSNs if those DEGs are expressed in both MSNs and non-MSN cells. Our FACS-array data could overcome the problem, because we used FACS-purified MSNs for the analysis. To find the DEGs, which are ubiquitously expressed in the brain, including in MSNs and non-MSN cells, we next performed regional expression pattern analysis. We obtained ISH gene expression data from the Allen Brain Atlas (ABA) (RRID:SCR_006491), a tool used to explore gene expression data from ISH in mouse, human, and nonhuman primate brain (29–31) and calculated relative expression values among 12 brain regions (Table S8). The expression of FACS-enriched DEGs was basically at the same levels among brain regions rather than enriched in the striatum (Fig. 5C). In contrast, FACS-nonenriched DEGs were strongly expressed in the striatum (Fig. 5D). Consistently, FACS-enriched DEGs showed similar expression levels between striatum and pallidum, an adjacent area that receives projections from striatum (average expression value: striatum = 1.197, pallidum = 0.805, p = 0.0252), whereas FACS-nonenriched DEGs showed much higher expression in striatum than pallidum (average expression value: striatum = 1.811, pallidum = 0.968, p < 0.0001) (Fig. 5, C and D). A heatmap of relative expression values also showed that expression of FACS-nonenriched DEGs tended to be enriched in the striatum with high S.D. values compared with FACS-enriched DEGs (Fig. S10 and Table S9). These results suggest that FACS-enriched DEGs contained genes that were ubiquitously expressed in the brain rather than specifically expressed in the striatum. It is possible that those FACS-enriched DEGs were expressed in not only MSNs but also other cell types. Furthermore, those FACS-enriched DEGs could be masked in the STR-array by the changes of their expression in non-MSN cells.
Analysis of STR-array DEGs
Next, to analyze STR-enriched DEGs in the same way as the FACS-enriched DEGs, we also extracted STR-array DEGs. To select more verifiable DEPs, we selected DEPs showing higher raw signal (>500) and then selected DEPs using the FC and p value cut-off (absolute FC > 1.5, p < 0.01) (Fig. S7B). Furthermore, multiple probes recognizing identical genes were consolidated, as with the FACS-array DEGs. We retrieved 181 STR-array DEGs with those criteria (Fig. 6A and Table S6). Among the STR-array DEGs, 46 genes were identified as STR-enriched DEGs, and 135 genes were identified as STR-nonenriched DEGs (Fig. 6A and Table S6). We found that known dysregulated genes were mostly contained in the STR-nonenriched DEGs, and the percentages of down-regulated genes in STR-enriched DEGs (up, 13.04%; down, 86.96%) and STR-nonenriched DEGs (up, 10.37%; down, 89.63%) were much higher than those for up-regulated genes (Fig. 6A). GO enrichment analysis showed that both STR-enriched DEGs and STR-nonenriched DEGs were associated with neuronal function and properties (e.g. “signal,” “negative regulation of signal transduction,” “dendrite,” “neural cell body,” and “synapse”) (Fig. 6A, Fig. S9, and Table S7). These results are consistent with the results of STR-array DEPs, suggesting that a major component of the gene set was retrieved in STR-array DEGs. Next, we verified the expression of STR-array DEGs by qPCR. We confirmed that the expression of 9 of 10 genes (90%) in STR-array DEGs was significantly dysregulated in R6/2 mice (Fig. 6B).
Figure 6.
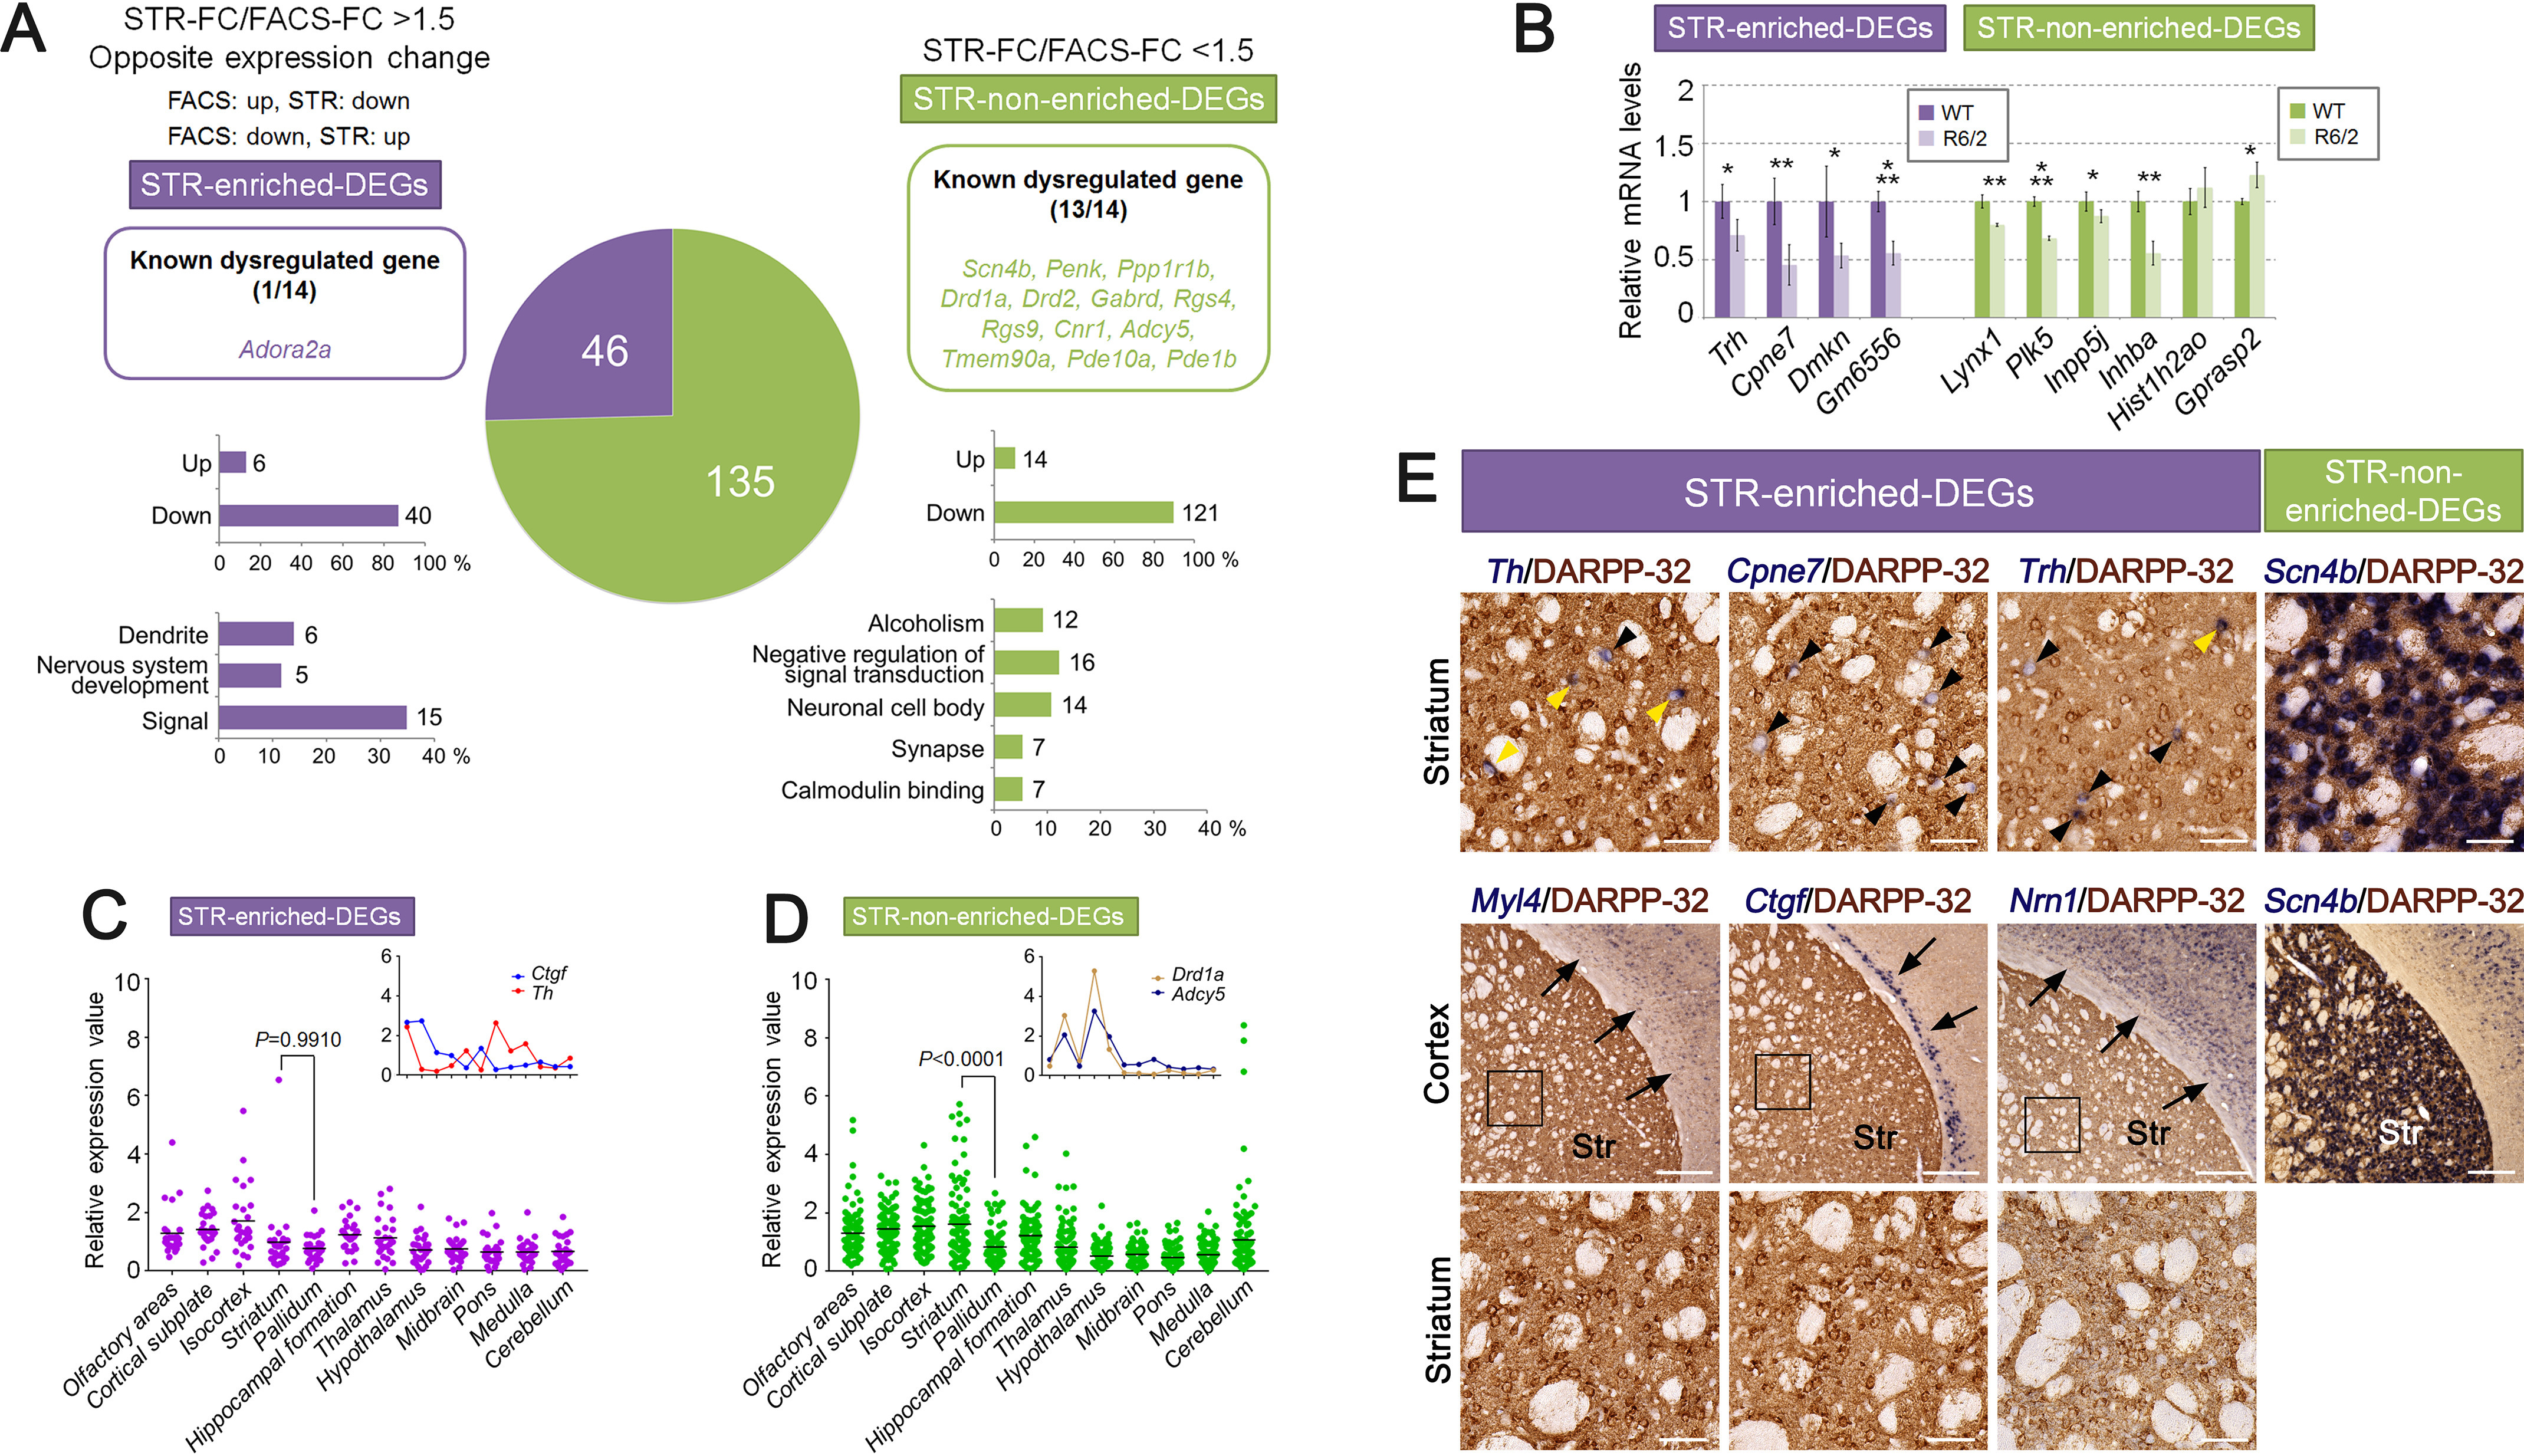
Gene expression analysis and regional expression pattern analysis of STR-array DEGs. A, STR-array DEGs, which are extracted from STR-array DEPs with more stringent criteria (abs FC > 1.5, p < 0.01, raw signal > 500, 181 genes), are divided into two groups, either STR-enriched DEGs (purple) or STR-nonenriched DEGs (green), according to the FC ratio (STR-FC/FACS-FC > 1.5 or STR-FC/FACS-FC < 1.5, respectively). The DEGs showing opposite expression change between FACS-array and STR-array were included into STR-enriched DEGs. The pie chart indicates gene number of each gene set. The number and gene symbol of known dysregulated genes (Scn4b, Penk, Ppp1r1b, Drd1a, Drd2, Adora2a, Gabrd, Rgs4, Rgs9, Cnr1, Adcy5, Tmem90a, Pde10a, and Pde1b) are displayed at the top. The number and percentage of up-regulated or down-regulated genes are displayed in the middle. The number and percentage of genes annotated to enriched GO terms are displayed at the bottom. B, relative mRNA levels of selected genes from STR-array DEGs were verified by qPCR (STR-enriched DEGs, purple; STR-nonenriched DEGs, green). Gapdh was used to normalize the gene expression data. Data are presented as mean ± S.D. (error bars) (n = 4 for each genotypes). *, p < 0.05; **, p < 0.01; ***, p < 0.001, unpaired Student's t test. C and D, regional expression pattern analysis of STR-array DEGs in 12 brain regions of mouse. ISH expression data were obtained from the ABA (27 of 46 genes in STR-enriched DEGs and 101 of 135 genes in STR-nonenriched DEGs are available). Relative expression values were calculated by average expression value of 12 brain regions (raw expression value/average expression value). The inset line graph displays the typical gene expression pattern. Data were analyzed by one-way ANOVA followed by Tukey's multiple-comparison test. E, images for dual ISH-IHC staining in coronal brain sections from 8-week-old mice. Antisense RNA probes of STR-enriched DEGs (Th, Cpne7, Trh, Myl4, Ctgf, Nrn1) and STR-nonenriched DEGs (Scn4b) were used for ISH (blue). Anti-DARPP-32 was used for IHC (brown). Black arrowheads, single-ISH-labeled cells. Yellow arrowheads, double-labeled MSNs. Arrows, ISH signals in the cortex region. The bottom panels show higher magnification of the boxed areas in the middle panels. Scale bar, 100 μm (E, top and bottom panels) and 300 μm (E, middle panels). Str, striatum.
Regional expression pattern analysis showed that the expression levels of STR-enriched DEGs were mostly the same among brain regions. In contrast, STR-nonenriched DEGs were strongly expressed in the striatum (Fig. 6, C and D). Consistently, STR-enriched DEGs showed similar expression levels between striatum and pallidum (average expression value: striatum = 0.988, pallidum = 0.770, p = 0.9910) (Fig. 6C), whereas the expression of STR-nonenriched DEGs was enriched in the striatum (average expression value: striatum = 1.615, pallidum = 0.833, p < 0.0001) (Fig. 6D). Consistent results were also obtained from the heatmap of relative expression values: the expression of STR-nonenriched DEGs tended to be enriched in the striatum compared with STR-enriched DEGs (Fig. S10 and Table S9).
Next, we examined the distribution of STR-enriched DEGs, which showed enhanced detection in STR-array. Because the expression of STR-enriched DEGs was not enriched in the striatum, we expected those genes could be expressed in non-MSN cells, the same as the FACS-enriched DEGs. To examine this possibility, we performed dual ISH and immunohistochemistry (IHC) staining using ISH probes of STR-enriched DEGs and anti-DARPP-32, which is a marker of MSNs. We selected Th, Cpne7, Trh, Myl4, Ctgf, and Nrn1 for ISH probes because they showed lower expression in the striatum compared with Scn4b, which is an MSN-enriched gene belonging to STR-nonenriched DEGs (Fig. S11). The result of dual ISH-IHC staining showed that Th, Cpne7, and Trh were expressed in a few DARPP-32–positive MSNs but were mainly expressed in other striatal cells (Fig. 6E). On the other hand, Myl4, Ctgf, and Nrn1 were distributed in cortical cells (Fig. 6E). Furthermore, the expression pattern of those genes was distinct from Scn4b (Fig. 6E). These results suggest that a portion of STR-enriched DEGs were mostly unexpressed in the striatal MSNs.
Transcriptional regulators and apoptosis-related gene in the FACS-array DEGs
GO enrichment analysis showed that FACS-enriched DEPs were associated with “regulation of transcription” and “DNA damage” (Fig. 4). Thus, we next focused on the genes related to transcriptional regulation and DNA damage in FACS-array DEGs. In addition, because DNA damage links to apoptosis and neurodegeneration (32, 33), we also focused on the genes related to apoptosis.
We identified Nfya (FC = 4.650, p = 0.0096), Etv4 (FC = 1.562, p = 0.0093), Nacc1 (FC = −1.700, p = 0.0036), Per1 (FC = −1.592, p = 0.0035), Arid2 (FC = −1.887, p = 0.0054), Nab2 (FC = −2.159, p = 0.0097), Bmp2 (FC = −3.914, p = 1.19E−05), and Mbd6 (FC = −1.796, p = 0.0096) as transcriptional regulators in FACS-array DEGs (Fig. 7A and Table S4). NF-YA encoded by the Nfya gene is a component of the NF-Y transcription factor and known as an mHTT-interacting protein (6). It has been reported that NF-Y binds to a promoter region of HSP70 and affects the promoter activity (6). In the brain of R6/2 mice, NF-Y was sequestered into mHTT aggregates, the protein levels of NF-Y were decreased, and NF-Y binding to the HSP70 promoter region was reduced (6). Because HSP70 can refold mHTT aggregates, reduction of NF-YA could affect HD pathogenesis (6). The FACS-array data showed that the expression levels of Nfya were dramatically up-regulated in R6/2 MSNs (Fig. 7A). This suggests that increased expression of Nfya could be a compensatory response to a decrease of NF-YA. Furthermore, we identified Gsn (FC = −3.778, p = 0.0030), Bcl2l1 (FC = −1.513, p = 0.0099), Arel1 (FC = −2.134, p = 0.0016), Ucp2 (FC = −3.181, p = 0.0021), Hrk (FC = −2.874, p = 0.0030), Pdpk1 (FC = −1.568, p = 0.0049), and Bcr (FC = −1.678, p = 0.0043) as the genes associated with apoptotic response in FACS-array DEGs (Fig. 7B). BCL2L1/Bcl-xL protein encoded by the Bcl2l1 gene is known as an anti-apoptotic protein belonging to the Bcl-2 family localized to the mitochondrial outer membrane. It has been reported that PCR array profiling data using postmortem neostriatal tissue revealed that Bcl2l1 is up-regulated in HD (34). However, our qPCR result showed the opposite result, that Bcl2l1 expression was significantly down-regulated in MSNs of R6/2 at 4 weeks (Fig. 5B). This finding suggests that gene expression alteration of apoptosis-related genes at an early disease stage may be distinct from late stage. In addition, we found two other genes related to the mitochondrial cell death pathway. Hrk is a BCL2L1/Bcl-xL-binding protein belonging to BH3–only proteins and promotes apoptosis when it is overexpressed (35). Ucp2, a mitochondrial membrane protein, has a neuroprotective effect through reducing reactive oxygen species (36). Gsn, Arel1, Pdpk1, and Bcr are also related to apoptosis, but their apoptotic cascade is unclear (37–40). Those genes have not been identified by a common profiling assay using whole striatal samples, suggesting that they were masked in the assay. Next, to identify potential apoptosis mediators, FACS-array DEGs were compared with the transcriptome data of citrinin-induced apoptotic cells (41). Citrinin is known to induce apoptosis via a mitochondria-mediated apoptotic pathway (42). Interestingly, citrinin induced apoptosis-related genes implicated in DNA damage, DNA repair, and transcriptional regulation (41). Overlapping genes between FACS-array DEGs and citrinin-induced apoptosis-related genes are displayed in Fig. 7C. Remarkably, higher FC and lower p values were shown in FACS-array DEGs compared with corresponding genes of STR-array data (Fig. 7, A–C), suggesting that those DEGs were more detectable in FACS-array than in STR-array. Regional expression pattern analysis revealed that those identified transcriptional regulators and known apoptosis-related genes basically showed similar expression levels among the mouse brain regions and did not show enriched expression in the striatum (Fig. 7, D and E). Overall, these results suggest that FACS-array analysis using an MSN-enriched fraction of R6/2 mice detected DEGs in the MSNs, which have not been identified by a common profiling assay. That was a methodological advantage of this assay.
Figure 7.
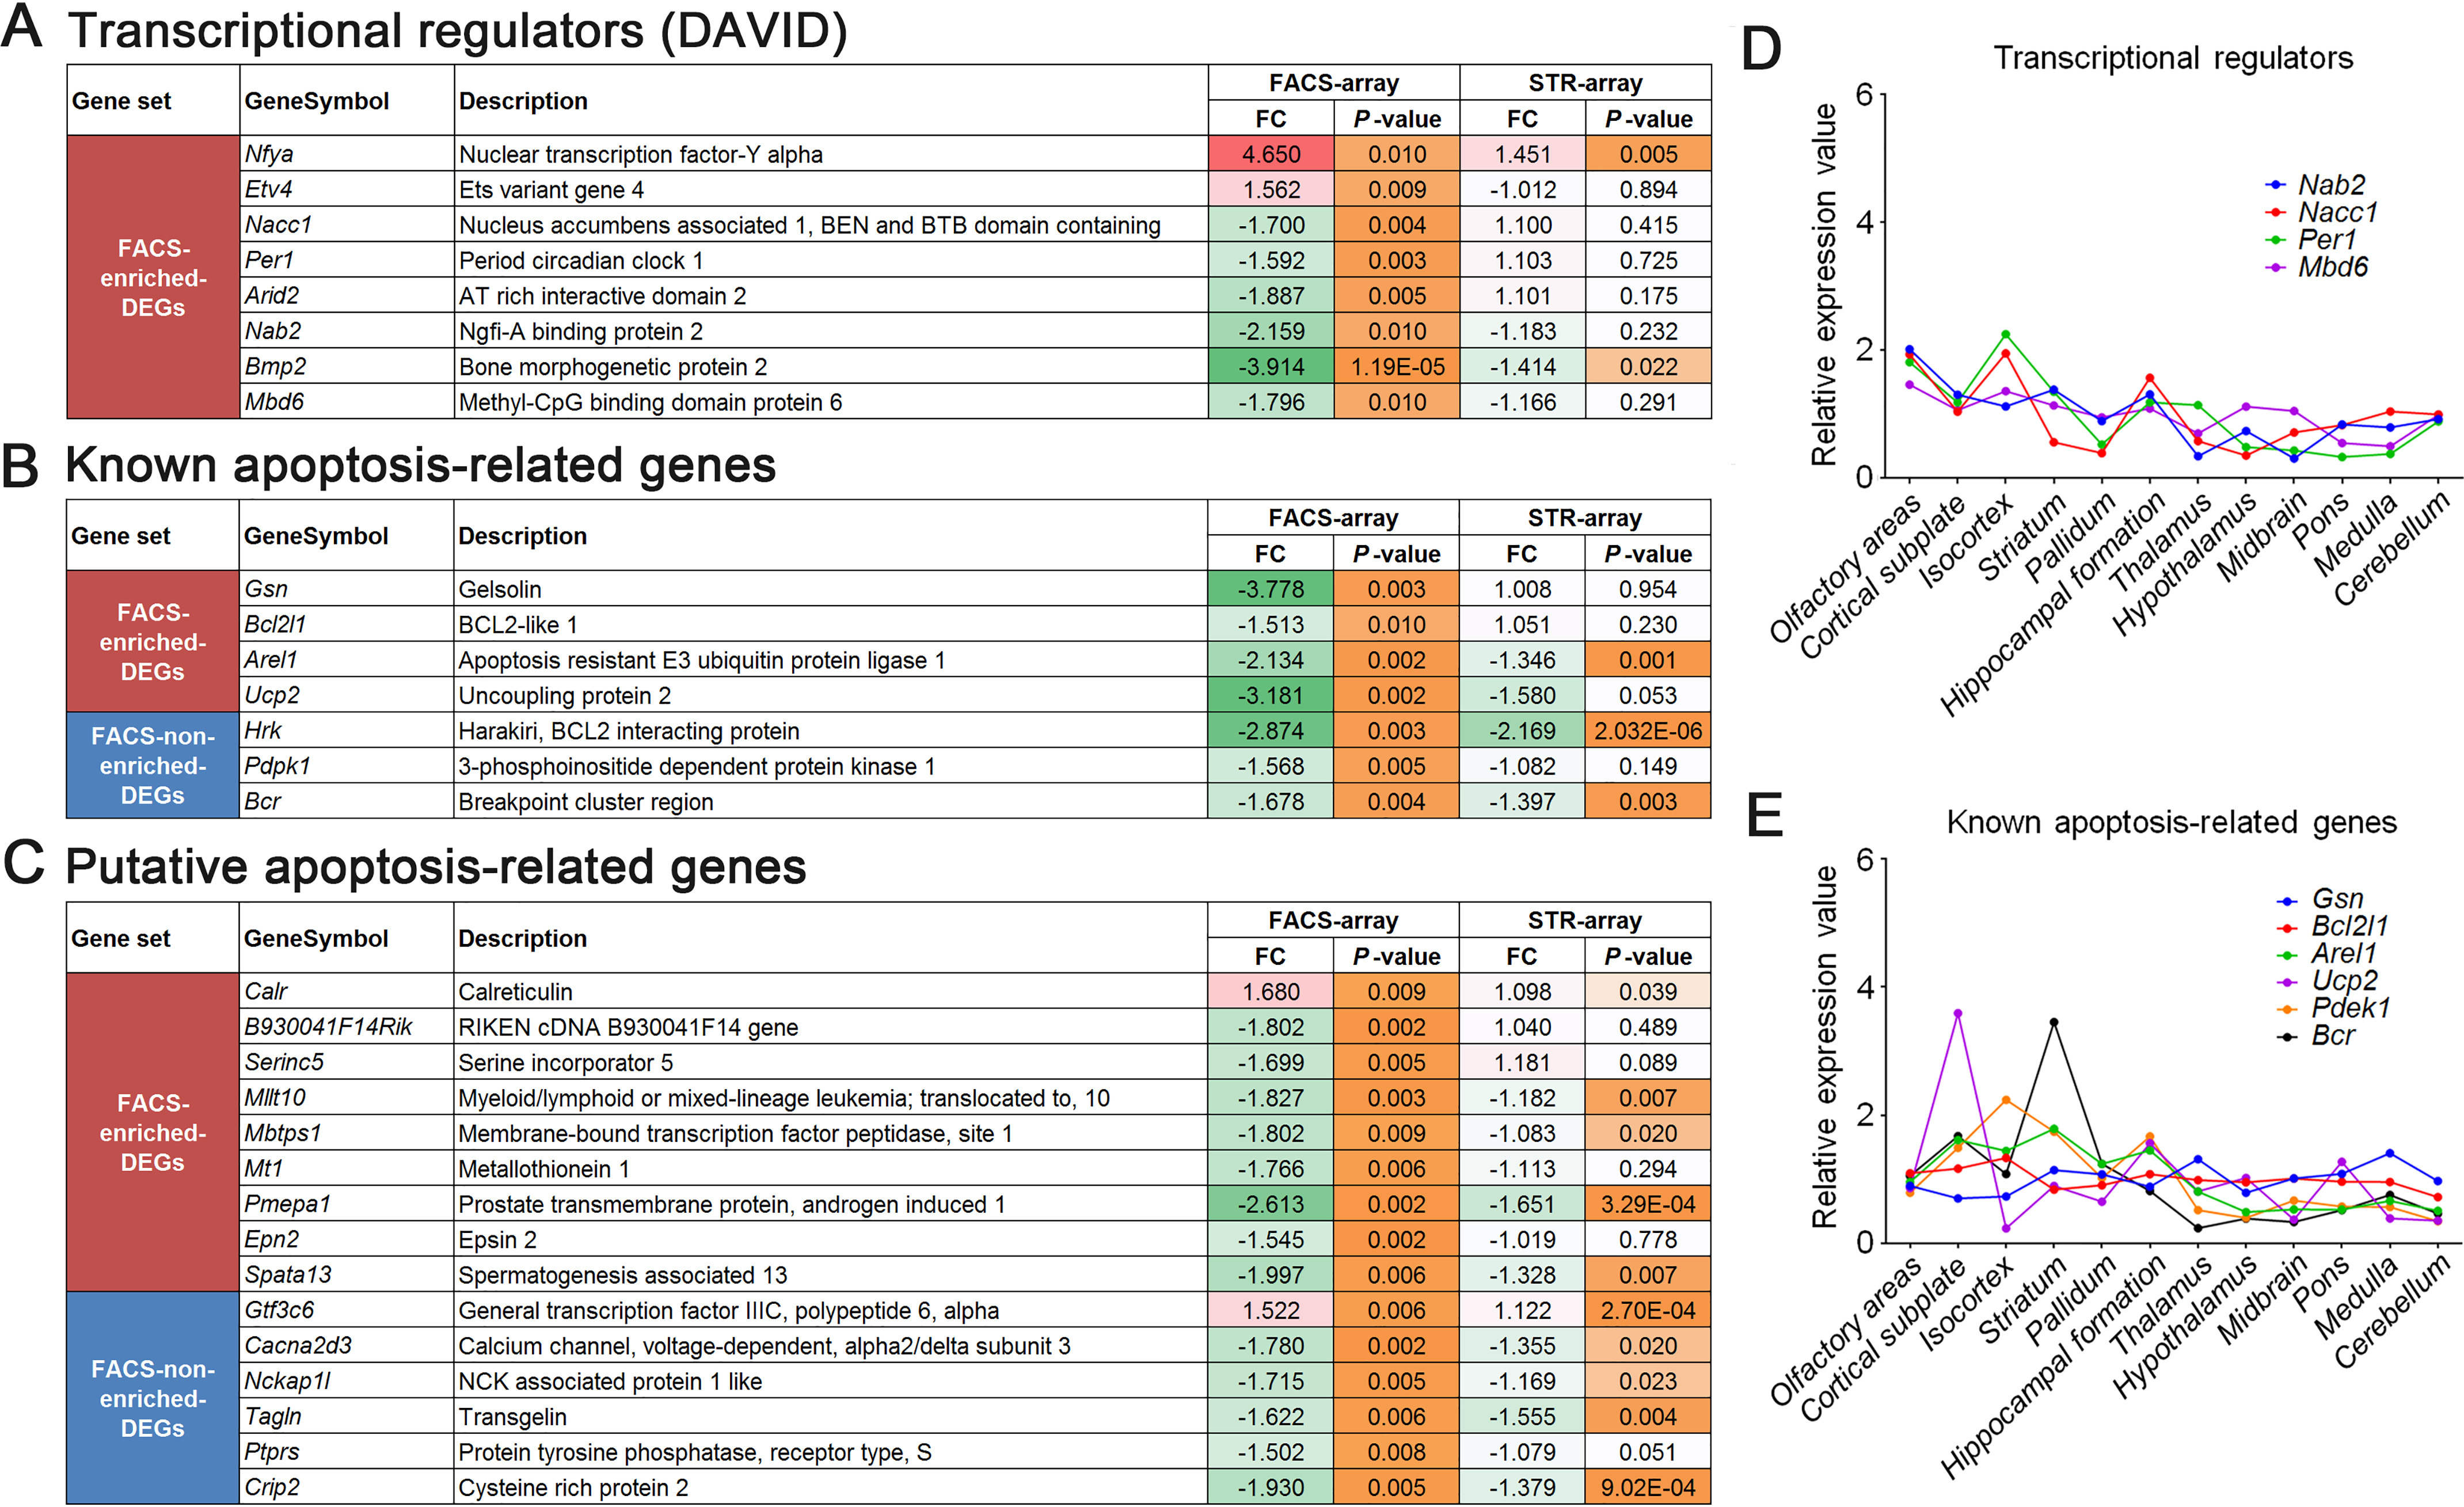
Transcriptional regulators and apoptosis-related genes in the FACS-array DEGs. A–C, transcriptional regulators (A), known apoptosis-related genes (B), and putative apoptosis-related genes (C) in FACS-array DEGs are displayed. The genes listed in C are overlapped with citrinin-induced apoptosis-related genes (41). FC values and p values of those genes are compared between FACS-array (left columns) and STR-array (right columns). The color range from white to red indicates low to high FC value of up-regulated gene, respectively. The color range from white to green indicates low to high FC value of down-regulated gene, respectively. The color range from white to orange indicates high to low p value, respectively. D and E, regional expression pattern analysis of transcriptional regulators (D) and known apoptosis-related genes (E) in 12 brain regions of mouse. ISH data of 4 of 8 genes in transcriptional regulators (A) and 6 of 7 genes in known apoptosis-related genes (B) were obtained from ABA and used for the analysis.
In addition, we identified 34 disease-causative genes in FACS-array DEGs analyzed by OMIM, which is a catalog of human genes and genetic disorders (RRID:SCR_006437) (Fig. S12). According to OMIM, 17 of the 34 genes are associated with neurological disorders, such as dyskinesia, spinocerebellar ataxia, Alzheimer's disease, and frontotemporal lobar degeneration. This result suggests that common pathogenic genes or pathways could exist among neurological disorders.
Comparative analysis between FACS-array DEPs and HD-modified genes
A recent gene expression profiling study showed distinct gene expression patterns between striatal MSNs (Drd1a and Drd2 subtypes) and glial cells in symptomatic R6/1 HD mice and HD brain (28). Both results show that down-regulated genes were enriched in the MSNs, and in contrast, up-regulated genes were enriched in the glial cells. This finding strongly suggests that pathogenic changes of gene expression are distinct in each cell type. To gain further information from our data, we compared the FACS-array DEPs with the data of up- and down-regulated genes in the striatal MSNs (HD-MSN-DEGs) and glial cells (HD-glia-DEGs) in HD brain (9, 28). As described in the previous report, down-regulated genes were enriched in the MSNs rather than glial cells (MSN-down, 329 genes; glia-down, 99 genes), whereas the opposite pattern was observed in up-regulated genes (MSN-up, 63 genes; glia-up, 369 genes) (Fig. S13A). Comparative analysis showed that HD-MSN-DEGs were highly represented in FACS-nonenriched DEGs (HD-MSN-DEGs, 45 genes (13.31%); HD-glia-DEGs, 7 genes (2.07%)) (Fig. S13B). In contrast, HD-glia-DEGs were enriched in FACS-enriched DEGs, although the expression data were obtained from purified MSNs (HD-MSN-DEGs, 9 genes (1.33%); HD-glia-DEGs, 23 genes (3.40%)) (Fig. S13B). We speculated that those HD-glia-DEGs may be expressed in MSNs as well as glial cells. To confirm this, we examined distribution of those HD-glia-DEGs in WT mouse brain using ABA. As expected, ISH data of HD-glia-DEGs overlapped with FACS-enriched DEPs clearly showed that those genes were expressed in both MSNs and glial cells (Fig. S13C). Importantly, some of those genes represented lower expression in the MSNs than glial cells (e.g. Plekhh1, Camk2d, Dlgap1, Tmem25, and Cdk14). This result suggests that those genes were mainly expressed in glial cells but also expressed in MSNs with low expression. FC values of those FACS-enriched DEPs and corresponding probes in STR-array revealed that expression levels of those genes were generally unchanged in STR-array. In contrast, much higher FC values were observed in FACS-array (Fig. S13D). This suggests that gene expression in glial cells affected the transcriptomic data and elimination of glial cells by FACS improved the detection of DEGs with low expression in MSNs.
Transcriptomic HD data related to CAG repeat length was reported recently by Langfelder et al. (43). They performed weighted gene co-expression network analysis using gene expression profiling data of HD knock-in mice with different CAG repeat length (Q20, Q80, Q92, Q111, Q140, and Q175), different age (2, 6, and 10 months), and different sample (striatum, cortex, and liver). Then they created 13 striatal and 5 cortical modules that highly correlated with CAG length and age. The striatal modules and their functional annotations are shown in Fig. S14. First, we focused on striatal module M2, which implicates cAMP signaling, postsynaptic density proteins, and striatal marker genes. This module could be similar to FACS-nonenriched DEPs/DEGs, because FACS-nonenriched DEGs represented many striatal-enriched genes (Fig. 5D). As expected, striatal module M2 also contained many striatal-enriched genes (e.g. Ppp1r1b, Scn4b, Adcy5, Arpp21, Pde1b, and Pde10a) and MSN subtype markers (e.g. Drd1a, Drd2, and Penk) (43), and a large number of FACS-nonenriched DEPs were overlapped with the genes in striatal module M2 (178 genes, 52.82%) (Fig. S14C). This result suggests that components of striatal module M2 are quite similar to FACS-nonenriched DEPs. On the other hand, FACS-enriched DEPs were not so overlapped with striatal module M2 (103 genes, 15.21%) probably due to their ubiquitous expression in the brain (Fig. 5C and Fig. S14B). Next, we focused on striatal module M20 and M39, which implicate DNA damage response and DNA damage repair, respectively, and striatal module M34, which implicates regulation of transcription and chromatin modification (Fig. S14A). Likewise, GO enrichment analysis of our data also showed the association of FACS-enriched DEPs with DNA damage and regulation of transcription (Fig. 4). Interestingly, FACS-enriched DEPs were represented in striatal modules M20 (39 genes, 5.76%) and M39 (18 genes, 2.66%) (Fig. S14B), but FACS-enriched DEPs in the M34 showed similar representation with other modules (12 genes, 1.77%) (Fig. S14B). Thus, FACS-array DEPs were partly consistent with the Langfelder's striatal modules. FC values of those FACS-enriched DEPs showed higher FC in FACS-array compared with corresponding probes in STR-array (Fig. S14D). This result suggests that the DEPs implicated in DNA damage responses were more detectable in FACS-array than in STR-array.
Discussion
Gene expression studies in HD model mice and in humans with HD have revealed that a large number of genes are altered in their expression (9–12, 43, 44). In this study, we focused on DEGs in striatal MSNs, which is the vulnerable cell type in HD (45). To analyze DEGs in striatal MSNs, we obtained FACS-purified MSNs, which were genetically labeled with Venus, from presymptomatic R6/2 mice.
We obtained two data sets of DEGs from MSNs and whole striatal samples by microarray analysis (FACS-array DEGs and STR-array DEGs) and created four probe/gene sets according to enrichment of the two different arrays (FACS-enriched DEPs/DEGs, FACS-nonenriched DEPs/DEGs, STR-enriched DEPs/DEGs, and STR-nonenriched DEPs/DEGs) (Fig. 8). Our result suggests that FACS-enriched DEPs/DEGs included masked DEGs in a common profiling assay. This is a methodological advantage of this study. Regional expression pattern analysis showed that expression levels of FACS-enriched DEGs were relatively low in the MSNs, whereas FACS- and STR-nonenriched DEGs tended to be strongly expressed in the MSNs. GO enrichment analysis showed that FACS-enriched DEPs were commonly associated with “transcriptional regulation” and “DNA damage,” suggesting that FACS-enriched DEPs are relevant to basic cellular function rather than neuronal functions, which are related to FACS-nonenriched DEPs, STR-enriched DEPs, and STR-nonenriched DEPs (Fig. 8).
Figure 8.

Summary of comparative analysis between FACS-array DEPs/DEGs and STR-array DEPs/DEGs. We created four probe/gene sets according to enrichment of two different arrays (FACS-array and STR-array): FACS-enriched DEPs/DEGs (FACS > STR), FACS-nonenriched DEPs/DEGs (FACS = STR), STR-enriched DEPs/DEGs (FACS < STR), and STR-nonenriched DEPs/DEGs (FACS = STR). FACS- and STR-nonenriched DEPs/DEGs contain a number of striatal-enriched genes, including transcripts strongly expressed in the MSNs. FACS-enriched DEPs/DEGs contain the genes that are expressed in both MSNs and non-MSN cells. STR-enriched DEPs/DEGs contain transcripts expressed in the forebrain. GO enrichment analysis shows that FACS-enriched DEPs/DEGs associate with general cellular responses, such as transcriptional regulation and DNA damage. The other three probe/gene sets associate with neuronal functions and properties, such as ion transport, calcium signaling, axon, dendrite, and synapse. FACS-enriched DEPs/DEGs could associate with neuronal cell death. In contrast, the other three probe/gene sets could be implicated in dysregulation of neuronal function.
The contribution of DNA damage responses to HD pathogenesis has been reported. For example, accumulation of oxidative DNA damage is observed in HD model mice (46), and mHTT impairs DNA repair by interacting with Ku70, a component of the DNA damage repair complex (47). In this study, we found many potential candidates related to DNA damage and repair in FACS-enriched DEPs due to methodological advantages (Fig. 4 and Fig. S14D). For example, Msh3 is a DNA mismatch repair (MMR) component, and its expression was increased in FACS-purified R6/2 MSNs (FC = 2.133, p = 0.0399). Recent studies have revealed that the DNA repair protein complex Msh2-Msh3 promotes CAG expansion in Saccharomyces cerevisiae (48), and genetic loss of Msh2 and Msh3 suppresses CAG repeat expansion and nuclear accumulation of mHTT in HD model mice (49), suggesting that up-regulation of Msh3 in MSNs may increase instability of CAG repeats in mHTT. It is well-known that CAG repeat instability is strongly associated with the disease symptoms and progression (1). Thus, FACS-enriched DEPs related to DNA MMR systems could be a therapeutic target. In addition, because DNA damage responses contribute to neuronal survival and degeneration (33), disruption of DNA MMR–related gene expression may cause neuronal cell death (Fig. 8). These newly identified genes related to DNA damage could provide a better understanding of not only the mechanisms of CAG repeat instability but also the mechanisms of MSN degeneration in HD.
The mitochondrial cell death pathway is induced by disruption of mitochondrial outer membrane permeability followed by cytochrome c release and caspase activation (50) It has been proposed that disruption of transcriptional machinery induced by mHTT may affect mitochondrial dysfunction in HD (51). Indeed, amelioration of transcriptional dysregulation by treatment with histone deacetylase inhibitors improved mitochondrial dysfunction in striatal neurons expressing mHTT (52). We found apoptosis-related genes implicated in a mitochondrial cell death pathway in the FACS-array DEPs: Bcl2l1 (FC = −1.513, p = 0.0099), Ucp2 (FC = −3.181, p = 0.0021), Hrk (FC = −2.874, p = 0.0030) (Fig. 7). Cell death pathway genes and HD-modulated genes were also shown in the striatal module M7 of the Langfelder CAG length–dependent module (43). We did not find enrichment of overlapped gene between M7 module and FACS-array DEPs, but two apoptosis-related genes implicated in a mitochondrial cell death pathway were represented in the module (Bid and Sh3glb1).
PCR array profiling data using postmortem neostriatal tissue revealed that many mitochondria-related apoptotic genes were generally up-regulated in HD (34). For example, the expression of Bcl2l1, which is a gene for an anti-apoptotic protein localized on mitochondria, was strikingly up-regulated in HD (34). However, our FACS-array profiling and qPCR result showed that Bcl2l1 expression was significantly down-regulated in the MSNs of R6/2 mice at 4 weeks (Figs. 5B and 7B). Our data also showed that expression of not only Bcl2l1, but also apoptosis-related genes, including mitochondria-related genes, was generally down-regulated (Fig. 7B). Thus, the opposite regulation of gene expression was shown in the brain of postmortem human HD and presymptomatic R6/2. The gene expression regulation of apoptosis-related genes could be altered, depending on disease stage (early or late).
Previous microarray studies revealed that the expression of striatal-enriched genes, such as Scn4b, Kcnip2, PPP1r1b, Rgs9, Drd1a, and Pde10a, was altered in HD patients and HD model mice (15, 53, 54). Consistently, we also identified a large number of striatal-enriched genes in STR-array DEPs/DEGs, and some of them overlapped with FACS-array DEPs/DEGs (Fig. 8). Striatal-enriched genes are associated with striatal function via neurotransmitter signaling, G-protein signaling, and calcium signaling (53, 55, 56), suggesting that expression alteration of those genes could disrupt striatal function in HD (Fig. 8).
Furthermore, our study showed a methodological advantage of vulnerable neuron-specific transcriptome analysis. As shown in Fig. 7, FACS-array DEGs showed higher FC and lower p value compared with the data of STR-array, suggesting that those genes were hardly detected by the common profiling assay using whole striatal samples. Taken together, FACS-array profiling using purified MSNs provided novel information about the disease cascade in HD. In addition, this profiling method using vulnerable neurons is also applicable for investigating the mechanisms of pathological cascades in other neurodegenerative disorders. FACS-array profiling using vulnerable neurons may lead to identification of novel therapeutic targets for neurodegenerative disease.
Experimental procedures
Animals
All surgical procedures and experiments were approved by the RIKEN ethics committee (approval no. H21-2-238 for animal experiments and 2011-016 for genetic recombinant experiments) and the Doshisha university ethics committee (approval no. A15083 for animal experiments and D15083 for genetic recombinant experiments). All animal experiments were performed in accordance with the guidelines approved by the Animal Experiments Committee of RIKEN and Doshisha University. All experiments were carried out in accordance with the approved ethical guidelines and regulations. Scn4b-Venus transgenic mice expressing the fluorescent marker Venus under the control of the 9-kb Scn4b promoter (18) were crossed with R6/2 transgenic mice (bearing 114–129 CAG repeats) (17). To identify Scn4b-Venus mouse, a mutant band was amplified by PCR using two primers: GFP_Venus-S61 (5′-GGCGACGTAAACGGCCACAAGTTCA-3′); GFP_Venus-A660 (5′-GACCATGTGATCGCGCTTCTCGTTG-3′). To identify the R6/2 mouse, the mutant band was amplified by PCR using two primers: HD33934F (5′-GGCGGCTGAGGAAGCTGAGGA-3′) and HD31329 (5′-ATGAAGGCCTTCGAGTCCCTCAAGTCCTTC-3′). Brains from 4-week-old male mice were used for microarray analysis.
FACS of MSNs from striatum
The striatal samples were dissected from coronal brain sections of 4-week-old male R6/2;Scn4b-Venus and control mice and minced with a scalpel blade (No. 11, Feather, Osaka, Japan) in Earle's balanced salt solution (EBSS), which is a reagent of the papain dissociation system (#LK003150, Worthington). DNase was added to the minced striatal samples, which were then dissociated at 37 °C and 140 rpm for 30 min using papain enzyme according to the manufacturer's instructions. The samples were dissociated with a 1-ml blue tip 50 times and centrifuged at 1,000 rpm for 5 min at room temperature. To remove debris and papain enzyme, pellets were resuspended in EBSS/DNase/albumin-ovomucoid inhibitor solution and carefully added onto albumin-ovomucoid inhibitor solution in the centrifuge tube for discontinuous density gradient. Layered samples were centrifuged at 800 rpm for 5 min at room temperature. Pellets were resuspended in EBSS with DNase and filtered through a cell strainer with 40-µm pores (#352340, Falcon–Corning, Corning, NY, USA). To label dead cells, cells were stained with 20 µg/ml PI (#P4864, Sigma–Aldrich) and then sorted by FACSAria (BD Biosciences) at the Support Unit for Bio-Material Analysis in RIKEN CBS Research Resources Division (RRD) using the following laser and filter combinations: 488-nm laser and 530/30 filter (detecting Venus), 488-nm laser and 710/50 filter (detecting PI). Striatal cells from WT littermates were treated with the same method described above and used as negative control. After sorting, 5,000–10,000 Venus (+)/PI (−) MSNs were obtained from each sorted aliquot.
Total RNA purification and cDNA amplification of FACS-purified MSNs
Approximately 4-20 ng of total RNAs were extracted from Venus (+)/PI (−) MSNs of R6/2;Scn4b-Venus and its control using an RNeasy Micro Kit (#74004, Qiagen, Hilden, Germany) according to the manufacturer's instructions. We validated total RNA quality and concentration using an Agilent 2100 Bioanalyzer (Agilent Technologies, San Carlos, CA, USA) and decided to use total RNAs above 7.0 RIN for microarray analysis. Next, we performed cDNA amplification using an Ovation Pico WTA System V2 (#3302-12, NuGEN, San Carlos, CA, USA) according to the manufacturer's instructions. An input amount of 2 ng of total RNA was used for cDNA synthesis and amplification.
Microarray analysis
cDNA labeling and hybridization were performed by DNA Chip Research Inc. (Tokyo, Japan) using the standard protocol for Agilent microarray. We used a SurePrint G3 Mouse GE 8x60K Microarray (#G4852A, Agilent Technologies) for this study. The microarray data were subsequently analyzed by GeneSpring 13 (Agilent Technologies). We performed microarray analysis using striatal samples to compare FACS-array data. Total RNAs from striatal samples of 4-week-old male WT and R6/2 mice were isolated by TRIzol reagent (#15596026, Thermo Fisher Scientific, Waltham, MA, USA) and then purified using an RNeasy Mini Kit (#74104, Qiagen) according to the manufacturer's instructions. Approximately 30–50 µg of total RNAs were purified from those striatal samples, and we used total RNAs above 8.0 RIN for microarray analysis. cDNA and cRNA synthesis were performed by DNA Chip Research Inc. (Tokyo, Japan). An input amount of 100 ng of total RNA from striatal samples was used for cRNA synthesis. cRNA labeling and hybridization were carried out by DNA Chip Research Inc. (Tokyo, Japan), and then microarray data were analyzed by GeneSpring 13 (Agilent Technologies). The microarray data of purified MSNs and whole striatal samples are available in the GEO database under accession numbers GSE113928, GSE113929, and GSE113930.
Analysis of FACS- and STR-array DEPs/DEGs
Raw signal values of microarray data were normalized by a 75-percentile shift, the default setting of GeneSpring. Because weak signal could be an inaccurate signal, we eliminated the probes with raw signal <100 (at least 1 of 8 samples) from the normalized data. Then we identified differentially expressed probes of FACS-array (FACS-array DEPs, absolute FC > 1.5, p < 0.05). We used a nominal p value for the selection because normalized signal value showed higher variance compared with the common profiling assay. The higher variance probably resulted from the use of amplified cDNA for FACS-array analysis. When we obtained the log2 expression value from microarray data, the raw signal value was log2-transformed and normalized with GeneSpring (75-percentile shift normalization). After normalization, the value of 75 percentile reached 0.
Next, FACS-array DEPs were divided into two groups, either FACS-enriched DEPs or FACS-nonenriched DEPs, according to enrichment of the different two arrays (FACS-array and STR-array). To create the sets, we examined the ratio of absolute FC of FACS-array DEPs to corresponding probes in STR-array (FACS-FC/STR-FC). We determined the DEPs that are enriched or nonenriched in FACS-array compared with FACS-array using the following contrasts: FACS-enriched DEPs, FACS-FC/STR-FC > 1.5; FACS-nonenriched DEPs, FACS-FC/STR-FC < 1.5. FACS-array DEPs showing opposite expression change to the corresponding STR-probes (up and down or down and up, respectively) were included in FACS-enriched DEPs.
As with the FACS-array DEPs, raw signals of STR-array were normalized (75-percentile shift normalization), and STR-array DEPs were selected with FC, nominal p value, and raw signal cut-off (absolute FC > 1.5, p < 0.05, raw signal > 100). When we obtained the log2 expression value from microarray data, raw signal value was log2-transformed and normalized using GeneSpring (75-percentile shift normalization). Next, STR-array DEPs were also divided into two groups: either STR-enriched DEPs or STR-nonenriched DEPs. To create the sets, we examined the ratio of absolute FC of STR-array DEPs to corresponding probes in FACS-array (STR-FC/FACS-FC). We determined the DEPs that are enriched or nonenriched in STR-array compared with FACS-array using the following contrasts: STR-enriched DEPs, STR-FC/FACS-FC > 1.5; STR-nonenriched DEPs, STR-FC/FACS-FC < 1.5.
STR-array DEPs showing opposite expression change to the corresponding FACS-probes (up and down or down and up, respectively) were included in the STR-enriched DEPs, as described for the FACS-array DEPs. A flowchart of the selection of FACS- and STR-array DEPs is displayed in Fig. S7A.
We performed further selection for the following two reasons: 1) some of the probes with low signal value (<500 in microarray data) were difficult to verify by qPCR (data not shown), and 2) to carry out regional expression analysis with ABA, multiple probes recognizing identical genes should be consolidated. To select more verifiable DEPs, we eliminated the probes with raw signal <500 from normalized FACS- and STR-array data. Then we selected DEPs with the FC and p value cut-off (absolute FC > 1.5, p < 0.01 (nominal p value)). To consolidate multiple probes, we only selected the probe showing the highest average signal value in control samples. We named the gene set as FACS- and STR-array “differentially expressed genes” (DEGs), because one probe recognizes one gene in the set. Next, we created four gene sets (FACS-enriched DEGs, FACS-nonenriched DEGs, STR-enriched DEGs, and STR-nonenriched DEGs), as we did for the FACS- and STR-array DEPs. To determine whether the DEGs were either enriched or nonenriched in each array, we used the following contrasts: FACS-enriched DEGs, FACS-FC/STR-FC > 1.5; FACS-nonenriched DEGs, FACS-FC/STR-FC < 1.5; STR-enriched DEGs, STR-FC/FACS-FC > 1.5; STR-nonenriched DEGs, STR-FC/FACS-FC < 1.5.
As with the FACS- and STR-array DEPs, the DEGs showing opposite expression change to the corresponding FACS-probes (up and down or down and up, respectively) were included in FACS- or STR-enriched DEGs. A flowchart of the selection of FACS- and STR-array DEGs is displayed in Fig. S7B.
Tissue preparation for histological analysis
Mice were perfused with PBS followed by 4% paraformaldehyde in PBS. Mouse brains were dissected and postfixed with 4% paraformaldehyde in PBS overnight. The brains were transferred and immersed with 30% sucrose (w/v) in PBS and then embedded into OCT compound by immediate freezing with liquid nitrogen. After freezing, brain samples were stored at −80 °C. We cut 20-µm-thick frozen sections with a Leica CM1850 Cryostat (Leica Biosystems, Wetzlar, Germany). To prepare paraffin sections, we perfused mice as described above. Dissected and postfixed mouse brains were dehydrated by ethanol, transferred to xylene, and then embedded in paraffin wax. 4-µm-thick sections were cut with an HM430 sliding microtome (Thermo Fisher Scientific).
qPCR
cDNAs obtained from MSN samples were synthesized and amplified using an Ovation Pico WTA System V2 (NuGEN) according to the manufacturer's instructions. We used 2 ng of cDNAs as a template for qPCR. cDNAs obtained from striatal samples were synthesized using ReverTra Ace -alpha-® (#FSK-101, Toyobo, Osaka, Japan) according to the manufacturer's instructions (input amount of total RNA was 1 µg). Template cDNAs prepared in 50-fold dilutions were used for qPCR. Template cDNAs and specific primers were mixed with FastStart Universal SYBR Green Master (Rox) (#4913914001, Roche, Basel, Switzerland), and PCRs were performed by a LightCycler®480 Real-Time PCR System (Roche). Cycling parameters for PCR were as follows: preincubation (95 °C for 10 min), amplification (60 cycles of 95 °C for 15 s and 60 °C for 1 min), melting curve (65–95 °C), and cooling (40 °C for 30 s). When we compared expression levels of mRNA between WT and R6/2 striatal samples, standards were generated by cDNA diluent of striatal samples. When we compared expression levels of mRNA between WT and R6/2 purified MSNs, standards were generated by cDNA diluent of purified MSNs. When we compared expression levels between striatal samples and purified MSNs of WT mice, standards were generated by cDNA diluent of striatal samples. The expression of the target gene was normalized with the expression value of Gapdh in each sample. Gapdh was used as the reference gene because it shows similar expression levels between FACS-purified MSNs and striatal samples (Fig. S15). Microarray data also showed that expression levels of Gapdh were not altered in MSNs and striatal samples of 4-week-old WT and R6/2 mice (Fig. S16). We could not clarify Gapdh expression levels across cell types due to technical limitations. Primers used for qPCR are listed in Table S10.
Antibodies
We used the following primary antibodies in this study: anti-digoxigenin-AP (sheep, 1:2,000; #11093274910, Roche), anti-GFP (chicken, 1:700; #ab13970, Abcam, Cambridge, MA, USA), anti-GFP (mouse, 1:300; #11814460001, Roche), anti-DARPP-32 (rabbit, 1:300; #AB10518, Millipore, Burlington, MA, USA), anti-Huntingtin (mouse, clone EM48, 1:1,000; #MAB5374, Millipore), anti-ubiquitin (rabbit, 1:1,000; #Z0458, Dako, Glostrup, Denmark), and secondary antibodies: Alexa Fluor 488/546 anti-mouse/rabbit/chicken IgG (1:300; Thermo Fisher Scientific) and biotinylated anti-mouse/rabbit IgG (1:300; Vector Laboratories, Burlingame, CA, USA).
In situ hybridization
cDNA fragments encoding target genes were amplified using KOD-Plus-Neo polymerase (#KOD-401, Toyobo) and specific primers (Table S10). Amplified cDNAs were subcloned into pcDNATM 3.1/V5-His C vector (#V81020, Thermo Fisher Scientific), and those sequences were confirmed by DNA sequencing. Digoxigenin (DIG)-labeled probes were synthesized using a MEGAscriptTM T7 Transcription Kit (#AM1333, Thermo Fisher Scientific) and DIG RNA Labeling Mix (#11277073910, Roche) according to the manufacturer's instructions. Probes of Scn4b and Venus were synthesized as described previously (12, 18). DIG-labeled cRNA probes hybridized to 20-µm-thick frozen mouse brain sections, and signals were detected as described previously (18).
Immunohistochemistry
For 3,3′-diaminobenzidine staining, mouse brain sections were autoclaved for 5 min at 120 °C utilizing pH 6.0 citrate buffer for antigen retrieval and then incubated with 0.3% hydrogen peroxide for 30 min at room temperature to block endogenous peroxidase activity. Sections were incubated with blocking solution containing 5% skim milk in TBST (20 mm Tris-HCl (pH 7.5), 150 mm NaCl, 0.05% Tween 20) for 1 h at room temperature, primary antibodies in TBST overnight at 4 °C, followed by biotin-conjugated secondary antibodies for 3 h at room temperature. Sections were incubated with R.T.U. VECTASTAIN Elite ABC Reagent (#PK-7100, Vector Laboratories) for 30 min at room temperature, and then 3,3′-diaminobenzidine solution was applied. Slides were washed, dehydrated, and then mounted with xylene-based mounting solution. For immunofluorescence staining, slides were autoclaved and then incubated with 5% skim milk/TBST, followed by primary antibodies and Alexa Fluor–conjugated secondary antibodies. After washing, sections were mounted with VECTASHIELD Mounting Medium (#H-1200, Vector Laboratories). Images were taken with a BZ-X710 (KEYENCE, Osaka, Japan) and TCS SP2 confocal microscope (Leica Microsystems, Wetzlar, Germany).
Image analysis
Coronal striatal sections obtained from 4-, 8-, and 12-week-old WT; and R6/2;Scn4b-Venus mice were stained with anti-GFP (mouse, 1:300; #11814460001, Roche) and anti-Huntingtin (mouse, clone EM48, 1:1,000; #MAB5374, Millipore). Images were taken by a TCS SP2 confocal microscope (Leica Microsystems) under the same conditions and then scanned by ArrayScan HCS Reader (Thermo Fisher Scientific). Immunofluorescence intensity of GFP and Huntingtin in individual MSNs (∼450 cells) was automatically calculated using Target Activation Bioapplication software (Thermo Fisher Scientific) with the same parameters for all images.
Regional expression pattern analysis
ABA (RRID:SCR_006491) provides gene expression values of ISH in both coronal and sagittal sections of adult mouse brain. The values obtained from two different planes of section are similar but not always identical. Thus, we used only the expression values of sagittal sections for regional expression pattern analysis. We could not obtain all gene expression data of FACS- and STR-array DEGs from ABA, because some of them were not available. We obtained the raw expression values of 57 of 91 genes in the FACS-enriched DEGs, 76 of 90 genes in the FACS-nonenriched DEGs, 27 of 46 genes in the STR-enriched DEGs, and 101 of 135 genes in the STR-nonenriched DEGs from the ABA (Table S8). The relative expression value in different brain regions was calculated by average expression value of all brain regions (raw expression value/average expression value) (Table S9).
Statistics
To examine whether the samples had the same variances, samples were first analyzed by F-test. Next, to detect outliers, samples were analyzed by Grubbs' test. For microarray and qPCR analysis, data were presented as mean ± S.D. and analyzed by unpaired Student's t test. For regional expression pattern analysis by ABA, data were analyzed by one-way ANOVA followed by Tukey's multiple-comparison test. *, p < 0.05; **, p < 0.01; and ***, p < 0.001. p values of <0.05 were considered statistically significant.
Data availability
All data are contained within the article and supporting information. All of the FACS-array and STR-array data were deposited into the GEO database under accession numbers GSE113928, GSE113929, and GSE113930.
Supplementary Material
Acknowledgments
We thank Kenji Ohtawa (RIKEN CBS RRD) for purification of MSNs by FACS. We thank the staff of DNA Chip Research Inc. (Tokyo, Japan) for support of microarray analysis. We thank Itsuko Yamamoto and Tomoko Yoda for genotyping and maintenance of animals. We thank Kazuki Ninomiya for plasmid construction of ISH probes.
This article contains supporting information.
Author contributions—H. M. conceptualization; H. M., M. K., M. Y.-K., and R. Y. data curation; H. M., T. Y., F. O., and Y. K. formal analysis; H. M. and N. N. funding acquisition; H. M. investigation; H. M. and F. O. methodology; H. M. and N. N. writing-original draft; T. Y., F. O., Y. K., M. K., M. Y.-K., T. S., N. H., and N. N. resources; N. N. supervision; N. N. project administration; N. N. writing-review and editing.
Funding and additional information—This work was supported by Grants-in-Aid from the Ministry of Education, Culture, Sports, Science, and Technology (MEXT) of Japan for 25253066 and 17H01564 (to N. N.) and 16K07005 (to H. M.) and by AMED Grant 20ek0109310h0003 (to N. N.).
Conflict of interest—The authors declare that they have no conflicts of interest with the contents of this article.
- HD
- Huntington disease
- MSN
- medium spiny neuron
- DEP
- differentially expressed probe
- DEG
- differentially expressed gene
- polyQ
- polyglutamine
- mHTT
- mutant huntingtin protein
- GO
- gene ontology
- ISH
- in situ hybridization
- qPCR
- quantitative PCR
- NA
- nuclear accumulation
- NII
- neuronal intranuclear inclusion
- PI
- propidium iodide
- FC
- -fold change
- abs FC
- absolute FC
- ABA
- Allen Brain Atlas
- IHC
- immunohistochemistry
- RIN
- RNA integrity number
- MMR
- mismatch repair
- EBSS
- Earle's balanced salt solution
- DIG
- digoxigenin
- ANOVA
- analysis of variance.
References
- 1. Walker F. O. (2007) Huntington's disease. Lancet 369, 218–228 10.1016/S0140-6736(07)60111-1 [DOI] [PubMed] [Google Scholar]
- 2. Ehrlich M. E. (2012) Huntington's disease and the striatal medium spiny neuron: cell-autonomous and non-cell-autonomous mechanisms of disease. Neurotherapeutics 9, 270–284 10.1007/s13311-012-0112-2 [DOI] [PMC free article] [PubMed] [Google Scholar]
- 3. Huntington's Disease Collaborative Research Group (1993) A novel gene containing a trinucleotide repeat that is expanded and unstable on Huntington's disease chromosomes. Cell 72, 971–983 10.1016/0092-8674(93)90585-E [DOI] [PubMed] [Google Scholar]
- 4. Nucifora F. C. Jr., Sasaki M., Peters M. F., Huang H., Cooper J. K., Yamada M., Takahashi H., Tsuji S., Troncoso J., Dawson V. L., Dawson T. M., and Ross C. A. (2001) Interference by huntingtin and atrophin-1 with cbp-mediated transcription leading to cellular toxicity. Science 291, 2423–2428 10.1126/science.1056784 [DOI] [PubMed] [Google Scholar]
- 5. Suhr S. T., Senut M. C., Whitelegge J. P., Faull K. F., Cuizon D. B., and Gage F. H. (2001) Identities of sequestered proteins in aggregates from cells with induced polyglutamine expression. J. Cell Biol. 153, 283–294 10.1083/jcb.153.2.283 [DOI] [PMC free article] [PubMed] [Google Scholar]
- 6. Yamanaka T., Miyazaki H., Oyama F., Kurosawa M., Washizu C., Doi H., and Nukina N. (2008) Mutant Huntingtin reduces HSP70 expression through the sequestration of NF-Y transcription factor. EMBO J. 27, 827–839 10.1038/emboj.2008.23 [DOI] [PMC free article] [PubMed] [Google Scholar]
- 7. Vashishtha M., Ng C. W., Yildirim F., Gipson T. A., Kratter I. H., Bodai L., Song W., Lau A., Labadorf A., Vogel-Ciernia A., Troncosco J., Ross C. A., Bates G. P., Krainc D., Sadri-Vakili G., et al. (2013) Targeting H3K4 trimethylation in Huntington disease. Proc. Natl. Acad. Sci. U. S. A. 110, E3027–E3036 10.1073/pnas.1311323110 [DOI] [PMC free article] [PubMed] [Google Scholar]
- 8. Kim M. O., Chawla P., Overland R. P., Xia E., Sadri-Vakili G., and Cha J. H. (2008) Altered histone monoubiquitylation mediated by mutant huntingtin induces transcriptional dysregulation. J. Neurosci. 28, 3947–3957 10.1523/JNEUROSCI.5667-07.2008 [DOI] [PMC free article] [PubMed] [Google Scholar]
- 9. Hodges A., Strand A. D., Aragaki A. K., Kuhn A., Sengstag T., Hughes G., Elliston L. A., Hartog C., Goldstein D. R., Thu D., Hollingsworth Z. R., Collin F., Synek B., Holmans P. A., Young A. B., et al. (2006) Regional and cellular gene expression changes in human Huntington's disease brain. Hum. Mol. Genet. 15, 965–977 10.1093/hmg/ddl013 [DOI] [PubMed] [Google Scholar]
- 10. Oyama F., Miyazaki H., Sakamoto N., Becquet C., Machida Y., Kaneko K., Uchikawa C., Suzuki T., Kurosawa M., Ikeda T., Tamaoka A., Sakurai T., and Nukina N. (2006) Sodium channel β4 subunit: down-regulation and possible involvement in neuritic degeneration in Huntington's disease transgenic mice. J. Neurochem. 98, 518–529 10.1111/j.1471-4159.2006.03893.x [DOI] [PubMed] [Google Scholar]
- 11. Luthi-Carter R., Hanson S. A., Strand A. D., Bergstrom D. A., Chun W., Peters N. L., Woods A. M., Chan E. Y., Kooperberg C., Krainc D., Young A. B., Tapscott S. J., and Olson J. M. (2002) Dysregulation of gene expression in the R6/2 model of polyglutamine disease: parallel changes in muscle and brain. Hum. Mol. Genet. 11, 1911–1926 10.1093/hmg/11.17.1911 [DOI] [PubMed] [Google Scholar]
- 12. Kotliarova S., Jana N. R., Sakamoto N., Kurosawa M., Miyazaki H., Nekooki M., Doi H., Machida Y., Wong H. K., Suzuki T., Uchikawa C., Kotliarov Y., Uchida K., Nagao Y., Nagaoka U., et al. (2005) Decreased expression of hypothalamic neuropeptides in Huntington disease transgenic mice with expanded polyglutamine-EGFP fluorescent aggregates. J. Neurochem. 93, 641–653 10.1111/j.1471-4159.2005.03035.x [DOI] [PubMed] [Google Scholar]
- 13. Jia H., Morris C. D., Williams R. M., Loring J. F., and Thomas E. A. (2015) HDAC inhibition imparts beneficial transgenerational effects in Huntington's disease mice via altered DNA and histone methylation. Proc. Natl. Acad. Sci. U. S. A. 112, E56–E64 10.1073/pnas.1415195112 [DOI] [PMC free article] [PubMed] [Google Scholar]
- 14. Seredenina T., and Luthi-Carter R. (2012) What have we learned from gene expression profiles in Huntington's disease?. Neurobiol. Dis. 45, 83–98 10.1016/j.nbd.2011.07.001 [DOI] [PubMed] [Google Scholar]
- 15. Desplats P. A., Kass K. E., Gilmartin T., Stanwood G. D., Woodward E. L., Head S. R., Sutcliffe J. G., and Thomas E. A. (2006) Selective deficits in the expression of striatal-enriched mRNAs in Huntington's disease. J. Neurochem. 96, 743–757 10.1111/j.1471-4159.2005.03588.x [DOI] [PubMed] [Google Scholar]
- 16. Crotti A., Benner C., Kerman B. E., Gosselin D., Lagier-Tourenne C., Zuccato C., Cattaneo E., Gage F. H., Cleveland D. W., and Glass C. K. (2014) Mutant Huntingtin promotes autonomous microglia activation via myeloid lineage-determining factors. Nat. Neurosci. 17, 513–521 10.1038/nn.3668 [DOI] [PMC free article] [PubMed] [Google Scholar]
- 17. Mangiarini L., Sathasivam K., Seller M., Cozens B., Harper A., Hetherington C., Lawton M., Trottier Y., Lehrach H., Davies S. W., and Bates G. P. (1996) Exon 1 of the HD gene with an expanded CAG repeat is sufficient to cause a progressive neurological phenotype in transgenic mice. Cell 87, 493–506 10.1016/S0092-8674(00)81369-0 [DOI] [PubMed] [Google Scholar]
- 18. Miyazaki H., Oyama F., Inoue R., Aosaki T., Abe T., Kiyonari H., Kino Y., Kurosawa M., Shimizu J., Ogiwara I., Yamakawa K., Koshimizu Y., Fujiyama F., Kaneko T., Shimizu H., et al. (2014) Singular localization of sodium channel β4 subunit in unmyelinated fibres and its role in the striatum. Nat. Commun. 5, 5525 10.1038/ncomms6525 [DOI] [PubMed] [Google Scholar]
- 19. Lobo M. K., Karsten S. L., Gray M., Geschwind D. H., and Yang X. W. (2006) FACS-array profiling of striatal projection neuron subtypes in juvenile and adult mouse brains. Nat. Neurosci. 9, 443–452 10.1038/nn1654 [DOI] [PubMed] [Google Scholar]
- 20. Ena S. L., De Backer J.-F., Schiffmann S. N., and de Kerchove d'Exaerde A. (2013) FACS array profiling identifies Ecto-5′ nucleotidase as a striatopallidal neuron-specific gene involved in striatal-dependent learning. J. Neurosci. 33, 8794–8809 10.1523/JNEUROSCI.2989-12.2013 [DOI] [PMC free article] [PubMed] [Google Scholar]
- 21. Bye C. R., Jonsson M. E., Bjorklund A., Parish C. L., and Thompson L. H. (2015) Transcriptome analysis reveals transmembrane targets on transplantable midbrain dopamine progenitors. Proc. Natl. Acad. Sci. U. S. A. 112, E1946–E1955 10.1073/pnas.1501989112 [DOI] [PMC free article] [PubMed] [Google Scholar]
- 22. Gutekunst C. A., Li S. H., Yi H., Mulroy J. S., Kuemmerle S., Jones R., Rye D., Ferrante R. J., Hersch S. M., and Li X. J. (1999) Nuclear and neuropil aggregates in Huntington's disease: relationship to neuropathology. J. Neurosci. 19, 2522–2534 10.1523/JNEUROSCI.19-07-02522.1999 [DOI] [PMC free article] [PubMed] [Google Scholar]
- 23. Meade C. A., Deng Y. P., Fusco F. R., Del Mar N., Hersch S., Goldowitz D., and Reiner A. (2002) Cellular localization and development of neuronal intranuclear inclusions in striatal and cortical neurons in R6/2 transgenic mice. J. Comp. Neurol. 449, 241–269 10.1002/cne.10295 [DOI] [PubMed] [Google Scholar]
- 24. Silberberg G., and Bolam J. P. (2015) Local and afferent synaptic pathways in the striatal microcircuitry. Curr. Opin. Neurobiol. 33, 182–187 10.1016/j.conb.2015.05.002 [DOI] [PubMed] [Google Scholar]
- 25. Gervasi N. M., Scott S. S., Aschrafi A., Gale J., Vohra S. N., MacGibeny M. A., Kar A. N., Gioio A. E., and Kaplan B. B. (2016) The local expression and trafficking of tyrosine hydroxylase mRNA in the axons of sympathetic neurons. RNA 22, 883–895 10.1261/rna.053272.115 [DOI] [PMC free article] [PubMed] [Google Scholar]
- 26. Heiman M., Schaefer A., Gong S., Peterson J. D., Day M., Ramsey K. E., Suárez-Fariñas M., Schwarz C., Stephan D. A., Surmeier D. J., Greengard P., and Heintz N. (2008) A translational profiling approach for the molecular characterization of CNS cell types. Cell 135, 738–748 10.1016/j.cell.2008.10.028 [DOI] [PMC free article] [PubMed] [Google Scholar]
- 27. Huang da W., Sherman B. T., and Lempicki R. A. (2009) Systematic and integrative analysis of large gene lists using DAVID bioinformatics resources. Nat. Protoc. 4, 44–57 10.1038/nprot.2008.211 [DOI] [PubMed] [Google Scholar]
- 28. Merienne N., Meunier C., Schneider A., Seguin J., Nair S. S., Rocher A. B., Le Gras S., Keime C., Faull R., Pellerin L., Chatton J. Y., Neri C., Merienne K., and Deglon N. (2019) Cell-type-specific gene expression profiling in adult mouse brain reveals normal and disease-state signatures. Cell Rep. 26, 2477–2493.e2479 10.1016/j.celrep.2019.02.003 [DOI] [PubMed] [Google Scholar]
- 29. Lein E. S., Hawrylycz M. J., Ao N., Ayres M., Bensinger A., Bernard A., Boe A. F., Boguski M. S., Brockway K. S., Byrnes E. J., Chen L., Chen T. M., Chin M. C., Chong J., Crook B. E., et al. (2007) Genome-wide atlas of gene expression in the adult mouse brain. Nature 445, 168–176 10.1038/nature05453 [DOI] [PubMed] [Google Scholar]
- 30. Zeng H., Shen E. H., Hohmann J. G., Oh S. W., Bernard A., Royall J. J., Glattfelder K. J., Sunkin S. M., Morris J. A., Guillozet-Bongaarts A. L., Smith K. A., Ebbert A. J., Swanson B., Kuan L., Page D. T., et al. (2012) Large-scale cellular-resolution gene profiling in human neocortex reveals species-specific molecular signatures. Cell 149, 483–496 10.1016/j.cell.2012.02.052 [DOI] [PMC free article] [PubMed] [Google Scholar]
- 31. Bernard A., Lubbers L. S., Tanis K. Q., Luo R., Podtelezhnikov A. A., Finney E. M., McWhorter M. M., Serikawa K., Lemon T., Morgan R., Copeland C., Smith K., Cullen V., Davis-Turak J., Lee C. K., et al. (2012) Transcriptional architecture of the primate neocortex. Neuron 73, 1083–1099 10.1016/j.neuron.2012.03.002 [DOI] [PMC free article] [PubMed] [Google Scholar]
- 32. Roos W. P., and Kaina B. (2006) DNA damage-induced cell death by apoptosis. Trends Mol. Med. 12, 440–450 10.1016/j.molmed.2006.07.007 [DOI] [PubMed] [Google Scholar]
- 33. Madabhushi R., Pan L., and Tsai L. H. (2014) DNA damage and its links to neurodegeneration. Neuron 83, 266–282 10.1016/j.neuron.2014.06.034 [DOI] [PMC free article] [PubMed] [Google Scholar]
- 34. Kim J., Moody J. P., Edgerly C. K., Bordiuk O. L., Cormier K., Smith K., Beal M. F., and Ferrante R. J. (2010) Mitochondrial loss, dysfunction and altered dynamics in Huntington's disease. Hum. Mol. Genet. 19, 3919–3935 10.1093/hmg/ddq306 [DOI] [PMC free article] [PubMed] [Google Scholar]
- 35. Taylor R. C., Cullen S. P., and Martin S. J. (2008) Apoptosis: controlled demolition at the cellular level. Nat. Rev. Mol. Cell Biol. 9, 231–241 10.1038/nrm2312 [DOI] [PubMed] [Google Scholar]
- 36. Hass D. T., and Barnstable C. J. (2016) Uncoupling protein 2 in the glial response to stress: implications for neuroprotection. Neural Regen. Res. 11, 1197–1200 10.4103/1673-5374.189159 [DOI] [PMC free article] [PubMed] [Google Scholar]
- 37. Li G. H., Arora P. D., Chen Y., McCulloch C. A., and Liu P. (2012) Multifunctional roles of gelsolin in health and diseases. Med. Res. Rev. 32, 999–1025 10.1002/med.20231 [DOI] [PubMed] [Google Scholar]
- 38. Kim J.-B., Kim S. Y., Kim B. M., Lee H., Kim I., Yun J., Jo Y., Oh T., Jo Y., Chae H.-D., and Shin D. Y. (2013) Identification of a novel anti-apoptotic E3 ubiquitin ligase that ubiquitinates antagonists of inhibitor of apoptosis proteins SMAC, HtrA2, and ARTS. J. Biol. Chem. 288, 12014–12021 10.1074/jbc.M112.436113 [DOI] [PMC free article] [PubMed] [Google Scholar]
- 39. Xu C., Yu L., Hou J., Jackson R. J., Wang H., Huang C., Liu T., Wang Q., Zou X., Morris R. G., Spires-Jones T. L., Yang Z., Yin Z., Xu Y., and Chen G. (2017) Conditional deletion of PDK1 in the forebrain causes neuron loss and increased apoptosis during cortical development. Front. Cell Neurosci. 11, 330 10.3389/fncel.2017.00330 [DOI] [PMC free article] [PubMed] [Google Scholar]
- 40. Danisz K., and Blasiak J. (2013) Role of anti-apoptotic pathways activated by BCR/ABL in the resistance of chronic myeloid leukemia cells to tyrosine kinase inhibitors. Acta Biochim. Pol. 60, 503–514 10.18388/abp.2013_2014 [DOI] [PubMed] [Google Scholar]
- 41. Khromov T., Dressel R., Siamishi I., Nolte J., Opitz L., Engel W., and Pantakani D. V. (2012) Apoptosis-related gene expression profiles of mouse ESCs and maGSCs: role of Fgf4 and Mnda in pluripotent cell responses to genotoxicity. PLoS ONE 7, e48869 10.1371/journal.pone.0048869 [DOI] [PMC free article] [PubMed] [Google Scholar]
- 42. Chan W. H. (2008) Citrinin induces apoptosis in mouse embryonic stem cells. IUBMB Life 60, 171–179 10.1002/iub.30 [DOI] [PubMed] [Google Scholar]
- 43. Langfelder P., Cantle J. P., Chatzopoulou D., Wang N., Gao F., Al-Ramahi I., Lu X. H., Ramos E. M., El-Zein K., Zhao Y., Deverasetty S., Tebbe A., Schaab C., Lavery D. J., Howland D., et al. (2016) Integrated genomics and proteomics define huntingtin CAG length-dependent networks in mice. Nat. Neurosci. 19, 623–633 10.1038/nn.4256 [DOI] [PMC free article] [PubMed] [Google Scholar]
- 44. Luthi-Carter R., Strand A., Peters N. L., Solano S. M., Hollingsworth Z. R., Menon A. S., Frey A. S., Spektor B. S., Penney E. B., Schilling G., Ross C. A., Borchelt D. R., Tapscott S. J., Young A. B., Cha J. H., et al. (2000) Decreased expression of striatal signaling genes in a mouse model of Huntington's disease. Hum. Mol. Genet. 9, 1259–1271 10.1093/hmg/9.9.1259 [DOI] [PubMed] [Google Scholar]
- 45. Hickey M. A., and Chesselet M. F. (2003) Apoptosis in Huntington's disease. Prog. Neuropsychopharmacol. Biol. Psychiatry 27, 255–265 10.1016/S0278-5846(03)00021-6 [DOI] [PubMed] [Google Scholar]
- 46. Kovtun I. V., Liu Y., Bjoras M., Klungland A., Wilson S. H., and McMurray C. T. (2007) OGG1 initiates age-dependent CAG trinucleotide expansion in somatic cells. Nature 447, 447–452 10.1038/nature05778 [DOI] [PMC free article] [PubMed] [Google Scholar]
- 47. Enokido Y., Tamura T., Ito H., Arumughan A., Komuro A., Shiwaku H., Sone M., Foulle R., Sawada H., Ishiguro H., Ono T., Murata M., Kanazawa I., Tomilin N., Tagawa K., et al. (2010) Mutant huntingtin impairs Ku70-mediated DNA repair. J. Cell Biol. 189, 425–443 10.1083/jcb.200905138 [DOI] [PMC free article] [PubMed] [Google Scholar]
- 48. Kantartzis A., Williams G. M., Balakrishnan L., Roberts R. L., Surtees J. A., and Bambara R. A. (2012) Msh2-Msh3 interferes with Okazaki fragment processing to promote trinucleotide repeat expansions. Cell Rep. 2, 216–222 10.1016/j.celrep.2012.06.020 [DOI] [PMC free article] [PubMed] [Google Scholar]
- 49. Dragileva E., Hendricks A., Teed A., Gillis T., Lopez E. T., Friedberg E. C., Kucherlapati R., Edelmann W., Lunetta K. L., MacDonald M. E., and Wheeler V. C. (2009) Intergenerational and striatal CAG repeat instability in Huntington's disease knock-in mice involve different DNA repair genes. Neurobiol. Dis. 33, 37–47 10.1016/j.nbd.2008.09.014 [DOI] [PMC free article] [PubMed] [Google Scholar]
- 50. Jana N. R., Zemskov E. A., Wang G., and Nukina N. (2001) Altered proteasomal function due to the expression of polyglutamine-expanded truncated N-terminal huntingtin induces apoptosis by caspase activation through mitochondrial cytochrome c release. Hum. Mol. Genet. 10, 1049–1059 10.1093/hmg/10.10.1049 [DOI] [PubMed] [Google Scholar]
- 51. Sawa A. (2001) Mechanisms for neuronal cell death and dysfunction in Huntington's disease: pathological cross-talk between the nucleus and the mitochondria? J. Mol. Med. (Berl.) 79, 375–381 10.1007/s001090100223 [DOI] [PubMed] [Google Scholar]
- 52. Oliveira J. M., Chen S., Almeida S., Riley R., Gonçalves J., Oliveira C. R., Hayden M. R., Nicholls D. G., Ellerby L. M., and Rego A. C. (2006) Mitochondrial-dependent Ca2+ handling in Huntington's disease striatal cells: effect of histone deacetylase inhibitors. J. Neurosci. 26, 11174–11186 10.1523/JNEUROSCI.3004-06.2006 [DOI] [PMC free article] [PubMed] [Google Scholar]
- 53. Thomas E. A. (2006) Striatal specificity of gene expression dysregulation in Huntington's disease. J. Neurosci. Res. 84, 1151–1164 10.1002/jnr.21046 [DOI] [PubMed] [Google Scholar]
- 54. Mazarei G., Neal S. J., Becanovic K., Luthi-Carter R., Simpson E. M., and Leavitt B. R. (2010) Expression analysis of novel striatal-enriched genes in Huntington disease. Hum. Mol. Genet. 19, 609–622 10.1093/hmg/ddp527 [DOI] [PMC free article] [PubMed] [Google Scholar]
- 55. Roze E., Cahill E., Martin E., Bonnet C., Vanhoutte P., Betuing S., and Caboche J. (2011) Huntington's disease and striatal signaling. Front. Neuroanat. 5, 55 10.3389/fnana.2011.00055 [DOI] [PMC free article] [PubMed] [Google Scholar]
- 56. Xie K., and Martemyanov K. A. (2011) Control of striatal signaling by G protein regulators. Front. Neuroanat. 5, 49 10.3389/fnana.2011.00049 [DOI] [PMC free article] [PubMed] [Google Scholar]
Associated Data
This section collects any data citations, data availability statements, or supplementary materials included in this article.
Supplementary Materials
Data Availability Statement
All data are contained within the article and supporting information. All of the FACS-array and STR-array data were deposited into the GEO database under accession numbers GSE113928, GSE113929, and GSE113930.