

Abstract
Activation of lipid-burning pathways in the fat-storing white adipose tissue (WAT) is a promising strategy to improve metabolic health and reduce obesity, insulin resistance, and type II diabetes. For unknown reasons, bilirubin levels are negatively associated with obesity and diabetes. Here, using mice and an array of approaches, including MRI to assess body composition, biochemical assays to measure bilirubin and fatty acids, MitoTracker-based mitochondrial analysis, immunofluorescence, and high-throughput coregulator analysis, we show that bilirubin functions as a molecular switch for the nuclear receptor transcription factor peroxisome proliferator–activated receptor α (PPARα). Bilirubin exerted its effects by recruiting and dissociating specific coregulators in WAT, driving the expression of PPARα target genes such as uncoupling protein 1 (Ucp1) and adrenoreceptor β 3 (Adrb3). We also found that bilirubin is a selective ligand for PPARα and does not affect the activities of the related proteins PPARγ and PPARδ. We further found that diet-induced obese mice with mild hyperbilirubinemia have reduced WAT size and an increased number of mitochondria, associated with a restructuring of PPARα-binding coregulators. We conclude that bilirubin strongly affects organismal body weight by reshaping the PPARα coregulator profile, remodeling WAT to improve metabolic function, and reducing fat accumulation.
Keywords: hormone, PPARα, PPARγ, PPARδ, peroxisome proliferator‐activated receptor (PPAR), nuclear receptor, biliverdin, beige fat, browning, obesity, peroxisome proliferator-activated receptor (PPAR), hormone, fatty acid oxidation
In the past, our understanding of bilirubin has been shaped by the dramatic consequences of extreme hyperbilirubinemia seen in pathological jaundice and Crigler–Najjar syndrome. This led to the idea that bilirubin is categorically harmful. However, now there is compelling evidence that hypobilirubinemia (<10 μm in men and <8 μm in women (1)) is deleterious and leads to metabolic deficits (1–6). Several large population studies have reflected a negative correlation between serum bilirubin levels with body weight and plasma glucose levels (7–12). People exhibiting mildly elevated (>12 μm) bilirubin levels have significantly fewer metabolic disorders, such as obesity or type II diabetes (7, 11). These data suggest that bilirubin may elicit molecular signaling pathways in various adipose stores, in which it regulates adiposity and glucose sensitivity.
In humans and rodents, adipose tissue depots have different functions, especially in their responses to stimuli (13). White adipose tissue (WAT) responds to nutrient overload and is a lipid-storing organ located viscerally and subcutaneously. The visceral portion expands during obesity and secrets inflammatory factors that contribute to low-grade chronic inflammation and insulin-resistant diabetes. Brown adipose tissue (BAT), however, responds to sympathetic stimuli and increases energy expenditure. Pharmacological stimuli can activate pathways in WAT that increase the burning of fat for energy expenditure known as beiging or browning named from the amplified mitochondrial levels. Activation of the browning of WAT, increasing energy expenditure and boosting the burning of fat, has significant implications in reducing adiposity and insulin resistance (14–16). Mostly, these processes are mediated by mitochondrial uncoupling proteins during physical activity or brown fat–mediated thermogenesis. During thermogenesis, β3 adrenergic receptor (ADRB3) signaling activates the uncoupling protein 1 (UCP1), prompting protons to leak across the inner mitochondrial membrane, increasing oxygen consumption (17–22), which overall improves mitochondrial function and fat utilization, reversing adipocyte dysfunction. Activation of PPARα in WAT causes browning, which reduces body weight (15, 16, 23, 24). Bilirubin has been shown to reduce body weight, but its role in mitochondrial function in WAT is unknown. Our previous studies have demonstrated a potential relationship between bilirubin and PPARα and that bilirubin is possibly a ligand for PPARs. We showed that bilirubin induced transcriptional activity of PPARα at a minimal promoter-luciferase construct (25) and endogenous genes (25, 26). However, PPARα is probably one of many factors involved in the effects of bilirubin, and bilirubin may likely bind other PPARs. Compounds that target the PPARs may simultaneously activate all three PPARs (PPAR pan-agonists) or can have selective PPAR modulation (SPPARM) (27–30). The latter may be a potent inducer of some activities with reduced unwanted effects.
Here, we examined whether bilirubin serves as a metabolic hormone because it may have a direct action on a target (PPARs) to lessen fat storage and improve adipocyte function. The mechanisms of the lipid-reducing capacity of bilirubin on WAT or BAT or direct signaling actions are unknown. We set out to comprehensively map the hormonal responses to bilirubin in adipose tissues and whether its activities span across all of the PPAR isoforms. We found that bilirubin has selective binding to PPARα and causes the recruitment and dissociation of a specific set of coregulators, which induces mitochondrial function, decreasing WAT size, ultimately affecting organismal metabolic balance and glucose homeostasis. Taken together, our findings indicate that bilirubin is a metabolic hormone that controls WAT tissue expansion, lessening hypertrophy and glucose intolerance.
Results
Bilirubin selectively binds PPARα
We and others have previously shown that bilirubin treatment reduces body weight and lipid accumulation in adipocytes (3, 25, 31, 32). However, whether this occurs by exclusive activation of PPARα or by discriminate PPARγ regulation or is a dual/pan-PPAR ligand remains to be determined. We first set out to ascertain whether bilirubin has actions on all PPAR isoforms (α, γ, and β/δ) or is a SPPARM to mediate its lipid-lowering effects. Using the Gal4 transcription factor reporter system fused with the PPAR ligand-binding domains (LBDs) for each isoform, we compared bilirubin dose responses for all PPAR-LBDs. The benefit of the Gal4 system is that endogenous PPARs are not responsive to the promoter, and only molecules that bind to the LBD drive expression. The Gal4-hPPARα-LBD responded to increasing bilirubin levels at the Gal4-driven upstream activation sequence (UAS) promoter (Fig. 1A, left). We have shown that bilirubin induces PPARα transactivation for the minimal PPAR response element (PPRE-3tk-luc) (25), which functions best with the PPARα-RXR heterodimer (33). The RXR heterodimer is not needed for the Gal4 system, eliminating the possibility that bilirubin signals RXR. Supporting that bilirubin binds to the PPARα LBD, cotreatment with PPARα antagonist GW6471 attenuated bilirubin responses at each dose (Fig. 1A, left). Dose response of bilirubin on the Gal4-hPPARα-LBD showed that bilirubin has an EC50 = 9.021 μm for PPARα activation (Fig. 1A, right). Analysis of bilirubin responsiveness on the Gal4-PPARγ-LBD or Gal4-PPARδ-LBD showed that there was no action on these isoforms (Figs. 1, B and C). To determine whether bilirubin is a competitive antagonist for PPARγ, we cotreated with agonist rosiglitazone and increasing doses of bilirubin, which we found did not affect the rosiglitazone-induced transactivation of the Gal4-hPPARγ-LBD. Similarly, increasing doses of rosiglitazone in the presence or absence of 50 μm bilirubin had no significant effect on the Gal4-hPPARγ-LBD transactivity (Fig. S1A). This was also found for the Gal4-hPPARδ-LBD and cotreatment with GW501516 PPARδ agonist and increasing doses of bilirubin (Fig. 1C). These data show that bilirubin is a selective ligand for PPARα but does not signal PPARγ or PPARδ at least via by binding to their LBDs.
Figure 1.
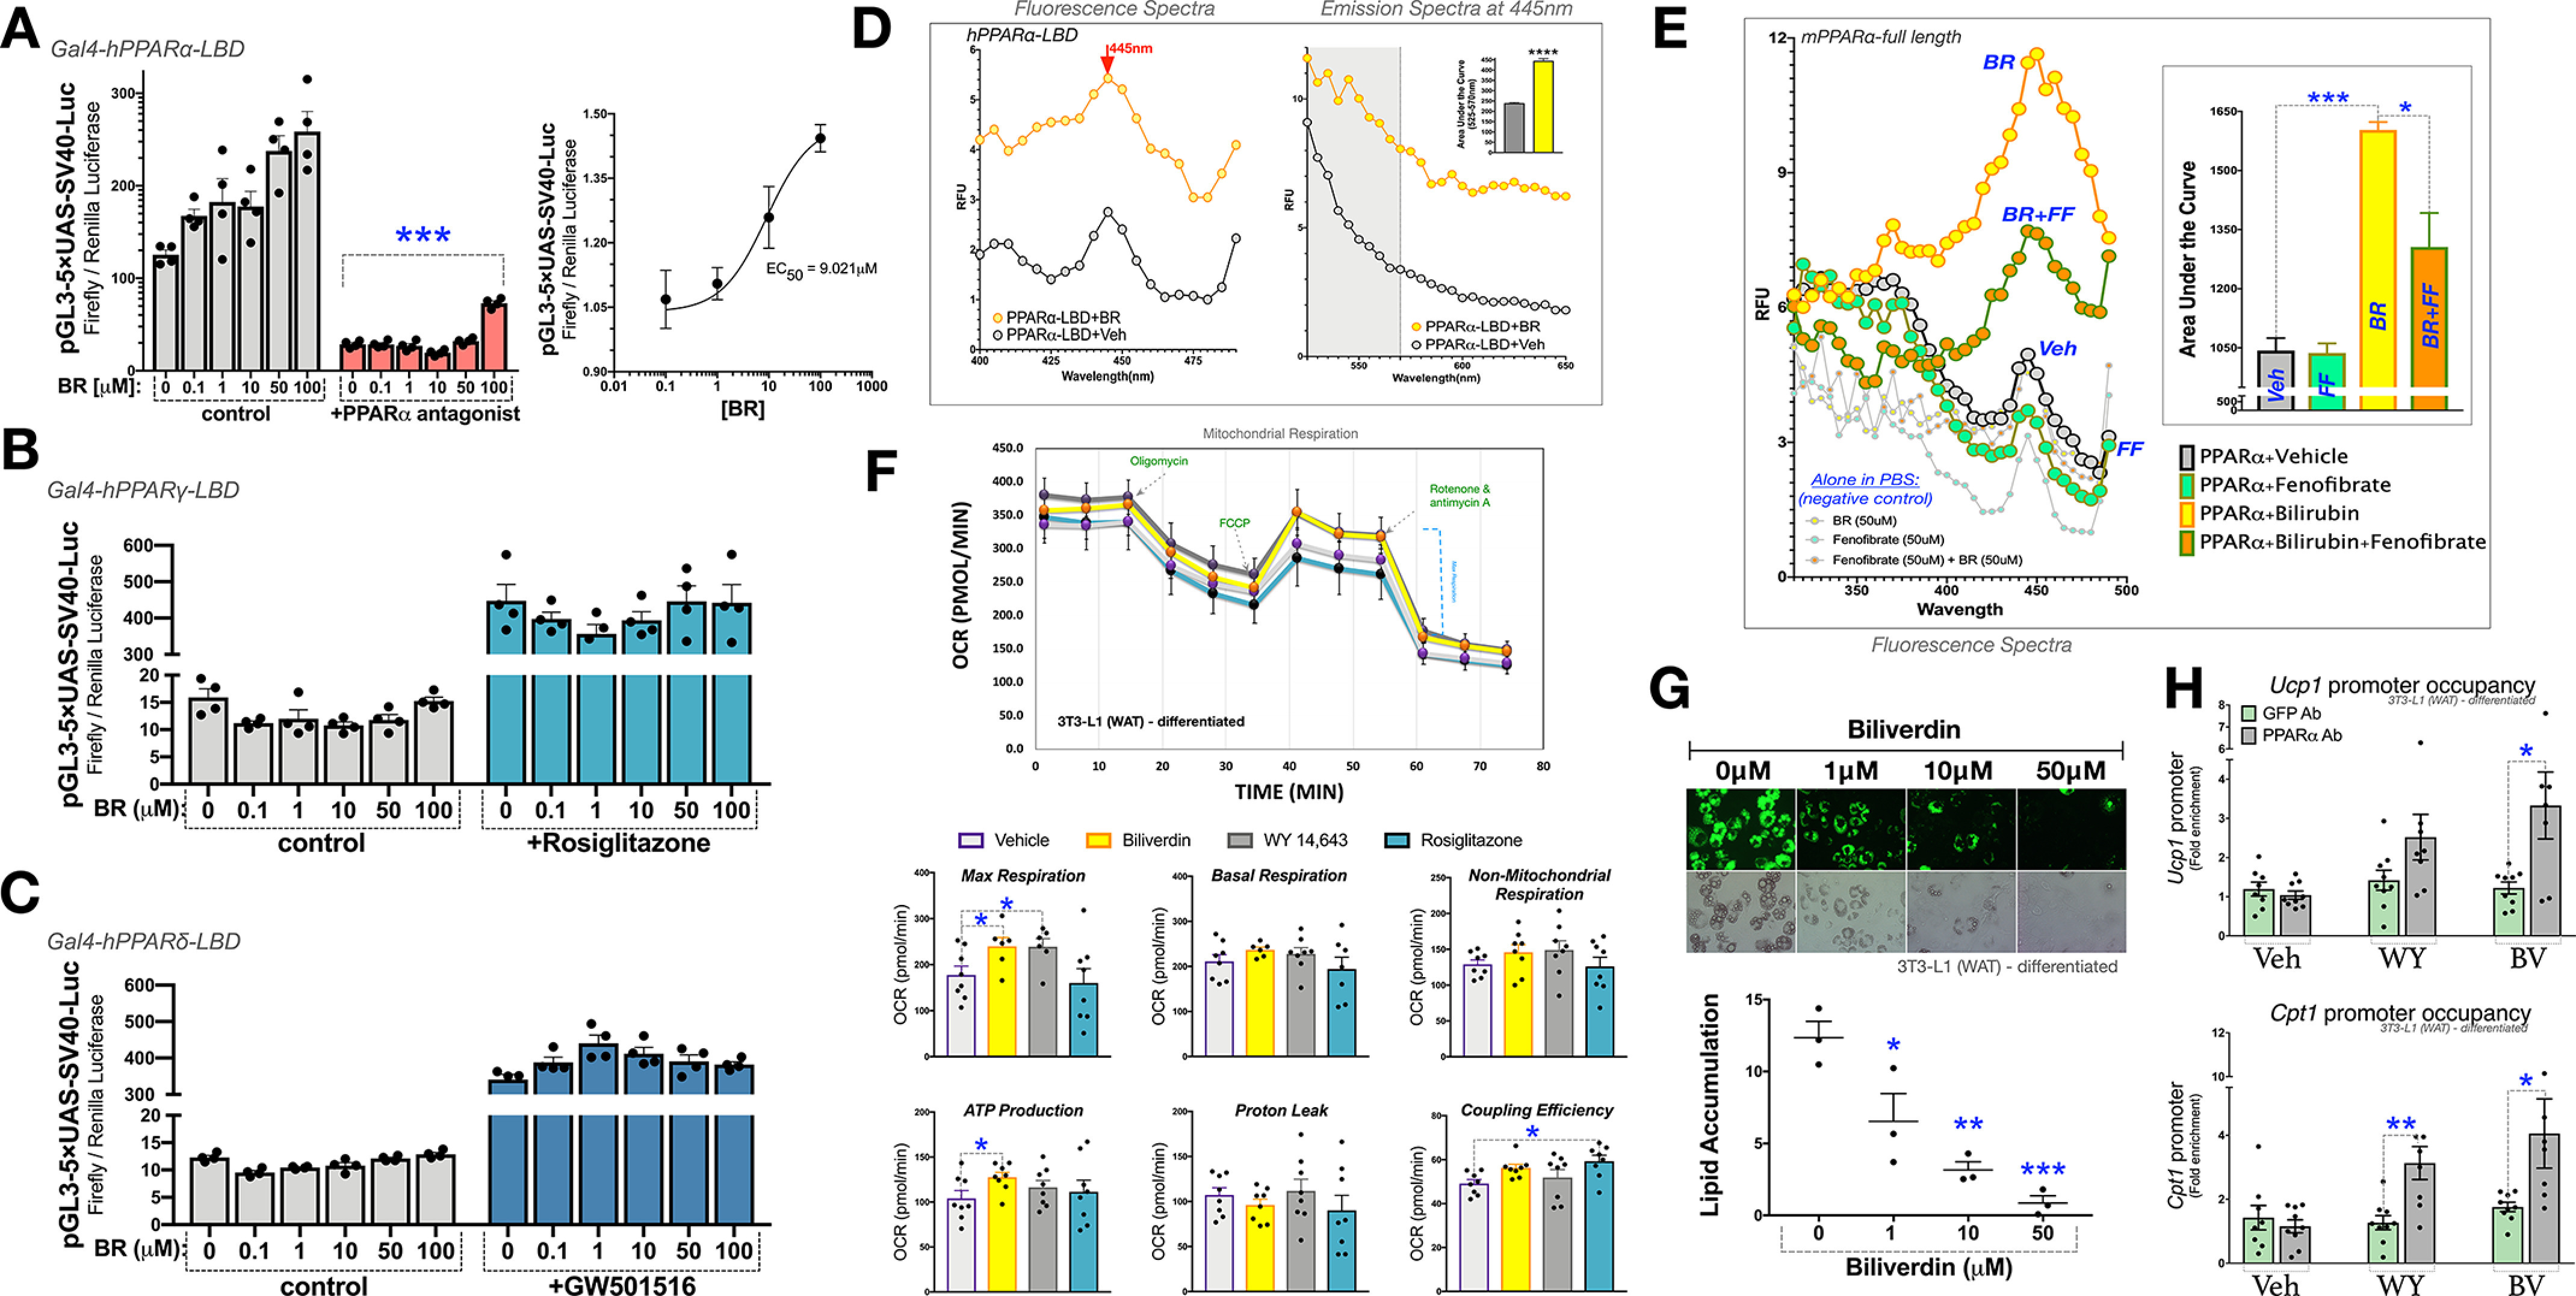
Bilirubin selectively binds PPARα. A–C, transient transfection of UAS-Luc and pCMV-renilla along with constructs for pGAL4-PPARα-LBD (A), pGAL4-PPARγ-LBD (B), or pGAL4-PPARδ-LBD (C) in HEK293 cells for 24 h. Cells were treated for 24 h with a dose-dependent increase of bilirubin in the absence and presence of 1 μm ligands for the respective PPAR isoforms (PPARα antagonist GW6471, PPARγ agonist rosiglitazone, or PPARδ agonist GW501516) (n = 4). D, excitation and emission relative fluorescence of the human PPARα ligand-binding domain (hPPARα-LBD) was measured in the presence and absence of bilirubin (50 μm) (n = 3). E, bilirubin's excitation relative fluorescence was measured in the presence and absence of the PPARα ligand-binding domain alongside other known PPARα ligands (n = 3). F, mitochondrial respiration was measured in fully differentiated 3T3-L1 adipocytes that were treated for 24 h with vehicle (DMSO), biliverdin (50 μm), WY 14,643 (50 μm), or rosiglitazone (10 μm) (n = 8). G, 3T3L1 cells were differentiated into mature adipocytes treated with vehicle (DMSO), biliverdin (from 1, 10, or 50 μm) over the differentiation protocol. Lipid accumulation was measured by Nile red staining (green) and densitometry (n = 3). H, ChIP in fully differentiated 3T3-L1 adipocytes treated for 24 h with vehicle (DMSO), biliverdin (50 μm), or WY-14,643 (50 μm) (n = 6-8). Data are presented as means ± S.E. (error bars) *, p < 0.05; **, p < 0.01; ***, p < 0.001.
To determine whether bilirubin directly binds PPARα, we used the autofluorescent properties of bilirubin, which has been extensively studied for bilirubin bound to albumin (Fig. S1B) (34–37). When bilirubin binds albumin and is excited by light, it undergoes a conformational change (Z → E configuration). This configuration, now photobilirubin/lumirubin, allows for greater mobility of the pyrrole rings and subsequent emission behavior (38–40). Utilizing the property of bilirubin to fluoresce, aside from when bound to albumin, we found that the purified PPARα-LBD protein interacts with bilirubin and, when excited, has fluorescence (Fig. 1D). We used this method to determine whether we could displace bilirubin-PPARα fluorescence with the known ligand fenofibrate, which does not induce fluorescence under excitation when bound to PPARα. Hence, this represents a competitive ligand-binding assay by displacement of the bilirubin-PPARα interaction, reducing fluorescence. Using purified full-length PPARα protein, we treated with bilirubin and compared it with cotreatments of fenofibrate and bilirubin. We found that fenofibrate significantly reduced bilirubin-PPARα autofluorescence (Fig. 1E). Furthermore, oleic acid, an unsaturated fatty acid that is an endogenous ligand for PPARα, reduced the bilirubin-PPARα fluorescent signal (Fig. S1C). The competitive inhibition was specific for PPARα, as fenofibrate did not displace bilirubin-albumin autofluorescence (Fig. S1B). These data indicate that bilirubin is an endogenous ligand that binds directly to the PPARα LBD.
Bilirubin enhances white adipocyte mitochondrial activity
To compare the effects of bilirubin on PPARα or PPARγ and mitochondrial function, we used a SeaHorse XFe96 analyzer to measure oxygen consumption rate (OCR) in fully differentiated 3T3-L1-WAT adipocytes treated with biliverdin, WY 14,643 (PPARα agonist), or rosiglitazone (PPARγ agonist). Biliverdin treatments serve as a prodrug for bilirubin, as it is only different by a double bond (41), making it more soluble. Biliverdin is rapidly reduced to bilirubin in cell culture (42–46) and in vivo (31, 47), and conversion is essential for metabolic responsiveness (47, 48). Not surprisingly, we found that biliverdin and WY 14,643 significantly increased the mitochondrial OCR for maximum respiration (Fig. 1F). Biliverdin significantly elevated ATP production, which was not observed with rosiglitazone or WY 14,643. Rosiglitazone, but not biliverdin or WY 14,643, significantly enhanced the coupling efficiency. Basal respiration in fully differentiated 3T3-L1-WAT adipocytes has been shown to be significantly higher than in undifferentiated cells (OCR ∼350 compared with ∼50-75) (49, 50). None of the ligands affected basal respiration or nonmitochondrial respiration and proton leak. These results indicate that bilirubin functions similarly to known PPARα ligands to enhance mitochondrial function.
To determine whether bilirubin reduces lipid accumulation by enhancing mitochondrial function in adipocytes, we treated 3T3-L1 cells, a WAT-type murine preadipocyte cell line that differentiates to full adipocytes, with increasing concentrations of biliverdin over the 9-day adipocytic differentiation protocol. Biliverdin treatments significantly reduced lipid accumulation at 1, 10, and 50 μm (Fig. 1G). The highest level of biliverdin (50 μm) substantially decreased lipid accumulation and significantly increased mRNA expression of mitochondrial and lipid-burning genes Ucp1 and Cpt1 (Fig. S1D). Both PPARγ and PPARα have been shown to up-regulate the expression of Ucp1 (16, 23, 24, 51–53). However, Cpt1 is considered PPARα-dependent (54). To investigate whether bilirubin is driving PPARα to the promoters of Ucp1 and Cpt1 to improve mitochondrial function, we treated fully differentiated 3T3-L1 WAT adipocytes with biliverdin or WY 14,643 and then performed ChIP with an antibody specific to PPARα or control antibody for GFP. In Fig. 1H, we show that biliverdin significantly increased PPARα occupancy of two previously established PPREs at the 13K enhancer of the Ucp1 (identified in Ref. 55) and the −3306 to −3109 region of the Cpt1 promoter (defined in Ref. 56). WY 14,643 stimulated PPARα occupancy at both genes, but only significantly higher at the Cpt1 promoter.
To investigate the specific role of bilirubin in PPARα or PPARγ on mitochondrial function, we generated 3T3-L1 cells that overexpressed each receptor (3T3-PPARα or 3T3-PPARγ2) via lentivirus (Fig. 2, A and B). As controls, we used empty lentiviral vector–infected 3T3-L1 cells (3T3-Vector), which have very low expression or do not express the receptors in the undifferentiated state. The 3T3-Vector cells had no responses to biliverdin in Fig. 2 (A or B). Biliverdin treatments in the 3T3-PPARα cells caused significantly higher maximum respiration, basal respiration, proton leak, and ATP production (Fig. 2A). The 3T3-PPARγ2 cells had no significant changes in mitochondrial respiration with biliverdin treatments. Also, biliverdin treatments in the 3T3-PPARγ2 or 3T3-Vector had no transcriptome responses on known PPARγ target genes Fabp4, Cd36, Fgf21, or Angptl4 (Fig. S2). These results indicate that bilirubin selectively binds PPARα to induce activity and occupancy at the Ucp1 and Cpt1 promoters to drive expression, which overall enhances mitochondrial function in white adipocytes, reducing lipid accumulation.
Figure 2.
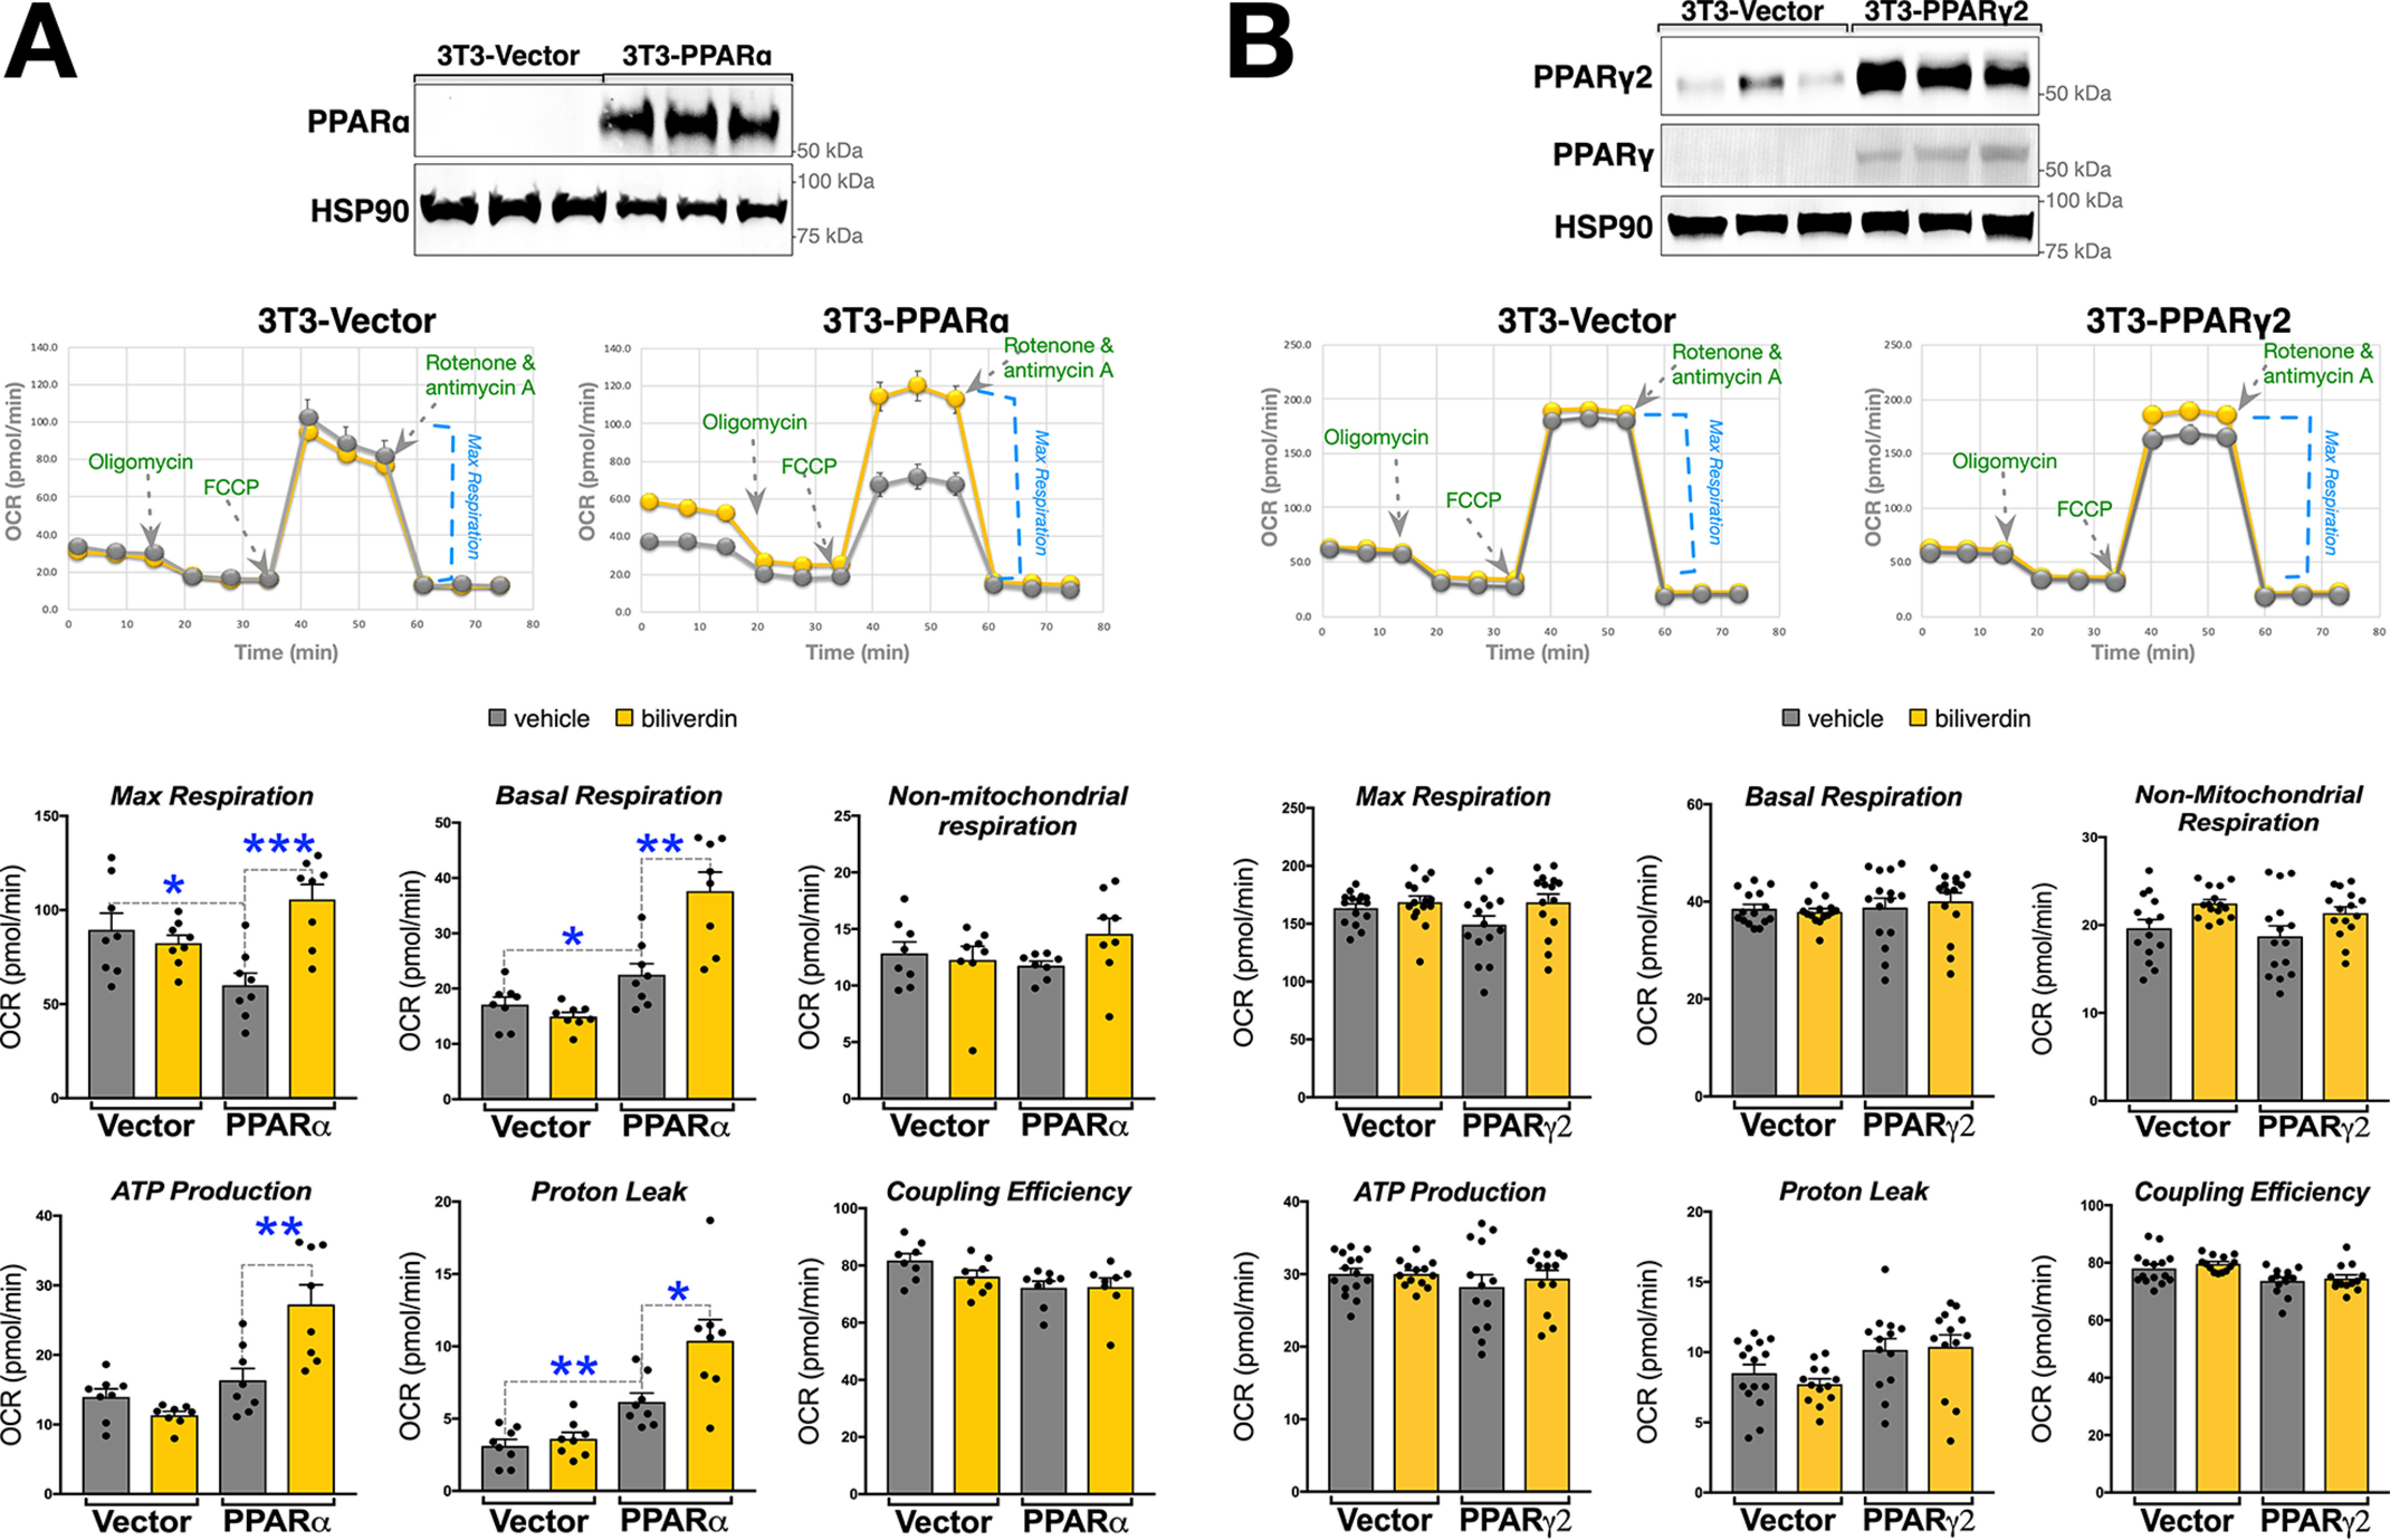
Bilirubin enhances mitochondrial function in WAT cells via PPARα. A, PPARα lentiviral overexpression in 3T3L1 cells (3T3-PPARα) and vector (3T3-Vector). Shown is immunoblotting of PPARα and HSP90 for loading control and mitochondrial respiration of 3T3-PPARα or 3T3-Vector that were treated for 24 h with vehicle (DMSO) or biliverdin (50 μm) (n = 8). B, PPARγ2 lentiviral overexpression in 3T3L1 cells (3T3-PPARγ2) and vector (3T3-Vector). Shown is immunoblotting of PPARγ2, PPARγ, and HSP90 for loading control and mitochondrial respiration of 3T3-PPARα or 3T3-Vector that were treated for 24 h with vehicle (DMSO) or biliverdin (50 μm) (n = 15). Data are presented as means ± S.E. (error bars). *, p < 0.05; **, p < 0.01; ***, p < 0.001.
Bilirubin enhances mitochondrial function but not lipid levels in brown adipocytes
We next evaluated energy expenditure by SeaHorse analysis in a murine BAT cell line (described in Refs. 57 and 58) treated with biliverdin, rosiglitazone, or WY 14,643 (Fig. 3A). The WY 14,643 and biliverdin treatments had results similar to the 3T3-L1 WAT model in that maximum respiration was significantly higher. Also, in the BAT cells, WY 14,643 and biliverdin treatments stimulated ATP production and proton leak. Rosiglitazone did not affect mitochondrial function in the BAT cells. Interestingly, increasing doses of biliverdin over the differentiation of the BAT cells had no impact on lipid accumulation (Fig. 3B), which was observed in 3T3-L1 WAT adipocytes. However, treatment with biliverdin, WY 14,463, and rosiglitazone in differentiated BAT cells caused a significant increase in Ucp1 mRNA (Fig. 3C). BAT cells respond sympathetically via the β3 adrenergic receptor (Adrb3), which induces excitation of BAT thermogenesis (17–22). Of the three ligands, only biliverdin significantly induced Adrb3 expression. There have been no previously identified PPREs in the Adrb3 promoter. Therefore, we performed in silico analysis of the Adrb3 promoter using the TRED (Transcriptional Regulatory Element Database) matrix search for PPREs. We found 14 potential PPREs and analyzed the highest five predicted PPREs by a ChIP assay with an antibody specific to PPARα (described above) in the BAT cells (Fig. S3A). We found that the enhancer region of the Adrb3 gene had the highest PPARα occupancy with biliverdin treatment. To further delineate whether bilirubin is increasing Adrb3 in a PPARα-dependent manner, we cloned the proximal (−2816 to +118) and enhancer (−4770 to −4,430) regions of the murine promoter in the luciferase pGL4.10 construct. We transfected the constructs with or without PPARα in receptorless COS7 cells, as we have described previously (25, 47). The proximal promoter had no response with or without PPARα expressed (Fig. 3E). However, there was a significant increase with PPARα overexpression with the enhancer region, which was significantly higher with biliverdin treatment. Similar to the mRNA and ChIP responses, WY 14,643 did not increase PPARα activity at the Adrb3 promoter-luciferase construct. By in silico analysis, we identified two potential PPREs in the enhancer region, and mutations in each separately attenuated luciferase activity with biliverdin (Fig. 3F). WY 14,643 and biliverdin increased the occupancy of PPARα at the Ucp1 and the Cpt1 promoters in BAT cells (Fig. S3B).
Figure 3.
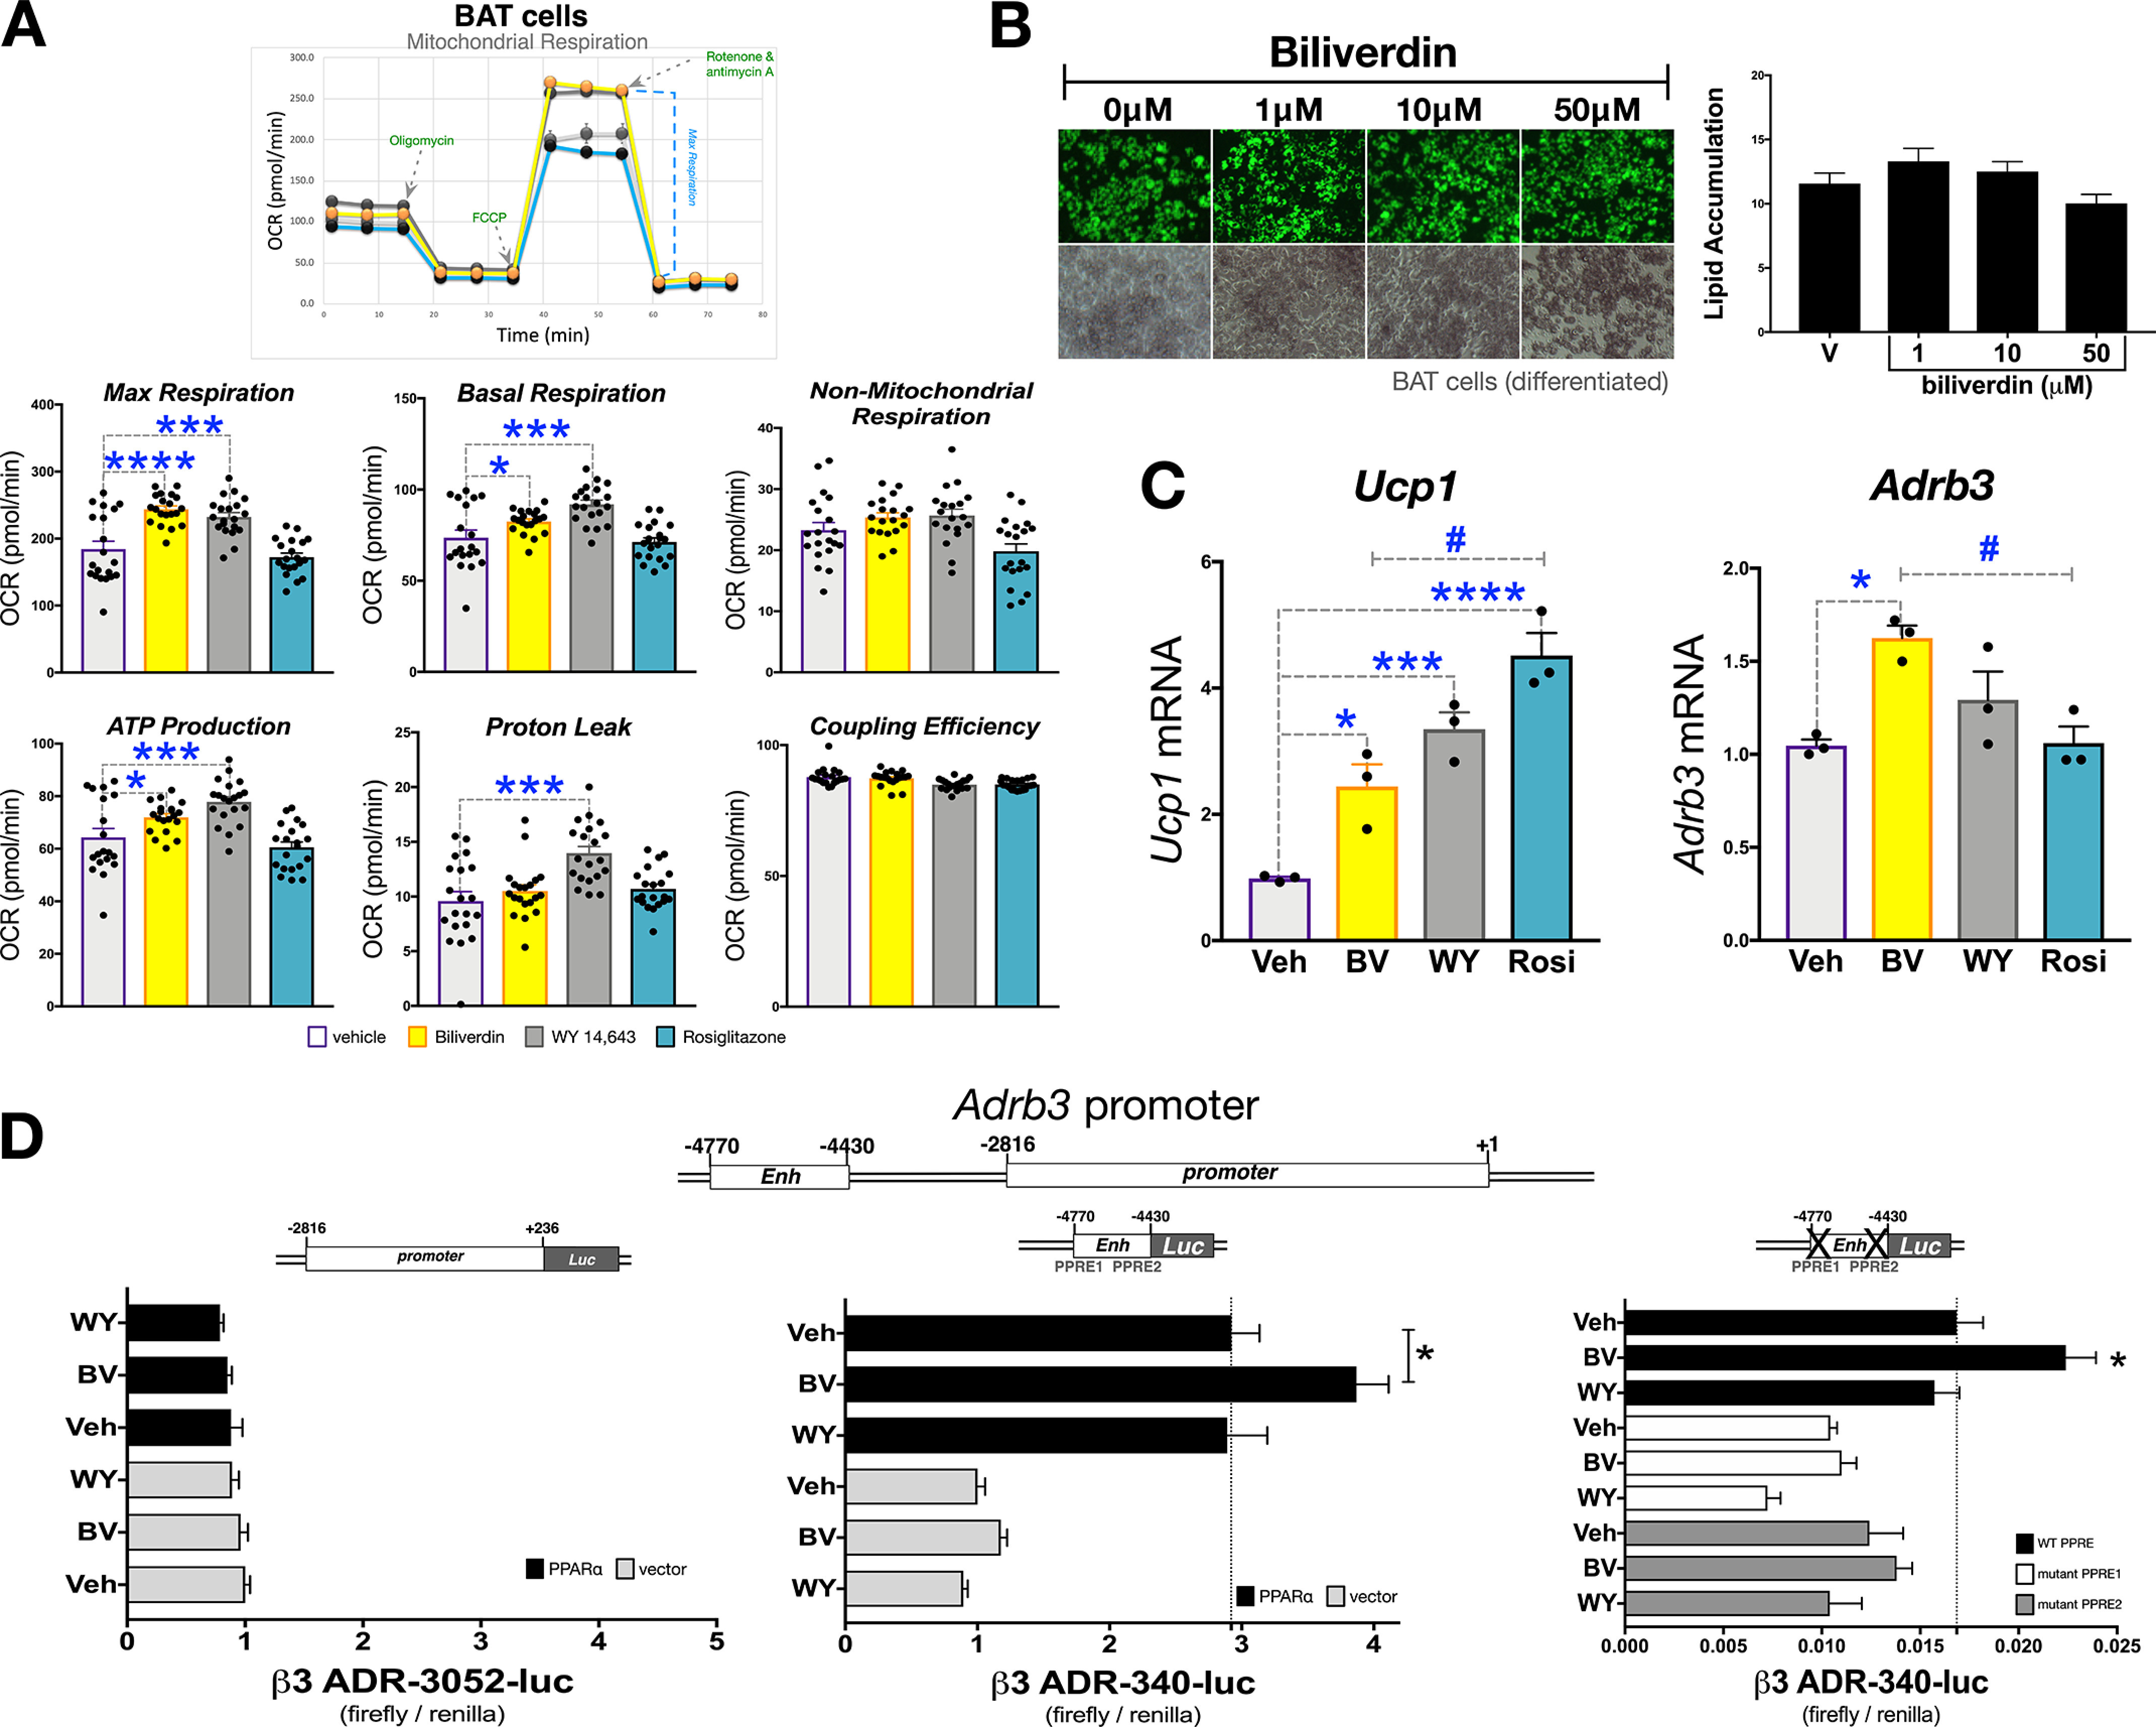
Bilirubin increases mitochondrial function BAT cells, but no effect on lipid levels. A, mitochondrial respiration was measured in BAT cells that were treated with vehicle (DMSO), biliverdin (50 μm), WY-14,643 (50 μm), or rosiglitazone (10 μm). (n = 20). B, BAT cells were differentiated into mature adipocytes and treated with vehicle (DMSO), biliverdin (from 1, 10, or 50 μm) over the differentiation protocol. Lipid accumulation was measured by Nile red staining (green) and densitometry (n = 3). C, mature BAT cells were treated for 24 h with biliverdin (50 μm), WY 14,643 (50 μm), or rosiglitazone (10 μm); RNA was extracted; and Ucp1 and Adrb3 expression was measured via realtime PCR (n = 3). D, transiently transfection of the proximal (−2,816 to +236), upstream enhancer (−4,770 to −4,430), or PPRE1 and PPRE2 mutant Adrb3 promoters for 24 h in receptorless COS7 cells. Afterward, cells were treated for 24 h with biliverdin (50 μm), WY-14,643 (50 μm), or vehicle (DMSO) (n = 4-8). Data are presented as means ± S.E. (error bars). *, p < 0.05; **, p < 0.01; ***, p < 0.001.
Although these results show that the actions of bilirubin to improve mitochondrial function are selective and PPARα-dependent, we wanted to validate these findings. We used CRISPR technology to develop PPARα knockout (KO) and established two null clone lines of the BAT cells (Fig. S4). We treated the BAT PPARα CRISPR KO cells (clone 1 and 2) and WT cells with biliverdin or WY 14,643 for 24 h and determined the impact on mitochondrial function via Seahorse analysis. The WT BAT cells responded similarly to the 3T3-L1 WAT adipocytes with increased OCR with WY 14,643 and biliverdin for the maximum respiration, basal respiration, and ATP production (Fig. 4, A and B). The function of the ligands was lost in both clones for the PPARα CRISPR KO BAT cells. These results indicate that bilirubin is driving PPARα to the Ucp1, Cpt1, and Adrb3 genes to stimulate BAT mitochondria function but for unknown reasons does not impact lipid accumulation in brown adipocytes.
Figure 4.
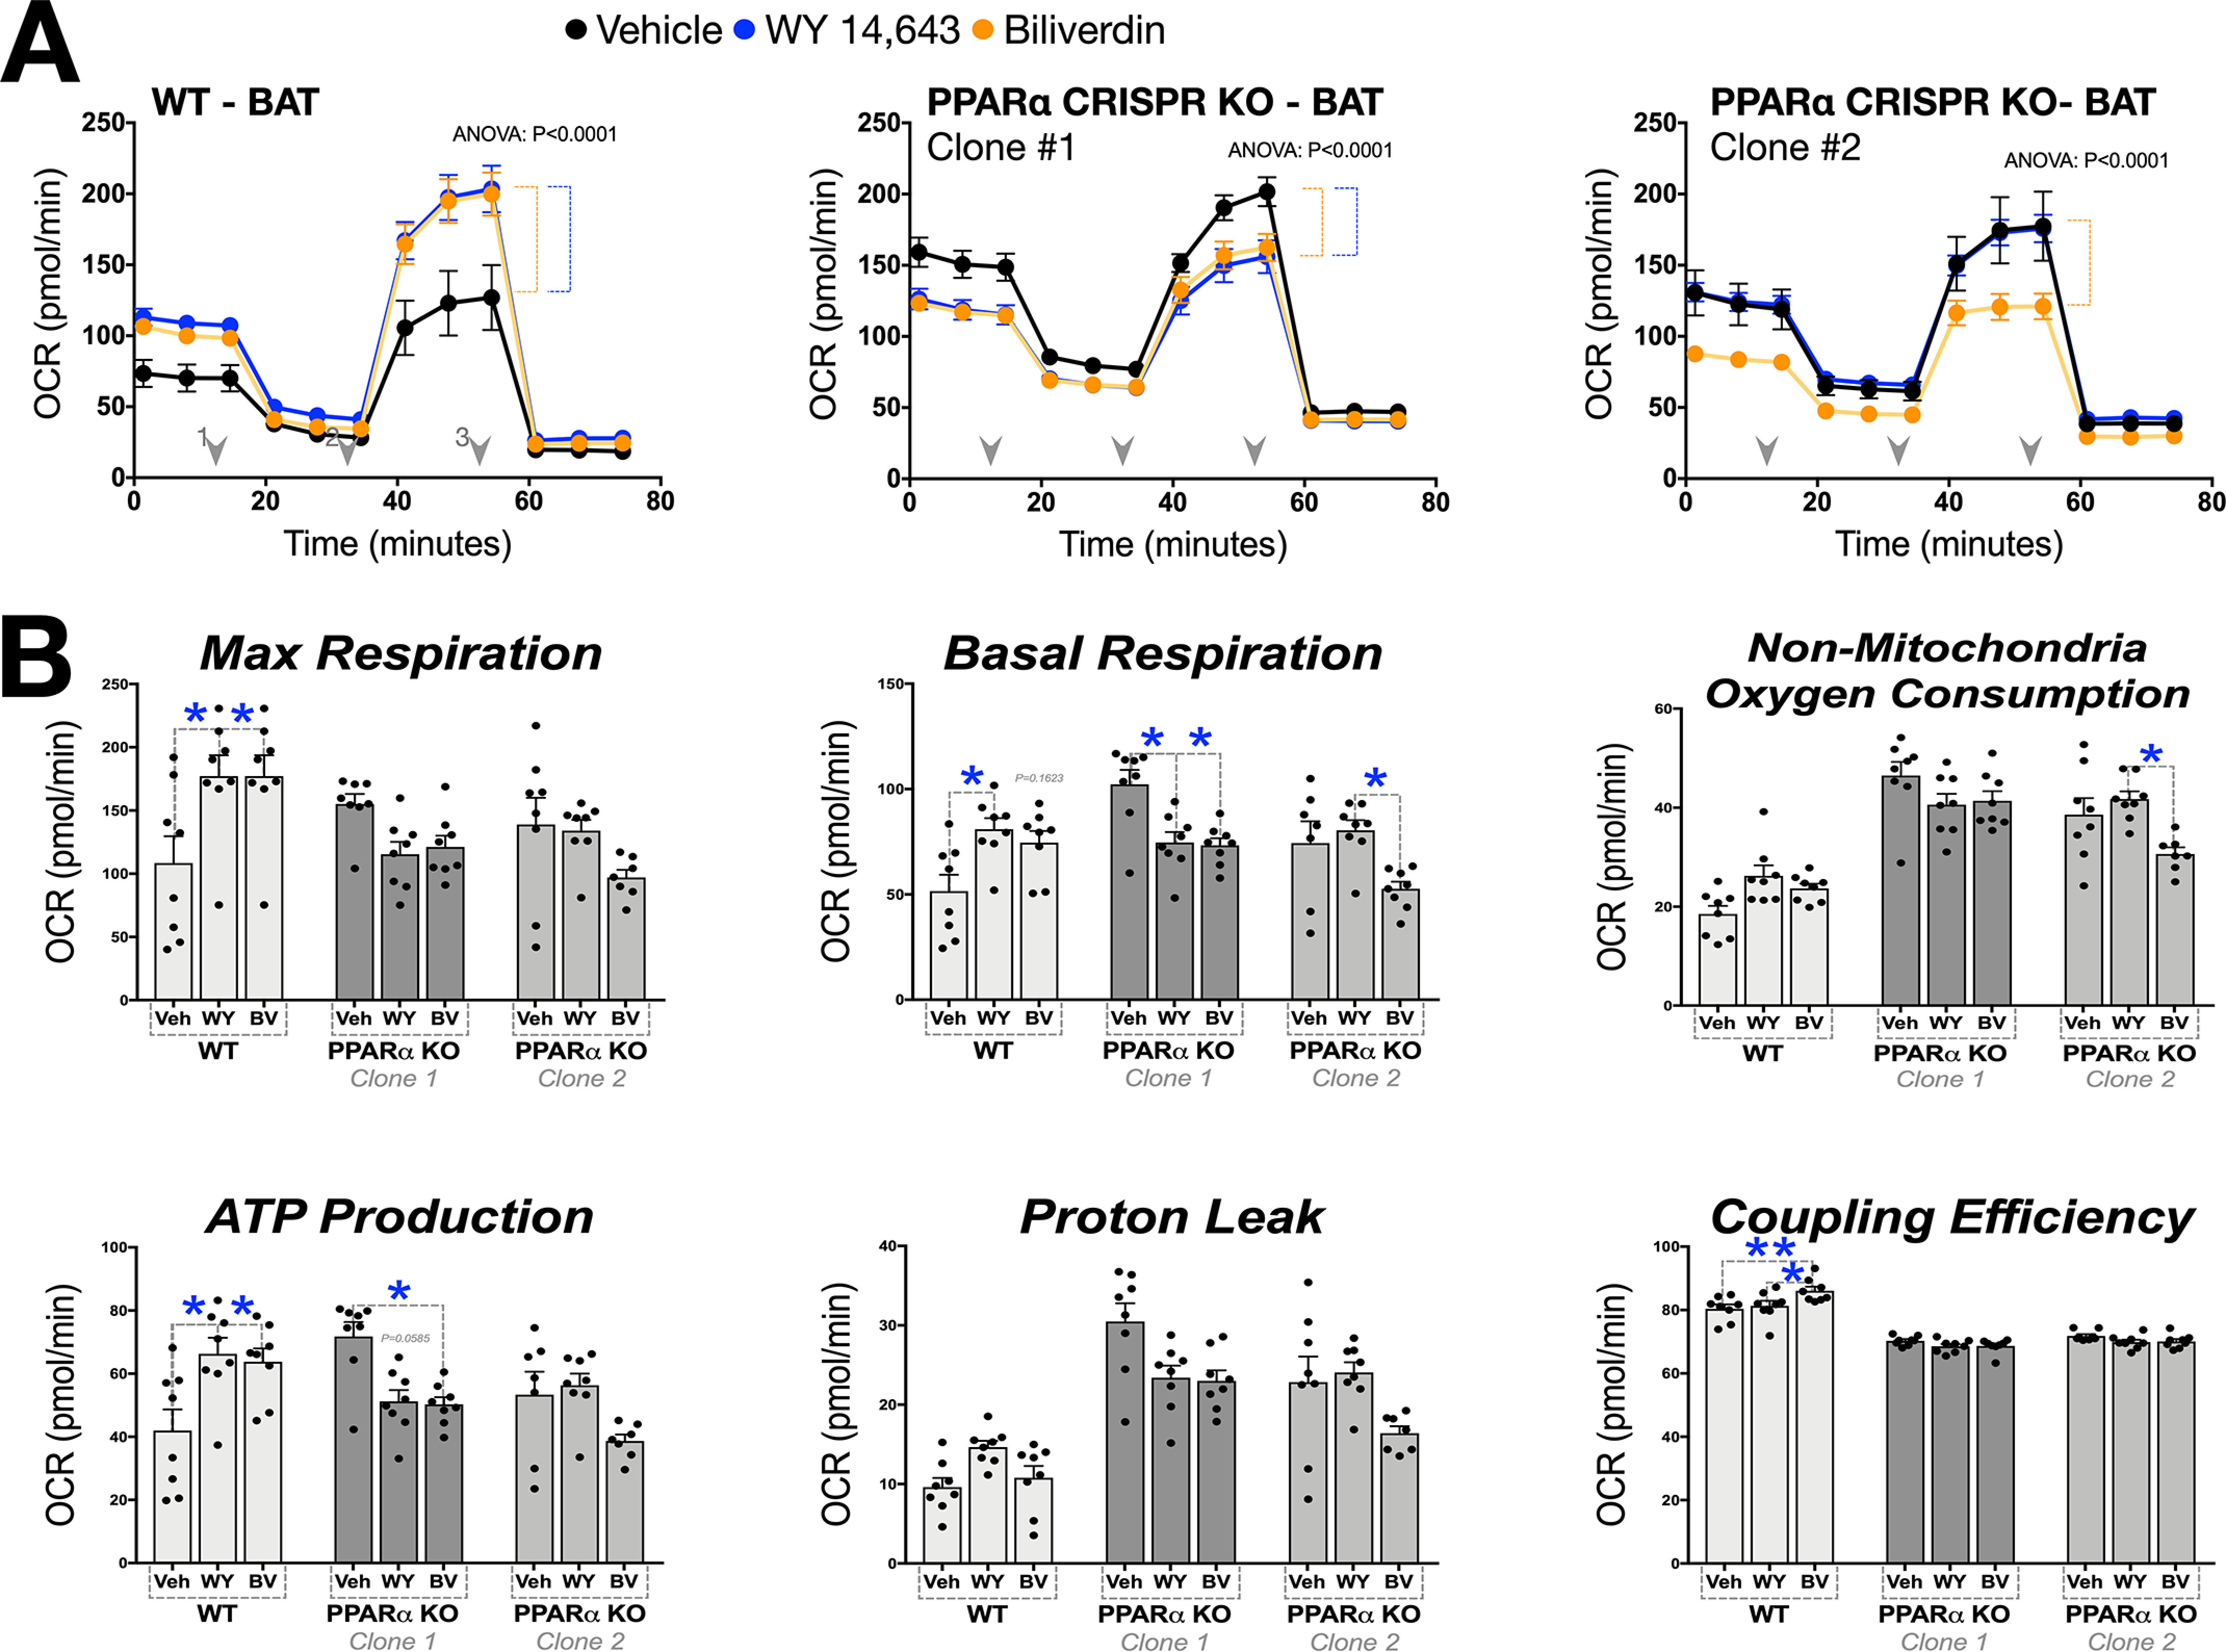
CRISPR-mediated loss of PPARα inhibits bilirubin-induced mitochondrial function. A, mitochondrial respiration was measured in WT BAT cells and two CRISPR PPARα knockout clones. Each cell type was treated with biliverdin (50 μm), WY-14,643 (50 μm), or vehicle (DMSO) (n = 8). B, detailed mitochondrial respiration perimeters were graphed (n = 8). Data are presented as means ± S.E. (error bars). *, p < 0.05; **, p < 0.01; ***, p < 0.001.
Bilirubin causes coregulator binding and dissociation to PPARα
The molecular determinants that dictate selectivity of PPARα-coregulator interactions are mostly unknown. PPARα ligands have different binding affinities, which may result in slight conformational changes in the protein, and this can potentially lead to divergent PPARα transcriptional activity because of a specific set of coregulators that are recruited or dissociated by ligand binding. These variances in PPARα activity have been shown between fenofibrate and WY 14,643 (59, 60). To determine whether bilirubin binding similarly causes an exchange of coregulators for PPARα, we used the PamGene nuclear hormone receptor (NHR) chip that utilizes MARCoNI (microarray assay for real-time coregulator-nuclear receptor interaction) technology that contains peptides for 135 motifs for 64 different coregulators (61). A previously published broad comparison of nuclear receptor-LBDs and coregulator binding included examination for the GST-tagged human PPARα-LBD (described in Ref. 61) and potential coregulators that interact in the unliganded state.
We utilized this method for our first comparison of bilirubin, fenofibrate, and WY 14,643 and how these PPARα ligands would differentiate between coregulator motifs. Using purified GST-tagged hPPARα-LBD, we applied the ligands to the NHR chip and performed the MARCoNI analysis using an anti-GST antibody. We subtracted the signal intensity for results of each ligand from the vehicle-treated group to reflect coregulators that had higher binding (recruitment) or less binding (dissociation) to the hPPARα-LBD and define these changes as the “molecular signature” across all of the 135 motifs. The molecular signatures identify a specific trait for bilirubin, fenofibrate, and WY 14,643 and all showed coregulator recruitment and dissociation for each ligand (Fig. 5A). To determine whether bilirubin also affected coregulator binding to murine PPARα, we purified bacterially expressed His-tagged full-length mPPARα protein. We performed a similar investigation with the ligands as above using the NHR chip, but for this study, we used an anti-PPARα antibody for the MARCoNI analysis. The results overall showed similarities to the hPPARα-LBD molecular signature (Fig. 5B). However, there was a more robust response for bilirubin and less for WY 14,643. Fenofibrate showed a similar molecular signature between hPPARα and mPPARα coregulator responses. In Fig. 5C, heat map analysis for comparison of bilirubin, fenofibrate, and WY 14,643 on coregulator response to the hPPARα-LBD, showed a diverse regulation for each ligand. There was an overlap for some effects on coregulator action across ligands. The mPPARα full-length protein responded similarly to the hPPARα-LBD, but bilirubin responses were more robust (Fig. 5D). These studies are the first systematic characterization of the binding between ligands with the human PPARα-LBD and mPPARα and how bilirubin affects binding to coregulator motifs. These data show that bilirubin has direct binding to the hPPARα and mPPARα LBDs and induces recruitment and dissociation of coregulators. The variances in coregulator recruitment may explain the differential in gene regulation and physiological responses with each ligand.
Figure 5.
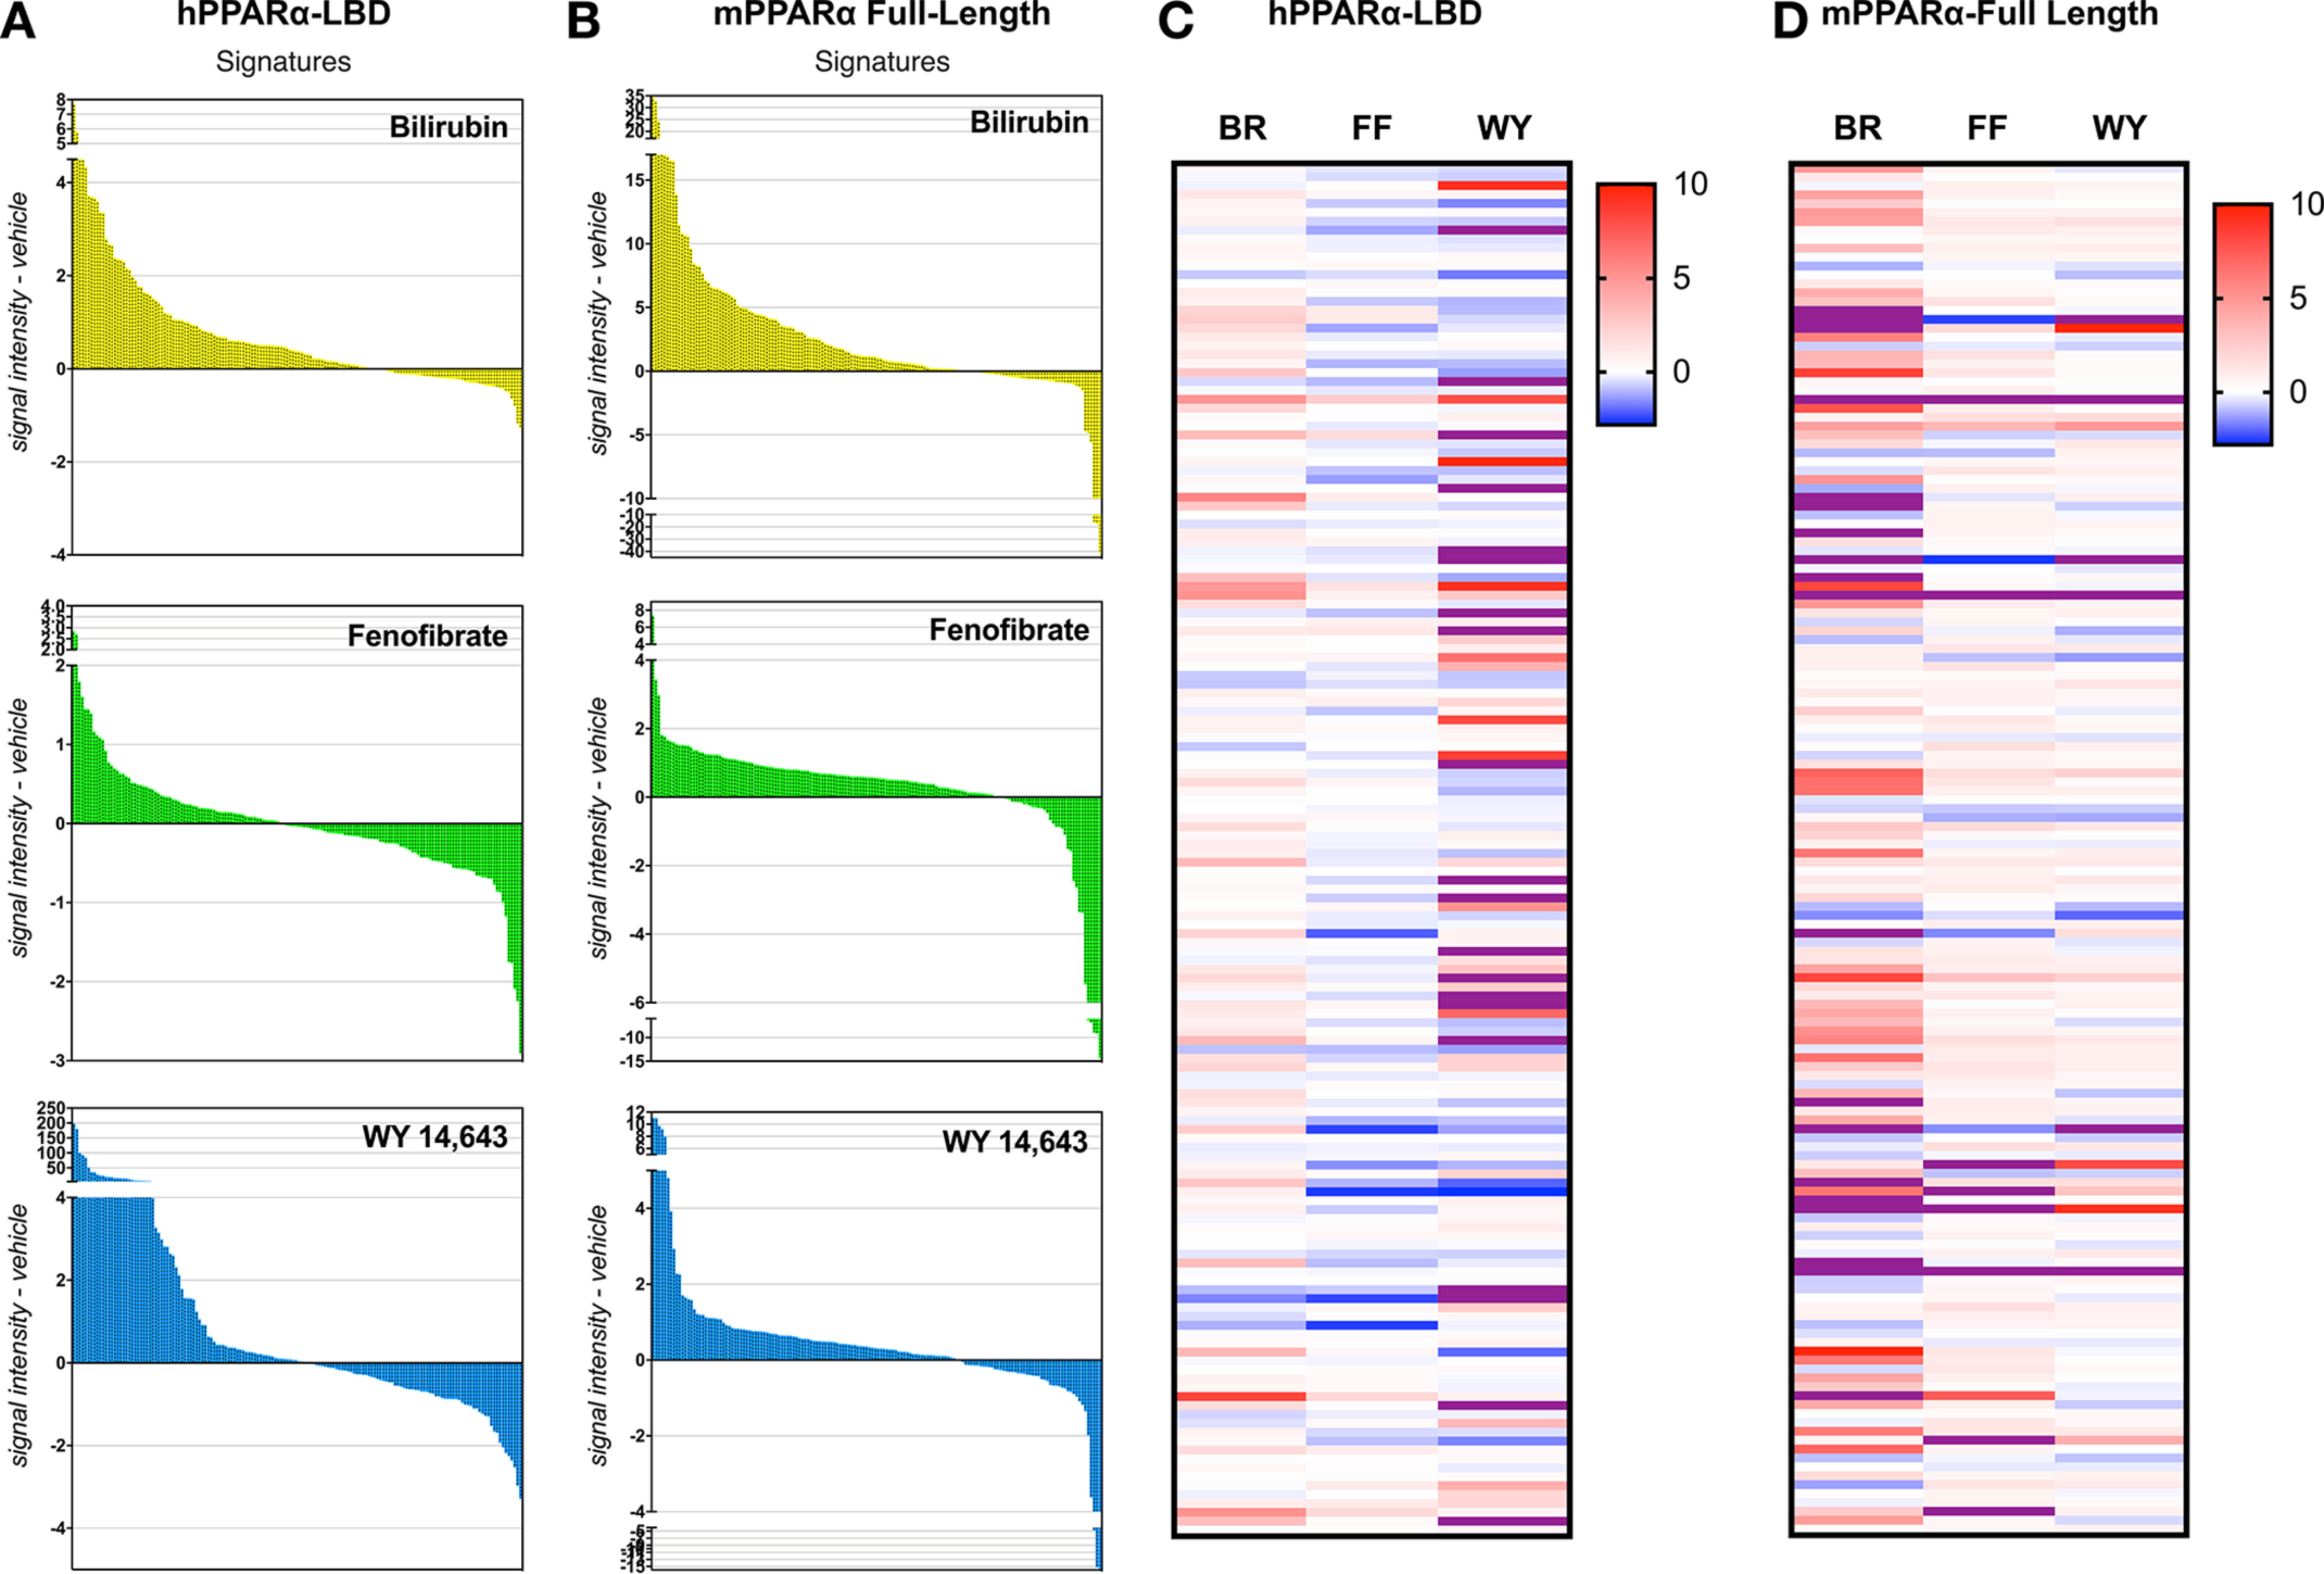
Bilirubin causes coregulator binding and dissociation to PPARα. Purified hPPARα-LBD or mPPARα full-length proteins treated with bilirubin (50 μm), WY-14,643 (50 μm), or vehicle (DMSO) were analyzed via a PamGene PamStation NHR coregulator chip by MARCoNI analysis. Molecular signatures were measured by the signal intensity of each ligand subtracted from vehicle for hPPARα-LBD (A) or mPPARα full-length proteins (B). Shown is a heatmap of the MARCoNI analysis for comparisons of ligand treatments for coregulator intensity subtracted from vehicle for hPPARα-LBD (C) or hPPARα-LBD mPPARα full-length proteins (D).
Obese mice treated with bilirubin have higher WAT mitochondrial function and restructuring of the PPARα coregulator profile
To determine whether bilirubin improves adipocyte function in the obese, we treated diet-induced obese (DIO) mice with the recently described water-soluble PEGylated bilirubin (PEG-BR) (62, 63). Mice were fed a high-fat diet (HFD) for 24 weeks and then treated for 4 weeks with PEG-BR while maintaining the HFD. At the start of the study, the obese mice had very low bilirubin levels (Fig. 6A), which has been reported in obese humans (1). The 4-week PEG-BR treatment significantly increased plasma bilirubin levels. In Fig. 6 (B and C), we show that the 4-week treatment with PEG-BR in obese mice caused a significant reduction in blood glucose, body mass, and fat mass and increased lean mass. The plasma glycerol and free fatty acid levels were significantly lower with PEG-BR compared with vehicle-treated obese mice (Fig. 6D), indicating reduced lipolysis in adipose tissue. The WAT size was significantly reduced (p < 0.05), and WAT mitochondrial function and number were higher (Fig. 6E). Measurement of the fat-burning genes Ucp1 and Adrb3 in WAT was higher (Fig. 6F). Interestingly, PEG-BR did not affect BAT size or mitochondrial function or number or expression of Ucp1 and Adrb3 (Fig. 6G). There were also no significant changes in PPARα expression in WAT and BAT tissues. MARCoNI analysis of coregulators bound to PPARα in WAT of obese mice treated with PEG-BR and vehicle for endogenous PPARα, showed that bilirubin induces the binding (positive) and dissociation (negative) of coregulators that indicate the molecular signature of bilirubin-bound PPARα (Fig. 6H). The highest binding results of the MARCoNI assay revealed that PEG-BR enhanced binding with several coactivators; most notable were several nuclear receptor coactivators (NCOA2, NCOA3, NCOA6, NCOA1, and NCOA4), ligand-induced MED1, and peroxisome proliferator-activated receptor γ coactivator 1-α (PGC-1α) (Fig. 6H). There was also higher binding of some corepressor motifs, such as NCOR1. The coregulators with reduced binding (lowest) showed that several proteins had reduced interaction when PPARα was bound by bilirubin. Most notably, interaction with known corepressors CCR4-NOT transcription complex subunit 1 (CNOT1), nuclear receptor–interacting protein 1 (NRIP1, also known as RIP140), and nuclear corepressor (NCOR) were reduced with bilirubin-bound PPARα. These data show that bilirubin causes corepressor proteins that interact with PPARα to dissociate and causes recruitment of coactivators, which together improve WAT function. The bilirubin-PPARα–induced binding to some corepressor motifs may be related to their inhibitory actions to reduce fat accumulation.
Figure 6.
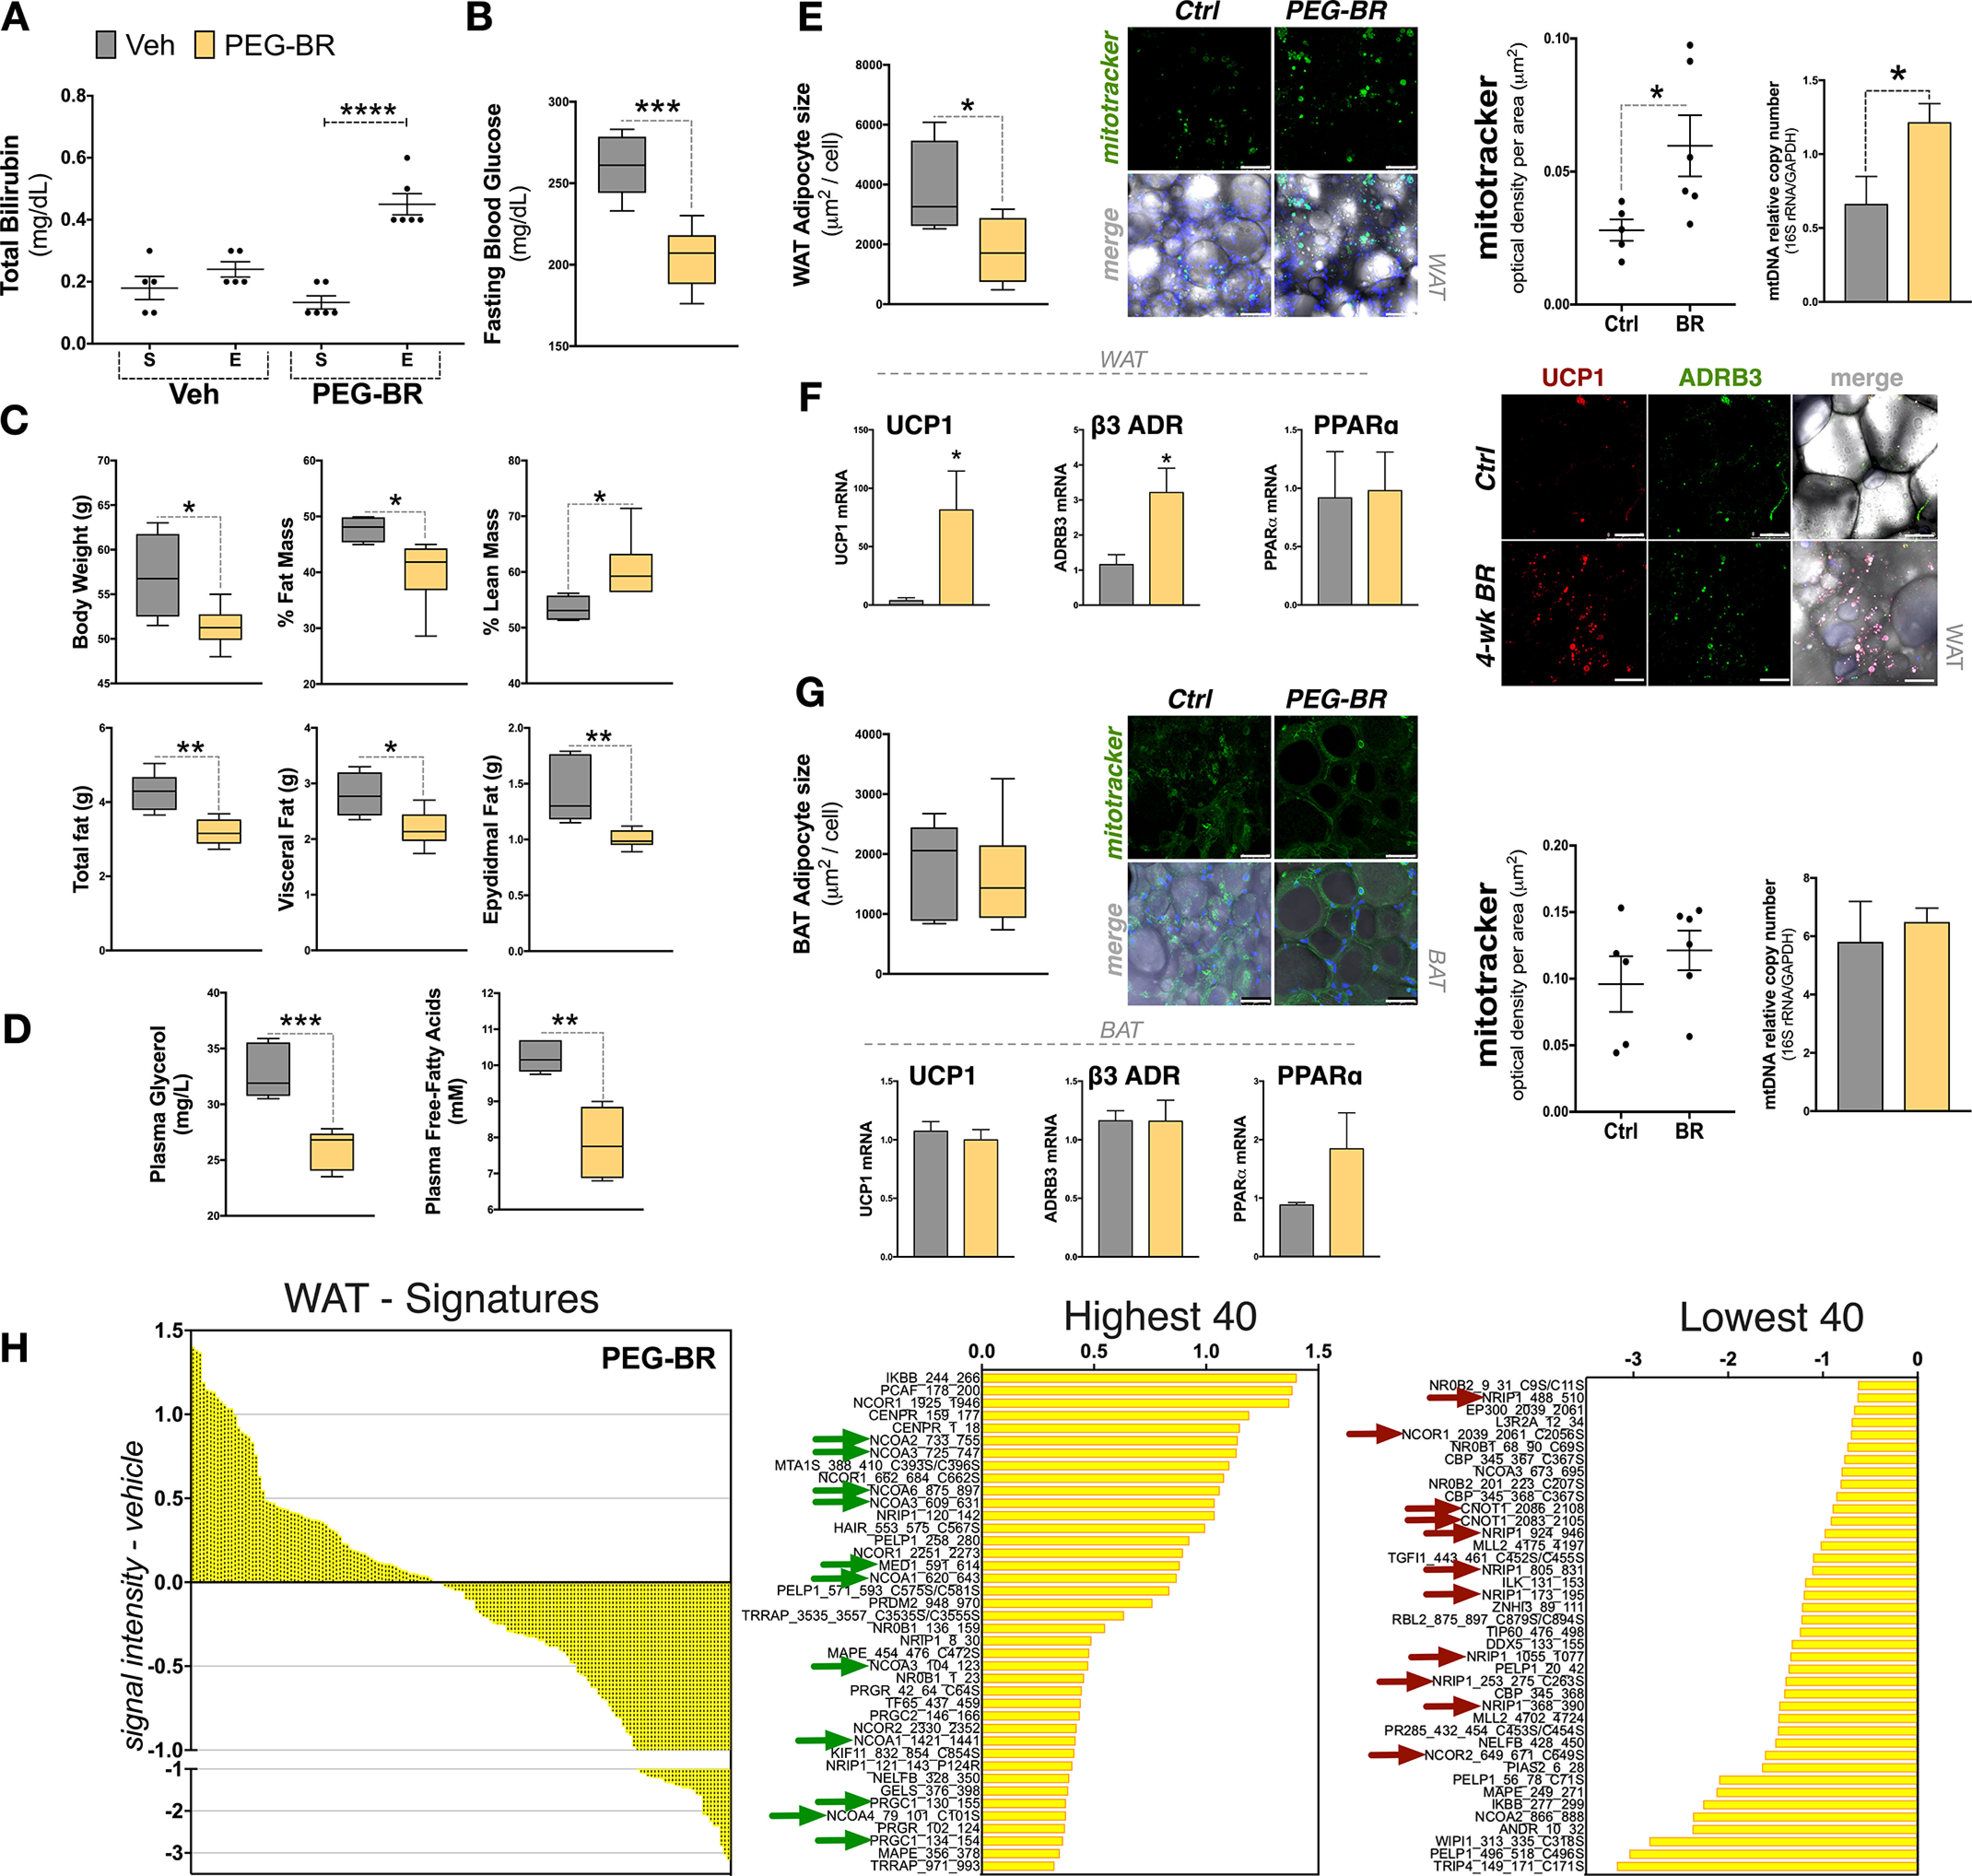
Obese mice treated with bilirubin have higher WAT mitochondrial function by enhanced coregulator recruitment to PPARα. A, total bilirubin levels of 24-week high-fat diet–fed DIO mice treated for 4 weeks with PEG-BR or vehicle (Veh) from start (S) to the end (E) of study (PEG-BR, n = 6; Veh, n = 5). B, fasting glucose levels in PEG-BR or Veh DIO mice at the end of the 4-week treatment. C, body composition of the PEG-BR or Veh DIO mice; body weight, percentage of fat mass, percentage of lean mass, grams of total fat, visceral fat, and epidydimal fat (PEG-BR, n = 6; Veh, n = 5). D, plasma glycerol and free fatty acids in PEG-BR or Veh DIO mice at the end of the 4-week treatment (PEG-BR, n = 5; Veh, n = 5). E. WAT adipocyte size, Mitotracker staining, and mitochondrial DNA content in Veh– versus PEG-BR–treated DIO mice (PEG-BR, n = 6; Veh, n = 5) (scale bars, 50 μm). F, WAT analysis for real-time PCR for Ucp1, Adrb3, or PPARα mRNA expression (n = 5-6) and immunostaining of UCP1 and ADRB3 expression (scale bars, 75 μm). G, BAT analysis for adipocyte size, MitoTracker staining, mitochondrial DNA content, and real-time PCR for Ucp1, Adrb3, or PPARα mRNA expression in Veh– versus PEG-BR–treated DIO mice (PEG-BR, n = 6; Veh, n = 5) (scale bars, 50 μm). H, WAT molecular signature of PEG-BR–treated DIO mice (subtracted from vehicle). The 40 most highly recruited and 40 most highly dissociated coregulators are identified. Green arrows, known coactivators; red arrows, corepressors (n = 5–6 pooled). Data are presented as means ± S.E. (error bars). *, p < 0.05; **, p < 0.01; ***, p < 0.001.
High-fat diet–fed mice with hyperbilirubinemia are resistant to WAT hypertrophy by hyperphosphorylation of PPARα, reshaping the coregulator profile
We have recently shown that mice with the human Gilbert's polymorphism (HuUGT*28) are resistant to HFD-induced weight gain and hepatic steatosis (64). Using this model, we analyzed the impact of hyperbilirubinemia on WAT and whether this would alter coregulators interacting with PPARα. In Fig. 7A, we show that the HuUGT*28 mice had significantly smaller WAT size and higher mitochondrial number. Comparable with the PEG-BR–treated animals, the HuUGT*28 mice had no significant changes in BAT mitochondria or adipocyte size (data not shown). We previously found that the liver of the HuUGT*28 mice had higher PPARα activation because of reduced serine 73 phosphorylation (64), which is known to cause ubiquitination and reduced expression (47). However, serine 12 phosphorylation of PPARα is necessary for activation (65). Here, we show that the HuUGT*28 mice had significantly higher phosphorylation of serine 12 of PPARα in WAT (Fig. 7B). The MARCoNI analysis was performed as described for the PEG-BR–treated animals described above for endogenous PPARα in WAT of the HuUGT*28 and control mice. The results revealed that PEG-BR treatment and the HuUGT*28 hyperbilirubinemia mice have similarities in response to PPARα coregulator binding and molecular signatures (Fig. 7C). The HuUGT*28 mice were also comparable with the PEG-BR–treated mice with higher binding with several coactivators (MED1, NCOA2, NCOA3, NCOA1, and PGC1α; indicated by green arrows) and reduced binding with corepressors (CNOT1, NRIP1, NCOR, and ligand-induce corepressor (LCOR); indicated by red arrows). Overall, the HuUGT*28 mice with hyperbilirubinemia have an active state of PPARα, prompting phosphorylation and restructuring of coregulators bound, mediating WAT size and mitochondrial number.
Figure 7.
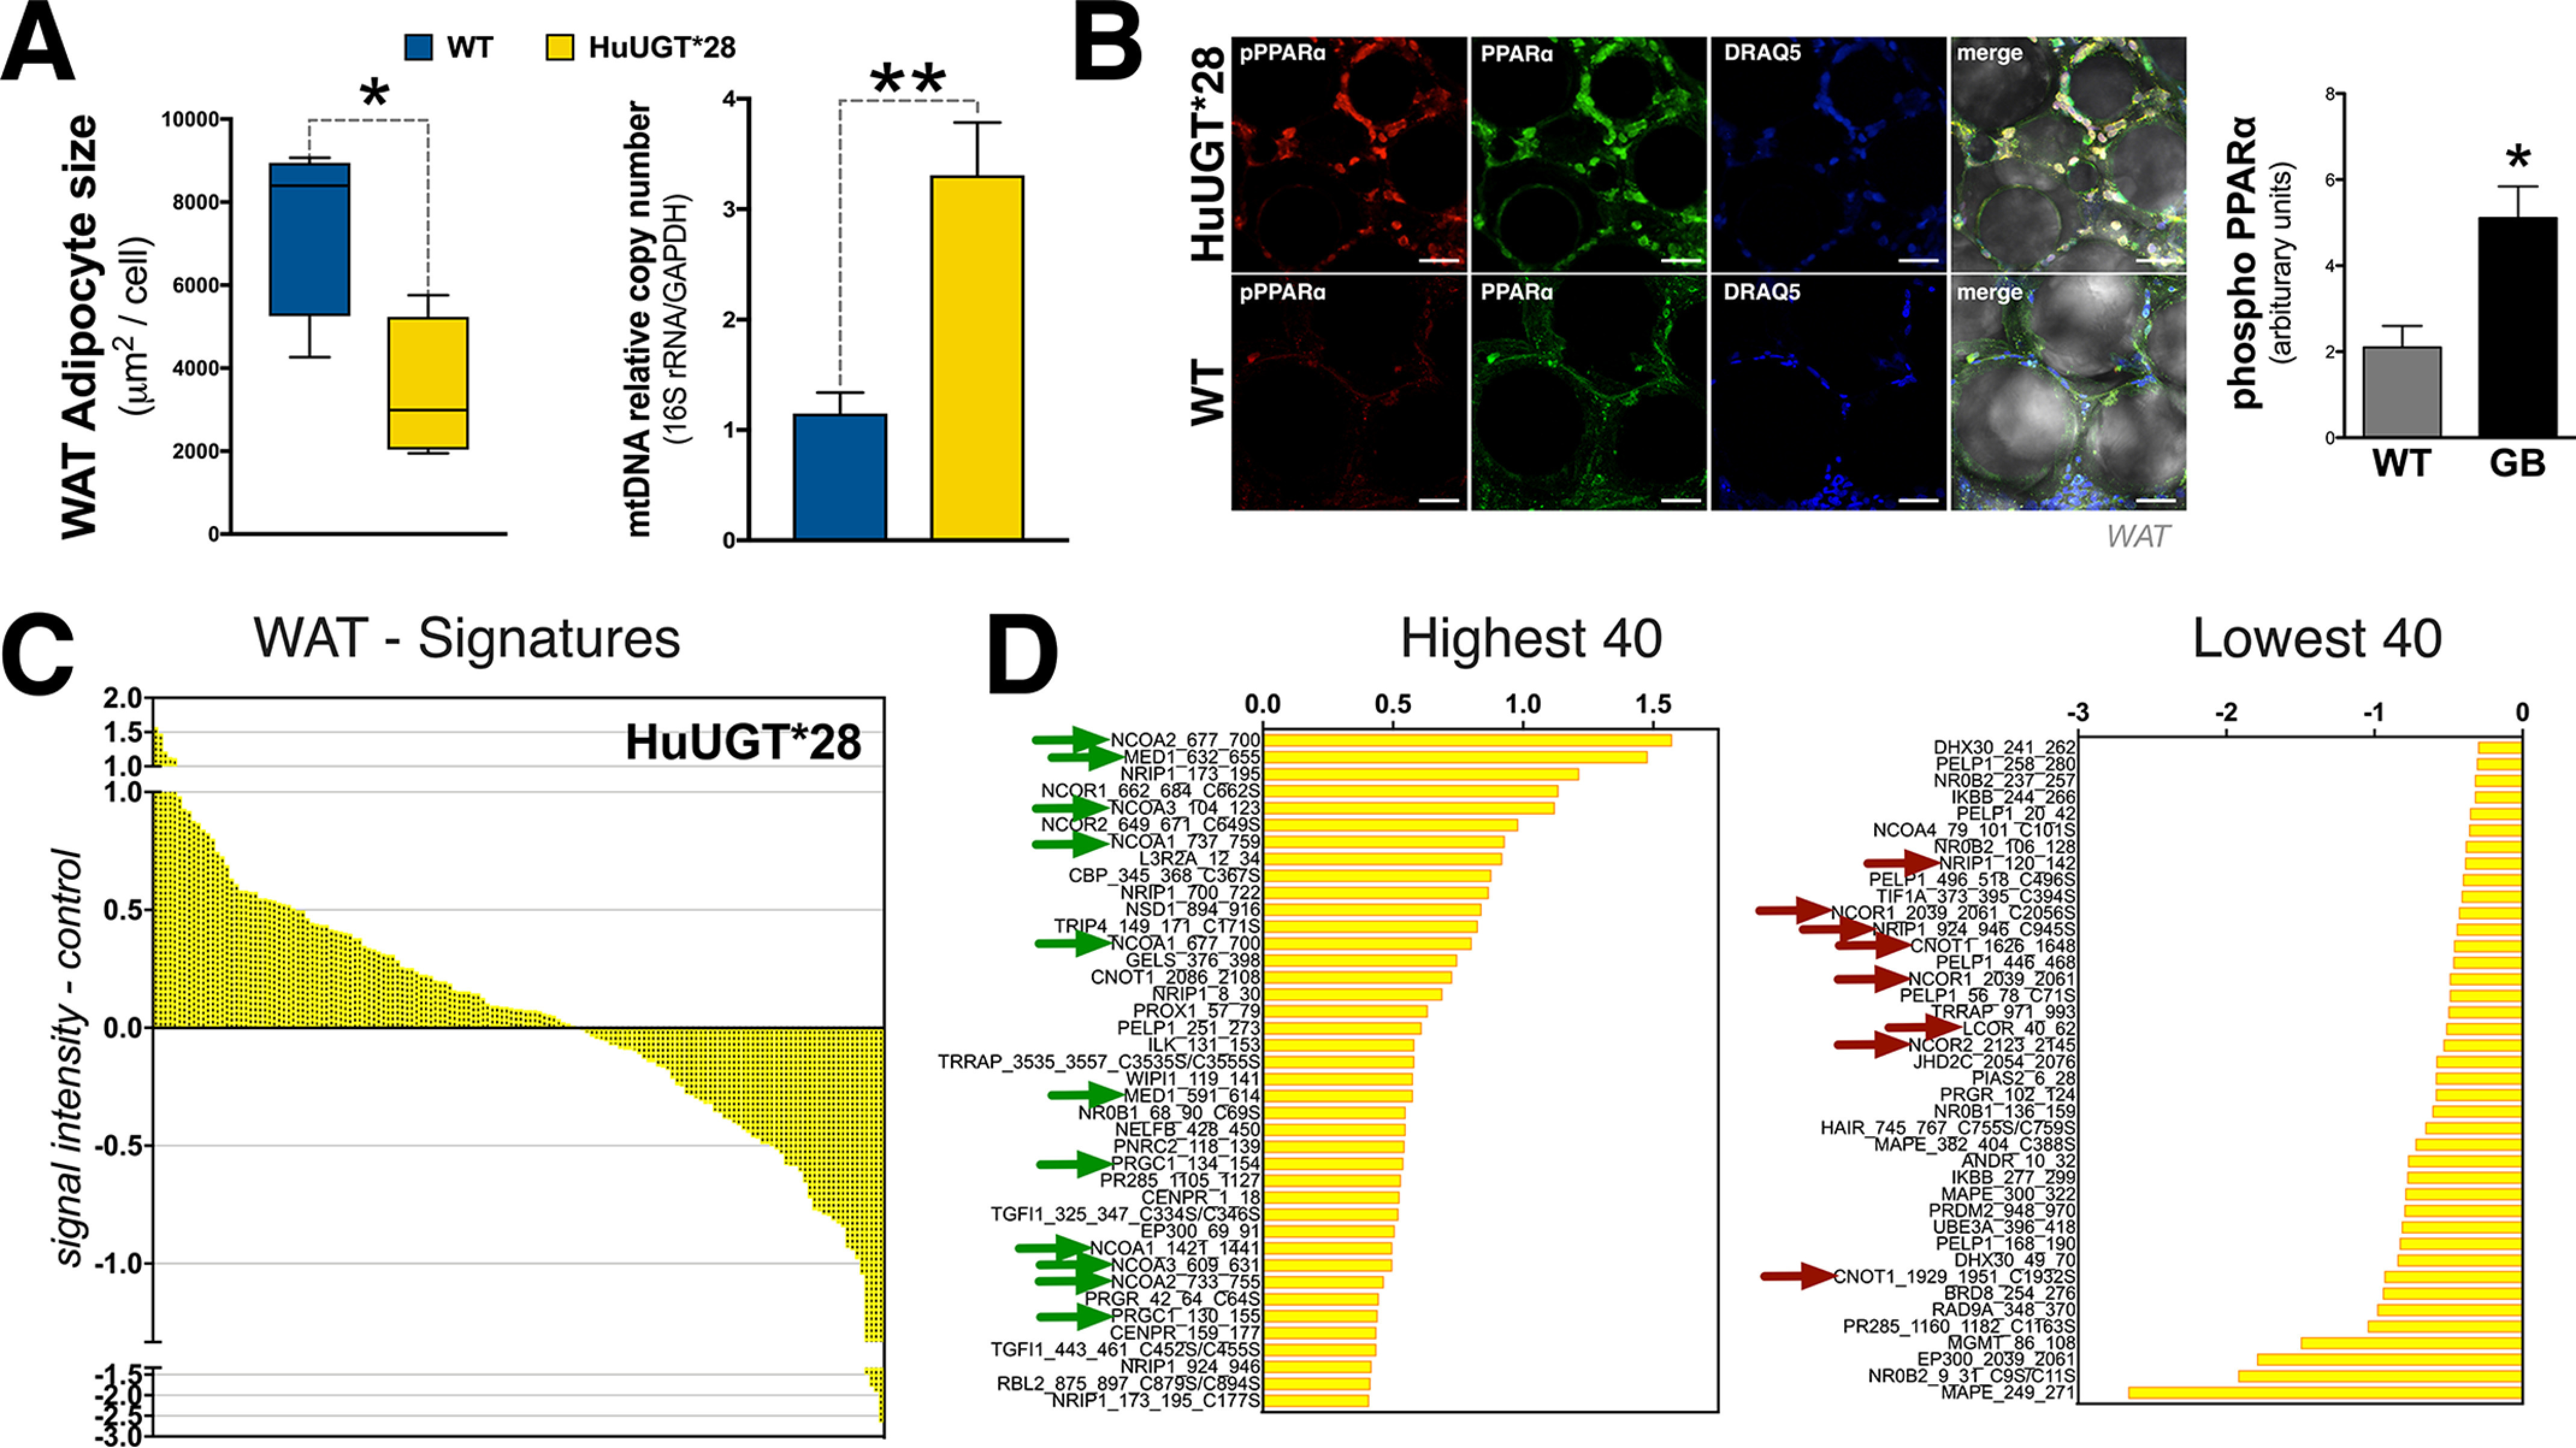
High-fat diet–fed mice with hyperbilirubinemia are resistant to WAT hypertrophy by enhanced coregulator recruitment to PPARα. A, WAT adipocyte size and mitochondria number in Gilbert's (HuUGT*28) and WT mice (n = 4). B, phosphorylation of serine 12 of PPARα in Gilbert's (HuUGT*28) and WT mice (n = 5-6). C, WAT molecular signature of Gilbert's (HuUGT*28) and WT mice. The 40 most highly recruited and 40 most highly dissociated coregulators are identified. Green arrows, known coactivators; red arrows, corepressors (n = 4 pooled). Data are presented as means ± S.E. (error bars). *, p < 0.05; **, p < 0.01; ***, p < 0.001.
Discussion
The pathology of low bilirubin levels and its involvement in metabolic protection is just now coming to light. Little is known about how bilirubin signals to reduce lipid accumulation. Previous snapshots of bilirubin-induced transcriptome responses showed that it most likely functions via PPARα (25, 26). Our studies here found for the first time that bilirubin has a hormonal function by selectively binding and acting on PPARα. The direct binding of bilirubin to the PPARα-LBD, and not to the PPARγ-LBD or PPARδ-LBD, indicate that its actions are discriminatory. Combined with WAT and BAT analysis, we were able to pinpoint WAT as the primary mediator by which bilirubin induces activity and occupancy of PPARα at gene promoters in adipocytes, which prompts reorganization of coregulators (recruitment of coactivators and dissociation of corepressors) to drive expression and improve adiposity.
The swapping of corepressors for coactivators is a known activity that occurs when ligands bind to nuclear receptors to induce transcriptome responses (61, 66, 67). However, at some gene promoters, corepressors are recruited to suppress expression. Hence, PPARα-induced suppression of de novo lipogenesis genes (68). Bilirubin-induced recruitment of coactivators such as NCOA, PGC1α, and MED1 assists PPARα in selective gene targeting. The finding that bilirubin enhanced PPARα-MED1 interaction further supports its function as a ligand, as MED1 is essential for ligand-induced PPARα pleiotropic effects (69). Also supporting this notion is the bilirubin-induced PPARα dissociation from CNOT1 and NRIP1 (RIP140), which are coregulators that induce adiposity. The interaction of CNOT1 and PPARα has not been thoroughly investigated, but a previous MARCoNI coregulator analysis reported that there was a potential interaction (61). How CNOT1 functions with ligand selectivity is not known. Mice with an adipocyte-specific knockout of CNOT1 had reduced fat pads, and PPARγ expression was almost completely abolished (70), suggesting that CNOT1 is a positive modulator of lipogenesis via PPARγ. NRIP1 (RIP140), on the other hand, is a negative regulator of PPARα transactivation (71). NRIP1 (RIP140) was reported to be most highly expressed in WAT (5-fold higher than BAT) (72) and a coactivator for PPARγ to inhibit genes involved in mitochondrial uncoupling and fatty acid oxidation (73). The NRIP1 (RIP140) null mice were resistant to high-fat diet–induced obesity, which was most likely due to the 100-fold higher expression of Ucp1 in WAT (72) and amplified PPARα occupancy at the Ucp1 enhancer-promoter in adipocytes (74). The bilirubin-induced switch for coregulator interaction with PPARα is an essential element controlling adiposity in WAT and body size. There is a known interchange that occurs with exercise for PGC1α and RIP140, which also happens during weight loss (73, 75). We found that PEG-BR–treated obese and hyperbilirubinemia HuUGT*28 mice fed a high-fat diet had enhanced PGC1α and reduced NRIP1/RIP140 binding with PPARα in WAT compared with controls. PGC1α regulates many beneficial effects of exercise, reduces inflammation, and cooperates with transcription factors to induce genes for mitochondrial biogenesis and function (75). The transgenic overexpression of RIP140 in mice suppressed mitochondrial biogenesis and function as well as PPARα level, which induced cardiac hypertrophy and impaired cardiac function (76).
Bilirubin most likely serves to prevent RIP140 blockade of PPARα in WAT, which may also occur in the cardiovascular system. In patient studies of mild hyperbilirubinemia and Gilbert's polymorphism, UGT1A1*28 has been associated with a reduced risk of cardiovascular disease (77–79) and coronary artery disease and reduced risk for future heart disease (77). Humans with Gilbert's polymorphism were shown to have hyperphosphorylation of PPARα in peripheral blood mononucleated cells compared with people who have normal levels of bilirubin and no UGT1A1 polymorphisms (80). Our study showed that hyperbilirubinemia in mice on a high-fat diet increases the mitochondrial number and hyperphosphorylation of PPARα compared with controls. These data indicate that PPARα-bound bilirubin causes a switch of corepressors (NRIP1/RIP140, CNOT1, and others) to coactivators (PGC1α, MED1, and NCOA), prompting mitochondrial function and biogenesis and ultimately remodeling WAT.
As early as 1969, bilirubin was shown to affect mitochondria function in rat liver and bovine heart at mildly elevated levels (20 μm) but not at extremely high levels (400 μm), and this effect was not observed in the brains of chickens, rabbits, or monkeys (81). Stumpf et al. (82) also demonstrated that a similar dose of bilirubin induced oxygen consumption in rat liver mitochondria. Here, we found that bilirubin enhanced mitochondrial function in adipocyte cell lines and WAT of diet-induced obese mice. Whereas this function was observed in BAT cell lines, mice treated with PEG-BR or hyperbilirubinemic HuUGT*28 did not have changes in BAT size or mitochondria number compared with controls. We previously made a similar finding for adipocyte-specific knockout of biliverdin reductase A (BVRA), the enzyme that generates bilirubin (83), that WAT was affected but not BAT (84).
One possibility for the differences observed for bilirubin between WAT and BAT might be from the fatty acid–binding protein (FABP) expression in WAT that may not be present in BAT or may be present at very low levels in mice. In the liver, bilirubin is transported by FABP1, a liver-specific FABP (85), and also as early as 1969 was shown to be a potent binder of bilirubin (86). In the Unagi Japanese freshwater eel, bilirubin binds to a similar FABP-like protein named UnaG, and UnaG fluorescence is triggered by bilirubin as an endogenous ligand (87). We have recently designed a new biliverdin reductase activity assay (the enzyme that generates bilirubin (83)), using the UnaG protein to measure the production of unconjugated bilirubin via the BVRA enzyme (42). The differential effects observed in WAT may be related to high-fat diet–induced obesity and increased expression of FABPs or fatty acid transport proteins (FATPs) in WAT that may not occur in BAT of animals. One rationale for this is that physiologically WAT would need more FABPs and FATPs during weight gain to bring in more lipids for storage as this is the primary function of this organ and not the purpose of BAT. FABP1 and FABP2 have been shown to be essential for PPARα activity (88). Interestingly, there was ligand-selective binding to FABPs, as fenofibrate only increased PPARα activity with FABP2, GW7647 utilized FABP1, and oleic acid used both FABPs (88). Probably, bilirubin will bind to other FABPs (and possibly FATPs), and not only FABP1, and this could be most highly expressed in WAT and may not be present in BAT, causing tissue-specific activation of PPARα. However, more studies are needed to determine these specificities and whether FABP or FATP levels change in adipose depots during weight gain.
Bilirubin having no effect on BAT was surprising, and this could be related to the differential roles of WAT and BAT and their responses to stimuli. PPARα knockout mice on a high-fat diet showed that inguinal and gonadal fat depots significantly increased, but BAT significantly decreased in size (257 ± 20 mg of WT and 240 ± 12 mg of KO) (89). Others have shown that PPARα is dispensable for cold-induced browning and BAT function, which was reported to occur by PPARγ (90, 91). However, in WAT, PPARα is important in the browning effect by increasing UCP1 and mitochondrial levels (15, 16). Here, we found that PPARα knockout in BAT cells increased the basal oxygen consumption rate, and this was not increased with bilirubin or WY 14,643. Undoubtedly, activation of PPARα transcriptional actions induces fat-burning genes and reduces body weight and browning of WAT (16, 23, 24, 52). The loss of PPARα in BAT appears to reduce the size, which might be compensated by increased PPARγ activity in this tissue, which is well-known to activate energy-dependent pathways in BAT (92). However, PPARα is essential in increasing mitochondrial activity in white adipocytes as Rachid et al. (16, 23, 24) showed that activation of PPARα strongly induced UCP1 in WAT in animals on a high-fat diet, and this was not expressed in control obese mice.
Adipose tissue is composed of multiple different cell types, which are primarily white adipocytes for WAT. Still, there are some macrophages, beige-brown cells, stem cells, and possibly others present too. One limitation of this study is that signals from WAT were not differentiated for white adipocytes from adipocytic macrophages. One factor that differentiates adipocytes from macrophages is UCP1, as this gene is not expressed in macrophages. Work by Sakamoto et al. (93) showed that macrophage infiltration in WAT suppressed UCP1 induction, but this was not observed in BAT. The same group showed that inflammation in 10T1/2 adipocytes suppressed UCP1 mRNA induction (94). The important reporting factor here is that WAT is responding positively with bilirubin treatments, and the UCP1 levels are higher and adipocyte size smaller. The effects of bilirubin seem to be explicitly on WAT, and this most likely occurs via PPARα.
Our studies here indicate that bilirubin explicitly regulates PPARα-induced function, and not PPARγ or PPARδ, and is possibly a SPPARM. We found that bilirubin and its precursor biliverdin, which is rapidly reduced to bilirubin (42–46, 83), increased Ucp1 and Adrb3 expression in WAT. We have shown that biliverdin treatments in 3T3-L1 white adipocytes reduced PPARγ expression and heightened PPARα target genes (25). Inhibiting PPARγ in white adipocytes reduces fat accumulation (95), and activating PPARα reduces fat by elevation in fat-burning genes. We recently showed that adipocytic loss of BVRA in mice on an HFD had significantly less Adrb3 and PPARα expression as well as mitochondria in WAT but not BAT (84). PPARα up-regulates Adrb3 and Ucp1 to induce the browning of WAT and improve mitochondrial function (16, 23, 24, 52). PPARγ, however, suppresses Adrb3 expression in adipocytes, causing lipogenesis (51, 96). Ligands may have selective PPARα modulation as a SPPARMα by recruiting coregulators that induce select pathways (29). The allosteric differences in ligand binding cause slight shifts in the conformation of the protein that opens or closes coregulator interaction, which results in differential gene regulation (97). Demonstrating these slight variances in gene regulation, the fibrates are better at reducing inflammation compared with WY 14,643 and are typically used in treating inflammatory hyperlipidemia and fatty liver disease (98–100). Whereas WY 14,643 does reduce hyperlipidemia, it is not efficient at reducing inflammation (101). However, WY 14,643 is better at lowering blood glucose levels (102). These differences have been attributed to their gene-selective action through coregulator recruitment. Bilirubin may function as a SPPARMα to regulate its cardiovascular protective, anti-obesity, and antidiabetic properties in vivo and, like other PPARα ligands, have its own molecular signatures by bound coregulators.
The position of bilirubin in weight management or exercise-induced weight loss has not been established. Still, these studies posit it as a hormone that potentiates metabolic responsiveness to reduce adiposity. For unknown reasons, exercise was shown to elevate plasma bilirubin levels in mice (103). In obese patients, short-term weight loss caused a rise of 22 μm in plasma bilirubin as body weight decreased by 2% or more (104). The body's response to increasing bilirubin during weight loss may be related to its hormonal function on PPARα to induce oxidation of fat. Mutually, plasma bilirubin levels increase during fasting via regulation of Ugt1a1 (105), and this is when PPARα is also most highly expressed (106). These findings posit bilirubin-PPARα as a potential fasting-induced fat-burning axis. Patients exhibiting mildly elevated (>12 μm) bilirubin (in comparison, the EC50 of bilirubin activation of PPARα was identified in this study to be 9.0 μm) were shown to have significantly fewer metabolic disorders such as fatty liver, obesity, or type II diabetes (7–12, 107–109). Correspondingly, the level of hypobilirubinemia considered metabolically significant in men and women (1) is near or below the level of activation for bilirubin-PPARα. Bilirubin has the potential to serve as a novel antilipemic and antidiabetic agent (110) as well as to protect against hypertension and kidney damage (111).
There has been a recent call for the readjustment of plasma bilirubin levels (112). Mostly, the low spectrum of bilirubin has not been classified. The extremely high levels of bilirubin that appear in the well-known Crigler–Najjar syndrome (300–700 μm) are infrequent and occur in less than one in a million people (113). At high-end pathological concentrations (>150 μm), bilirubin induces jaundice and may cause pruritus or itching. Recently, Meixiong et al. (114) demonstrated that bilirubin at an EC50 of 145 μm activated MRGPRX4, which is a G protein–coupled receptor on sensory neurons, to produce itching. This level of bilirubin is only observed in jaundiced patients that have severe liver damage. Obese patients are on the lower spectra for plasma bilirubin and are much more common, as obesity has hit an all-time high of nearly 40% of the population (115). This suggests that low bilirubin (hypobilirubinemia) is analogous to severely high bilirubin levels (>150 μm) and may also be pathological. In the upper physiological range (>12 μm) and in that observed in humans with Gilbert's polymorphism (18–50 μm), bilirubin has metabolic benefits that improve health (110, 116).
Our understanding of the bilirubin spectra in terms of disease is only limited to the upper limits that may induce kernicterus and brain damage in newborns. Here, we found that bilirubin is a hormone, and low levels are pathological due to the reduced PPARα-bilirubin interaction that safeguards from adiposity and possibly cardiovascular diseases. Our findings show that bilirubin had an adipose depot–specific effect and only affected WAT and not BAT. The differences might be related to fatty acid binding or transporter protein expression, but this is yet to be established, and more work is needed to reveal these differences. Our finding that bilirubin has a hormonal function by binding and activating PPARα to reorganize coregulators suggests that there may be a pivotal role for its use in the treatment of metabolic dysfunction. These findings indicate that a positive modulation of bilirubin in fat could improve glucose homeostasis and promote metabolic fitness. Taken together, our data support a novel paradigm in which PPARα-bilirubin interaction in WAT is a key control point for systemic regulation of adiposity.
Materials and methods
Mouse husbandry
The experimental procedures and protocols of this study conform to the National Institutes of Health Guide for the Care and Use of Laboratory Animals and were approved by the Institutional Animal Care and Use Committee of the University of Mississippi Medical Center. C57BL/6J mice were purchased from the Jackson Laboratory (Bar Harbor, ME). Gilbert's mice UGT1A1*28 (TgUGTA1*28)Ugt−/− were obtained from Dr. Robert H. Tukey (University of California San Diego, La Jolla, CA, USA).
Pegylated bilirubin treatments in mice
The synthesis of pegylated bilirubin was prepared as described previously (63). Experiments were performed on male DIO C57BL/6J mice. DIO mice were on a high-fat diet prior to purchase for at least 16 weeks and then maintained on the HFD for another 14 weeks. Mice were housed under standard conditions and allowed full access to 60% high-fat diet and water. This diet contains 60% of its total kilocalories from fat and 20% from carbohydrates derived from mainly from maltodextrin 10 (12%) and sucrose (6.8%). Mice were treated with PEG-bilirubin (30 mg/kg, intraperitoneally) every other day for 4 weeks while they continued to consume the HFD. Control animals received injections of vehicle (saline). All mice had free access to food and water ad libitum. Animals were housed in a temperature-controlled environment with a 12-h dark-light cycle.
UGT1A1*28 Gilbert mice
Gilbert's mice UGT1A1*28 were used as described previously (64). Studies were performed on male Gilbert's mice housed under standard laboratory conditions for 4 weeks. After this time, mice were switched to the HFD for 36 weeks and allowed access to water. All mice had free access to food and water ad libitum. Animals were housed in a temperature-controlled environment with a 12-h dark-light cycle.
Body composition
Body composition changes were assessed at 6-week intervals throughout the study using MRI (EchoMRI-900TM, Echo Medical System). MRI measurements were performed in conscious mice placed in a thin-walled plastic cylinder with a cylindrical plastic insert added to limit movement of the mice. Mice were briefly submitted to a low-intensity electromagnetic field where fat mass, lean mass, free water, and total water were measured.
Fasting glucose
Following an 8-h fast, a blood sample was obtained via orbital sinus under isoflurane anesthesia. Blood glucose was measured using an Accu-Chek Advantage glucometer (Roche Applied Science).
Measurement of total bilirubin
Total bilirubin was measured from 30 μl of plasma using a Vet Axcel serum chemistry analyzer (AlfaWasserman). Samples were measured in duplicate with standards supplied by the manufacturer, and the data are presented as mg/dl.
Adipocyte size measurements
Adipocyte sizes were measured as we described previously (84). In brief, frozen brown and white adipose tissue samples were thawed at room temperature. The images of the lipid droplet sizes were measured as described previously (117). Tissue sample diameters were measured based on the measurement of the lipid droplet's widest point. The diameter was used to extrapolate the lipid volume for the adipocytes.
Mitotracker mitochondrial analysis
Mitotracker analysis was performed as we described previously (84). In brief, frozen brown and white adipose tissue samples were thawed to room temperature. Specimens were then washed three times with prewarmed 37 °C PBS and then incubated with 100 nm Mitotracker® Green FM (Invitrogen) for 15 min at room temperature. The samples were washed once with PBS and then incubated with 1 μm DRAQ5 (Cell Signaling Technology) and washed one final time with PBS before imaging. The specimen images were obtained using confocal microscopy.
Measurement of mitochondrial DNA (mtDNA)
DNA was isolated from tissues using the GenElute™ mammalian genomic DNA miniprep kit protocol (Millipore Sigma) according to the manufacturer's instructions. The mtDNA copy number was analyzed as the relative mtDNA copy number via the ratio of 16S rRNA, a mitochondrial gene, and GAPDH, a nuclear gene, as described previously (118). PCR amplification of the genomic DNA was performed by quantitative realtime PCR using TrueAmp SYBR Green qPCR SuperMix (Advance Bioscience) and primers for the promoters of 16S and GAPDH. The thermocycling protocol consisted of 3 min at 95 °C, 48 cycles of 15 s at 95 °C, 30 s at 60 °C, and, based on transcript size, from 0 to 30 s at 72 °C.
Glycerol and free fatty acid measurements
Plasma glycerol and free fatty acid were measured from a 10-μl sample using the Cayman glycerol colorimetric assay kit (item no. 10010755) and Cayman free fatty acid fluorometric assay kit (item no. 700310) per the manufacturer's instructions.
Immunofluorescence
White adipose tissue samples were cut into 2 × 2 mm for immunofluorescence staining. Images were acquired using a Leica TCS SP5 laser-scanning confocal microscope (Leica Microsystems, Bannockburn, IL, USA) equipped with a Ti-sapphire tunable multiphoton laser (Coherent, Santa Clara, CA, USA). Adipose z-stacks were acquired at 512 × 512 with 0.5-μm steps in the UT Advanced Microscopy and Imaging Center as previously described (119). Adipose size was measured directly in the Leica Application Suite Advanced Fluorescence (LAS AF) acquisition software. Immunofluorescence staining was performed on adipose tissue samples that were thawed to room temperature and washed three times for 5 min with prewarmed 37 °C PBS. The primary antibodies, UCP1 (Novus Biologicals, NBP2-43550), ADRB3 (Abcam, ab94506), pPPARα (Ser-12) (Abcam, ab3484), or PPARα (Origen, TA503540), were incubated overnight at room temperature. The samples were washed three times for 5 min with PBS at room temperature. Secondary antibodies were incubated for 2 h at room temperature and further washed three times in PBS. Samples were then incubated with 1 μm DRAQ5 (Cell Signaling Technology, Danvers, MA, USA) and washed one final time with PBS before imaging. Adipose tissue was imaged on an inverted confocal microscope using coverslip bottom dishes using a ×63 lens. Sequential scan mode was used to eliminate any overlap in the emission spectra of the secondary antibodies (488, 594, and 647 nm) with excitation using the 488-, 561-, and 633-nm laser lines, respectively. Brightfield images were also acquired for adipocyte size measurements.
Cell culture and generation of stable cell lines
The murine 3T3-L1 and BAT, human HEK293, and COS7 green kidney monkey cells were routinely cultured and maintained in Dulbecco's modified Eagle's medium containing 10% bovine calf serum or fetal bovine serum (FBS) with 1% antibiotic-antimycotic. Cultures were maintained at 37 °C and a 5% CO2 saturation.
3T3-L1 PPARγ2 overexpression cell line
The 3T3-L1 PPARγ2 line was established similarly to the 3T3-L1 PPARα cell line (25). In brief, to establish a 3T3-L1 cell line that has PPARγ2 stably overexpressed, mouse PPARγ2 cDNA was ligated into the pQXCIP vector, and the construct was cotransfected together with vectors expressing gag-pol, REV, and VSV-G into HEK293FT cells (Invitrogen) to generate a third-generation lentiviral construct. The lentivirus-containing supernatant was used to infect 3T3-L1 cells to establish cell lines with stable overexpression of PPARγ2(3T3-PPARγ2) or an empty vector control cell line (3T3-Vector). After 72 h, the cells were selected with puromycin, and positive cells were confirmed by Western blotting.
CRISPR-mediated PPARα KO BAT cells
CRISPR technology was employed in BAT cells as described previously (48) to excise part of exon 3 and exon 4 of the Pparα gene to create a PPARα knockout BAT cell line. Two sgRNAs with high efficacy and low off-target scores were identified on exons 3 and 4 of the mouse PPARα gene using Benchling online software. The two Cas9 targets were separated by 9,465 bases. All of the off-targets to our PPARα sgRNA had four mismatches, of which at least 1–2 were within the seed region (up to 12 bases proximal to the protospacer adjacent motif site), which reduces the likelihood of Cas9 off-target effects. The multiplex sgRNAs were generated using the PrecisionX Multiplex gRNA Cloning Kit (System Biosciences) according to the manufacturer's instructions. The multiplex sgRNA fragments were cloned into the GuideIt Green plasmid (Clontech Laboratories, Inc.) according to the manufacturer's instructions. After sequence verification, 2 μg of the plasmid was transfected into cells in 12-well plates. After 36 h of transfection, cells with the top 5% level of fluorescence were single-sorted into 96-well plates by FACS. Sorted cells were allowed to recover and grow to confluence in individual wells. Individual wells were harvested with trypsin, and crude genomic DNA was obtained from two-thirds of the cells while the remaining one-third was left to continue growing. PCR was carried out on the genomic DNA samples using primers flanking the two cut sites for exons 3 and 4. Positive clones were identified by the presence of an 831-bp product (longer or shorter, depending on whether there is further insertion or deletion) indicative of Cas9-mediated targeting. The clones were immunoblotted with a PPARα antibody (Abcam, ab24509) to determine the PPARα levels.
Luciferase promoter activity assay
PPARα activity was measured using HEK293 cells that were transiently transfected with a UAS GAL4-driven luciferase vector construct (UAS-Luc) along with fusion products of the GAL4 DNA-binding domain and the LBDs of PPARα (GAL4-PPARα-LBD), PPARγ (GAL4-PPARγ-LBD), or PPARδ (GAL4-PPARδ-LBD). Cells were treated with a dose-dependent increase of bilirubin in the absence and presence of ligands for 24 h (PPARα antagonist, GW6471; PPARγ agonist, rosiglitazone; PPARδ agonist, GW501516), and activity was measured via luciferase using the Dual-Luciferase® reporter assay system (Promega) with the Promega GloMax® 96 microplate luminometer (Promega).
Histidine-tagged PPARα and purification
Full-length histidine-tagged mouse PPARα sequence was amplified with primers that included digestion sites for BamHI (forward, 5′-CGGGATCCGATGGTGGACACAGAGAGCC-3′) and XbaI (reverse, 5′-GCTCTAGACTCTTCATCCCCAAGCGTAG-3′) using the KOD HOT Start DNA polymerase kit (Millipore Sigma). The PCR products and the pcDNA6/His A vector (Invitrogen) were digested with the appropriate restriction enzymes BamHI and XbaI overnight at 37 °C. Ligation of the pcDNA6/HisA vector and the PPARα PCR products was achieved using a Rapid DNA Ligation Kit (Thermo Fisher Scientific) and transformed into DH5α cells (Invitrogen). Sequencing of the plasmids was performed using T7 (forward, 5′-TAATACGACTCACTATAGGG-3′) and BGH (reverse, 5′-TAGAAGGCACAGTCGAGG-3′) primers. Purified plasmid was transiently transfected into HEK293 GP2 cells using GeneFect (Alkali Scientific Inc.) for 48 h in Dulbecco's modified Eagle's medium, 10% dialyzed FBS, 1% antibiotic-antimycotic. Cells were harvested via scrapping and resuspended in PBS and spun down at 5,000 rpm and either used immediately for protein extraction or flash-frozen and stored at 80 °C.
Bacterial expression of pET-mPPARα was constructed and obtained from Vector Builder. For protein expression, cells were grown in overnight culture and induced the following day with 1 mm isopropyl β-d-1-thiogalactopyranoside for 3 h while shaking at 300 rpm at 37 °C. Cells were then spun down at 5,000 rpm and either used immediately for protein extraction or flash-frozen and stored at 80 °C.
Protein lysates were generated from either frozen cells thawed directly on ice or freshly harvested cells stored on ice prior to centrifugation and resuspended in 700 μl of 200 μm HEPES. His-tagged proteins were extracted and purified using the HisLink™ protein purification kit (Promega). Cells were ruptured using a DNase I–containing Fastbreak solution and incubated along with 75 μl of an anti-His resin and spun at 10 rpm at 4 °C for 30 min. Bound resin was washed twice with the supplied wash buffer prior to elution via 200 μl of elution buffer. Purified proteins were then dialyzed in 1× PBS overnight. Confirmation of successful protein extraction was determined via Western blotting.
Bilirubin fluorescence assay setup
In a black flat-bottom 96-well plate PPARα, BSA, or PBS was added to the wells. Next, the test ligands were added into wells with or without the aforementioned proteins or PBS. Once all compounds were added to the plate, the plate was protected with foil to avoid light degradation. Excitation and emission spectra of the samples were recorded using the top read SpectraMax plate reader (Molecular Devices). The samples were read at room temperature in 5-nm steps with both excitation and emission filters in use. The excitation spectrum was recorded from 300 to 495 nm. Once the maximal emission for bilirubin bound to the protein of interest was recorded, that wavelength of the peak value was set as the maximal excitation value and used for the excitation wavelength for the subsequent emission spectrum from 495 to 700 nm.
Adipogenesis
Adipogenic differentiation of 3T3L1 cells was achieved by treatment with 250 nm dexamethasone, 167 nm insulin, and 500 μm isobutylmethylxanthine in 10% FBS until day 9 as described previously (120–122). Adipogenic differentiation of BAT cells was achieved with 0.02 μm insulin, 0.001 μm triiodothyronine, 125 μm indomethacin, 5.096 μm dexamethasone, and 0.5 mm isobutylmethylxanthine in 10% FBS until day 10. Differentiated cells were stained with Nile Red to visualize lipid content, and densitometry was used as a direct measure as we have described previously (25, 95, 120, 121, 123).
Seahorse cellular respiration analysis
BAT or 3T3-L1 cells were seeded on a XF96 cell culture microplate (Agilent). Cells were counted using a Bio-Rad TC20 automated cell counter and plated at 20,000 cells/well. For differentiation assays, cells were grown to 100% confluence and differentiated as described previously for 9 days. None of the ligands caused changes in cell viability, as was determined by no significant cell death observed by microscopy. Cellular respiration was quantified via OCR and extracellular acidification rate using the Seahorse Extracellular Flux Analyzer XF-96 (Agilent Technologies). The Seahorse XF Cell Mito Stress Test Kit (Agilent) was used for analysis of cellular respiration. Cells were treated for 24 h before Seahorse microplate analysis. After treatment, cells were washed twice with Seahorse Bioscience Assay Media (XF Base media with 25 mm glucose, 2 mm l-glutamate, and 1 mm sodium pyruvate) and then incubated with the buffer for 1 h in a non-CO2 incubator. The Seahorse Cartridge ports were loaded in ports a, b, and c with assay media containing 10 μm carbonyl cyanide p-trifluoromethoxyphenylhydrazone, 10 μm oligomycin, and 5 μm rotenone/antimycin A, respectively, an hour before the assay. XF Cell Mito Stress protocols were followed per the manufacturer's details utilizing sequential measurements to obtain cellular baseline respiration, ATP production, maximal respiration, proton leak, and nonmitochondrial respiration. The raw data and graphs were supplied as an Excel file or GraphPad Prism file.
ChIP
BAT or 3T3-L1 cells were differentiated and treated as described and then harvested for ChIP to quantify promoter occupancy. Cells were cross-linked with formaldehyde with a final concentration of 1% in media while shaking at room temperature for 10 min. The activity of the formaldehyde was quenched with the addition of 125 nm glycine while rocking for 5 min at room temperature. Cells were washed twice with 1× PBS, collected into a 15-ml conical tube, and spun down at 3,000 rpm for 5 min. Pellets were rapidly frozen on a dry ice ethanol mix and stored at −80 °C for a minimum of 1 h or immediately resuspended in a series of lysis buffers containing protease inhibitors for 5 min. Pellets were resuspended in lysis buffer 1 (50 mm HEPES-KOH, pH 7.5, 140 mm NaCl, 1 mm EDTA, pH 8.0, 10% glycerol, 0.5% Nonidet P-40, 0.25% Triton X-100) for 5-10 min and then centrifuged for 2 min. Then the decanted pellet was resuspended in lysis buffer 2 (10 mm Tris-HCl, pH 8.0, 200 mm NaCl, 1 mm EDTA, pH 8.0, 0.5 mm EGTA) for 5–10 min, and finally after centrifugation, the decanted pellet was resuspended in lysis buffer 3 (10 mm Tris-HCl, pH 8.0, 100 mm NaCl, 1 mm EDTA, pH 8.0, 0.5 mm EGTA, 0.1% sodium deoxycholate, 0.5% N-lauroylsarcosine). Cells were sonicated for ∼8 min, and lysates were centrifuged for 10 min at 4 °C at 13,000 rpm. The lysates were precleared in BSA/salmon sperm−blocked beads rotating for 2 h at 4 °C. After preclearing, the lysate was transferred to another tube containing the PPARα, IgG, or GFP antibody and was rotated at 10 rpm overnight at 4 °C. Lysate mixtures were then incubated with agarose A beads and rotated for 4 h at 4 °C. The samples were then washed with a wash buffer (50 mm HEPES-KOH, pKa 7.55, 500 mm LiCl, 1 mm EDTA, pH 8.0, 1.0% Nonidet P-40, 0.7% sodium deoxycholate) five times. The protein/DNA complex was eluted in an elution buffer at 65 °C for 30 min shaking every 2 min. The eluted samples were transferred to another tube and incubated at 65 °C overnight to reverse cross-linking. The samples were purified after a 1-h incubation with Proteinase K at 55 °C via an isopropyl alcohol/chloroform/ethanol mixture. DNA was quantified on a NanoDrop 2000 spectrophotometer (Thermo Fisher Scientific). PCR amplification of the genomic DNA was performed by quantitative realtime PCR using TrueAmp SYBR Green qPCR SuperMix (Advance Bioscience) and primers for the promoters of Adrb3, Cpt1, and Ucp1. The thermocycling protocol consisted of 2 min at 50 °C and then 10 min at 95 °C, 48 cycles of 30 s at 95 °C, and 1 min at 65°.
Gel electrophoresis and Western blotting
Extracted protein or protein lysates were quantified using the BCA protein assay kit (Thermo Fisher Scientific) or with the NanoDrop 2000 spectrophotometer (Thermo Fisher Scientific). The proteins were resolved by SDS-PAGE and electrophoretically transferred to ImmobilonFL membranes. Membranes were blocked at room temperature for 1 h in Odyssey blocking buffer (LI-COR Biosciences) or TBS (10 mm TrisHCl (pH 7.4) and 150 mm NaCl) containing 5% BSA or nonfat milk. Subsequently, the membrane was incubated overnight at 4 °C with a PPARα (Santa Cruz Biotechnology, Inc., sc-9000), PPARγ (Santa Cruz Biotechnology, sc-7273), PPARγ2 (Santa Cruz Biotechnology, sc-22020), or HSP90 (Santa Cruz Biotechnology, sc-13119) antibody at 1:1,000 dilution. After three washes in TBST (TBS plus 0.1% Tween 20), the membrane was incubated with an IR secondary antibody labeled with IRDye IR dye (LI-COR Biosciences) (1:15,000 dilution in TBS) for 2 h at 4 °C. Following an additional three washes in TBST, immunoreactivity was visualized and quantified by IR scanning in the Odyssey system (LI-COR Biosciences).
Quantitative realtime PCR analysis
Total RNA was extracted from tissues using the miRNeasy Mini Kit (Qiagen Biotechnology). Total RNA was read on a NanoDrop 2000 spectrophotometer (Thermo Fisher Scientific), and cDNA was synthesized using the High Capacity cDNA Reverse Transcription Kit (Applied Biosystems). PCR amplification of the cDNA was performed by quantitative realtime PCR using TrueAmp SYBR Green qPCR SuperMix (Advance Bioscience). The thermocycling protocol consisted of 3 min at 95 °C, 48 cycles of 15 s at 95 °C, 30 s at 60 °C, and based on primer size 0-30 s at 72 °C and finished with a melting curve ranging from 60 to 95 °C to allow distinction of specific products. Normalization was performed in separate reactions with primers to 36B4. The quantitative RT-PCR primers used in this study can be found in Table S1.
Cloning and sequencing of murine Adrb3 promoter
Information regarding introns and exons (ENSMUSG00000031489) was downloaded from Ensembl Mouse GeneView (RRID:SCR_002344). Cloning and sequencing of the Adrb3 promoter was performed as follows. Murine DNA was isolated from 3T3-L1 cells, and the following primers for the Adrb3 3,052-bp promoter and Adrb3 340-bp enhancer with added restriction enzyme−cut sites to amplify regions of interest using KOD Xtreme Hot Start DNA Polymerase (Novagen). Products were ligated into pGL4.10 vector using the restriction enzymes XhoI and BglII (proximal promoter) and XhoI and HindIII (enhancer) and transformed into DH5α (Invitrogen). Plasmid DNA from positive clones was determined by RT-PCR and further extracted using the Qiagen Spin Miniprep Kit (Qiagen Biotechnology). XhoI and BglII sites flank the position on the vector at which the Adrb3 promoter is inserted, and the XhoI and HindIII sites flank the position on the vector at which the Adrb3 enhancer is inserted. Sequencing was performed by Eurofins Genomics (Louisville, KY) using forward and reverse primers that flank the gene insertion site of the plasmid. Mutations in the PPREs for the enhancer pβ3-ADR-340-luc plasmid were made using the Agilent QuikChange Lightning Kit and sequenced as described above. Primers used for the mutations in the Adrb3 340-bp enhancer region targeted the PPARα-binding site (PPRE1) and RXR-binding site (PPRE2). The sequence-confirmed plasmids were named pβ3-ADR-3052-luc, pβ3-ADR-340-luc, and pβ3-ADR-340-luc PPRE1 and PPRE2 mutants.
PamStation NHR assay—purified protein analysis
PPARα interactions with coregulators was characterized with the PamStation nuclear hormone receptor chip (PamGene International). All mixtures were prepared with TR-FRET coregulator buffer J (Invitrogen) supplemented with 5 nm DTT as described previously (61). A nuclear receptor tube held a mixture of 20 nm GST-hPPARα LBD (Thermo Fisher Scientific) or 40 nm full-length His-mPPARα; an antibody tube held a mixture 100 nm GST tag polyclonal antibody with Alexa Fluor 488 or 100 nm PPARα antibody and secondary antibody Alexa Fluor 488; and last, ligand tubes each held a 100 μm concentration of the tested ligand. In a final 1.5-ml microtube, 50 μl of the respective ligand mixture, followed by 25 μl of PPARα mixture and 25 μl of the antibody mixture, were combined and incubated at 37 °C for 5 min prior to placement on the respective array for analysis in a PamStation12 (Pamgene International) over 120 cycles. PPARα binding was reflected via fluorescent signals recorded through the PamStation12. The signals were transformed into tiff images, and binding capacity was quantified using BioNavigator software (PamGene International).
PamGene NHR ChIP assay for white adipose tissue
For tissue analysis, frozen samples were retrieved and pooled based on treatment condition. Upon rupture via homogenization, samples were incubated in a 50/50 mix of M-PER buffer (Thermo Fisher Scientific) and HEMG buffer (10 mm HEPES, 3 mm EDTA, 10 mm sodium molybdate, 10% glycerol) supplemented with a phosphatase and protease inhibitor. Samples were spun down at 14,000 rpm for 5-10 min. The supernatants obtained were measured in triplicate for protein concentration using the PierceTM BCA Protein Kit (Thermo Fisher Scientific). Samples were measured at 512 nm using the SpectraMax Plus (Molecular Devices, San Jose, CA). A final 1.5-ml microtube tube for each condition contained 25 ng of protein lysate/array, 25 nm PPARα antibody, 25 nm secondary antibody Alexa Fluor 488. Before placement on the array, all final mixtures were rotated at 10 rpm for 30 min at 4 °C. PPARα binding was reflected via fluorescent signals recorded through the PamStation12 over 120 cycles. The signals were transformed into tiff images, and binding capacity was quantified using BioNavigator software (PamGene International).
Statistical analysis
Data were analyzed with Prism version 7 (GraphPad Software) using analysis of variance combined with Tukey's posttest to compare pairs of group means or unpaired t tests. Results are expressed as mean ± S.E. Additionally, oneway analysis of variance with a least significant difference post hoc test was used to compare mean values between multiple groups, and a two tailed two way analysis of variance was utilized in multiple comparisons, followed by the Bonferroni post hoc analysis to identify interactions. *, p < 0.05; **, p < 0.01; ***, p < 0.001.
Data availability
All data not included in the article are available upon request from the corresponding author (Terry D. Hinds, Terry.Hinds@utoledo.edu).
Supplementary Material
Acknowledgments
We thank Rene Houtman with PamGene (Netherlands) and the PamGene team for helpful discussions and assistance in developing protocols to use the PamStation NHR chip technology for white adipose tissue from mice. We also thank John M. Rimoldi, Rama S. Gadepalli, and the Research Institute of Pharmaceutical Sciences at the University of Mississippi (Oxford, MS, USA) for the synthesis of pegylated bilirubin used in the studies. We also acknowledge the Analytical and Assay Core in the Department of Physiology and Biophysics at the University of Mississippi Medical Center.
This article contains supporting information.
Author contributions—D. M. G., K. L. N., A.-R. A. H., C. F. H., A. L. N.-K., S. A. M., M. P. M., S. O. A., J. G. S., P. W. E., R. E. M., and D. E. S. data curation; D. M. G., K. L. N., A.-R. A. H., C. F. H., A. L. N.-K., S. A. M., M. P. M., S. O. A., J. G. S., P. W. E., R. E. M., and D. E. S. formal analysis; D. M. G., K. L. N., A.-R. A. H., M. P. M., S. O. A., P. W. E., R. E. M., and D. E. S. validation; D. M. G., K. L. N., A.-R. A. H., C. F. H., A. L. N.-K., S. A. M., M. P. M., S. O. A., R. E. M., and D. E. S. investigation; D. M. G., K. L. N., A. L. N.-K., M. P. M., S. O. A., J. G. S., P. W. E., R. E. M., D. E. S., and T. D. H. methodology; D. M. G., A. L. N.-K., D. E. S., and T. D. H. writing-original draft; D. M. G., K. L. N., A.-R. A. H., C. F. H., A. L. N.-K., S. A. M., M. P. M., S. O. A., J. G. S., P. W. E., R. E. M., D. E. S., and T. D. H. writing-review and editing; A. L. N.-K., D. E. S., and T. D. H. visualization; D. E. S. and T. D. H. conceptualization; D. E. S. and T. D. H. resources; D. E. S. and T. D. H. supervision; D. E. S. and T. D. H. funding acquisition; D. E. S. and T. D. H. project administration.
Funding and additional information—This work was supported by the National Institutes of Health (NIH) Grants 1R01DK121797-01A1 (to D. E. S.) and 1R01DK126884-01 (to D. E. S. and T. D. H.); NHLBI, NIH, Grants K01HL-125445 (to T. D. H.) and P01 HL05197-11 (to D. E. S.); and NIGMS, National Institutes of Health, Grant P20GM104357-02 (to D. E. S.). This project was supported in part by Grant P30GM122733 (Chemistry and DMPK Core Faculty) funded by NIGMS (NIH) as one of its Centers of Biomedical Research Excellence (COBRE). The content is solely the responsibility of the authors and does not necessarily represent the official views of the National Institutes of Health.
Conflict of interest—Terry Hinds and David Stec have submitted patents on bilirubin and obesity-related disorders.
- WAT
- white adipose tissue
- BAT
- brown adipose tissue
- SPPARM
- selective PPAR modulation
- PPAR
- peroxisome proliferator-activated receptor
- LBD
- ligand-binding domain
- UAS
- upstream activation sequence
- PPRE
- PPAR response element
- RXR
- retinoid X receptor
- OCR
- oxygen consumption rate
- KO
- knockout
- NHR
- nuclear hormone receptor
- MARCoNI
- microarray assay for real-time coregulator-nuclear receptor interaction
- DIO
- diet-induced obesity
- PEG-BR
- PEGylated bilirubin
- HFD
- high-fat diet
- NCOR
- nuclear corepressor
- BVRA
- biliverdin reductase A
- FABP
- fatty acid–binding protein
- FATP
- fatty acid transport protein
- mtDNA
- mitochondrial DNA
- FBS
- fetal bovine serum
- sgRNA
- single guide RNA
- Veh
- vehicle.
References
- 1. Torgerson J. S., Lindroos A. K., Sjöström C. D., Olsson R., Lissner L., and Sjöström L. (1997) Are elevated aminotransferases and decreased bilirubin additional characteristics of the metabolic syndrome? Obes. Res. 5, 105–114 10.1002/j.1550-8528.1997.tb00650.x [DOI] [PubMed] [Google Scholar]
- 2. Jørgensen M. E., Torp-Pedersen C., Finer N., Caterson I., James W. P., Legler U. F., and Andersson C. (2014) Association between serum bilirubin and cardiovascular disease in an overweight high risk population from the SCOUT trial. Nutr. Metab. Cardiovasc. Dis. 24, 656–662 10.1016/j.numecd.2013.12.009 [DOI] [PubMed] [Google Scholar]
- 3. Dong H., Huang H., Yun X., Kim D. S., Yue Y., Wu H., Sutter A., Chavin K. D., Otterbein L. E., Adams D. B., Kim Y. B., and Wang H. (2014) Bilirubin increases insulin sensitivity in leptin-receptor deficient and diet-induced obese mice through suppression of ER stress and chronic inflammation. Endocrinology 155, 818–828 10.1210/en.2013-1667 [DOI] [PMC free article] [PubMed] [Google Scholar]
- 4. Hinds T. D. Jr., Sodhi K., Meadows C., Fedorova L., Puri N., Kim D. H., Peterson S. J., Shapiro J., Abraham N. G., and Kappas A. (2014) Increased HO-1 levels ameliorate fatty liver development through a reduction of heme and recruitment of FGF21. Obesity (Silver Spring) 22, 705–712 10.1002/oby.20559 [DOI] [PMC free article] [PubMed] [Google Scholar] [Retracted]
- 5. Belo L., Nascimento H., Kohlova M., Bronze-da-Rocha E., Fernandes J., Costa E., Catarino C., Aires L., Mansilha H. F., Rocha-Pereira P., Quintanilha A., Rêgo C., and Santos-Silva A. (2014) Body fat percentage is a major determinant of total bilirubin independently of UGT1A1*28 polymorphism in young obese. PLoS ONE 9, e98467 10.1371/journal.pone.0098467 [DOI] [PMC free article] [PubMed] [Google Scholar]
- 6. Hamoud A. R., Weaver L., Stec D. E., and Hinds T. D. Jr. (2018) Bilirubin in the liver-gut signaling axis. Trends Endocrinol. Metab. 29, 140–150 10.1016/j.tem.2018.01.002 [DOI] [PMC free article] [PubMed] [Google Scholar]
- 7. Cheriyath P., Gorrepati V. S., Peters I., Nookala V., Murphy M. E., Srouji N., and Fischman D. (2010) High total bilirubin as a protective factor for diabetes mellitus: an analysis of NHANES data from 1999–2006. J. Clin. Med. Res. 2, 201–206 10.4021/jocmr425w [DOI] [PMC free article] [PubMed] [Google Scholar]
- 8. Choi S. H., Yun K. E., and Choi H. J. (2011) Relationships between serum total bilirubin levels and metabolic syndrome in Korean adults. Nutr. Metab. Cardiovasc. Dis. 23, 31–37 10.1016/j.numecd.2011.03.001 [DOI] [PubMed] [Google Scholar]
- 9. Wu Y., Li M., Xu M., Bi Y., Li X., Chen Y., Ning G., and Wang W. (2011) Low serum total bilirubin concentrations are associated with increased prevalence of metabolic syndrome in Chinese. J. Diabetes 3, 217–224 10.1111/j.1753-0407.2011.00138.x [DOI] [PubMed] [Google Scholar]
- 10. Kwon K. M., Kam J. H., Kim M. Y., Kim M. Y., Chung C. H., Kim J. K., Linton J. A., Eom A., Koh S. B., and Kang H. T. (2011) Inverse association between total bilirubin and metabolic syndrome in rural korean women. J. Womens Health (Larchmt.) 20, 963–969 10.1089/jwh.2010.2453 [DOI] [PubMed] [Google Scholar]
- 11. Han S. S., Na K. Y., Chae D. W., Kim Y. S., Kim S., and Chin H. J. (2010) High serum bilirubin is associated with the reduced risk of diabetes mellitus and diabetic nephropathy. Tohoku J. Exp. Med 221, 133–140 10.1620/tjem.221.133 [DOI] [PubMed] [Google Scholar]
- 12. Guzek M., Jakubowski Z., Bandosz P., Wyrzykowski B., Smoczyński M., Jabloiska A., and Zdrojewski T. (2012) Inverse association of serum bilirubin with metabolic syndrome and insulin resistance in Polish population. Przegl. Epidemiol. 66, 495–501 [PubMed] [Google Scholar]
- 13. John K., Marino J. S., Sanchez E. R., and Hinds T. D. Jr. (2016) The glucocorticoid receptor: cause of or cure for obesity? Am. J. Physiol. Endocrinol. Metab. 310, E249–E257 10.1152/ajpendo.00478.2015 [DOI] [PMC free article] [PubMed] [Google Scholar]
- 14. Thyagarajan B., and Foster M. T. (2017) Beiging of white adipose tissue as a therapeutic strategy for weight loss in humans. Horm. Mol. Biol. Clin. Investig. 31 10.1515/hmbci-2017-0016 [DOI] [PubMed] [Google Scholar]
- 15. Barbera M. J., Schluter A., Pedraza N., Iglesias R., Villarroya F., and Giralt M. (2001) Peroxisome proliferator-activated receptor α activates transcription of the brown fat uncoupling protein-1 gene: a link between regulation of the thermogenic and lipid oxidation pathways in the brown fat cell. J. Biol. Chem. 276, 1486–1493 10.1074/jbc.M006246200 [DOI] [PubMed] [Google Scholar]
- 16. Rachid T. L., Penna-de-Carvalho A., Bringhenti I., Aguila M. B., Mandarim-de-Lacerda C. A., and Souza-Mello V. (2015) Fenofibrate (PPARα agonist) induces beige cell formation in subcutaneous white adipose tissue from diet-induced male obese mice. Mol. Cell. Endocrinol. 402, 86–94 10.1016/j.mce.2014.12.027 [DOI] [PubMed] [Google Scholar]
- 17. Seale P. (2015) Transcriptional regulatory circuits controlling brown fat development and activation. Diabetes 64, 2369–2375 10.2337/db15-0203 [DOI] [PMC free article] [PubMed] [Google Scholar]
- 18. Kajimura S., Spiegelman B. M., and Seale P. (2015) Brown and beige fat: physiological roles beyond heat generation. Cell Metab. 22, 546–559 10.1016/j.cmet.2015.09.007 [DOI] [PMC free article] [PubMed] [Google Scholar]
- 19. Harms M., and Seale P. (2013) Brown and beige fat: development, function and therapeutic potential. Nat. Med. 19, 1252–1263 10.1038/nm.3361 [DOI] [PubMed] [Google Scholar]
- 20. Kim S. H., and Plutzky J. (2016) Brown fat and browning for the treatment of obesity and related metabolic disorders. Diabetes Metab. J. 40, 12–21 10.4093/dmj.2016.40.1.12 [DOI] [PMC free article] [PubMed] [Google Scholar]
- 21. Rosell M., Kaforou M., Frontini A., Okolo A., Chan Y. W., Nikolopoulou E., Millership S., Fenech M. E., MacIntyre D., Turner J. O., Moore J. D., Blackburn E., Gullick W. J., Cinti S., Montana G., et al. (2014) Brown and white adipose tissues: intrinsic differences in gene expression and response to cold exposure in mice. Am. J. Physiol. Endocrinol. Metab. 306, E945–E964 10.1152/ajpendo.00473.2013 [DOI] [PMC free article] [PubMed] [Google Scholar]
- 22. Christian M. (2015) Transcriptional fingerprinting of “browning” white fat identifies NRG4 as a novel adipokine. Adipocyte 4, 50–54 10.4161/adip.29853 [DOI] [PMC free article] [PubMed] [Google Scholar]
- 23. Rachid T. L., Silva-Veiga F. M., Graus-Nunes F., Bringhenti I., Mandarim-de-Lacerda C. A., and Souza-Mello V. (2018) Differential actions of PPAR-α and PPAR-β/δ on beige adipocyte formation: a study in the subcutaneous white adipose tissue of obese male mice. PLoS ONE 13, e0191365 10.1371/journal.pone.0191365 [DOI] [PMC free article] [PubMed] [Google Scholar]
- 24. Rachid T. L., Penna-de-Carvalho A., Bringhenti I., Aguila M. B., Mandarim-de-Lacerda C. A., and Souza-Mello V. (2015) PPAR-α agonist elicits metabolically active brown adipocytes and weight loss in diet-induced obese mice. Cell Biochem. Funct. 33, 249–256 10.1002/cbf.3111 [DOI] [PubMed] [Google Scholar]
- 25. Stec D. E., John K., Trabbic C. J., Luniwal A., Hankins M. W., Baum J., and Hinds T. D. Jr. (2016) Bilirubin binding to PPARα inhibits lipid accumulation. PLoS ONE 11, e0153427 10.1371/journal.pone.0153427 [DOI] [PMC free article] [PubMed] [Google Scholar]
- 26. Gordon D. M., Blomquist T. M., Miruzzi S. A., McCullumsmith R., Stec D. E., and Hinds T. D. Jr. (2019) RNA-sequencing in human HepG2 hepatocytes reveals PPARα mediates transcriptome responsiveness of bilirubin. Physiol. Genomics 51, 234–240 10.1152/physiolgenomics.00028.2019 [DOI] [PMC free article] [PubMed] [Google Scholar]
- 27. Dunn F. L., Higgins L. S., Fredrickson J., and DePaoli A. M., and INT131-004 study group (2011) Selective modulation of PPARγ activity can lower plasma glucose without typical thiazolidinedione side-effects in patients with Type 2 diabetes. J. Diabetes Complications 25, 151–158 10.1016/j.jdiacomp.2010.06.006 [DOI] [PubMed] [Google Scholar]
- 28. Higgins L. S., and Depaoli A. M. (2010) Selective peroxisome proliferator-activated receptor gamma (PPARγ) modulation as a strategy for safer therapeutic PPARγ activation. Am. J. Clin. Nutr. 91, 267S–272S 10.3945/ajcn.2009.28449E [DOI] [PubMed] [Google Scholar]
- 29. Fruchart J. C. (2013) Selective peroxisome proliferator-activated receptor α modulators (SPPARMα): the next generation of peroxisome proliferator-activated receptor α-agonists. Cardiovasc. Diabetol. 12, 82 10.1186/1475-2840-12-82 [DOI] [PMC free article] [PubMed] [Google Scholar]
- 30. Feldman P. L., Lambert M. H., and Henke B. R. (2008) PPAR modulators and PPAR pan agonists for metabolic diseases: the next generation of drugs targeting peroxisome proliferator-activated receptors?. Curr. Top. Med. Chem. 8, 728–749 10.2174/156802608784535084 [DOI] [PubMed] [Google Scholar]
- 31. Takei R., Inoue T., Sonoda N., Kohjima M., Okamoto M., Sakamoto R., Inoguchi T., and Ogawa Y. (2019) Bilirubin reduces visceral obesity and insulin resistance by suppression of inflammatory cytokines. PLoS ONE 14, e0223302 10.1371/journal.pone.0223302 [DOI] [PMC free article] [PubMed] [Google Scholar]
- 32. Liu J., Dong H., Zhang Y., Cao M., Song L., Pan Q., Bulmer A., Adams D. B., Dong X., and Wang H. (2015) Bilirubin increases insulin sensitivity by regulating cholesterol metabolism, adipokines and PPARγ levels. Sci. Rep. 5, 9886 10.1038/srep09886 [DOI] [PMC free article] [PubMed] [Google Scholar]
- 33. Bougarne N., Weyers B., Desmet S. J., Deckers J., Ray D. W., Staels B., and De Bosscher K. (2018) Molecular actions of PPARα in lipid metabolism and inflammation. Endocr. Rev. 39, 760–802 10.1210/er.2018-00064 [DOI] [PubMed] [Google Scholar]
- 34. Lamola A. A., and Russo M. (2014) Fluorescence excitation spectrum of bilirubin in blood: a model for the action spectrum for phototherapy of neonatal jaundice. Photochem. Photobiol. 90, 294–296 10.1111/php.12167 [DOI] [PMC free article] [PubMed] [Google Scholar]
- 35. McDonagh A. F., Palma L. A., and Lightner D. A. (1982) Phototherapy for neonatal jaundice. Stereospecific and regioselective photoisomerization of bilirubin bound to human serum albumin and NMR characterization of intramolecularly cyclized photoproducts. J. Am. Chem. Soc. 104, 6867–6869 10.1021/ja00388a104 [DOI] [Google Scholar]
- 36. Croce A. C., Ferrigno A., Santin G., Vairetti M., and Bottiroli G. (2014) Bilirubin: an autofluorescence bile biomarker for liver functionality monitoring. J. Biophotonics 7, 810–817 10.1002/jbio.201300039 [DOI] [PubMed] [Google Scholar]
- 37. Petersen C. E., Ha C. E., Harohalli K., Feix J. B., and Bhagavan N. V. (2000) A dynamic model for bilirubin binding to human serum albumin. J. Biol. Chem. 275, 20985–20995 10.1074/jbc.M001038200 [DOI] [PubMed] [Google Scholar]
- 38. Lightner D. A., Wooldridge T. A., and McDonagh A. F. (1979) Photobilirubin: an early bilirubin photoproduct detected by absorbance difference spectroscopy. Proc. Natl. Acad. Sci. U.S.A. 76, 29–32 10.1073/pnas.76.1.29 [DOI] [PMC free article] [PubMed] [Google Scholar]
- 39. Greene B. I., Lamola A. A., and Shank C. V. (1981) Picosecond primary photoprocesses of bilirubin bound to human serum albumin. Proc. Natl. Acad. Sci. U.S.A. 78, 2008–2012 10.1073/pnas.78.4.2008 [DOI] [PMC free article] [PubMed] [Google Scholar]
- 40. Plavskii V. Y., Mostovnikov V. A., Mostovnikova G. R., and Tret'yakova A. I. (2007) Spectral fluorescence and polarization characteristics of Z,Z-bilirubin IXα. J. Appl. Spectrosc. 74, 120–132 10.1007/s10812-007-0019-6 [DOI] [Google Scholar]
- 41. Weaver L., Hamoud A. A., Stec D. E., and Hinds T. D. Jr. (2018) Biliverdin reductase and bilirubin in hepatic disease. Am. J. Physiol. Gastrointest. Liver Physiol. 314, G668–G676 10.1152/ajpgi.00026.2018 [DOI] [PMC free article] [PubMed] [Google Scholar]
- 42. Adeosun S. O., Moore K. H., Lang D. M., Nwaneri A. C., Hinds T. D. Jr., and Stec D. E. (2018) A novel fluorescence-based assay for the measurement of biliverdin reductase activity. React. Oxyg. Species (Apex) 5, 35–45 10.20455/ros.2018.809 [DOI] [PMC free article] [PubMed] [Google Scholar]
- 43. Frydman R. B., Tomaro M. L., Awruch J., and Frydman B. (1982) Molecular forms of biliverdin reductase from rat liver with different reduction rates for biliverdin-IX. Biochem. Biophys. Res. Commun. 105, 752–758 10.1016/0006-291X(82)91498-X [DOI] [PubMed] [Google Scholar]
- 44. Awruch J., Tomaro M. L., Frydman R. B., and Frydman B. (1984) The specificity of biliverdin reductase. The reduction of biliverdin XIII isomers. Biochim. Biophys. Acta 787, 146–151 10.1016/0167-4838(84)90073-6 [DOI] [PubMed] [Google Scholar]
- 45. Frydman R. B., Tomaro M. L., Rosenfeld J., Awruch J., Sambrotta L., Valasinas A., and Frydman B. (1987) Biliverdin reductase: substrate specificity and kinetics. Biochim. Biophys. Acta 916, 500–511 10.1016/0167-4838(87)90197-X [DOI] [PubMed] [Google Scholar]
- 46. Bell J. E., and Maines M. D. (1988) Kinetic properties and regulation of biliverdin reductase. Arch. Biochem. Biophys. 263, 1–9 10.1016/0003-9861(88)90607-8 [DOI] [PubMed] [Google Scholar]
- 47. Hinds T. D. Jr., Burns K. A., Hosick P. A., McBeth L., Nestor-Kalinoski A., Drummond H. A., AlAmodi A. A., Hankins M. W., Vanden Heuvel J. P., and Stec D. E. (2016) Biliverdin reductase A attenuates hepatic steatosis by inhibition of glycogen synthase kinase (GSK) 3β phosphorylation of serine 73 of peroxisome proliferator-activated receptor (PPAR) α. J. Biol. Chem. 291, 25179–25191 10.1074/jbc.m116.731703 [DOI] [PMC free article] [PubMed] [Google Scholar]
- 48. Adeosun S. O., Gordon D. M., Weeks M. F., Moore K. H., Hall J. E., Hinds T. D., and Stec D. E. (2018) Loss of biliverdin reductase-A (BVRA) promotes lipid accumulation and lipotoxicity in mouse proximal tubule cells. Am. J. Physiol. Renal Physiol. 315, F323–F331 [DOI] [PMC free article] [PubMed] [Google Scholar]
- 49. Forbes-Hernández T. Y., Cianciosi D., Ansary J., Mezzetti B., Bompadre S., Quiles J. L., Giampieri F., and Battino M. (2020) Strawberry (Fragaria x ananassa cv. Romina) methanolic extract promotes browning in 3T3-L1 cells. Food Funct. 11, 297–304 10.1039/C9FO02285F [DOI] [PubMed] [Google Scholar]
- 50. Pan Y., Zhao W., Zhao D., Wang C., Yu N., An T., Mo F., Liu J., Miao J., Lv B., Gu Y., Gao S., and Jiang G. (2018) Salvianolic acid B improves mitochondrial function in 3T3-L1 adipocytes through a pathway involving PPARγ coactivator-1α (PGC-1α). Front. Pharmacol. 9, 671 10.3389/fphar.2018.00671 [DOI] [PMC free article] [PubMed] [Google Scholar]
- 51. Festuccia W. T., Oztezcan S., Laplante M., Berthiaume M., Michel C., Dohgu S., Denis R. G., Brito M. N., Brito N. A., Miller D. S., Banks W. A., Bartness T. J., Richard D., and Deshaies Y. (2008) Peroxisome proliferator-activated receptor-γ-mediated positive energy balance in the rat is associated with reduced sympathetic drive to adipose tissues and thyroid status. Endocrinology 149, 2121–2130 10.1210/en.2007-1553 [DOI] [PubMed] [Google Scholar]
- 52. Wang L., Teng R., Di L., Rogers H., Wu H., Kopp J. B., and Noguchi C. T. (2013) PPARα and Sirt1 mediate erythropoietin action in increasing metabolic activity and browning of white adipocytes to protect against obesity and metabolic disorders. Diabetes 62, 4122–4131 10.2337/db13-0518 [DOI] [PMC free article] [PubMed] [Google Scholar]
- 53. Hondares E., Rosell M., Díaz-Delfín J., Olmos Y., Monsalve M., Iglesias R., Villarroya F., and Giralt M. (2011) Peroxisome proliferator-activated receptor α (PPARα) induces PPARγ coactivator 1α (PGC-1α) gene expression and contributes to thermogenic activation of brown fat: involvement of PRDM16. J. Biol. Chem. 286, 43112–43122 10.1074/jbc.M111.252775 [DOI] [PMC free article] [PubMed] [Google Scholar]
- 54. Rakhshandehroo M., Knoch B., Müller M., and Kersten S. (2010) Peroxisome proliferator-activated receptor α target genes. PPAR Res. 2010, 1–20 10.1155/2010/612089 [DOI] [PMC free article] [PubMed] [Google Scholar]
- 55. Abe Y., Rozqie R., Matsumura Y., Kawamura T., Nakaki R., Tsurutani Y., Tanimura-Inagaki K., Shiono A., Magoori K., Nakamura K., Ogi S., Kajimura S., Kimura H., Tanaka T., Fukami K., et al. (2015) JMJD1A is a signal-sensing scaffold that regulates acute chromatin dynamics via SWI/SNF association for thermogenesis. Nat. Commun. 6, 7052 10.1038/ncomms8052 [DOI] [PMC free article] [PubMed] [Google Scholar]
- 56. Martinez-Jimenez C. P., Kyrmizi I., Cardot P., Gonzalez F. J., and Talianidis I. (2010) Hepatocyte nuclear factor 4α coordinates a transcription factor network regulating hepatic fatty acid metabolism. Mol. Cell Biol. 30, 565–577 10.1128/MCB.00927-09 [DOI] [PMC free article] [PubMed] [Google Scholar]
- 57. Fasshauer M., Klein J., Kriauciunas K. M., Ueki K., Benito M., and Kahn C. R. (2001) Essential role of insulin receptor substrate 1 in differentiation of brown adipocytes. Mol. Cell Biol. 21, 319–329 10.1128/MCB.21.1.319-329.2001 [DOI] [PMC free article] [PubMed] [Google Scholar]
- 58. Fasshauer M., Klein J., Ueki K., Kriauciunas K. M., Benito M., White M. F., and Kahn C. R. (2000) Essential role of insulin receptor substrate-2 in insulin stimulation of Glut4 translocation and glucose uptake in brown adipocytes. J. Biol. Chem. 275, 25494–25501 10.1074/jbc.M004046200 [DOI] [PubMed] [Google Scholar]
- 59. González M. D. C., Corton J. C., Acero N., Muñoz-Mingarro D., Quirós Y., Álvarez-Millán J. J., Herrera E., and Bocos C. (2012) Peroxisome proliferator-activated receptor α agonists differentially regulate inhibitor of DNA binding expression in rodents and human cells. PPAR Res. 2012, 1–9 10.1155/2012/483536 [DOI] [PMC free article] [PubMed] [Google Scholar]
- 60. Ren H., Vallanat B., Brown-Borg H. M., Currie R., and Corton J. C. (2010) Regulation of proteome maintenance gene expression by activators of peroxisome proliferator-activated receptor α. PPAR Res. 2010, 1–14 10.1155/2010/727194 [DOI] [PMC free article] [PubMed] [Google Scholar]
- 61. Broekema M. F., Hollman D. A. A., Koppen A., van den Ham H. J., Melchers D., Pijnenburg D., Ruijtenbeek R., van Mil S. W. C., Houtman R., and Kalkhoven E. (2018) Profiling of 3696 nuclear receptor-coregulator interactions: a resource for biological and clinical discovery. Endocrinology 159, 2397–2407 10.1210/en.2018-00149 [DOI] [PubMed] [Google Scholar]
- 62. Lee Y., Kim H., Kang S., Lee J., Park J., and Jon S. (2016) Bilirubin nanoparticles as a nanomedicine for anti-inflammation therapy. Angew. Chem. Int. Ed. Engl. 55, 7460–7463 10.1002/anie.201602525 [DOI] [PubMed] [Google Scholar]
- 63. Kim M. J., Lee Y., Jon S., and Lee D. Y. (2017) PEGylated bilirubin nanoparticle as an anti-oxidative and anti-inflammatory demulcent in pancreatic islet xenotransplantation. Biomaterials 133, 242–252 10.1016/j.biomaterials.2017.04.029 [DOI] [PubMed] [Google Scholar]
- 64. Hinds T. D. Jr., Hosick P. A., Hankins M. W., Nestor-Kalinoski A., and Stec D. E. (2017) Mice with hyperbilirubinemia due to Gilbert's syndrome polymorphism are resistant to hepatic steatosis by decreased serine 73 phosphorylation of PPARα. Am. J. Physiol. Endocrinol. Metab. 312, E244–E252 10.1152/ajpendo.00396.2016 [DOI] [PMC free article] [PubMed] [Google Scholar]
- 65. Gelman L., Michalik L., Desvergne B., and Wahli W. (2005) Kinase signaling cascades that modulate peroxisome proliferator-activated receptors. Curr. Opin. Cell Biol. 17, 216–222 10.1016/j.ceb.2005.02.002 [DOI] [PubMed] [Google Scholar]
- 66. Giudici M., Goni S., Fan R., and Treuter E. (2016) Nuclear receptor coregulators in metabolism and disease. Handb. Exp. Pharmacol. 233, 95–135 10.1007/164_2015_5 [DOI] [PubMed] [Google Scholar]
- 67. Weikum E. R., Liu X., and Ortlund E. A. (2018) The nuclear receptor superfamily: a structural perspective. Protein Sci. 27, 1876–1892 10.1002/pro.3496 [DOI] [PMC free article] [PubMed] [Google Scholar]
- 68. Stec D. E., Gordon D. M., Hipp J. A., Hong S., Mitchell Z. L., Franco N. R., Robison J. W., Anderson C. D., Stec D. F., and Hinds T. D. Jr. (2019) The loss of hepatic PPARα promotes inflammation and serum hyperlipidemia in diet-induced obesity. Am. J. Physiol. Regul. Integr. Comp. Physiol. 317, R733–R745 10.1152/ajpregu.00153.2019 [DOI] [PMC free article] [PubMed] [Google Scholar]
- 69. Matsumoto K., Yu S., Jia Y., Ahmed M. R., Viswakarma N., Sarkar J., Kashireddy P. V., Rao M. S., Karpus W., Gonzalez F. J., and Reddy J. K. (2007) Critical role for transcription coactivator peroxisome proliferator-activated receptor (PPAR)-binding protein/TRAP220 in liver regeneration and PPARα ligand-induced liver tumor development. J. Biol. Chem. 282, 17053–17060 10.1074/jbc.M701956200 [DOI] [PubMed] [Google Scholar]
- 70. Takahashi A., Takaoka S., Kobori S., Yamaguchi T., Ferwati S., Kuba K., Yamamoto T., and Suzuki T. (2019) The CCR4-NOT deadenylase complex maintains adipocyte identity. Int. J. Mol. Sci. 20, 5274 10.3390/ijms20215274 [DOI] [PMC free article] [PubMed] [Google Scholar]
- 71. Miyata K. S., McCaw S. E., Meertens L. M., Patel H. V., Rachubinski R. A., and Capone J. P. (1998) Receptor-interacting protein 140 interacts with and inhibits transactivation by, peroxisome proliferator-activated receptor alpha and liver-X-receptor α. Mol. Cell. Endocrinol. 146, 69–76 10.1016/s0303-7207(98)00196-8 [DOI] [PubMed] [Google Scholar]
- 72. Leonardsson G., Steel J. H., Christian M., Pocock V., Milligan S., Bell J., So P. W., Medina-Gomez G., Vidal-Puig A., White R., and Parker M. G. (2004) Nuclear receptor corepressor RIP140 regulates fat accumulation. Proc. Natl. Acad. Sci. U.S.A. 101, 8437–8442 10.1073/pnas.0401013101 [DOI] [PMC free article] [PubMed] [Google Scholar]
- 73. Rosell M., Jones M. C., and Parker M. G. (2011) Role of nuclear receptor corepressor RIP140 in metabolic syndrome. Biochim. Biophys. Acta 1812, 919–928 10.1016/j.bbadis.2010.12.016 [DOI] [PMC free article] [PubMed] [Google Scholar]
- 74. Debevec D., Christian M., Morganstein D., Seth A., Herzog B., Parker M., and White R. (2007) Receptor interacting protein 140 regulates expression of uncoupling protein 1 in adipocytes through specific peroxisome proliferator activated receptor isoforms and estrogen-related receptor α. Mol. Endocrinol. 21, 1581–1592 10.1210/me.2007-0103 [DOI] [PMC free article] [PubMed] [Google Scholar]
- 75. Handschin C., and Spiegelman B. M. (2008) The role of exercise and PGC1α in inflammation and chronic disease. Nature 454, 463–469 10.1038/nature07206 [DOI] [PMC free article] [PubMed] [Google Scholar]
- 76. Fritah A., Steel J. H., Nichol D., Parker N., Williams S., Price A., Strauss L., Ryder T. A., Mobberley M. A., Poutanen M., Parker M., and White R. (2010) Elevated expression of the metabolic regulator receptor-interacting protein 140 results in cardiac hypertrophy and impaired cardiac function. Cardiovasc. Res. 86, 443–451 10.1093/cvr/cvp418 [DOI] [PMC free article] [PubMed] [Google Scholar]
- 77. Vitek L., Jirsa M., Brodanová M., Kaláb M., Mareček Z., Danzig V., Novotný L., and Kotal P. (2002) Gilbert syndrome and ischemic heart disease: a protective effect of elevated bilirubin levels. Atherosclerosis 160, 449–456 10.1016/S0021-9150(01)00601-3 [DOI] [PubMed] [Google Scholar]
- 78. Lin J. P., O'Donnell C. J., Schwaiger J. P., Cupples L. A., Lingenhel A., Hunt S. C., Yang S., and Kronenberg F. (2006) Association between the UGT1A1*28 allele, bilirubin levels, and coronary heart disease in the Framingham Heart Study. Circulation 114, 1476–1481 10.1161/CIRCULATIONAHA.106.633206 [DOI] [PubMed] [Google Scholar]
- 79. Schwertner H. A., and Vítek L. (2008) Gilbert syndrome, UGT1A1*28 allele, and cardiovascular disease risk: possible protective effects and therapeutic applications of bilirubin. Atherosclerosis 198, 1–11 10.1016/j.atherosclerosis.2008.01.001 [DOI] [PubMed] [Google Scholar]
- 80. Mölzer C., Wallner M., Kern C., Tosevska A., Schwarz U., Zadnikar R., Doberer D., Marculescu R., and Wagner K. H. (2016) Features of an altered AMPK metabolic pathway in Gilbert's syndrome, and its role in metabolic health. Sci. Rep. 6, 30051 10.1038/srep30051 [DOI] [PMC free article] [PubMed] [Google Scholar]
- 81. Mustafa M. G., Cowger M. L., and King T. E. (1969) Effects of bilirubin on mitochondrial reactions. J. Biol. Chem. 244, 6403–6414 [PubMed] [Google Scholar]
- 82. Stumpf D. A., Eguren L. A., and Parks J. K. (1985) Bilirubin increases mitochondrial inner membrane conductance. Biochem. Med. 34, 226–229 10.1016/0006-2944(85)90115-2 [DOI] [PubMed] [Google Scholar]
- 83. O'Brien L., Hosick P. A., John K., Stec D. E., and Hinds T. D. Jr. (2015) Biliverdin reductase isozymes in metabolism. Trends Endocrinol. Metab. 26, 212–220 10.1016/j.tem.2015.02.001 [DOI] [PMC free article] [PubMed] [Google Scholar]
- 84. Stec D. E., Gordon D. M., Nestor-Kalinoski A. L., Donald M. C., Mitchell Z. L., Creeden J. F., and Hinds T. D. Jr. (2020) Biliverdin reductase A (BVRA) knockout in adipocytes induces hypertrophy and reduces mitochondria in white fat of obese mice. Biomolecules 10, 387 10.3390/biom10030387 [DOI] [PMC free article] [PubMed] [Google Scholar]
- 85. Vítek L. (2020) Bilirubin as a signaling molecule. Med. Res. Rev. 10.1002/med.21660 [DOI] [PubMed] [Google Scholar]
- 86. Levi A. J., Gatmaitan Z., and Arias I. M. (1969) Two hepatic cytoplasmic protein fractions, Y and Z, and their possible role in the hepatic uptake of bilirubin, sulfobromophthalein, and other anions. J. Clin. Invest. 48, 2156–2167 10.1172/JCI106182 [DOI] [PMC free article] [PubMed] [Google Scholar]
- 87. Kumagai A., Ando R., Miyatake H., Greimel P., Kobayashi T., Hirabayashi Y., Shimogori T., and Miyawaki A. (2013) A bilirubin-inducible fluorescent protein from eel muscle. Cell 153, 1602–1611 10.1016/j.cell.2013.05.038 [DOI] [PubMed] [Google Scholar]
- 88. Hughes M. L., Liu B., Halls M. L., Wagstaff K. M., Patil R., Velkov T., Jans D. A., Bunnett N. W., Scanlon M. J., and Porter C. J. (2015) Fatty acid-binding proteins 1 and 2 differentially modulate the activation of peroxisome proliferator-activated receptor α in a ligand-selective manner. J. Biol. Chem. 290, 13895–13906 10.1074/jbc.M114.605998 [DOI] [PMC free article] [PubMed] [Google Scholar]
- 89. Haluzik M., Gavrilova O., and LeRoith D. (2004) Peroxisome proliferator-activated receptor-α deficiency does not alter insulin sensitivity in mice maintained on regular or high-fat diet: hyperinsulinemic-euglycemic clamp studies. Endocrinology 145, 1662–1667 10.1210/en.2003-1015 [DOI] [PubMed] [Google Scholar]
- 90. Defour M., Dijk W., Ruppert P., Nascimento E. B. M., Schrauwen P., and Kersten S. (2018) The peroxisome proliferator-activated receptor α is dispensable for cold-induced adipose tissue browning in mice. Mol. Metab. 10, 39–54 10.1016/j.molmet.2018.01.023 [DOI] [PMC free article] [PubMed] [Google Scholar]
- 91. Lasar D., Rosenwald M., Kiehlmann E., Balaz M., Tall B., Opitz L., Lidell M. E., Zamboni N., Krznar P., Sun W., Varga L., Stefanicka P., Ukropec J., Nuutila P., Virtanen K., et al. (2018) Peroxisome proliferator activated receptor γ controls mature brown adipocyte inducibility through glycerol kinase. Cell Rep. 22, 760–773 10.1016/j.celrep.2017.12.067 [DOI] [PubMed] [Google Scholar]
- 92. Shen Y., Su Y., Silva F. J., Weller A. H., Sostre-Colón J., Titchenell P. M., Steger D. J., Seale P., and Soccio R. E. (2020) Shared PPARα/γ target genes regulate brown adipocyte thermogenic function. Cell Rep. 30, 3079–3091.e5 10.1016/j.celrep.2020.02.032 [DOI] [PubMed] [Google Scholar]
- 93. Sakamoto T., Nitta T., Maruno K., Yeh Y. S., Kuwata H., Tomita K., Goto T., Takahashi N., and Kawada T. (2016) Macrophage infiltration into obese adipose tissues suppresses the induction of UCP1 level in mice. Am. J. Physiol. Endocrinol. Metab. 310, E676–E687 10.1152/ajpendo.00028.2015 [DOI] [PubMed] [Google Scholar]
- 94. Sakamoto T., Takahashi N., Sawaragi Y., Naknukool S., Yu R., Goto T., and Kawada T. (2013) Inflammation induced by RAW macrophages suppresses UCP1 mRNA induction via ERK activation in 10T1/2 adipocytes. Am. J. Physiol. Cell Physiol. 304, C729–C738 10.1152/ajpcell.00312.2012 [DOI] [PMC free article] [PubMed] [Google Scholar]
- 95. Hinds T. D., John K., McBeth L., Trabbic C. J., and Sanchez E. R. (2016) Timcodar (VX-853) is a non-FKBP12 binding macrolide derivative that inhibits PPARγ and suppresses adipogenesis. PPAR Res. 2016, 1–10 10.1155/2016/6218637 [DOI] [PMC free article] [PubMed] [Google Scholar]
- 96. Festuccia W. T., Blanchard P. G., Turcotte V., Laplante M., Sariahmetoglu M., Brindley D. N., Richard D., and Deshaies Y. (2009) The PPARγ agonist rosiglitazone enhances rat brown adipose tissue lipogenesis from glucose without altering glucose uptake. Am. J. Physiol. Regul. Integr. Comp. Physiol. 296, R1327–R1335 10.1152/ajpregu.91012.2008 [DOI] [PubMed] [Google Scholar]
- 97. Brunmeir R., and Xu F. (2018) Functional regulation of PPARs through post-translational modifications. Int. J. Mol. Sci. 19, 1738 10.3390/ijms19061738 [DOI] [PMC free article] [PubMed] [Google Scholar]
- 98. Seo Y. S., Kim J. H., Jo N. Y., Choi K. M., Baik S. H., Park J. J., Kim J. S., Byun K. S., Bak Y. T., Lee C. H., Kim A., and Yeon J. E. (2006) PPAR agonists treatment is effective in a nonalcoholic fatty liver disease animal model by modulating fatty-acid metabolic enzymes. J. Gastroenterol. Hepatol. 23, 102–109 10.1111/j.1440-1746.2006.04819.x [DOI] [PubMed] [Google Scholar]
- 99. Harano Y., Yasui K., Toyama T., Nakajima T., Mitsuyoshi H., Mimani M., Hirasawa T., Itoh Y., and Okanoue T. (2006) Fenofibrate, a peroxisome proliferator-activated receptor α agonist, reduces hepatic steatosis and lipid peroxidation in fatty liver Shionogi mice with hereditary fatty liver. Liver Int. 26, 613–620 10.1111/j.1478-3231.2006.01265.x [DOI] [PubMed] [Google Scholar]
- 100. Goto T., Lee J. Y., Teraminami A., Kim Y. I., Hirai S., Uemura T., Inoue H., Takahashi N., and Kawada T. (2011) Activation of peroxisome proliferator-activated receptor-α stimulates both differentiation and fatty acid oxidation in adipocytes. J. Lipid Res. 52, 873–884 10.1194/jlr.M011320 [DOI] [PMC free article] [PubMed] [Google Scholar]
- 101. Larter C. Z., Yeh M. M., Van Rooyen D. M., Brooling J., Ghatora K., and Farrell G. C. (2012) Peroxisome proliferator-activated receptor-α agonist, Wy 14,643, improves metabolic indices, steatosis and ballooning in diabetic mice with non-alcoholic steatohepatitis. J. Gastroenterol. Hepatol. 27, 341–350 10.1111/j.1440-1746.2011.06939.x [DOI] [PubMed] [Google Scholar]
- 102. Tsuchida A., Yamauchi T., Takekawa S., Hada Y., Ito Y., Maki T., and Kadowaki T. (2005) Peroxisome proliferator-activated receptor (PPAR)α activation increases adiponectin receptors and reduces obesity-related inflammation in adipose tissue: comparison of activation of PPARα, PPARγ, and their combination. Diabetes 54, 3358–3370 10.2337/diabetes.54.12.3358 [DOI] [PubMed] [Google Scholar]
- 103. Chen W. C., Huang W. C., Chiu C. C., Chang Y. K., and Huang C. C. (2014) Whey protein improves exercise performance and biochemical profiles in trained mice. Med. Sci. Sports Exerc. 46, 1517–1524 10.1249/MSS.0000000000000272 [DOI] [PMC free article] [PubMed] [Google Scholar]
- 104. Andersson C., Weeke P., Fosbøl E. L., Brendorp B., Køber L., Coutinho W., Sharma A. M., Van Gaal L., Finer N., James W. P., Caterson I. D., Rode R. A., Torp-Pedersen C., SCOUT Executive Steering Committee, and SCOUT investigators (2009) Acute effect of weight loss on levels of total bilirubin in obese, cardiovascular high-risk patients: an analysis from the lead-in period of the Sibutramine Cardiovascular Outcome trial. Metabolism 58, 1109–1115 10.1016/j.metabol.2009.04.003 [DOI] [PubMed] [Google Scholar]
- 105. Wang S., Lin Y., Zhou Z., Gao L., Yang Z., Li F., and Wu B. (2019) Circadian clock gene Bmal1 regulates bilirubin detoxification: a potential mechanism of feedback control of hyperbilirubinemia. Theranostics 9, 5122–5133 10.7150/thno.35773 [DOI] [PMC free article] [PubMed] [Google Scholar]
- 106. Preidis G. A., Kim K. H., and Moore D. D. (2017) Nutrient-sensing nuclear receptors PPARα and FXR control liver energy balance. J. Clin. Invest. 127, 1193–1201 10.1172/JCI88893 [DOI] [PMC free article] [PubMed] [Google Scholar]
- 107. Jang B. K. (2012) Elevated serum bilirubin levels are inversely associated with nonalcoholic fatty liver disease. Clin. Mol. Hepatol. 18, 357–359 10.3350/cmh.2012.18.4.357 [DOI] [PMC free article] [PubMed] [Google Scholar]
- 108. Kwak M. S., Kim D., Chung G. E., Kang S. J., Park M. J., Kim Y. J., Yoon J. H., and Lee H. S. (2012) Serum bilirubin levels are inversely associated with nonalcoholic fatty liver disease. Clin. Mol. Hepatol. 18, 383–390 10.3350/cmh.2012.18.4.383 [DOI] [PMC free article] [PubMed] [Google Scholar]
- 109. Jo J., Yun J. E., Lee H., Kimm H., and Jee S. H. (2011) Total, direct, and indirect serum bilirubin concentrations and metabolic syndrome among the Korean population. Endocrine 39, 182–189 10.1007/s12020-010-9417-2 [DOI] [PubMed] [Google Scholar]
- 110. Hinds T. D. Jr., and Stec D. E. (2018) Bilirubin, a cardio-metabolic signaling molecule. Hypertension 72, 788–795 10.1161/HYPERTENSIONAHA.118.11130 [DOI] [PMC free article] [PubMed] [Google Scholar]
- 111. Sundararaghavan V. L., Binepal S., Stec D. E., Sindhwani P., and Hinds T. D. Jr. (2018) Bilirubin, a new therapeutic for kidney transplant?. Transplant. Rev. (Orlando) 32, 234–240 10.1016/j.trre.2018.06.003 [DOI] [PMC free article] [PubMed] [Google Scholar]
- 112. Vítek L. (2019) Bilirubin as a predictor of diseases of civilization. Is it time to establish decision limits for serum bilirubin concentrations?. Arch. Biochem. Biophys. 672, 108062 10.1016/j.abb.2019.108062 [DOI] [PubMed] [Google Scholar]
- 113. Bosma P. J. (2003) Inherited disorders of bilirubin metabolism. J. Hepatol. 38, 107–117 10.1016/S0168-8278(02)00359-8 [DOI] [PubMed] [Google Scholar]
- 114. Meixiong J., Vasavda C., Green D., Zheng Q., Qi L., Kwatra S. G., Hamilton J. P., Snyder S. H., and Dong X. (2019) Identification of a bilirubin receptor that may mediate a component of cholestatic itch. Elife 8, e44116 10.7554/eLife.44116 [DOI] [PMC free article] [PubMed] [Google Scholar]
- 115. Hales C. M., Fryar C. D., Carroll M. D., Freedman D. S., and Ogden C. L. (2018) Trends in obesity and severe obesity prevalence in US youth and adults by sex and age, 2007-2008 to 2015-2016. JAMA 319, 1723–1725 10.1001/jama.2018.3060 [DOI] [PMC free article] [PubMed] [Google Scholar]
- 116. Hinds T. D. Jr., and Stec D. E. (2019) Bilirubin safeguards cardiorenal and metabolic diseases: a protective role in health. Curr. Hypertens. Rep. 21, 87 10.1007/s11906-019-0994-z [DOI] [PMC free article] [PubMed] [Google Scholar]
- 117. Parlee S. D., Lentz S. I., Mori H., and MacDougald O. A. (2014) Quantifying size and number of adipocytes in adipose tissue. Methods Enzymol. 537, 93–122 10.1016/B978-0-12-411619-1.00006-9 [DOI] [PMC free article] [PubMed] [Google Scholar]
- 118. Sun Z., Xue X., Zhang Y., Niu R., and Wang J. (2017) Effect of sodium fluoride on the sperm mitochondrial DNA in mice. Biochem. Biophys. Res. Commun. 492, 295–299 10.1016/j.bbrc.2017.08.129 [DOI] [PubMed] [Google Scholar]
- 119. Ebke L. A., Nestor-Kalinoski A. L., Slotterbeck B. D., Al-Dieri A. G., Ghosh-Lester S., Russo L., Najjar S. M., von Grafenstein H., and McInerney M. F. (2014) Tight association between macrophages and adipocytes in obesity: implications for adipocyte preparation. Obesity (Silver Spring) 22, 1246–1255 10.1002/oby.20634 [DOI] [PMC free article] [PubMed] [Google Scholar]
- 120. Hinds T. D. Jr., Stechschulte L. A., Cash H. A., Whisler D., Banerjee A., Yong W., Khuder S. S., Kaw M. K., Shou W., Najjar S. M., and Sanchez E. R. (2011) Protein phosphatase 5 mediates lipid metabolism through reciprocal control of glucocorticoid receptor and peroxisome proliferator-activated receptor-γ (PPARγ). J. Biol. Chem. 286, 42911–42922 10.1074/jbc.M111.311662 [DOI] [PMC free article] [PubMed] [Google Scholar]
- 121. Stechschulte L. A., Hinds T. D. Jr., Khuder S. S., Shou W., Najjar S. M., and Sanchez E. R. (2014) FKBP51 controls cellular adipogenesis through p38 kinase-mediated phosphorylation of GRα and PPARγ. Mol. Endocrinol. 28, 1265–1275 10.1210/me.2014-1022 [DOI] [PMC free article] [PubMed] [Google Scholar]
- 122. Stechschulte L. A., Qiu B., Warrier M., Hinds T. D. Jr., Zhang M., Gu H., Xu Y., Khuder S. S., Russo L., Najjar S. M., Lecka-Czernik B., Yong W., and Sanchez E. R. (2016) FKBP51 null mice are resistant to diet-Induced obesity and the PPARγ agonist rosiglitazone. Endocrinology 157, 3888–3900 10.1210/en.2015-1996 [DOI] [PMC free article] [PubMed] [Google Scholar]
- 123. Stechschulte L. A., Hinds T. D. Jr., Ghanem S. S., Shou W., Najjar S. M., and Sanchez E. R. (2014) FKBP51 reciprocally regulates GRα and PPARγ activation via the Akt-p38 pathway. Mol. Endocrinol. 28, 1254–1264 10.1210/me.2014-1023 [DOI] [PMC free article] [PubMed] [Google Scholar]
Associated Data
This section collects any data citations, data availability statements, or supplementary materials included in this article.
Supplementary Materials
Data Availability Statement
All data not included in the article are available upon request from the corresponding author (Terry D. Hinds, Terry.Hinds@utoledo.edu).