

Abstract
Our understanding of adipose tissue biology has steadily evolved. While structural and energy storage functionalities have been in the forefront, a key endocrine role for adipocytes was revealed only over the last few decades. In contrast to the wealth of information on dynamic function of other endocrine tissues, few studies have focused on dynamic adipose tissue function or on tool development toward that end. Here, we apply our unique droplet-based microfluidic devices to culture, perfuse, and sample secretions from primary murine epididymal white adipose tissue (eWAT), and from predifferentiated clusters of 3T3-L1 adipocytes. Through automated control, oil-segmented aqueous droplets (~2.6 nL) were sampled from tissue or cells at 3.5-second temporal resolution (including sample and reference droplets), with integrated enzyme assays enabling real-time quantification of glycerol (down to 1.9 fmol droplet−1). This high resolution revealed previously unreported oscillations in secreted glycerol at frequencies of 0.2 to 2.0 min−1 (~30-300 s periods) present in the primary tissue but not in clustered cells. Low-level bursts (~50 fmol) released in basal conditions were contrasted with larger bursts (~300 fmol) during stimulation. Further, both fold changes and burst magnitudes were decreased in eWAT of aged and obese mice. These results, combined with immunostaining and photobleaching analyses, suggest that gap-junctional coupling or nerve cell innervation within the intact ex-vivo tissue explants play important roles in this apparent tissue-level, lipolytic synchronization. High-resolution, quantitative sampling by droplet microfluidics thus permitted unique biological information to be observed, giving an analytical framework poised for future studies of dynamic oscillatory function of adipose and other tissues.
Graphical Abstract
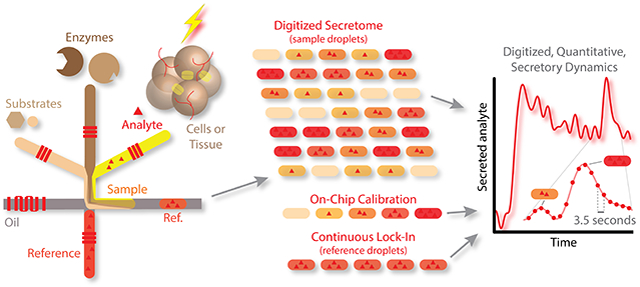
High temporal resolution sampling and quantitative detection of glycerol secretion dynamics from adipose tissue using our automated, droplet-based microfluidic system.
Introduction
Dynamic studies of hormone and metabolite secretion from cells and tissues are critical to understand their biochemical and physiological functions and to develop therapeutics for related diseases. Traditionally, secretion sampling from cells or tissues is done in tubes or well-plates, and the typical temporal resolution is around one to five minutes for metabolites and tens of minutes to hours for hormones, depending on the abundance of targets and restricted by manual handling 1-4. In tube- or well-based secretion sampling, a large amount of tissue or cells is required, the temporal resolution is limited, and the sampling from such a static culture system can give results that are significantly different from the true, in vivo response 5-8.
In particular, our understanding of dynamic functionality in adipose tissue is limited, perhaps due to the belated perspective on its endocrine nature as well as the additional culture and sampling challenges caused by adipocyte buoyancy 9. It is clear that better tools are needed for this purpose, and these tools will require some customized features to deal with adipose tissue. The tissue—particularly the primary ex vivo adipose explants taken from mice and used in this work—consists mainly of adipocyte cell units (one cell can be >100 μm in diameter), each with a single large lipid droplet for storage of triglycerides. Because the lipid droplet occupies most of the cell volume, the tissue is less dense than aqueous solutions, and it floats to the top of the solution via buoyancy. In a recent review article, our group outlined the history and future challenges in integrating this tissue with microfluidic devices9; for specific protocols, we refer readers to our book chapter on the subject.10 While adipose tissue has long been known to store triglycerides for energy, it is now known to be an important component of the endocrine system and a player in disease states such as diabetes, obesity, and metabolic syndrome. The tissue secretes hormones, responds to stimuli, and is interconnected with the immune system. White adipose tissue (WAT) as used herein consists of multiple cell types, including adipocytes, precursor cells, fibroblasts, vascular cells, macrophages, smooth muscle, and immune cells. Because all of these cells can have significant effects on the functionality, it is important to leverage ex vivo tissue explants to glean more relevant biological function. In this work, we focus on studies that switch from an energy-rich environment to an energy-deficient environment using hormonal (insulin), nutritional (glucose), and nervous system (isoproterenol) stimulants. This feeding-to-fasting switch results in hydrolysis of triacylglycerols, releasing non-esterified fatty acids (NEFA) and glycerol. Very little is known about the dynamics of these processes, representing an opportunity for microfluidic sampling to give meaningful biological information.
In this manner, with a substantial increase in biological applications of microfluidic devices recently, the state-of-the-art in cell culture systems and their temporal limitations have begun to change. Microfluidics has been affirmed as a powerful tool in studies of cell biology such as proliferation, growth, mobility, or response to chemical stimuli 11-16. As noted earlier, one particularly suitable application of microfluidic devices is the investigation of dynamics in ions, genomics, and proteomics in cells or tissues under varying treatments, due to the automatic and precise control of chemical and mechanical microenvironments offered by microfabricated systems, which can better mimic the in vivo situation 13, 17, 18. Dynamic changes in metabolites such as glucose, fatty acids, and glycerol are integral to cytokine secretion and cell function in the pancreas, liver, and adipose tissue, yet current techniques remain inadequate to answer questions on short time scales from small amounts of tissue. Needs for improved capabilities, such as on-chip integration of sampling and detection, has led our group and others to develop bioanalytical microfluidic tools for culture or sampling of adipose cells and tissues 10, 18-29. Continuous-flow systems for high sampling resolution have been developed by Kennedy and co-workers, where integrated enzyme assays quantified secreted glycerol and non-esterized fatty acids from 3T3-L1 adipocytes 20, 21, and by our group from primary adipose tissue using automated microfluidic sampling 24. To date, however, many dynamic aspects of the tissue’s function remain a mystery due to a lack of adequate temporal resolution caused by dispersion within mixing channels or static culture conditions. We have recently shown that this problem can be addressed using droplet microfluidics with integrated, mix-and-read immunoassays, permitting continuous 15-second measurements of insulin secreted by single pancreatic islets 25. However, this system did not reach its defined theoretical limit of ~2-second resolution, and it was not yet feasible to integrate buoyant adipose tissue explant culture into the microdevice. This work has therefore set the stage for modifications to allow unique experiments on other tissues, such as adipose tissue, and it is clear that device improvements are needed to push the system toward its resolution limit (defined by dispersion from channel dimensions and valve actuation). 25, 30, 31
In this work, our aqueous-in-oil droplet sampling device 25 was significantly improved to allow an unprecedented 3.5-second temporal resolution, and the introduction of additional assay reagent channels permitted on-chip integrated enzyme reactions for real-time glycerol quantification from cells or tissues. The results revealed previously unreported dynamic behavior in the adipose tissue, which was not present in clustered cell lines. Both peaks and valleys of tissue-secreted glycerol were captured into ~2.6 nL aqueous droplets segmented by an oil phase, allowing unique quantitative burst analyses on wild-type, aged, and obese tissues. As described in detail below, such high resolution results revealed, for the first time, cell-to-cell communication in adipose tissue that is similar to that of pancreatic endocrine tissue. This novel biological finding was repeatedly observed in multiple mice (wild-type and diseased) and from numerous tissue explants, and the results open a new line of future biological inquiry that can be pursued using our automated, droplet-based microfluidic sampling systems.
Results and Discussion
Microchip Design and Function.
Adipose tissue is a critical organ for energy homeostasis by regulating glucose and fat metabolism, and it is also an endocrine organ 9, 32. A variety of small molecules are taken up by and released from adipocytes tissue under the regulation of several hormones 33, and it is important to quantify the uptake and secretion dynamics of these molecules to improve our understanding of the physiological and pathological functions of the tissue. A number of enzymatic assays for small molecules are well-developed, e.g. assays for glucose, glycerol, and non-esterized fatty acids. This improved microfluidic droplet system was designed for sampling into segmented aqueous droplets, reaction of the secretome with enzymatic assay reagents, on-chip incubation, and on-chip readout at higher temporal resolution. The modified droplet-based microfluidic device includes three input channels for substrate, enzyme, and secretion sampling; a T-junction for droplet formation with another inlet for perfluorinated oil as the continuous phase; a reference inlet to introduce our lock-in methodology for high sensitivity quantification 30, 31; and a long incubation channel for the reaction of assay reagents with analytes (Fig. 1A). To improve temporal resolution beyond the 15 seconds achieved previously 25, a serpentine-shaped microvalve with five crossing points was exploited in this device to enhance contact area, effectively increasing oil pumping volume by 8-fold for each pump cycle, giving a volumetric rate of 9.3 μL h−1 (Fig. S-3). This new design could generate droplets faster and achieve higher temporal resolution, as low as ~3.5 seconds (total time for two droplets, one sample and one reference).
Figure 1.

Microchip design and experimental setup for high temporal resolution sampling and quantitative detection of glycerol secretion dynamics from primary adipose tissue (eWAT) explants. A) Two-layer microfluidic chip design; short red lines, representing microvalves, were in the bottom layer for pneumatic control; inlets, flow channels (black), and incubation channel (orange) were in the top layer for fluid flow. B) 3D CAD depictions of 3D-printed template (dark gray) for cell culture reservoir fabrication, and the 3D-printed insert (red) used in eWAT tissue sampling to trap the tissue in the reservoir during solution exchange. C) Schematic figure of the cross-section of cell/tissue-culture reservoir, through which one explant or cell spheroid was sampled in each experiment. D) Photograph of the experimental setup on the stage of a fluorescence microscope, connected to pneumatic solenoid switches. Scale bar = 1 cm. E) Sliced cross section of cell/tissue reservoir. The upper open reservoir was for bulk solution, and the narrow lower part was for trapping tissue or cell spheroids close to the microchannel. Scale bar = 500 μm. F) Formed droplets containing digitized secretome as they flowed through the long-incubation channel, with small-sized droplets as references and large sample droplets (see supplementary video 1). Scale bar = 500 μm. Glycerol secretions from tissue or cells were stored in the 2.6-nL sample droplets, digitizing the secretory trace in time. Sample and reference droplets were generated alternatively (total of 3.5 s for one pair) each then sequentially passed by the optical window in part A for lock-in detection30, 31, 34 and calibration. G) Example eWAT tissue image in the narrow part of the reservoir in E, connected to the microchannel for sampling into droplets. Scale bar = 150 μm.
Since adipocytes are buoyant, another important component of the chip is the cell-culture reservoir (Fig. 1E), fabricated by 3D-printed templating 19, 25. As the schematic in Fig. 1C demonstrates, the treatment solution was continuously flowing through the tissue (one explant or cell spheroid per experiment), carrying all secreted analytes into the microchannel to be trapped into droplets thereafter. The continuous flow brings fresh media to tissue or cells and takes metabolic molecules away, reducing auto-inhibition of biochemical reactions in the cell—arguably more akin to the in vivo situation. We previously showed this sampling design capable of complete capture of analytes from pancreatic islet tissue with high temporal resolution 25. The flow rate of media was determined to be 120 ± 22 μL min−1 per gram of cells or tissue in our system (6 different explants), which was designed to be similar to the experimental measurement of blood flow rate through epididymal adipose tissue in the morning, 100 ± 10 μL min−1 per gram tissue in un-anesthetized rats 35. From the secretion plots below and from calculated flow rates in our previous tests 25, we concluded that this sampling flow rate was appropriate to carry away secreted analytes without accumulation in the reservoir. This represents a major difference between our continuous flow sampling system and more standard, static sampling methods in tubes or well-plates.
Real-time Quantification of Glycerol Release from 3T3-L1 Adipocytes.
Differentiated from 3T3-L1 fibroblasts, 3T3-L1 adipocytes are typically characterized as white adipocytes in their basal bioenergetics and gene expression profile, and they respond sensitively to catecholamines and insulin; the cells are widely used as an in vitro model of white adipocytes36. To validate that secreted analytes could be quantified in real time via the microfluidic droplet system, glycerol secretion from 3D spheroids of these cells (~200 μm diameter; Fig. S-8 and supplementary video 2) was quantified under different treatments. In Fig. 2A, the lipid droplets in the cells were stained by LipidTox Green to visualize trapped adipocytes and confirm their presence in agarose spheroids. While changing the treatment from high glucose with high insulin (HGHI) to low glucose with low insulin and 20 μM isoproterenol (LGLIS), the glycerol released from these adipocyte spheroids was sampled using our microfluidic device, combined with enzyme assay reagents into segmented droplets, then detected by fluorescence imaging in the downstream channel. Isoproterenol, a beta adrenergic agonist, is known to help mimic fasting by stimulating triglyceride breakdown (lipolysis) and release of free fatty acids and glycerol. The processed and calibrated data from 3 representative cell spheroids is shown in Fig. 2A. Glycerol release from the spheroids was observed to increase almost immediately after stimulation, and the secreted amount was increased by 2.5- to 5.5-fold compared to baseline. There appeared to be a correlation of secreted glycerol amount with adipocyte cell number in the spheroids; unfortunately accurate cell counting was not feasible in these studies due to the technical difficulty with recovery, dispersal, and counting. Previous results from others using continuous flowing microfluidics have reported similar fold changes 37. Also noteworthy is the relatively constant secretion rate that was observed both before and after stimulation, an important point for comparison to tissue results below. Thus, our high-resolution microfluidic droplet sampling system with an integrated enzyme assay was proven functional for assaying cellular secretions and was capable of studying the rapid response of cells to stimuli.
Figure 2.

High resolution temporal sampling and quantification of glycerol secretions from adipocyte spheroids and adipose tissue explants. A) Glycerol release from 3T3-L1 adipocyte spheroids responded quickly, with sustained release rates before and after treatments. Insets show merged DIC and fluorescence images of stained adipocytes in the spheroids. B) By contrast, glycerol release from primary murine eWAT explants (12-week old mice) was observed to both increase and to oscillate. The middle frame (eWAT_2) shows a zoomed version of several bursts captured by a series of droplets sampled at dt = 3.48 seconds. C) Glycerol release from eWAT explants from 20-week old mice was less pronounced, more akin to 3T3-L1 cell spheroids. D) Similar patterns were seen from explants of 20-week old diet-induced obese (DIO) mice. E) Compiled fold changes of the sustained glycerol release from the 3T3-L1 cell spheroids and the three different types of eWAT explants after changing the treatment from the HGHI to LGLIS. “HGHI” = 25 mM glucose, 2 nM insulin in DMEM, with 0.25% BSA; “LGLIS” = 3 mM glucose, 50 pM insulin, with 20 μM isoproterenol in DMEM, with 0.25% BSA. Signals from droplet digitized secretomes (parts A-D) were converted to glycerol quantities—with high precision and very low signal drift—using digitized calibration curves through our recently developed lock-in detection methodology30, 31, 34 , described in detail in Supplementary Information (Fig. S-1 through Fig. S-6).
Real-time Quantification of Glycerol Release from eWAT.
Primary cells are considered as ideal models for drug discovery and toxicity tests because they are representative of phenotypic gene expression and behavior of organs38, as they have undergone development and maturation throughout the life of the animal. However, even short periods of culturing can reduce their specificities if the cells are isolated from the surrounding tissue by digestion. Therefore, when available, undigested primary tissue explants should provide better in vitro models and should present more organotypic secretomes. For this reason, we have used our device to sample glycerol secretion ex vivo from primary murine eWAT explants. At appropriate sizes (~0.12 ± 0.02 μL explant volumes) for scaling with the chip operation, eWAT explants were loaded into the cell culture reservoir, and glycerol secretion under different treatments was sampled into droplets and quantified. As shown in Fig. 2B, fast and dramatic changes were observed within one minute after changing the treatment from HGHI to LGLIS, and obvious dynamic changes were superimposed upon these responses. Note that these fast changes would not have been observable with other analytical systems, which would have under-sampled the rapid bursts and given a smoothed trace. It is by droplet-based segmentation at our unprecedented 3.5-second temporal resolution that these observations were possible. Surprisingly, glycerol release from eWAT explants exhibited a unique oscillatory pattern (Fig. 2B), a pattern that was not observed in encapsulated 3T3-L1 adipocytes (Fig. 2A). Multiple explants from two 12-week old wild-type mice were tested, and the three representative experiments shown in Fig. 2B exhibited similar oscillations with periods of ~30 to 300 s (frequency range of ~0.2 to 2.0 min−1). A few experiments showed some heterogeneity between mice with somewhat different oscillation patterns (see Fig. 6A). These data show that our high-resolution microfluidic sampling system was capable of observing unique function in adipose tissue.
Figure 6.

Evidence for cell-to-cell connectivity in adipose tissue explants. A) Glycerol release from eWAT explants (12- and 17-week ages, respectively) treated sequentially by HGHI, LGLIS, HGHI + 100 μM 2-APB, and LGLIS + 100 μM 2-APB. Stimulatory conditions enhanced glycerol secretion as usual, but a gap junction inhibitor drug (2-APB) prevented stimulatory effects upon the second treatment. B) An FFT spectrogram shows oscillatory bursts of glycerol were amplified by stimulation with LGLIS, while 2-APB treatment caused a loss of oscillatory magnitude even in the presence of the stimulant, with an apparent preference toward loss of higher frequency oscillations.
Additional observations were made by sampling at high resolution from explants of aged (20 weeks) or diet-induced obese (DIO) mice (Fig. 2C-D), where a reduced level of oscillatory function was observed in both cases. Also, by comparing pre- and post-treatment levels (Fig. 2E), we observed that the overall average increase in secreted glycerol from adipose tissue explants (12-week WT) was similar to the response from 3T3-L1 adipocytes used in the sixth day after differentiation, with both increasing 3- to 5-fold after treatments. These data suggested that the tissue and encapsulated cells were functioning as expected in the microfluidic devices. Conversely, aged (~20 weeks) and obese (DIO) mice showed decreased fold-changes, perhaps related to decreased connectivity as discussed below.
Unique, Technology-Enabled Data Analyses.
Since our micro-analytical system sampled at such high temporal resolution, it was possible to delve deeper into the analysis and carry out fast Fourier transforms (FFTs) on the data. Fig. 3 and Fig. S-9 show the comparisons of oscillatory patterns between encapsulated cell lines and eWAT explants. A windowed, sliding FFT method (128-point moving window, 7.42 min) was applied to give the time-dependent spectrograms of glycerol secretion shown in Fig. 3. Even with glycerol secretion intensities represented on a logarithmic scale, mere hints of lower frequency oscillations were observed from cell spheroids (left data), and treatment-dependent changes were not observed. These spectrograms were relatively flat and featureless, akin to those of the cell-free standard curve (not shown). By contrast, rich patterns of oscillatory glycerol secretion were observed in the frequency domain data from eWAT tissue explants (right data). All eWAT explants showed strong oscillatory function at frequencies in the range of ~0.2 and 1.2 min−1 (~50 to 300 s periods), with an additional group of fast oscillations at ~2 min−1 (~30 second period). Another important observation is that the oscillations were at lower intensities under HGHI treatment, then they were quickly amplified by the LGLIS treatment. In other words, basal oscillations were present at low levels and were simply potentiated by the treatment, which is a unique observation in adipose tissue enabled by our methodology.
Figure 3.

Unique oscillation analysis of glycerol release (FFT spectrograms) enabled by microfluidic droplet sampling. eWAT explants exhibited treatment-responsive oscillations in glycerol release in the frequency range of 0.2 to 2.0 min−1 (periods from ~30 to 300 s), while 3T3-L1 adipocyte spheroids were essentially quiet. Vertical dashed lines depict the exact treatment times. The legend at right shows glycerol burst intensity on a logarithmic scale with a “16-color” colormap.
Using a more simplified visualization, a low-pass filter with 1.0 min−1 cutoff was applied to the time-domain data (from Fig. 2), standard FFT analysis was carried out, and frequency domain data from 0 to 2 min−1 was plotted (Fig. S-9 A-H). Again, little to no glycerol secretion oscillations were observed from the cell spheroids, while strong oscillations were released by the tissue from 12-week-old mice. Interestingly, eWAT tissue from older mice (~20 weeks) seemed to have lost much of its oscillatory magnitude. Using a similar analysis, Fig. S-9I further demonstrates the differences of average magnitudes in the frequency domain among the tissues, cells, and standard curve. These data further confirmed that oscillations were arising from the tissue, not from the sampling and detection system.
High-resolution microfluidic data also permitted us to investigate glycerol secretion dynamics by individually analyzing bursts of secreted analyte. These burst analysis results are shown in Fig. 4A-E, where each burst of glycerol was treated akin to a peak in chromatographic data. In Fig. 4A, the peak heights of the oscillatory bursts, representing the maximum amount of glycerol in each pulse under different treatments, were calculated and plotted against the peak widths (i.e. full width at half maximum, FWHM). Significant increases in glycerol burst amounts were observed in pulses from eWAT tissues treated by LGLIS compared to HGHI treatment, which contrasts with the unchanged peak heights of pulses from 3T3-L1 cells. This phenotypic difference is further confirmed in Fig. 4B, where accumulated amounts of glycerol in each pulse increased significantly in LGLIS treatments compared to HGHI. Further, as confirmed by the histogram analyses in Fig. 4C and 4D, the observed change in glycerol pulse amount was apparently due to height changes in the bursts, not from the change of peak widths (oscillation periods). This result is in agreement with the interpretation of the time-dependent spectrogram shown in Fig. 3. In Fig. 4E, example calculations of burst amounts are given and shown at higher magnification.
Figure 4.

Glycerol burst analysis enabled by high-resolution data. A) Peak analysis software extracted burst heights (fmol) and burst widths (s). Data from 3T3-L1 cells spheroids or eWAT explants is presented under different treatments. Only explants showed significant treatment-dependent changes in burst height. B) Peak areas were used to extract burst amounts, again showing a significant treatment-triggered change only in eWAT explants. Mean burst amounts increased about 6-fold from ~50 fmol at HGHI to ~300 fmol per burst under LGLIS treatment. C) Histograms of eWAT glycerol bursts showed little change in width but D) a significant increase in burst height after stimulation. E) Data excerpts from Fig. 2B (eWAT_3) are shown at higher magnification with examples of resolved glycerol bursts and calculated burst amounts. Note: Oscillation peaks’ full-widths at half-maximum (FWHM) were used as a metric for burst widths.
As mentioned briefly above, another observation was that the fold-increases in glycerol release in response to LGLIS became lower, and the oscillations got smaller and less pronounced in aged or obese mice (Fig. 2C, 2D, 2E, and Fig. S-9G-H). The lack of a difference in glycerol release from eWAT of the 20-week wild-type mouse and DIO mouse may have resulted from the mouse becoming more overweight at 20 weeks compared to 12 weeks, with or without high-fat feeding. This assertion is supported by simply comparing total weights of eWAT extracted from the different types of mice (Fig. S-10). For C57BL/6J mice, eWAT weight is positively correlated with age, linking the issue to obesity. Interestingly, several reports39-44 have mentioned that the reduction of glycerol release in obese mice and humans could be a result of decreased expression of the aquaporin 7 (AQP7) gene (Aqp7); indeed, this gene was expressed more in our 9-week-old mice than in the 20-week-old mice (Fig. S-11). AQP7 is the main transporter of glycerol, and a knockout of Aqp7 results in lowering of plasma glycerol and the diminished response of glycerol secretion to the stimulation of β-adrenergic signaling. It is therefore possible that AQP7 plays an important role in the dynamic observations shown in this work. However, further investigations are needed to improve our understanding of the mechanisms of glycerol transport and/or intercellular communication and the observed changes related to age and obesity.
Tissue connectivity studies in eWAT.
Since we did not observe oscillations from cell spheroids, we hypothesized that our observed glycerol secretion oscillations from eWAT tissue explants were dependent upon cell-to-cell communication within the tissue, such as gap-junctional coupling, aquaporin-mediated transport, or other means of connectivity. Gap junctions are channels on cell membranes that permit intercellular communication by facilitating exchange of ions and secondary signaling molecules, as well as other small molecules. Such gap junctional tissue coupling can transfer signals between cells and induce synchronization of electrical and metabolic activities in connective tissue 45. Notably, synchronization and oscillation of insulin secretion from pancreatic islets have been shown to result from gap junctional electrical coupling of beta-cells, which couples oscillations of Ca2+ that are followed by downstream insulin oscillations46-48. Several previous reports have shown that similar gap junctions also exist in adipose tissue49, 50, although much less work has been done in this area. Adipose tissue is a complex organ including multiple cell types, connective tissues, blood vessels, and neuron terminals, thus neuron cell innervation may also provide a means of connectivity in intact adipose tissue 51-55.
To evaluate if gap junctions and neuron innervation were present in our eWAT explants, immunostaining was first applied to test for the existence of gap junction alpha-1 protein (GJA1, or connexin 43) and tyrosine hydroxylase (TH, marker of sympathetic neuron terminal); results in Fig. 5C-D show these proteins are present. For further evaluation, a Connexin 43 inhibitor (2-aminoethoxydiphenyl borate, 2-APB) and a neurotoxic compound (6-Hydroxydopamine, 6-OHDA) were applied to eWAT explants. These experiments leveraged confocal fluorescence recovery after photobleaching (FRAP) studies with CFDA-AM (5-Carboxyfluorescein diacetate, acetoxymethyl ester) as the cytoplasm-staining dye. CFDA-AM was hydrolyzed to carboxyfluorescein after entering the cells, trapping it within the cells unless it can cross gap junctions, e.g. into a recently photobleached cell, to recover the fluorescence45. Using multiple eWAT explants from two different mice, FRAP results showed that the fluorescence recovery rate (ratio between the post-bleach and pre-bleach intensities) reduced when tissues were pre-treated with 2-APB, and a further decrease was observed after treatment with 2-APB plus 6-OHDA (Fig. 5A-B). These results suggest that the gap junction inhibitor and the neurotoxic drug both blocked cell-to-cell communication throughout the eWAT tissue.
Figure 5.

Evidence for cell-to-cell connectivity in adipose tissue explants via confocal fluorescence microscopy. A) Fluorescence recovery after photobleaching (FRAP) was used to monitor exchange between individual adipocytes in the tissue. Control (buffer), 2-APB, or 2-APB plus 6-OHDA treatments were applied to eWAT explants, and results suggest that disrupting gap junctions or nerve signaling reduces the dye recovery. FRAP was done on 2-3 pieces of tissue per mouse on >9 different spots per explant. B) Fluorescence recovery rate comparison under different treatments; tissue samples from two mice. Data from 125 to 230 s in A were chosen and analyzed. *, P-value < 0.05. C) Immunostaining of adipose tissue gap junctions. Nile red stains the lipid droplets in adipocytes (red), and gap junction alpha-1 protein (Cx43) is immunostained in green. D) Immunostaining of adipose tissue neurons. LipidTox Green stains the lipid droplets in adipocytes (green), and Tyrosine hydroxylase (TH) is immunostained in red. TH is marker of sympathetic neuron terminals. Note: Error bars in A report standard deviations, and bars represent error within each trace of the same color.
Data in Fig. 6A, collected on our microdevices, further demonstrates the significant reduction or perhaps complete loss of the catecholaminergic effect in lipid metabolism when gap junctions were blocked by the inhibitor 2-APB. Glycerol release did not increase under LGLIS treatment after the tissue was administrated with 2-APB with the HGHI treatment. Similar results were shown in the experiments where tissue was pretreated by 6-OHDA. When tissues were pretreated with 1.82 μg/μL 6-OHDA in culture media for 8 h, the fold change of glycerol release stimulated by LGLIS + 2-APB was negligible at 0.99 ± 0.04 compared to HGHI treatment. Thus, blocking cell-to-cell communication in tissue by pretreating it with either 2-APB or 2-APB + 6-OHDA can terminate the catecholaminergic effect directly. Finally, to investigate the more delicate oscillatory patterns in glycerol secretion under the stimulatory condition, an eWAT explant was pre-treated in HGHI, stimulated by LGLIS, then treated with 2-APB while sampling by our microfluidic device. As shown by the spectrogram in Fig. 6B, while oscillations were clearly observed to increase upon stimulation, a loss of oscillatory magnitude was observed after adding 100 μM of 2-APB. Interestingly, the highest frequency oscillations appeared to undergo the most attenuation, while the lower frequency oscillations were less reduced.
Overall, these results suggest that gap-junctional coupling and nerve cell innervation may play significant roles in the tissue-level, coordinated oscillations observed by our novel microfluidic system. The fact that 3T3-L1 adipocytes did not go through development and were not cultured under conditions to promote gap-junctional connectivity may help explain the observed oscillation deficiency in the clustered cell lines. While further biological studies are warranted to understand the roles that these treatments and others play, as well as the complex burst frequency dependences, our device has been proven herein as a suitable tool for dynamic secretion studies of adipose tissue.
Conclusions
Our automated microfluidic system25 was redesigned and improved to allow on-chip coupled enzyme assays and higher temporal resolution of droplet-based sampling from cells or tissue. Droplets with highly consistent volume were generated without connecting to macroscopic plumbing or perfusion systems. A variety of homogeneous immunoassays and other coupled enzyme assays could be applied in this system in the future to enable unique dynamic studies of small molecules and low-abundance proteins secreted from tissues or cell spheroids. Furthermore, only a few cells or tiny sections of primary tissues are needed for investigation, and different treatment solutions are easily changed and delivered in an automated fashion. Importantly, the segmentation of secretomes into aqueous-in-oil droplets very near the tissue (or cells) was shown to conserve temporal resolution by preventing downstream diffusion and dispersion, and it should be possible to achieve even higher temporal resolution that the ~3.5 s shown here using clever modifications of the fluidics.
With this high-resolution sampling, investigations of the dynamic secretion patterns of primary adipose tissue explants were achieved quantitatively, and unique glycerol secretion patterns from eWAT tissue were observed for the first time, showing stimulation-dependent oscillatory bursts of glycerol in amounts ranging from ~0.05 – 1.0 pmol and at periods from ~30 – 300 s. These patterns were obviously distinct from temporal patterns from encapsulated cell lines, suggesting that cell-to-cell communication in adipose tissue plays a role. Other studies (using lower-resolution sampling) have reported plasma glycerol and free fatty acid concentrations to oscillate by regulation of adrenergic signaling at a period of 6 ± 1 min56, and one group suggested that lipolytic oscillations with ~5-min pulses were driven by glycolysis in adipocytes and might have impact on the delivery of FFA and glycerol to the liver3. In our investigations, we note that whole adipose tissue explants were analyzed, which can conserve phenotypic characteristics and the local microenvironments within the tissue, compared to isolated adipocytes.
A unique finding in this work was the presence of basal oscillations or bursts in the eWAT tissue even in the absence of stimulation, which appeared to be potentiated or amplified by the treatments. This oscillatory function points to an underlying mode of signal transduction and a possible entrainment mechanism to communicate with other cells and tissues15, 57. Additional observations showed that age and obesity played a role in diminishing magnitudes of glycerol fold-changes and oscillatory bursts, and we hypothesize that these effects are related to a decline in tissue connectivity. Of course, further studies are needed to detail mechanistic connections among gap junctional coupling, nerve cell innervation, and oscillatory glycerol secretion in adipose tissue. Nonetheless, our results provide evidence that cell-to-cell communication plays a role in lipolytic synchronization and that oscillations exist naturally in the adipose tissue. To our knowledge, these results are the first to show such oscillations in eWAT, and the collection of these data was uniquely enabled by our novel, droplet-based microfluidic sampling and analysis system.
Supplementary Material
Acknowledgements
Funding for this work was provided generously by the National Institutes of Health, award R01 DK093810.
Footnotes
Competing interests
The authors have no competing interests to declare.
References
- 1.Alarcon C, Boland BB, Uchizono Y, Moore PC, Peterson B, Rajan S, Rhodes OS, Noske AB, Haataja L, Arvan P, Marsh BJ, Austin J and Rhodes CJ, Diabetes, 2016, 65, 438–450. [DOI] [PMC free article] [PubMed] [Google Scholar]
- 2.El Hachmane MF, Komai AM and Olofsson CS, PLoS One, 2015, 10, e0119530. [DOI] [PMC free article] [PubMed] [Google Scholar]
- 3.Getty-Kaushik L, Richard AM and Corkey BE, Obesity research, 2005, 13, 2058–2065. [DOI] [PubMed] [Google Scholar]
- 4.Wang Y, Ali Y, Lim CY, Hong W, Pang ZP and Han W, Biochem J, 2014, 458, 491–498. [DOI] [PubMed] [Google Scholar]
- 5.Guan A, Hamilton P, Wang Y, Gorbet M, Li Z and Phillips KS, Nature Biomedical Engineering, 2017, 1, 0045. [Google Scholar]
- 6.Kuo CT, Thompson AM, Gallina ME, Ye F, Johnson ES, Sun W, Zhao M, Yu J, Wu IC, Fujimoto B, DuFort CC, Carlson MA, Hingorani SR, Paguirigan AL, Radich JP and Chiu DT, Nat Commun, 2016, 7, 11468. [DOI] [PMC free article] [PubMed] [Google Scholar]
- 7.Sackmann EK, Fulton AL and Beebe DJ, Nature, 2014, 507, 181–189. [DOI] [PubMed] [Google Scholar]
- 8.Toh YC, Zhang C, Zhang J, Khong YM, Chang S, Samper VD, van Noort D, Hutmacher DW and Yu H, Lab Chip, 2007, 7, 302–309. [DOI] [PubMed] [Google Scholar]
- 9.Li X and Easley CJ, Anal Bioanal Chem, 2018, 410, 791–800. [DOI] [PMC free article] [PubMed] [Google Scholar]
- 10.Brooks JC, Judd RL and Easley CJ, Methods Mol Biol, 2017, 1566, 185–201. [DOI] [PMC free article] [PubMed] [Google Scholar]
- 11.Duncombe TA, Tentori AM and Herr AE, Nat Rev Mol Cell Biol, 2015, 16, 554–567. [DOI] [PMC free article] [PubMed] [Google Scholar]
- 12.El-Ali J, Sorger PK and Jensen KF, Nature, 2006, 442, 403–411. [DOI] [PubMed] [Google Scholar]
- 13.Mehling M and Tay S, Current opinion in biotechnology, 2014, 25, 95–102. [DOI] [PubMed] [Google Scholar]
- 14.Zhang X, Daou A, Truong TM, Bertram R and Roper MG, Am J Physiol Endocrinol Metab, 2011, 301, E742–747. [DOI] [PMC free article] [PubMed] [Google Scholar]
- 15.Dhumpa R, Truong TM, Wang X and Roper MG, Integr Biol (Camb), 2015, 7, 1061–1067. [DOI] [PMC free article] [PubMed] [Google Scholar]
- 16.Yi L, Wang X, Dhumpa R, Schrell AM, Mukhitov N and Roper MG, Lab Chip, 2015, 15, 823–832. [DOI] [PMC free article] [PubMed] [Google Scholar]
- 17.Kellogg RA, Gomez-Sjoberg R, Leyrat AA and Tay S, Nature protocols, 2014, 9, 1713–1726. [DOI] [PubMed] [Google Scholar]
- 18.Sumit M, Takayama S and Linderman JJ, Integr Biol (Camb), 2017, 9, 6–21. [DOI] [PMC free article] [PubMed] [Google Scholar]
- 19.Brooks JC, Ford KI, Holder DH, Holtan MD and Easley CJ, Analyst, 2016, 141, 5714–5721. [DOI] [PMC free article] [PubMed] [Google Scholar]
- 20.Clark AM, Sousa KM, Jennings C, MacDougald OA and Kennedy RT, Anal Chem, 2009, 81, 2350–2356. [DOI] [PMC free article] [PubMed] [Google Scholar]
- 21.Dugan CE, Grinias JP, Parlee SD, El-Azzouny M, Evans CR and Kennedy RT, Anal Bioanal Chem, 2017, 409, 169–178. [DOI] [PMC free article] [PubMed] [Google Scholar]
- 22.Godwin LA, Brooks JC, Hoepfner LD, Wanders D, Judd RL and Easley CJ, Analyst, 2015, 140, 1019–1025. [DOI] [PMC free article] [PubMed] [Google Scholar]
- 23.Inomata N, Toda M and Ono T, Lab Chip, 2016, 16, 3597–3603. [DOI] [PubMed] [Google Scholar]
- 24.Li X, Brooks JC, Hu J, Ford KI and Easley CJ, Lab Chip, 2017, 17, 341–349. [DOI] [PMC free article] [PubMed] [Google Scholar]
- 25.Li X, Hu J and Easley CJ, Lab Chip, 2018, 18, 2926–2935. [DOI] [PMC free article] [PubMed] [Google Scholar]
- 26.Liu Y, Kongsuphol P, Chiam SY, Zhang QX, Gourikutty SBN, Saha S, Biswas SK and Ramadan Q, Lab Chip, 2019, 19, 241–253. [DOI] [PubMed] [Google Scholar]
- 27.Loskill P, Sezhian T, Tharp KM, Lee-Montiel FT, Jeeawoody S, Reese WM, Zushin PH, Stahl A and Healy KE, Lab Chip, 2017, 17, 1645–1654. [DOI] [PMC free article] [PubMed] [Google Scholar]
- 28.Moraes C, Labuz JM, Leung BM, Inoue M, Chun TH and Takayama S, Integr Biol (Camb), 2013, 5, 1149–1161. [DOI] [PMC free article] [PubMed] [Google Scholar]
- 29.Zhu J, He J, Verano M, Brimmo AT, Glia A, Qasaimeh MA, Chen P, Aleman JO and Chen W, Lab Chip, 2018, 18, 3550–3560. [DOI] [PMC free article] [PubMed] [Google Scholar]
- 30.Negou JT, Avila LA, Li X, Hagos TM and Easley CJ, Anal Chem, 2017, 89, 6153–6159. [DOI] [PMC free article] [PubMed] [Google Scholar]
- 31.Negou JT, Hu J, Li X and Easley CJ, Anal Methods, 2018, 10, 3436–3443. [DOI] [PMC free article] [PubMed] [Google Scholar]
- 32.Vazquez-Vela ME, Torres N and Tovar AR, Archives of medical research, 2008, 39, 715–728. [DOI] [PubMed] [Google Scholar]
- 33.Lafontan M, Int J Obes (Lond), 2008, 32 Suppl 7, S39–51. [DOI] [PubMed] [Google Scholar]
- 34.Deal KS and Easley CJ, Anal Chem, 2012, 84, 1510–1516. [DOI] [PubMed] [Google Scholar]
- 35.Herd JA, Goodman HM and Grose SA, Am J Physiol, 1968, 214, 263–268. [DOI] [PubMed] [Google Scholar]
- 36.Morrison S and McGee SL, Adipocyte, 2015, 4, 295–302. [DOI] [PMC free article] [PubMed] [Google Scholar]
- 37.Dugan CE, Cawthorn WP, MacDougald OA and Kennedy RT, Anal Bioanal Chem, 2014, 406, 4851–4859. [DOI] [PMC free article] [PubMed] [Google Scholar]
- 38.Neuzi P, Giselbrecht S, Lange K, Huang TJ and Manz A, Nat Rev Drug Discov, 2012, 11, 620–632. [DOI] [PMC free article] [PubMed] [Google Scholar]
- 39.Fruhbeck G, Nature, 2005, 438, 436–437. [DOI] [PubMed] [Google Scholar]
- 40.Geng X and Yang B, Advances in experimental medicine and biology, 2017, 969, 51–62. [DOI] [PubMed] [Google Scholar]
- 41.Hibuse T, Maeda N, Funahashi T, Yamamoto K, Nagasawa A, Mizunoya W, Kishida K, Inoue K, Kuriyama H, Nakamura T, Fushiki T, Kihara S and Shimomura I, Proc Natl Acad Sci U S A, 2005, 102, 10993–10998. [DOI] [PMC free article] [PubMed] [Google Scholar]
- 42.Maeda N, Funahashi T, Hibuse T, Nagasawa A, Kishida K, Kuriyama H, Nakamura T, Kihara S, Shimomura I and Matsuzawa Y, Proc Natl Acad Sci U S A, 2004, 101, 17801–17806. [DOI] [PMC free article] [PubMed] [Google Scholar]
- 43.Marrades MP, Milagro FI, Martinez JA and Moreno-Aliaga MJ, Biochem Biophys Res Commun, 2006, 339, 785–789. [DOI] [PubMed] [Google Scholar]
- 44.Matsumura K, Chang BH, Fujimiya M, Chen W, Kulkarni RN, Eguchi Y, Kimura H, Kojima H and Chan L, Mol Cell Biol, 2007, 27, 6026–6037. [DOI] [PMC free article] [PubMed] [Google Scholar]
- 45.Bathany C, Beahm D, Felske JD, Sachs F and Hua SZ, Anal Chem, 2011, 83, 933–939. [DOI] [PMC free article] [PubMed] [Google Scholar]
- 46.Benninger RK, Hutchens T, Head WS, McCaughey MJ, Zhang M, Le Marchand SJ, Satin LS and Piston DW, Biophysical journal, 2014, 107, 2723–2733. [DOI] [PMC free article] [PubMed] [Google Scholar]
- 47.Benninger RK, Zhang M, Head WS, Satin LS and Piston DW, Biophysical journal, 2008, 95, 5048–5061. [DOI] [PMC free article] [PubMed] [Google Scholar]
- 48.Head WS, Orseth ML, Nunemaker CS, Satin LS, Piston DW and Benninger RK, Diabetes, 2012, 61, 1700–1707. [DOI] [PMC free article] [PubMed] [Google Scholar]
- 49.Burke S, Nagajyothi F, Thi MM, Hanani M, Scherer PE, Tanowitz HB and Spray DC, Microbes and infection, 2014, 16, 893–901. [DOI] [PMC free article] [PubMed] [Google Scholar]
- 50.Sheridan JD, J Cell Biol, 1971, 50, 795–803. [DOI] [PMC free article] [PubMed] [Google Scholar]
- 51.Bartness TJ, J Clin Invest, 2002, 110, 1235–1237. [DOI] [PMC free article] [PubMed] [Google Scholar]
- 52.Bartness TJ and Bamshad M, Am J Physiol, 1998, 275, R1399–1411. [DOI] [PubMed] [Google Scholar]
- 53.Jiang H, Ding X, Cao Y, Wang H and Zeng W, Cell Metab, 2017, 26, 686–692.e683. [DOI] [PubMed] [Google Scholar]
- 54.Youngstrom TG and Bartness TJ, Am J Physiol, 1995, 268, R744–751. [DOI] [PubMed] [Google Scholar]
- 55.Zeng W, Pirzgalska RM, Pereira MM, Kubasova N, Barateiro A, Seixas E, Lu YH, Kozlova A, Voss H, Martins GG, Friedman JM and Domingos AI, Cell, 2015, 163, 84–94. [DOI] [PMC free article] [PubMed] [Google Scholar]
- 56.Getty L, Panteleon AE, Mittelman SD, Dea MK and Bergman RN, J Clin Invest, 2000, 106, 421–430. [DOI] [PMC free article] [PubMed] [Google Scholar]
- 57.Cheong R and Levchenko A, Current opinion in genetics & development, 2010, 20, 665–669. [DOI] [PMC free article] [PubMed] [Google Scholar]
Associated Data
This section collects any data citations, data availability statements, or supplementary materials included in this article.