

Abstract
Objective:
Left ventricular assist devices (LVADs) fail in up to 10% of patients due to the development of pump thrombosis. Remote monitoring of patients with LVADs can enable early detection and, subsequently, treatment and prevention of pump thrombosis. We assessed whether acoustical signals measured on the chest of patients with LVADs, combined with machine learning algorithms, can be used for detecting pump thrombosis.
Methods:
13 centrifugal pump (HVAD) recipients were enrolled in the study. When hospitalized for suspected pump thrombosis, clinical data and acoustical recordings were obtained at admission, prior to and after administration of thrombolytic therapy, and every 24 hours until laboratory and pump parameters normalized. First, we selected the most important features among our feature set using LDH-based correlation analysis. Then using these features, we trained a logistic regression model and determined our decision threshold to differentiate between thrombosis and non-thrombosis episodes.
Results:
Accuracy, sensitivity and precision were calculated to be 88.9%, 90.9% and 83.3%, respectively. When tested on the post-thrombolysis data, our algorithm suggested possible pump abnormalities that were not identified by the reference pump power or biomarker abnormalities.
Significance:
We showed that the acoustical signatures of LVADs can be an index of mechanical deterioration and, when combined with machine learning algorithms, provide clinical decision support regarding the presence of pump thrombosis.
Keywords: Left Ventricular Assist Device, Pump Thrombosis, Heart Failure, Machine Learning
I. Introduction
Pump thrombosis occurs in up to 10–13% of left ventricular assist device (LVAD) recipients within the first year post implant [1, 2]. Thromboembolic events may lead to pump failure requiring replacement at substantial rates (~5–7%) which has been previously reported in large trials [3–5]. LVADs stimulate the coagulation cascade resulting in thrombus formation and, when exposed to the shearing force of blood flow, patients are predisposed to thromboembolic complications [6]. Pump thrombosis may result in hemodynamic derangement, stroke, and death [4, 6–8]. Presence of hemolysis [elevated plasma lactate dehydrogenase (LDH) or plasma free hemoglobin (pfHb) levels] and degradation of device performance (e.g., increased power) can indicate pump thrombosis, which is further investigated using echocardiogram ramp studies [9, 10].
Resultant end-organ dysfunction requires the exchange of the pump through an additional surgical procedure, which is expensive, and can contribute to higher allosensitization that is correlated with worse heart transplant graft survival outcome if associated with blood product use [11]. Moreover, device exchange does not preclude recurrence of thrombosis if the origin is biological rather than mechanical [7]. Therefore, device thrombosis should be mitigated with earlier diagnosis, before triggering any heart failure (HF) exacerbation and additional surgeries. In particular, outpatient monitoring is needed as up to 15% of patients are readmitted due to device thrombosis and subsequent complications increase healthcare costs and decrease patients’ quality of life [12, 13]. Remote monitoring of pump parameters and hemodynamics should be achieved to allow real-time communication between caregivers and patients [14]. However, without having the required blood-derived biomarkers, it is not feasible to evaluate the normal vs. pathologic processes, or biological responses to therapeutic interventions. Nevertheless, such monitoring can be achieved by deriving “digital biomarkers” [15], which are measured through home-based sensors, wearable devices and implants, to support continuous measurement outside the physical confines of the clinic. Unfortunately, there is no technology currently available commercially nor in the research domain that has demonstrated the ability to characterize and monitor hemodynamics and pump functionality of VAD recipients at home.
In clinical settings, the operating sounds of these artificial blood pumps has been studied for assisting in thrombosis detection [16, 17]. Several studies, both in vitro [17–22] and in vivo [16, 17, 19, 21, 23–27], have evaluated acoustic analysis as a non-invasive method for thrombosis detection in axial and centrifugal pumps. These studies mostly leveraged harmonic frequency analysis and focused on detecting changes in the acoustic features following pump thrombosis. For example, Kaufmann et al. [16] asserted that the most intense harmonic is the fourth harmonic in the centrifugal pump recordings. Based on this assertion, they calculated the intensities of the first four harmonics and normalized the intensities of the first three to the fourth. They suggested that an increase in first and second harmonic intensities and the existence of the third harmonic indicate pump thrombosis. In addition, Yost et al. [19] and Castagna et al. [26] performed similar harmonic analysis on axial pump recipients. Yost et al. suggested that the normalized harmonic intensities decrease as the pump starts to develop thrombosis. On the other hand, Castagna et al. proposed that an increase in the normalized power of the first two harmonics and a decrease in the third harmonic indicate development of pump thrombosis.
To the best of our knowledge, no validated method has been reported so far. Moreover, the reliance on a single feature of pump acoustics - harmonic content - as an indicator of pump thrombosis may not be generalizable to all datasets and all pump types. In this work, we had two objectives: (1) determining salient acoustic and pump features indicative of pump thrombosis; and (2) evaluating the added value of acoustic features in thrombosis detection. Ultimately, this approach may enable detection and diagnosis of pump thrombosis with improved accuracy in clinical and/or home settings.
II. Methods
A. Study Protocol and Subject Demographics
This study was conducted under a protocol approved by the University of California San Francisco (UCSF) and Georgia Institute of Technology Institutional Review Boards and all patients provided written informed consent. Thirteen adult centrifugal pump recipients were enrolled in the study. At the time of enrollment - the first post-implant clinic visit when the patient was deemed clinically optimized - a baseline sound recording was obtained and baseline pump parameters and laboratory data were collected. All the LVAD patients implanted at UCSF are followed using a remote management system (Abbott Alere Home Monitoring, Livermore, CA or Acticare Health, Livermore, CA) that records daily pump parameters (speed, power, flow, pulsatility index, peak, trough, alarms), vital signs (blood pressure, heart rate, weight) and point of care CoaguCheck INR (Roche Diagnostics, Indianapolis, IN). In case of abnormalities in the pump parameters or HF symptoms, patients are contacted and hemolysis biomarkers (LDH, pfHb) are promptly obtained to establish the diagnosis of suspected pump thrombosis. During the study, new sound recordings were obtained in cases where there was a change in pump speed or clinical condition. All subjects were recipients of HeartWare HVAD (Medtronic Framingham, MA) device for either bridge-to-transplantation or destination therapy indications.
Patients were followed longitudinally for the outcome of suspected pump thrombosis, defined as abnormal pump parameters (power elevations above manufacturers baseline or an absolute power ≥ 10 Watts), hemolysis (LDH > 500 IU/L, pfHb > 20 mg/dL), development of unexplained HF or clinical hemolysis (hemoglobinuria), or poor left ventricular unloading during an echocardiographic ramp study. Due to the enhanced surveillance of the patients treated at UCSF, suspected pump thrombosis was determined based on abnormal pump parameters and hemolysis. In patients hospitalized for suspected pump thrombosis, clinical data and sound recordings were obtained at admission, prior to and after administration of thrombolytic or anticoagulation therapy, and every 24 hours until laboratory and pump parameters normalized. Thrombus resolution was defined as normalization of pump power and LDH with no clinical evidence of hemolysis for at least 24 hours.
B. Study Design and Data Acquisition
All sounds during the study period were collected and stored using the Eko Electronic Stethoscope System (Eko Devices, Inc. Berkeley, CA). With the patient in the supine position in a quiet room, the diaphragm of the stethoscope was placed on the patients exposed chest over the mitral valve for 15 seconds (Figure 1). The stethoscope settings were as follows: 40x gain, 4kHz sampling rate, 20Hz - 2kHz bandwidth.
Fig. 1.
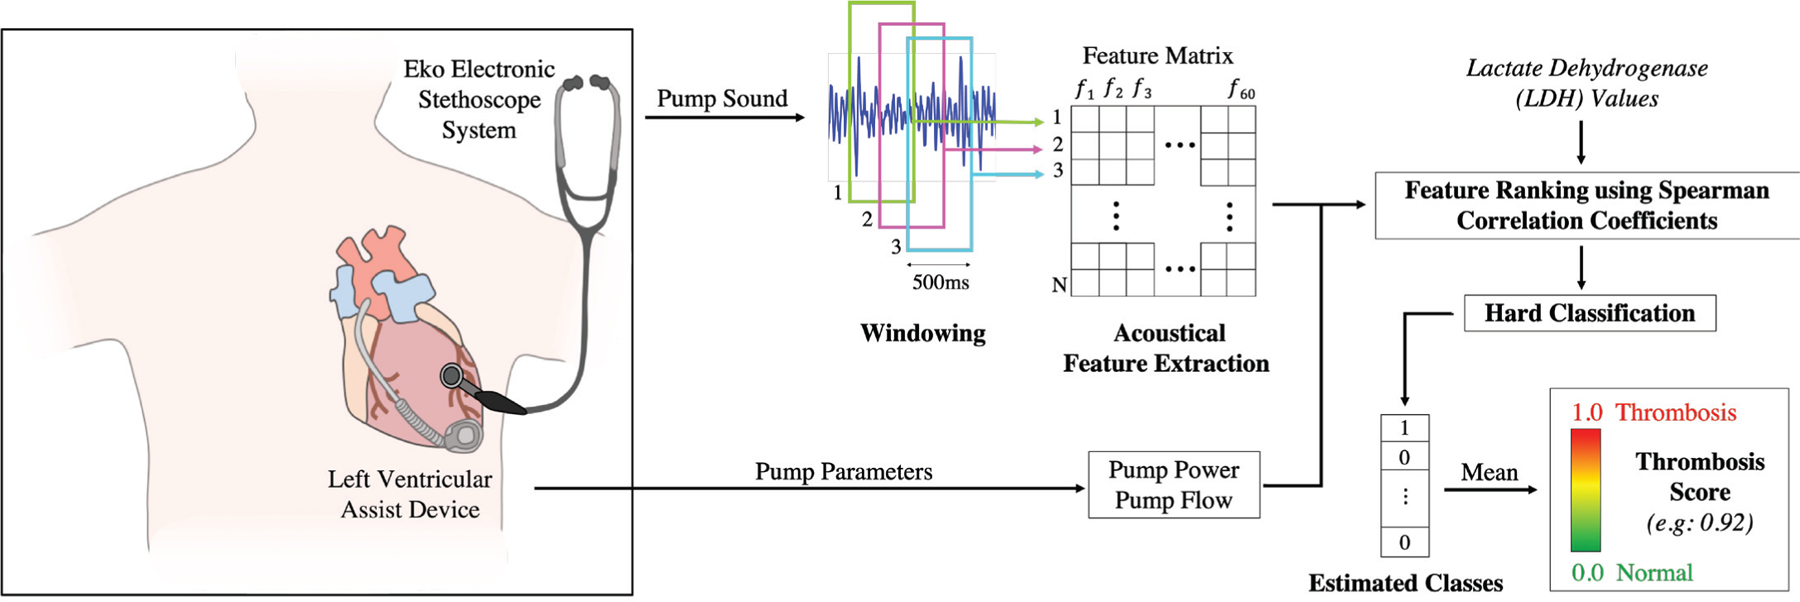
System Overview. The digital stethoscope was placed on the patients exposed chest over the mitral valve and recordings were obtained in cases of changing pump speed or clinical condition. The acquired recordings were windowed and 60 acoustic features were extracted from each frame. Pump parameters (pump power and flow) were also added to the analysis. First, the top 15 most significant features were determined using LDH-based correlation analysis. We hypothesized that the features which have higher correlation with LDH values would perform better in thrombosis detection. After calculating the correlation coefficients for each LDH-feature pair, the selected features were fed to a logistic regression classifier which was validated using LOSO-CV. Each window was assigned an estimated class and the overall thrombosis score for any given recording was defined as the mean of these estimated values.
Each recording was assigned to one of three groups for analysis: ‘normal’ for the baseline recording obtained at enrollment, ‘thrombosis’ for recordings obtained when a patient met the above criteria for suspected thrombosis, and ‘post-thrombosis’ for recordings obtained after initiation of medical treatment until normalization of pump parameters. For the post-thrombosis analysis, we used the recordings which were taken when the pump parameters and biomarkers returned to normal. The procedure by which recordings were processed and analyzed was as follows: (1) windowing and feature extraction; (2) feature selection using correlation analysis, (3) threshold selection and thrombosis score calculation.
C. Pre-processing and Feature Extraction
In this study, we had 41 recordings from 13 subjects (16 normal (baseline), 11 thrombosis and 14 post-thrombolysis). The average number of days post-implantation the recordings were obtained was 372, ranging between 11 and 1374. Information about subject demographics, pump parameters and blood biomarkers can be found in Tables I and II. Detailed information about the recording types is presented in Table III. In this paper, we focused on generalization across recordings rather than generalization across subjects as it is more important to demonstrate whether the method is consistent regardless of when the recording is performed for a particular patient. Thus, the signals were segmented into 500 ms frames with 90% overlap to increase the number of instances. From each frame, we extracted 60 acoustic features. In the recent studies, the best indicators for detecting various pump states were shown to be the spectral content of the signals, as these pump states may have different frequency characteristics [16, 19, 29]. Contrarily, we hypothesized that having a more diverse feature set would enhance the classifier performance, thus we explored various different features. Our feature set included the common audio-processing features [28, 30] and features used in previous LVAD studies [16, 19, 26]. We categorized our features as ‘temporal’, ‘spectral’, ‘MFCC’, ‘bandpower’, ‘wavelet’, ‘non-linearity’ or ‘harmonic’ features. Detailed information about these features can be found in Table IV. Extracted features were stored in a matrix, where each row represents a single frame and the columns represent the 60 features extracted. In addition to our 60 acoustical features, we also tested the reference pump parameters (pump power and pump flow) as our features, which resulted in 62 features in total (Figure 1).
Table I.
Subject demographics, pump parameters and blood biomarkers
| SUBJECT DEMOGRAPHICS | |
|---|---|
| Age, y | 57.4 ± 11.3 |
| Male, % | 84.6 |
| Weight, kg | 86.7 ± 20.1 |
| Height, cm | 179.1 ± 10.5 |
| Number of Recordings per Subject | 3.2 ± 4.2 |
| BASELINE BLOOD AND PUMP MARKERS | |
| Speed, rpm | 2738.8 ± 169.1 |
| Flow, L/min | 4.4 ± 1.0 |
| Power, watts | 4.6 ± 0.9 |
| Pulsatility, L | 3.5 ± 1.1 |
| Systolic Blood Pressure, mmHg | 98.4 ± 9.7 |
| Diastolic Blood Pressure, mmHg | 69.9 ± 7.6 |
| Mean Arterial Pressure, mmHg | 79.3 ± 7.4 |
| Heart rate, bpm | 79.2 ± 13.3 |
| Hemoglobin, g/dL | 12.1 ± 2.4 |
| Hematocrit, % | 36.0 ± 6.7 |
| Partial Thromboplastin Time, sec | 38.6 ± 15.0 |
| INR | 2.3 ± 0.7 |
Table II.
Pump parameters and blood biomarkers for baseline and thrombosis recordings
| Baseline (16 Recordings) | Thrombosis (11 Recordings) | |
|---|---|---|
| Lactate Dehydrogenase (LDH), IU/L | 291.4 ± 80.4 | 866.7 ± 382.9 |
| Plasma Free Hemoglobin (pfHb), mg/dL | 80%, <8 20%, 12.0 ± 5.6 | 50%, <8 50%, 133.4 ± 64.8 |
| INR | 2.2 ± 0.6 | 2.3 ± 0.8 |
| Abnormal power by device manufacturer standards, % | N/A | 81.8 |
| Treatment with both tissue plasminogen activator and IV heparin, % | N/A | 27.0 |
| Treatment with IV heparin exclusively, % | N/A | 54.5 |
Table III.
Number of recordings for each subject
| Sub. 1 | 1 baseline |
|---|---|
| Sub. 2 | 1 baseline, 3 thrombosis, 2 post-thrombolysis |
| Sub. 3 | 1 baseline |
| Sub. 4 | 3 baseline |
| Sub. 5 | 4 baseline, 3 thrombosis, 8 post-thrombolysis |
| Sub. 6 | 4 thrombosis, 3 post-thrombolysis |
| Sub. 7 | 1 baseline |
| Sub. 8 | 1 baseline |
| Sub. 9 | 1 thrombosis, 1 post-thrombolysis |
| Sub. 10 | 1 baseline |
| Sub. 11 | 1 baseline |
| Sub. 12 | 1 baseline |
| Sub. 13 | 1 baseline |
| TOTAL | 41 recordings (16 baseline, 11 thrombosis, 14 post-thrombolysis) |
Table IV.
Feature descriptions of different feature groups
| Feature Group | Features |
|---|---|
| Temporal | Zero Crossing Rate (ZCR), Energy, Energy Entropy |
| Spectral | Spectral Centroid, Spectral Spread, Spectral Flux, Spectral Entropy and Spectral Roll-off |
| MFCC | 13 Mel-frequency Cepstrum Coefficients |
| Bandpower | Signal power in 29 distinct frequency bands, between 30 logarithmically spaced frequencies in the range of 20Hz - 2kHz. |
| Wavelet | 3-level Daubechies8 wavelet transform was computed and the bandpower of the 3rd level approximation and detail coefficients and 2nd level detail coefficients were calculated. [28] |
| Non-linearity | Fundamental frequency, total harmonic distortion (odd harmonics), total harmonic distortion (even harmonics) |
| Harmonic | First, second, third and fourth harmonic amplitudes |
D. Feature Selection using Spearman Correlation Analysis
In the previous section, we presented the features we extracted; however as in many other cases, these features are selected ad hoc with a black box approach. Therefore, we eliminated the redundant features while keeping the informative ones; because although having more features can give extra power to ML algorithms, focusing on the intrinsic dimension is usually more desirable for preventing overfitting and ensuring robustness [31–33]. In addition, a mapping between blood-derived biomarkers and acoustical features should be quantified for evaluating the pathological processes or tracking therapeutic interventions accurately outside of the clinic, as the ideal scenario is recording and analyzing the pump sounds of the subjects outside the clinic in the absence of blood tests or any additional diagnostic tool. Based on this motivation, we hypothesized that finding the features which are highly correlated with the blood biomarkers may help us to exclude the redundant features and include the most related ones to construct a global feature set, which can be used for all subjects in thrombosis detection without any need for blood work [34].
As previously discussed, changes in hemolysis biomarker values (LDH > 500 IU/L, pfHb > 20 mg/dL) indicate pump thrombosis, therefore we hypothesized that if we could determine the acoustical features which have similar trends with the hemolysis biomarkers, our classifier might have a higher performance in thrombosis detection. For this study, we preferred LDH values over pfHb values as our reference, since it would not be possible to use some of the pfHb values (such as pfHb < 8 as in Table II). Also, recent studies proposed LDH as the primary [4, 35–37] and the most specific indicator [38, 39] of thrombosis in LVADs.
We used Spearman correlation analysis [40] to investigate the relationship between the LDH values and our acoustical features. We chose Spearman correlation instead of Pearson correlation as it does not make any assumptions regarding the frequency distribution of the variables or does not require a linear relationship between them. We wanted to treat our features as independent agents, because although some features (such as harmonics) are based on the same fundamental frequency, their behavior may be different during thrombosis development and there is no consensus across different studies [16, 19, 26]. We calculated the Spearman correlation coefficient ρ for each LDH - feature pair (e.g.: LDH and ZCR, LDH and Energy, etc.) which resulted in 62 correlation coefficients varying between −1 and 1. We then took the absolute value of these correlation values and ranked them in descending order. We determined 0.3 as our cut-off correlation coefficient as any value below 0.3 is considered negligible in the literature, especially in medical research [41–43]. Thus, we decided to use the features which have absolute correlation coefficient above 0.3 (when rounded to two significant digits). Based on this investigation, we included 15 features in our final feature set. Note that the target labels of the normal and thrombosis groups were not included in this investigation, so the analysis was not biased.
After ranking the features based on their correlation with LDH values, we plotted the kernel density estimate (KDE) plots for the best and worst performing features to visualize the differences in their probability density functions [44]. We expected to see distinguishable density functions between normal and thrombosis classes if a feature has high correlation with LDH biomarker. After determining our top 15 features, we continued with threshold selection and thrombosis score calculation.
E. Threshold Selection and Thrombosis Score Calculation
We determined our end goal as deriving a thrombosis score to place the recordings on a scale ranging from 0 (normal) to 1 (thrombosis). To calculate the thrombosis score, we trained our classifier twice: using top 15 features and all 62 features, to test the effectiveness of our correlation-based feature ranking. The classifier was validated using leave-one subject-out cross-validation (LOSO-CV). In each cross-validation fold, all recordings from one subject were left out and the logistic regression classifier was trained using the recordings from the remaining subjects. The model was then tested on the recordings from the subject being left out. This procedure was completed for all subjects. Note that the post-thrombosis data was not used for training, as the ground truth labels for this data were not known certainly - in many cases, thrombosis can be recurrent even following treatment.
Logistic regression was our preferred method due to several reasons. First, it is easy to implement and interpret - for example it does not require heavy scaling or tuning. This was our primary motivation, as an application like thrombosis detection is a collaborative work between medical doctors, researchers and patients; therefore, comprehensibility is an important consideration. Secondly, it is widely used in biostatistical applications where binary responses occur quite frequently, such as patients having heart disease or not, etc. [44]. Therefore for a case like thrombosis detection, it is well suited.
In more detail, let R denote our training data. Each instance within our training set corresponds to a 500ms-long frame in the form (xi, yi), where xi = (xi,1, xi,2, …, xi,62) are our 62 features, and yi is our thrombosis label (0 or 1). The training dataset R is used to build our logistic regression classifier which predicts the class of an incoming frame using its features. i.e., . In each fold, R includes data from all subjects, except the subject whose recordings are being tested. At prediction time, 302 unlabeled frames from each recording are provided to , and predicts their labels as 0 or 1 (hard classification). This prediction phase was completed for all recordings of the subject which had been left out in the training phase. In the following folds, the same pipeline was followed for all subjects. We define the thrombosis score of each recording as the mean of the predicted classes of all 302 frames within that recording.
Using the thrombosis scores we obtained from LOSOCV and the actual class labels, we plotted the receiver operating characteristic (ROC) curve to investigate how our two models (with 15 features and with all features) behave for different threshold values. After showing the superior performance of our condensed feature set, we determined the best threshold value for our application using the ROC curve we plotted. Since ROC represents the probability of detection (true positive rate) vs. probability of false alarm (false positive rate) for different threshold values, we selected a threshold which maximizes the probability of thrombosis detection while minimizing the probability of false alarm. We therefore selected the optimum threshold for our classification problem, which helped us to discard the sub-optimal models. The generalizability of the classifier was then assessed by calculating the accuracy, sensitivity, and precision values based on the threshold we selected. In the final part of the scoring procedure, the constructed model using the baseline and thrombosis recordings was fit into the post-thrombolysis data to investigate the pump conditions after heparin and/or tissue plasminogen activator (tPA) treatments.
F. Performance Comparison with Existing State-of-the-Art Methods
To benchmark the performance of our approach - which integrates multiple acoustic features using machine learning approaches rather than focusing on one or two individual features - we employed the reference parameters (pump features obtained from the controller) and state-of-the-art algorithms from the existing literature and compared the results of these approaches to our method. First, the classification was performed using the reference parameters: only the pump power and only the pump flow values as our features. As these parameters are directly associated with abnormal pump functionality, the performance metrics of these reference variables and our proposed method were compared.
Second, Kaufmann et al. [16] asserted that the most intense harmonic is the fourth harmonic in centrifugal pumps; therefore based on their methods, we calculated the intensities of the first four harmonics for each recording. They suggested that an increase in the first and second normalized harmonic intensity and the existence of the third harmonic suggest pump thrombosis. We investigated the effectiveness of their features both with and without a machine learning approach - first we compared the values of the harmonic intensities for normal and thrombosis recordings, then we reported the classifier performance which was trained using only these normalized intensities as features.
III. Results and Discussion
A. Feature Selection using Spearman Correlation Analysis
As explained in Section II-D, we calculated the Spearman correlation coefficient for each LDH-feature pair and used these correlation values as our feature ranking metric. Our hypothesis was that the features which have higher correlation with LDH values would perform better in thrombosis detection. Also, we wanted to eliminate the redundant features for the sake of robustness and simplicity. The 15 features having the highest absolute correlation coefficient are reported in Figure 2(a). Each color represents a different feature group (e.g.: green: temporal, orange: spectral, etc.) As seen in the bar graph, there is a great diversity in the colors, thus each feature group has a relationship with the LDH values. Also highly correlated features do not come from a single group, which makes the investigation of a diverse feature set rather that relying solely on one feature group (like harmonics) even more desirable.
Fig. 2.
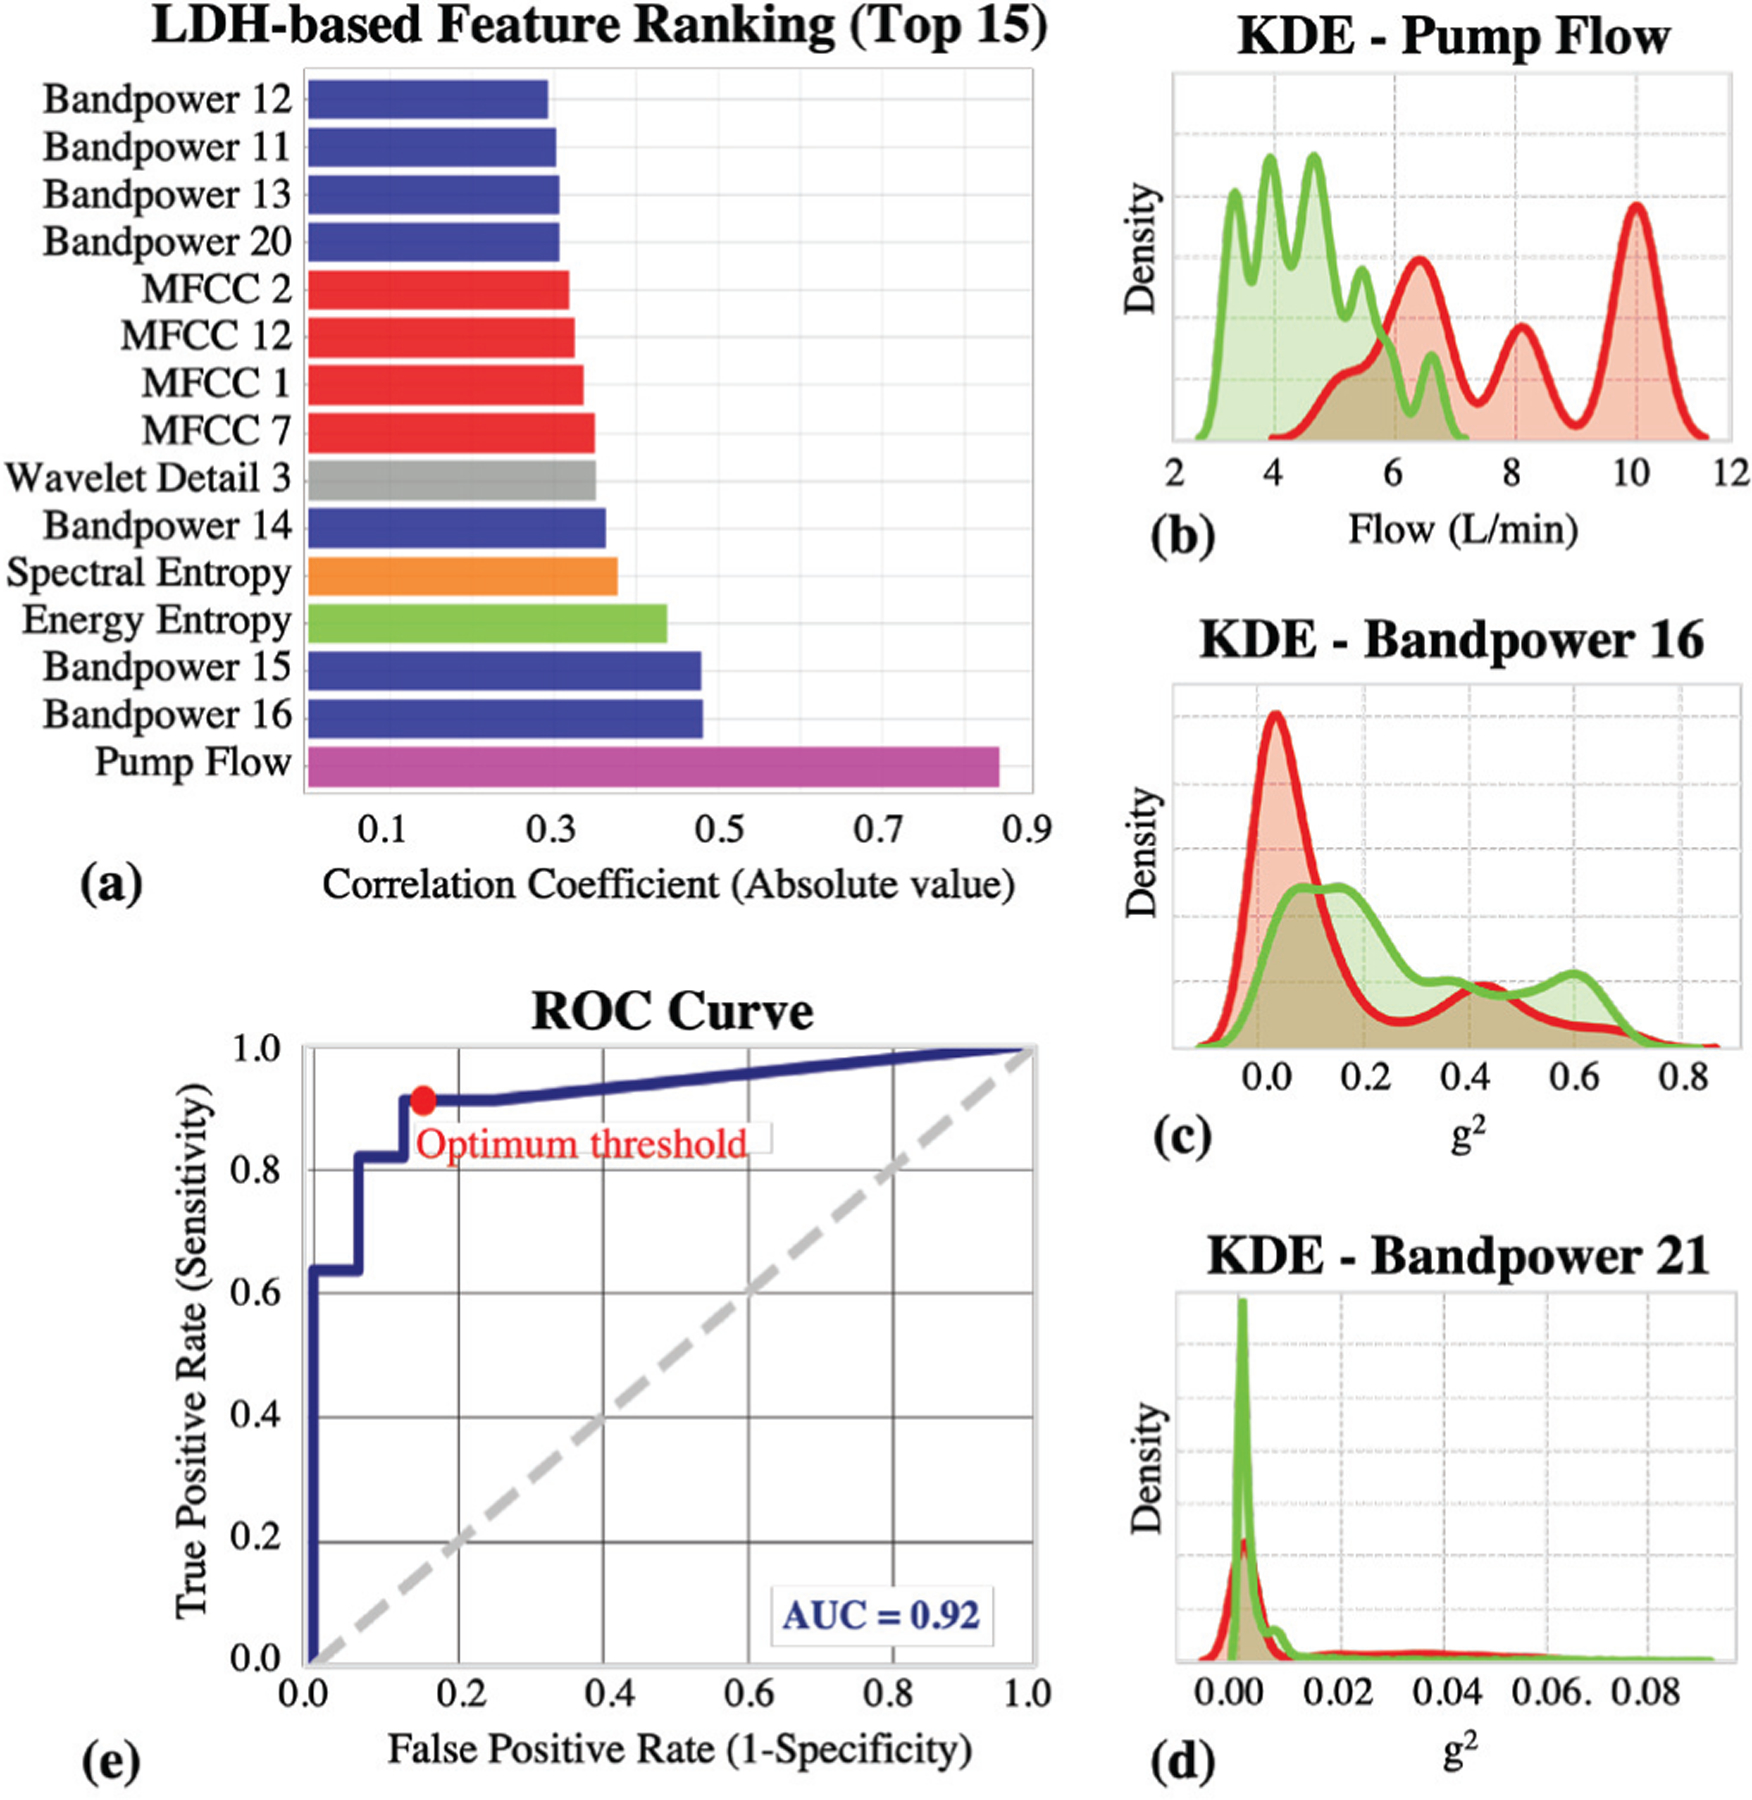
Results. (a) The 15 features having the highest absolute correlation with LDH are presented. There is a great diversity in the feature types, thus each feature group has a relationship with the LDH values. (b) KDE plot for the most correlated feature, pump flow. (c) KDE plot for the most correlated acoustic feature, bandpower 16 (190 – 230 Hz band). (d) KDE plot for the least correlated feature, bandpower 21 (440 – 520 Hz band). (e) ROC curve when the classifier was trained using the top 15 features. The are under the curve (AUC) was calculated to be 0.92. The decision threshold was determined to be 0.15 as it is the optimum value for maximizing the TPR (~ 0.91) while minimizing the FPR (~ 0.13).
To test whether the highly correlated features are indeed better in distinguishing between normal and thrombosis groups, we plotted the KDE plots and observed the differences in distributions (Figure 2(b–d)). We plotted the distributions of the top feature (pump flow, ρ=0.84), the top acoustical feature (bandpower 16, ~ 195–230 Hz, ρ=0.48) and the least correlated feature (bandpower 21, ~ 440–520 Hz, ρ=0.012). In the graphs, we colored the thrombosis recordings with red and normal recordings with green. If a specific feature has the ability to distinguish between two groups, we expected to see less overlapping distributions. As expected, it is visually clear that the features having higher correlations with LDH have less overlapping distributions compared to the ones having lower correlation. Thus, we justified that if a feature behaves similar to the actual blood biomarker, it will be more significant in thrombosis detection; therefore a mapping between our “acoustical biomarkers” and actual “blood biomarkers” is indeed achievable.
B. Threshold Selection and Thrombosis Score Calculation
As explained in Section II-E, we ran our algorithm twice: 1) Using the top 15 features, 2) Using all 62 features. We plotted the ROC curves for both experiments to investigate whether our correlation-based feature selection algorithm helps to increase classifier performance and eliminate the redundant features independent of the threshold we would use. When all 62 features were used, the area under the ROC curve was calculated to be 0.764, whereas for the top 15 features, this value was 0.921. This justified that the Spearman correlation coefficients between the features and LDH values can be used to rank and select the most prominent features. Also, another important point is that having more features is not always beneficial for the model and redundant features should be eliminated. A similar approach can be applied to many other biosignals to focus on the most relevant features while eliminating the unnecessary and deviating ones for a more robust analysis. Based on the ROC curve we plotted using our 15 features in Figure 2(e), we determined our threshold as 0.15 as it was the best value which maximizes the TPR (probability of detection) while minimizing the FPR (probability of false alarm). Using this threshold, we calculated our accuracy, sensitivity and precision to be 88.9%, 90.9% and 83.3%, respectively.
Additionally, the constructed model using the baseline and thrombosis recordings was fit into the post-thrombolysis data to investigate the pump conditions after heparin and/or tPA treatments. The model was tested on 14 post-thrombolysis recordings taken from 4 HVAD subjects; however, although the pump parameters and hemolysis biomarkers returned to normal, the scores were varying from 0 to 1, rather than being closer to 0, with 4 of the 14 recordings being above the thrombosis threshold and 10 being below the threshold (Figure 3).
Fig. 3.
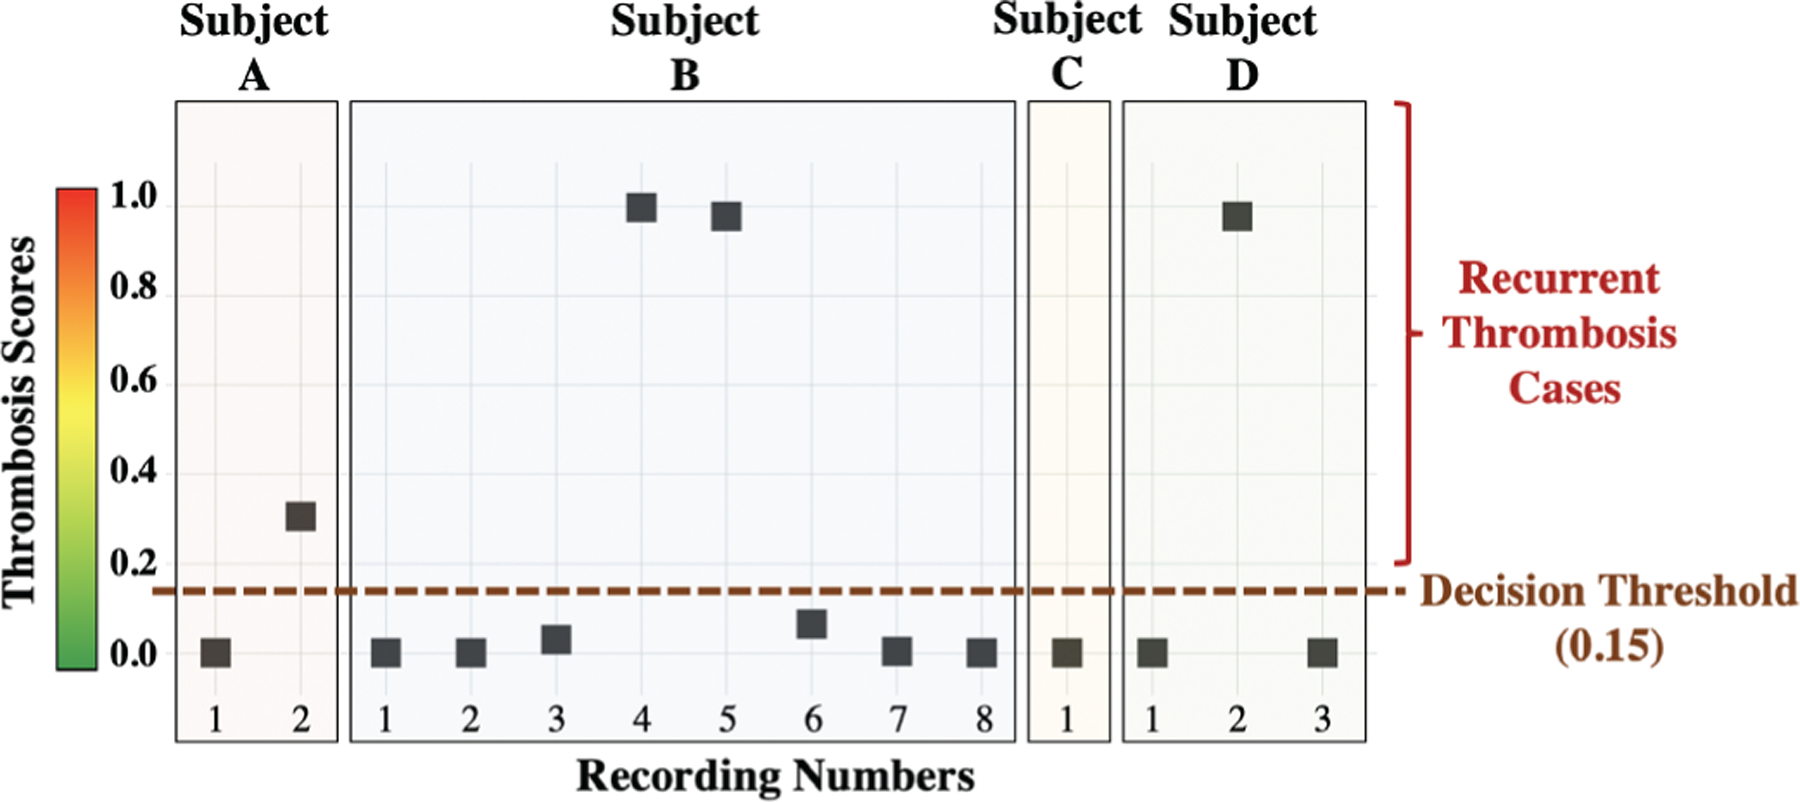
The constructed model using the baseline and thrombosis recordings was fit into the 14 post-thrombolysis recordings taken from 4 subjects to investigate the pump conditions after treatment. The results revealed that, while pump power and hemolysis biomarkers may indicate that the thrombosis is resolved, there may still be other problems such as altered pump mechanics, increased friction, or even residual pump thrombosis that cannot be identified by these markers. Indeed, recurrent thrombosis episodes were observed in 3 of the 4 subjects following the treatment of thrombosis, and the 4 recordings which had scores above the threshold belonged to these 3 subjects.
The results from the post-thrombolysis recordings from 4 subjects revealed that, while pump power and hemolysis biomarkers may indicate that the thrombosis is resolved, there may still be other problems such as altered pump mechanics, increased friction, or even residual pump thrombosis that cannot be identified by these markers. Indeed, for 3 of the 4 subjects, recurrent thrombosis episodes were observed following the treatment of thrombosis, and the 4 recordings which had scores above the threshold belonged to these 3 subjects (Subjects A, B, D in Figure 3). We further investigated the clinical logs of these 3 subjects, and found out that the subjects had indeed been diagnosed with recurrent thrombosis right after the recordings having higher scores. The ability to predict recurrent thrombosis by supplementing pump power and blood biomarker data with acoustical signatures measured from the pump should be evaluated extensively in future studies. Note that no direct confirmation of pump thrombosis was available in the study as no devices were exchanged.
Pump thrombosis decision is currently based on the presence of hemolysis and degradation of device performance, which is further investigated using echocardiogram ramp studies [9, 10]. In these studies, left ventricle end-diastolic diameter is monitored in response to changing LVAD speed, which may potentially diagnose pump thrombosis or other obstructions within the pump [45]. However, there is a need for a convenient remote monitoring system for LVAD recipients for early detection of thrombus formation, therefore patients should be able to monitor their LVAD status at home continuously. In particular, the patients at home could use the microphone function of their smartphones and transmit these sounds electronically to the cloud for analysis. Machine learning algorithms could then be employed to identify abnormal recordings from baseline, initiating a warning for patients and caregivers before thrombosis exacerbation and determining the need for clinical pump or blood tests. This way, early diagnosis and optimum treatment recommendations could be achieved, and this could help preventing HF aggravation and additional surgeries.
C. Performance Comparison with Existing State-of-the-Art Methods
Using only pump power values, accuracy, sensitivity and precision values were 62.9%, 27.3% and 60.0%, respectively. Using only pump flow values, the corresponding values were 81.4%, 72.7% and 80.0%. This demonstrates that mechanical power or blood flow characteristics are not sensitive nor specific enough to detect the suspected pump thrombosis episodes by themselves. On the other hand, flow showed higher performance in thrombosis detection compared to power probably due to frequently adapted hematocrit settings, which affected the flow calculation but not power consumption. Thus, we can say that although one of the most prominent clinical signs for thrombosis development is elevated pump power, the combination of acoustic features and pump flow values yields higher thrombosis detection rate and accuracy as we showed in Table V.
Table V.
Performance comparison with state-of-the-art methods
| Accuracy | Sensitivity | Precision | |
|---|---|---|---|
| Pump power | 62.9 % | 27.3 % | 60.0 % |
| Pump flow | 81.4 % | 72.7 % | 80.0 % |
| Harmonic analysis (Kaufman et al.)[16] | 74.1 % | 63.6 % | 70.0 % |
| Our method | 88.9 % | 90.9% | 83.3 % |
Furthermore, when we applied the approach outlined by Kaufmann et al. [16] on our dataset, the fourth harmonic was the most intense harmonic in only 17 of 41 recordings. Nevertheless, we normalized the first, second and third harmonic intensities to the fourth harmonic intensity as the authors explained. We found the average intensity for the normalized first harmonic to be 2.46 ± 3.52 and 3.06 ± 2.43 for the control and thrombosis groups, respectively. For the second harmonic, these values were 0.43 ± 0.57 and 2.01 ± 2.70 for the control and thrombosis groups, respectively. Indeed, these intensities increase as the pump starts to develop thrombosis as seen in previous work; however, high inter-recording variability resulted in lower than expected performance for classifying thrombosis. As the next step, we evaluated our model using the harmonic features and reported all classification results in Table V. However, it is important to note that Kaufmann et al. averaged 30 spectra in their work, whereas we are computing harmonics from single 500 ms frames, which is likely noisier. Thus, this should not be considered as a direct comparison.
D. Limitations and Future Work
Currently, there is no clinical gold standard existing for certain comparisons. Therefore, the findings in this work may serve as the preliminary evidence for developing an extensive clinical study in the future. This study was limited by a relatively small sample size, and the study was conducted at a single clinical site; accordingly, future studies will be needed to assess the reproducibility of the methods. Moreover, as the number of subjects in the training set is increased, the generalizability and prospective validation of our algorithm will be improved as will the determination of key acoustical features associated with pump thrombosis. In addition, although our proposed algorithm may eventually help to decrease the frequency of hospital visits and blood tests, recording the sound signals and processing them requires additional time and computational power, compared to bedside testing.
While our current work leverages hard classification using logistic regression due to their high interpretability in the medical domain, we plan to investigate the integration of soft-classification algorithms and calibration curve implementation into our study in future work. Similarly, the effect of recording length on feature sensitivity (e.g. sensitivity to harmonics) should be investigated in future studies. In this work, we calculated the bandpower features within fixed frequency bands. In future work, we will investigate the possibility of obtaining higher accuracy if the frequency bands were adapted based on the pump speed. Lastly, we used LDH as the reference blood-biomarker to employ correlation-based feature ranking and excluded any other condition that may have increased LDH. In our future studies, we will investigate the correlation between the acoustic features and other blood-biomarkers as well.
IV. Conclusion
We demonstrated that the acoustical signatures of LVADs, combined with machine learning algorithms, can improve the detection accuracy of suspected thrombosis outcomes. Additionally, the scoring of post-thrombolysis recordings suggested residual pump thrombosis which is not identified by pump parameters or hemolysis markers. Additionally, patients who have normal pump operations but abnormal levels of hemolysis markers could benefit from acoustic analysis to detect acoustic signs consistent with thrombosis. As there is a need for a convenient remote monitoring system for VAD recipients, patients should be able to monitor their VAD status at home. Once our algorithm is evaluated prospectively and demonstrates improvement in clinical management of pump thrombosis, the use of acoustical patterns can potentially enable detection of suspected pump thrombosis when biomarkers and pump parameters are non-diagnostic.
Acknowledgments
This material is based on work supported by the National Institutes of Health under Grant 1R01HL130619-A1 and the National Center for Advancing Translational Sciences of the National Institutes of Health under Award Number UL1TR002378.
Contributor Information
Beren Semiz, School of Electrical and Computer Engineering, Georgia Institute of Technology, Atlanta, GA, 30332 USA..
Sinan Hersek, School of Electrical and Computer Engineering, Georgia Institute of Technology, Atlanta, GA, 30332 USA..
Maziyar Baran Pouyan, School of Electrical and Computer Engineering, Georgia Institute of Technology, Atlanta, GA, 30332 USA..
Cynthia Partida, University of California San Francisco, CA, 94143 USA..
Leticia Blazquez Arroyo, University of California San Francisco, CA, 94143 USA..
Van Selby, University of California San Francisco, CA, 94143 USA..
Georg Wieselthaler, University of California San Francisco, CA, 94143 USA..
James M. Rehg, School of Electrical and Computer Engineering, Georgia Institute of Technology, Atlanta, GA, 30332 USA.
Liviu Klein, University of California San Francisco, CA, 94143 USA..
Omer T. Inan, School of Electrical and Computer Engineering, Georgia Institute of Technology, Atlanta, GA, 30332 USA.
References
- [1].Kirklin JK, Xie R, Cowger J, de By TM, Nakatani T, Schueler S, Taylor R, Lannon J, Mohacsi P, Gummert J et al. , “Second annual report from the ishlt mechanically assisted circulatory support registry,” The Journal of Heart and Lung Transplantation, vol. 37, no. 6, pp. 685–691, 2018. [DOI] [PubMed] [Google Scholar]
- [2].Milano CA, Rogers JG, Tatooles AJ, Bhat G, Slaughter MS, Birks EJ, Mokadam NA, Mahr C, Miller JS, Markham DW et al. , “Hvad: the endurance supplemental trial,” JACC: Heart Failure, vol. 6, no. 9, pp. 792–802, 2018. [DOI] [PubMed] [Google Scholar]
- [3].Najjar SS, Slaughter MS, Pagani FD, Starling RC, McGee EC, Eckman P, Tatooles AJ, Moazami N, Kormos RL, Hathaway DR et al. , “An analysis of pump thrombus events in patients in the heartware advance bridge to transplant and continued access protocol trial,” The Journal of Heart and Lung Transplantation, vol. 33, no. 1, pp. 23–34, 2014. [DOI] [PubMed] [Google Scholar]
- [4].Starling RC, Moazami N, Silvestry SC, Ewald G, Rogers JG, Milano CA, Rame JE, Acker MA, Blackstone EH, Ehrlinger J et al. , “Unexpected abrupt increase in left ventricular assist device thrombosis,” New England Journal of Medicine, vol. 370, no. 1, pp. 33–40, 2014. [DOI] [PubMed] [Google Scholar]
- [5].Rogers JG, Pagani FD, Tatooles AJ, Bhat G, Slaughter MS, Birks EJ, Boyce SW, Najjar SS, Jeevanandam V, Anderson AS et al. , “Intrapericardial left ventricular assist device for advanced heart failure,” New England Journal of Medicine, vol. 376, no. 5, pp. 451–460, 2017. [DOI] [PubMed] [Google Scholar]
- [6].Oz M, Argenziano M, Catanese KA, Gardocki MT, Goldstein DJ, Ashton RC, Gelijns AC, Rose EA, and Levin HR, “Bridge experience with long-term implantable left ventricular assist devices: are they an alternative to transplantation?” Circulation, vol. 95, no. 7, pp. 1844–1852, 1997. [DOI] [PubMed] [Google Scholar]
- [7].Uriel N, Han J, Morrison KA, Nahumi N, Yuzefpolskaya M, Garan AR, Duong J, Colombo PC, Takayama H, Thomas S et al. , “Device thrombosis in heartmate ii continuous-flow left ventricular assist devices: a multifactorial phenomenon,” The Journal of Heart and Lung Transplantation, vol. 33, no. 1, pp. 51–59, 2014. [DOI] [PubMed] [Google Scholar]
- [8].Stulak JM, Cowger J, Haft JW, Romano MA, Aaronson KD, and Pagani FD, “Device exchange after primary left ventricular assist device implantation: indications and outcomes,” The Annals of thoracic surgery, vol. 95, no. 4, pp. 1262–1268, 2013. [DOI] [PubMed] [Google Scholar]
- [9].Flores AS, Essandoh M, Yerington GC, Bhatt AM, Iyer MH, Perez W, Davila VR, Tripathi RS, Turner K, Dimitrova G et al. , “Echocardiographic assessment for ventricular assist device placement,” Journal of thoracic disease, vol. 7, no. 12, p. 2139, 2015. [DOI] [PMC free article] [PubMed] [Google Scholar]
- [10].Uriel N, Morrison KA, Garan AR, Kato TS, Yuzefpolskaya M, Latif F, Restaino SW, Mancini DM, Flannery M, Takayama H et al. , “Development of a novel echocardiography ramp test for speed optimization and diagnosis of device thrombosis in continuous-flow left ventricular assist devices: the columbia ramp study,” Journal of the American College of Cardiology, vol. 60, no. 18, pp. 1764–1775, 2012. [DOI] [PMC free article] [PubMed] [Google Scholar]
- [11].Schaffer JM, Singh SK, Reitz BA, Oyer PE, Robbins RC, and Mallidi HR, “Heart transplant graft survival is improved after a reduction in panel reactive antibody activity,” The Journal of thoracic and cardiovascular surgery, vol. 145, no. 2, pp. 555–565, 2013. [DOI] [PubMed] [Google Scholar]
- [12].Smedira NG, Hoercher KJ, Lima B, Mountis MM, Starling RC, Thuita L, Schmuhl DM, and Blackstone EH, “Unplanned hospital readmissions after heartmate ii implantation: frequency, risk factors, and impact on resource use and survival,” JACC: Heart Failure, vol. 1, no. 1, pp. 31–39, 2013. [DOI] [PubMed] [Google Scholar]
- [13].Hasin T, Marmor Y, Kremers W, Topilsky Y, Severson CJ, Schirger JA, Boilson BA, Clavell AL, Rodeheffer RJ, Frantz RP et al. , “Readmissions after implantation of axial flow left ventricular assist device,” Journal of the American College of Cardiology, vol. 61, no. 2, pp. 153–163, 2013. [DOI] [PubMed] [Google Scholar]
- [14].Kilic A, “The future of left ventricular assist devices,” Journal of Thoracic Disease, vol. 7, no. 12, 2015. [Online]. Available: http://jtd.amegroups.com/article/view/5639 [DOI] [PMC free article] [PubMed] [Google Scholar]
- [15].Coravos A, Khozin S, and Mandl KD, “Developing and adopting safe and effective digital biomarkers to improve patient outcomes,” NPJ digital medicine, vol. 2, no. 1, p. 14, 2019. [DOI] [PMC free article] [PubMed] [Google Scholar]
- [16].Kaufmann F, Hormandinger C, ¨ Stepanenko A, Kretzschmar A, Soltani S, Krabatsch T, Potapov E, and Hetzer R, “Acoustic spectral analysis for determining pump thrombosis in rotary blood pumps,” Asaio Journal, vol. 60, no. 5, pp. 502–507, 2014. [DOI] [PubMed] [Google Scholar]
- [17].Makino T, Okamoto E, Tanaka S, Yasuda T, Inoue Y, Saito I, Isoyama T, Chinzei T, Mochizuki S, Abe Y et al. , “Estimation of early-stage malfunction using implantable artificial heart sound in animal experiments,” Artificial organs, vol. 30, no. 5, pp. 360–364, 2006. [DOI] [PubMed] [Google Scholar]
- [18].Hubbert L, Sundbom P, Loebe M, Peterzén B, Granfeldt H, and Ahn H, “Acoustic analysis of a mechanical circulatory support,” Artificial organs, vol. 38, no. 7, pp. 593–598, 2014. [DOI] [PMC free article] [PubMed] [Google Scholar]
- [19].Yost GL, Royston TJ, Bhat G, and Tatooles AJ, “Acoustic characterization of axial flow left ventricular assist device operation in vitro and in vivo,” Asaio Journal, vol. 62, no. 1, pp. 46–55, 2016. [DOI] [PubMed] [Google Scholar]
- [20].Sundbom P, Roth M, Granfeldt H, Karlsson DM, Ahn H, Gustafsson F, and Hubbert L, “Sound analysis of a left ventricular assist device: A technical evaluation of ios devices,” The International journal of artificial organs, vol. 41, no. 5, pp. 254–260, 2018. [DOI] [PubMed] [Google Scholar]
- [21].Markey P, Dhital K, Gupta S, Woldendorp K, Robson D, Hayward C, and Lovell N, “The value of pump audiosignals in patients with left ventricular assist devices,” The Journal of Heart and Lung Transplantation, vol. 32, no. 4, p. S30, 2013. [Google Scholar]
- [22].Feldmann C, Deniz E, Stomps A, Knigge S, Chatterjee A, Wendl R, Hanke JS, Dogan G, Napp LC, Glasmacher B et al. , “An acoustic method for systematic ventricular assist device thrombus evaluation with a novel artificial thrombus model,” Journal of thoracic disease, vol. 10, no. Suppl 15, p. S1711, 2018. [DOI] [PMC free article] [PubMed] [Google Scholar]
- [23].Slaughter MS, Feldman CM, Sobieski MA, Silver MA, Martin MM, Kurien S, Coyle LA, and Pederson B, “Utilization of acoustic signatures to identify heartmate xve device end-of-life,” The Journal of heart and lung transplantation, vol. 26, no. 6, pp. 579–583, 2007. [DOI] [PubMed] [Google Scholar]
- [24].Hubbert L, Jorde U, Peterzén B, Granfeldt H, Kornhall B, Morrison K, and Ahn H, “379 early results from the soundmate study. acoustic analysis of a thromboembolic event in a patient treated with heartmate ii, mechanical circulatory support,” The Journal of Heart and Lung Transplantation, vol. 31, no. 4, pp. S134–S135, 2012. [Google Scholar]
- [25].Bowles C, Noor M, Schmidt A, Hedger M, Banner N, Parker K, and Simon A, “278 successful treatment of implantable rotary left ventricular assist device (lvad) thrombus is associated with normalisation of acoustic properties,” The Journal of Heart and Lung Transplantation, vol. 30, no. 4, p. S98, 2011. [Google Scholar]
- [26].Castagna F, Pan S, Garan A, Yuzefpolskaya M, Takeda K, Takayama H, Ross K, Torres M, Blum R, Singh S et al. , “Acoustic analysis of a continuous-flow left ventricular assist device before and after suspected pump thrombosis,” The Journal of Heart and Lung Transplantation, vol. 35, no. 4, p. S326, 2016. [Google Scholar]
- [27].Noor M, Hitchins N, Doyle E, Banner N, Parker K, and Bowles C, “007 analysis of the left ventricular assist device (lvad) acoustic signal: A novel clinical diagnostic method for suspected pump thrombosis,” Heart, vol. 99, no. suppl 2, p. A11, 2013. [Google Scholar]
- [28].Lin C-C, Chen S-H, Truong T-K, and Chang Y, “Audio classification and categorization based on wavelets and support vector machine,” IEEE Transactions on Speech and Audio Processing, vol. 13, no. 5, pp. 644–651, 2005. [Google Scholar]
- [29].Rana R, Schwarz KQ, and Kolodziej JR, “Non-invasive fault detection in an axial flow blood pump used as a ventricle assistive device,” in ASME 2014 Dynamic Systems and Control Conference. American Society of Mechanical Engineers Digital Collection, 2014. [Google Scholar]
- [30].Semiz B, Hersek S, Whittingslow DC, Ponder LA, Prahalad S, and Inan OT, “Using knee acoustical emissions for sensing joint health in patients with juvenile idiopathic arthritis: A pilot study,” IEEE sensors journal, vol. 18, no. 22, pp. 9128–9136, 2018. [DOI] [PMC free article] [PubMed] [Google Scholar]
- [31].Fan J and Lv J, “A selective overview of variable selection in high dimensional feature space,” Statistica Sinica, vol. 20, no. 1, p. 101, 2010. [PMC free article] [PubMed] [Google Scholar]
- [32].Chen L, “Curse of dimensionality. encyclopedia of database systems,” 2009. [Google Scholar]
- [33].Geng X, Liu T-Y, Qin T, and Li H, “Feature selection for ranking,” in Proceedings of the 30th annual international ACM SIGIR conference on Research and development in information retrieval. ACM, 2007, pp. 407–414. [Google Scholar]
- [34].Semiz B, Hersek S, Partida C, Arroyo LB, Selby V, Wieselthaler G, Inan O, and Klein L, “Blood-biomarker-based acoustical feature selection improves overall classification accuracy for pump thrombosis in left ventricular assist devices,” Journal of the American College of Cardiology, vol. 73, no. 9 Supplement 1, p. 897, 2019. [Google Scholar]
- [35].Sood V, Alam O, Tchantchaleishvili V, Pagani FD, Aaronson KD, Haft J, Joyce DL, Joyce LD, Daly RC, Maltais S et al. , “Correlation of pre-explant lactate dehydrogenase concentrations and findings during post-explant pump analysis of the heartmate ii left ventricular assist device,” The Annals of thoracic surgery, vol. 103, no. 4, pp. 1207–1213, 2017. [DOI] [PubMed] [Google Scholar]
- [36].Jennings DL and Weeks PA, “Thrombosis in continuous-flow left ventricular assist devices: pathophysiology, prevention, and pharmacologic management,” Pharmacotherapy: The Journal of Human Pharmacology and Drug Therapy, vol. 35, no. 1, pp. 79–98, 2015. [DOI] [PubMed] [Google Scholar]
- [37].Nguyen AB, Uriel N, and Adatya S, “New challenges in the treatment of patients with left ventricular support: Lvad thrombosis,” Current heart failure reports, vol. 13, no. 6, pp. 302–309, 2016. [DOI] [PubMed] [Google Scholar]
- [38].Shah P, Mehta VM, Cowger JA, Haft J, Romano M, Aaronson KD, and Pagani FD, “Lactate dehydrogenase is superior to serum free hemoglobin as a marker of pump thrombosis in left ventricular assist devices,” The Journal of Heart and Lung Transplantation, vol. 32, no. 4, p. S37, 2013. [Google Scholar]
- [39].Cowger JA, Romano MA, Shah P, Shah N, Mehta V, Haft JW, Aaronson KD, and Pagani FD, “Hemolysis: a harbinger of adverse outcome after left ventricular assist device implant,” The Journal of Heart and Lung Transplantation, vol. 33, no. 1, pp. 35–43, 2014. [DOI] [PubMed] [Google Scholar]
- [40].Spearman C, “The proof and measurement of association between two things,” American journal of Psychology, vol. 15, no. 1, pp. 72–101, 1904. [PubMed] [Google Scholar]
- [41].Hinkle DE, Wiersma W, and Jurs SG, Applied statistics for the behavioral sciences. Houghton Mifflin College Division, 2003, vol. 663. [Google Scholar]
- [42].Ramlaul A, Medical Imaging and Radiotherapy Research E-Book: Skills and Strategies. Elsevier Health Sciences, 2010. [Google Scholar]
- [43].Mukaka MM, “A guide to appropriate use of correlation coefficient in medical research,” Malawi Medical Journal, vol. 24, no. 3, pp. 69–71, 2012. [PMC free article] [PubMed] [Google Scholar]
- [44].Friedman J, Hastie T, and Tibshirani R, The elements of statistical learning. Springer series in statistics New York, 2001, vol. 1, no. 10. [Google Scholar]
- [45].Goldstein DJ, John R, Salerno C, Silvestry S, Moazami N, Horstmanshof D, Adamson R, Boyle A, Zucker M, Rogers J et al. , “Algorithm for the diagnosis and management of suspected pump thrombus,” 2013. [DOI] [PubMed] [Google Scholar]