. 2020 Jul 9;9:e56008. doi: 10.7554/eLife.56008

Figure 3. Farrerol promotes SpCRISPR/Cas9 mediated gene targeting efficiency in mouse ESCs.

(A) Schematic diagram of the gene targeting strategy at the mouse Actb locus. A donor vector containing a promoter-less p2A-puromycin (Puro) and GFP gene driven by the CAG promoter was designed for targeting the mouse Actb locus. The underlined trinucleotide represents the PAM, and the sgRNA targeting site is labeled in red. The length of the left and right homologous arm is 801 bp and 800 bp, respectively. (B) Representative images of Coomassie blue stained puromycin resistant E14 cells which were successfully knocked in. Transfection of donor only or the mixture of sgRNA and Cas9 were set as the negative control. (C) Representative microscopy images of successfully targeted E14 cells with GFP expression. (D) Effect of different small molecules on gene targeting frequency at the Actb locus in mouse ESCs. The knock-in efficiency was measured by counting the cell colonies which were resistant to puromycin. (E) The Sanger sequencing results of the 5’ and 3’ junction regions of successfully knocked-in cells treated with farrerol. HAL stands for the left homologous arm and HAR stands for the right homologous arm. Error bars represent the s.e.m. **p<0.01, ***p<0.001, n.s., not significant, t-test. All experiments were repeated at least three times.

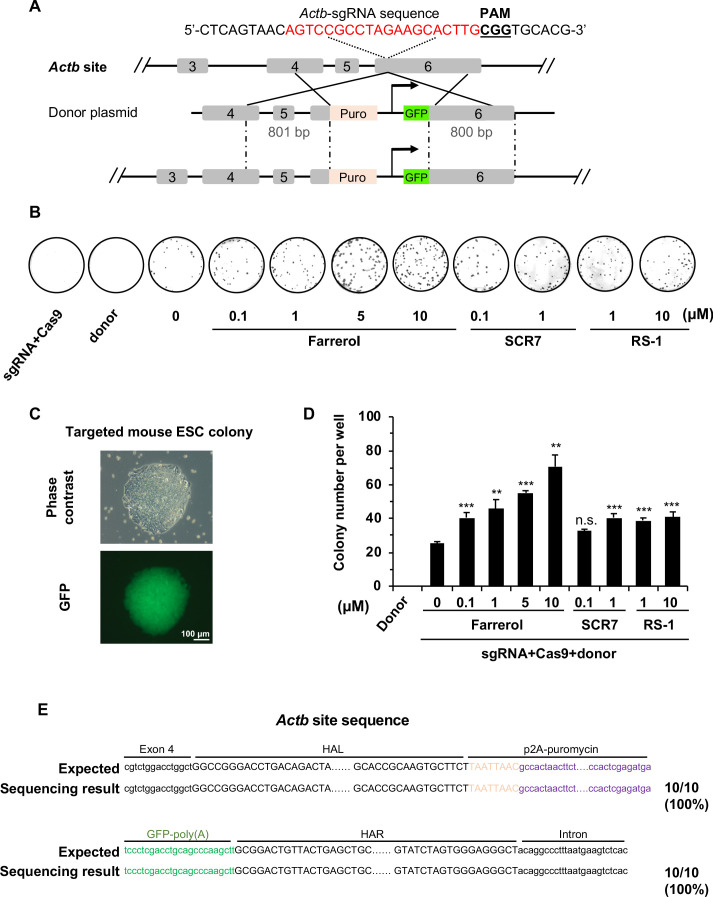
Figure 3—source data 1. Summary of knock-in efficiency in mouse ESCs.

Figure 3.

Figure 3—figure supplement 1. The effects of small molecule treatment on knock-in efficiency at the Rosa26 locus in mouse ESCs.

Figure 3—figure supplement 1.

(A) Schematic diagram of gene targeting strategy at the Rosa26 locus in mouse ESCs. Donor vector containing a promoter-less p2A-BFP-WPRE was designed for targeting the mouse Rosa26 locus. The underlined trinucleotide represents PAM, and the sgRNA targeting site is labeled in green. The length of both the left and right homologous arm are 800 bp. (B–C) Effect of different small molecules treatment on gene knock-in frequency at mouse Rosa26 locus. The representative FACS traces are shown in (B). Knock-in frequency was indicated by the percentage of BFP+ cells in (C). Error bars represent the s.e.m. **p<0.01, ***p<0.001, ****p<0.0001, t-test. All experiments were repeated at least three times.
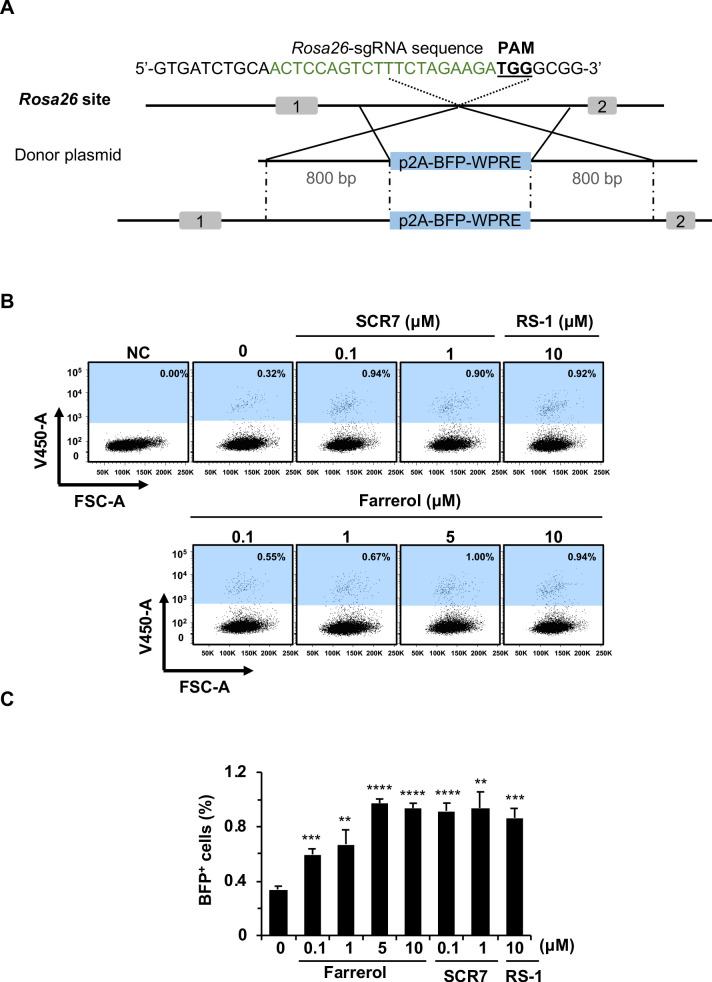
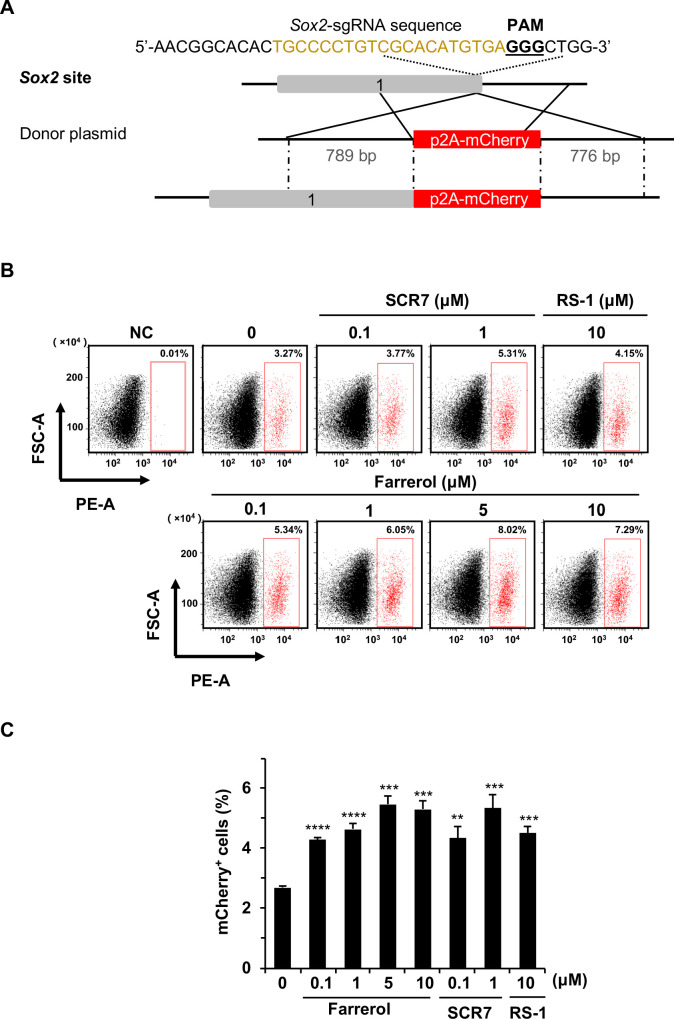
Figure 3—figure supplement 2. The effects of small molecule treatment on knock-in efficiency at the Sox2 locus in mouse ESCs.

Figure 3—figure supplement 2.

(A) Schematic diagram of gene targeting strategy at the Sox2 locus in mouse ESCs. Donor vector containing a promoter-less p2A-mCherry was designed for targeting the mouse Sox2 locus. The underlined trinucleotide represents PAM, and the sgRNA targeting site is labeled in light brown. The length of the left and right homologous arm is 789 bp and 776 bp, respectively. (B–C) Effect of different small molecules treatment on gene knock-in frequency at mouse Sox2 locus. The representative FACS traces are shown in (B). Knock-in frequency was indicated by the percentage of mCherry+ cells in (C). Error bars represent the s.e.m. **p<0.01, ***p<0.001, ****p<0.0001, t-test. All experiments were repeated at least three times.