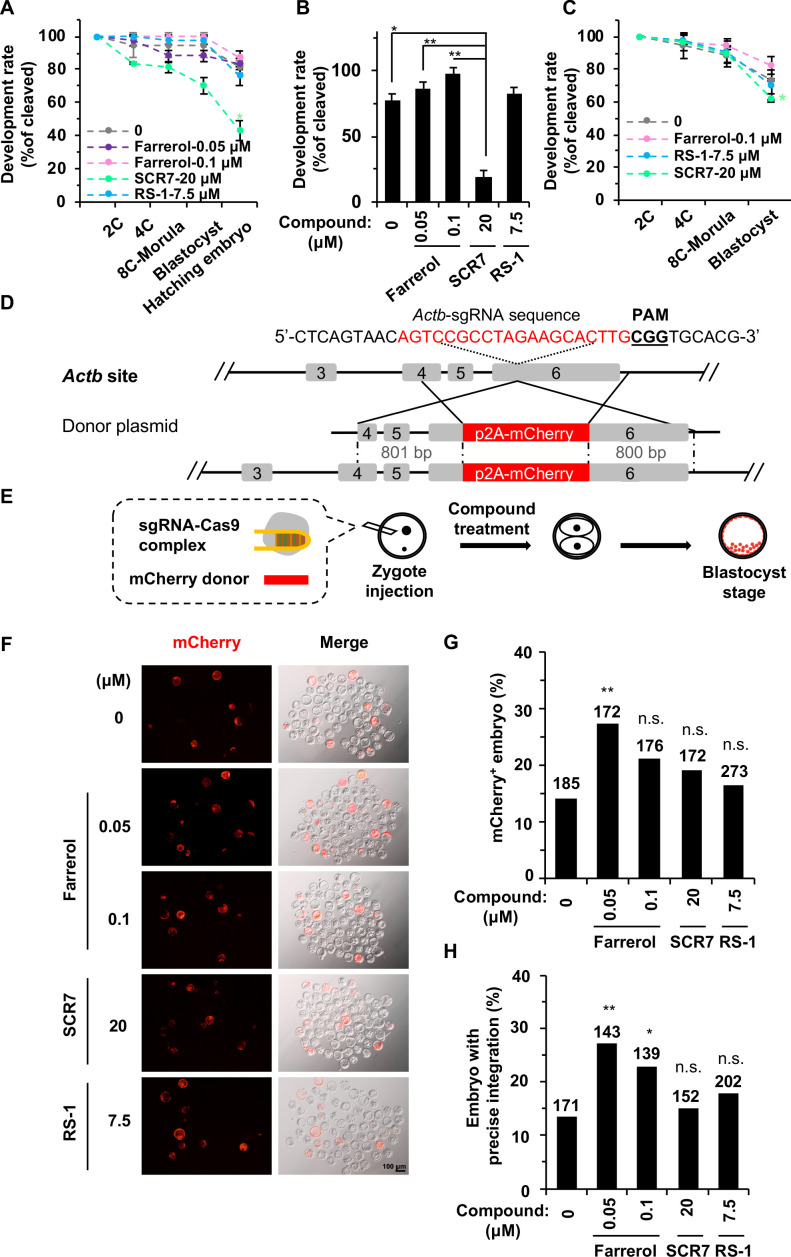
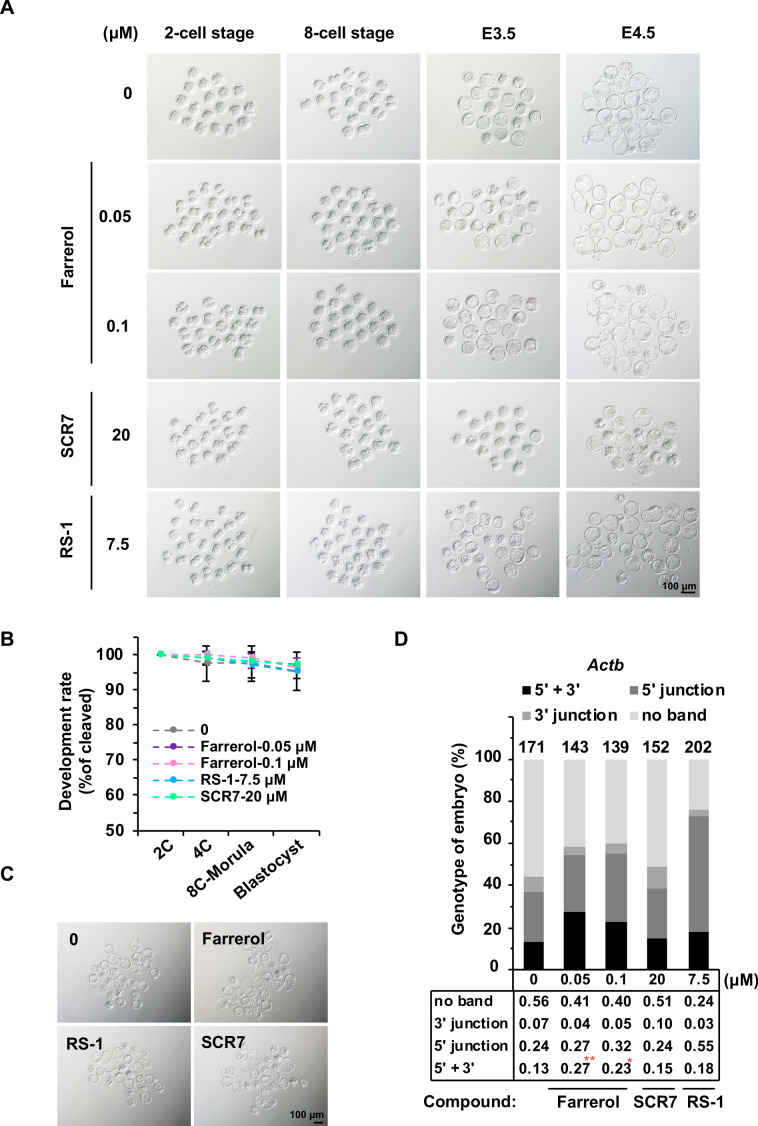
Figure 5. Farrerol promotes gene targeting in mouse embryos.
(A) In vitro development potential of mouse embryos treated with indicated doses of compounds during the whole embryonic stages. (B) The development rate of hatching blastocysts at E4.5 treated with indicated doses of compounds. The data is related to (A). (C) Effect of compounds treatment for 24 hr on in vitro development potential of mouse embryos upon DSBs were induced by Cas9 mRNA and sgRNA targeting the Cdx2 locus. (D) Schematic diagram of the gene targeting strategy at the Actb locus in mouse embryos. A donor vector containing a promoter-less p2A-mCherry was designed for targeting the Actb locus. The underlined trinucleotide represents the PAM, and the sgRNA targeting site is labeled in red. The length of the left and right homologous arm is 801 bp and 800 bp, respectively. (E) Diagram of the methods for gene targeting efficiency analysis in mouse blastocysts. (F) Representative fluorescence images of gene-edited mouse embryos at the Actb locus at the blastocyst stage. (G–H) Effect of indicated small compounds on gene knock-in frequencies at the Actb locus. Knock-in frequency was indicated by the percentage of mCherry+ blastocysts in (G), and was confirmed by PCR genotyping analysis using primers amplifying the flanks of the Actb site in (H). Number above each bar, total blastocysts analyzed. Error bars in (A), (B) and (C) represent the s.d. and t-test was used for statistical analysis. For (G) and (H), χ2-test was used for statistical analysis. *p<0.05, **p<0.01, n.s., not significant.


