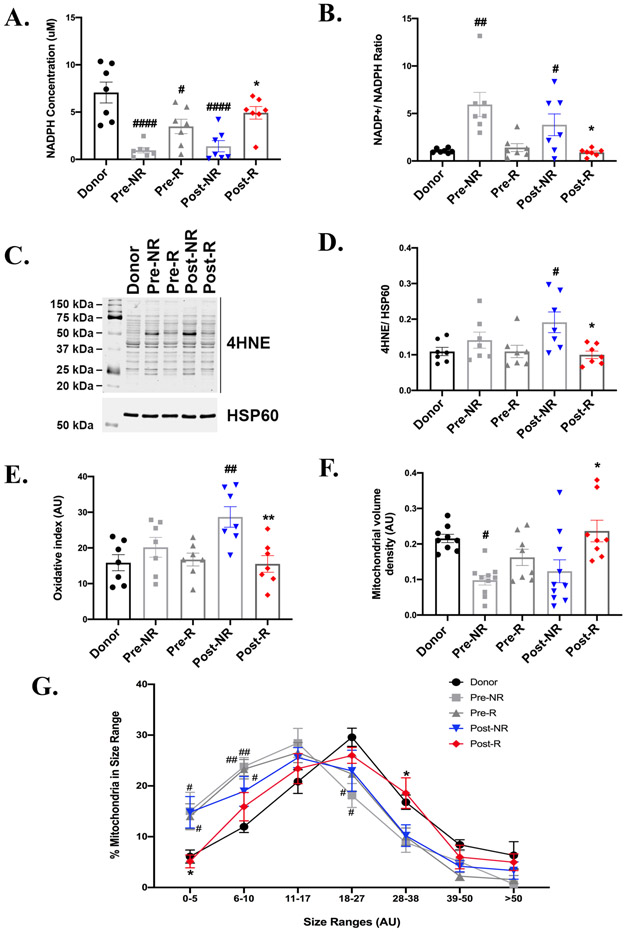
Figure 6: Oxidative stress and mitochondrial adaptations to increased non-glycolytic glucose metabolism.
A. NADPH levels and B) NADP+/NADPH ratio measured using the NADP+/ NADPH kit shows high NADPH levels and reduced ratio in Post-R. C) and D) Representative western blot and densitometric analysis from 7 independent experiments showing using 4-hydroxynonenal (4-HNE) oxidative modifications in paired tissue samples from pre- and Post-Responders (R) and non-responders (NR). HSP60 is the lane loading control. E) Graph showing densitometric analysis of the reactive oxygen species (ROS) modifications revealed using the oxy-blot detection kit. (n=7 for each group). F) Mitochondrial volume density and G) mitochondria size range using electron microscopy images. (n= donors-5, pre and post R-7, pre and post NR-7). p-value < 0.05 was considered significant; #p< 0.05, ##p<0.01 and ####p<0.0001 as compared to donors; *p< 0.05 and **p<0.01 compared to Post-NR. Error bars represent SEM.

