

Abstract
The substantia nigra pars reticulata (SNr), where the basal ganglia (BG) direct and indirect pathways converge, contains among the highest expression of cannabinoid receptor type 1 (CB1r) in the brain. Hence, SNr is an ideal locus to study pathway interactions and cannabinergic modulations. The objective of this study was to characterize the effects of systemic injections of the CB1r agonist (CP55940) on the balanced activity of the direct/indirect pathways in the SNr and its associated behaviors. To this aim, we recorded somatosensory and pathway-specific representations in the spiking activity of the SNr of male rats under CP55940. CB1r activation mainly decreased the inhibitory, potentially direct pathway component while sparing the excitatory, potentially indirect pathway component of somatosensory responses. As a result, cutaneous stimulation produced unbalanced responses favoring increased SNr firing rates, suggesting a potential locus for cannabinergic motor-related effects. To test this hypothesis, we implemented an ad hoc behavioral protocol for rats in which systemic administration of CP55940 produced kinematic impairments that were completely reverted by nigral injections of the CB1r antagonist (AM251). Our data suggest that cannabinoid-related motor effects are associated with unbalanced direct/indirect pathway activations that may be reverted by CB1r manipulation at the SNr.
SIGNIFICANCE STATEMENT The cannabinergic system has been the target of multiple studies to master its potential use as a therapeutic agent. However, significant advances have been precluded by the lack of mechanistic explanations for the variety of its desirable/undesirable effects. Here, we have combined electrophysiological recordings, pharmacological and optogenetic manipulations, and an ad hoc behavioral protocol to understand how basal ganglia (BG) is affected by cannabinoids. We found that cannabinoids principally affect inhibitory inputs, potentially from the direct pathway, resulting in unbalanced responses in the substantia nigra pars reticulata (SNr) and suggesting a mechanism for the cannabinoid-related slowness of movements. This possibility was confirmed by behavioral experiments in which cannabinoid-related slowness of purposeful movements was reverted by cannabinoid receptor type 1 (CB1r) manipulations directly into the SNr.
Keywords: cannabinoids, substantia nigra
Introduction
Given the high expression of the cannabinoid receptor type 1 (CB1r) in the basal ganglia (BG; Tsou et al., 1998; Egertovà and Elphick, 2000; Mátyás et al., 2006), as well as the motor effects associated with cannabinergic administrations (Rodríguez de Fonseca et al., 1998), the manipulation of the cannabinergic system has been proposed as a potential treatment for movement/BG-related disorders such as Parkinson's disease (Buhmann et al., 2019). The BG are a group of subcortical nuclei where information is processed by the direct and indirect pathways (Graybiel, 2008; Redgrave et al., 2010). The substantia nigra pars reticulata (SNr) and the globus pallidus (internal segment) are the output nuclei of the BG and integrate inputs from both pathways (Deniau et al., 2007). Given its anatomic location, the SNr could be an ideal integrative locus for movement selection and control (Aceves et al., 2011; Sarvestani et al., 2011); nevertheless, its exact contribution to the final behavioral outcome is still unknown.
On the other hand, the SNr is perhaps the nucleus with the highest concentration of CB1r in the brain, where receptors are located in GABAergic terminals (most likely from the direct pathway) and glutamatergic terminals (most likely from the indirect pathway; Tsou et al., 1998; Egertovà and Elphick, 2000; Mátyás et al., 2006). CB1r activation in the SNr decreases GABA (Wallmichrath and Szabo, 2002) and glutamate (Szabo et al., 2000) release in vitro, and it has been proposed that CB1r activation may be fundamental for the integrative properties of this nucleus (Aceves et al., 2011; Sarvestani et al., 2011). Despite the high levels of CB1r in the SNr and the well-known motor effects of systemic cannabinergic compounds, the exact role of CB1r modulation in the direct and indirect pathway terminals, as well as their final contribution to behavior, is still unclear. In this context, in vitro and in vivo electrophysiological evidence indicates that the activity of the SNr is highly modulated by systemic administrations of CB1 agonists. For example, it has been shown that sensory stimulation and specific activation of the direct or indirect pathways produce complex responses in the SNr in freely moving mice (Freeze et al., 2013; Brown et al., 2014). In rats, electrical stimulation of sensorimotor cortices produced similar responses characterized by a series of inhibitions and excitations potentially related to the activation of direct and indirect pathways of the BG, respectively (Antonazzo et al., 2019). Interestingly, the systemic administration of a CB1r agonist blocked the inhibitory and spared the excitatory component of the complex response, suggesting a biased or unbalanced cannabinergic modulation of direct pathway terminals (Antonazzo et al., 2019). The literature suggests that cannabinergic compounds may have differential effects on both pathways of the BG, but their final contribution to the behavioral outcome remains unclear. In this context, we hypothesize that the motor effects of cannabinergic drugs are related to an unbalanced activity of the direct/indirect pathways of the BG. This study aimed to characterize the direct and indirect pathway contributions to the integrated responses to sensory stimulation in the SNr, the role of CB1 activation in this phenomenon and its impact on behavior. To this end, we chose an electrophysiological strategy in which somesthetic stimulation produced robust sensory representations in the sensorimotor striatum of anesthetized rats (Hidalgo-Balbuena et al., 2019). Under this condition, we recorded dozens of neurons in the SNr while stimulating the direct and indirect pathways of the BG with optogenetics in wild-type and transgenic rats under systemic administrations of cannabinoids. For assessing behavioral consequences, we designed a novel task to recede from general motor quantifications and evaluate specific aspects of movements. In this task, we can simultaneously evaluate the speed, amplitude, and coordination of bimanual movements. We have combined this approach with systemic and local injections of CB1r agonists and antagonists.
Materials and Methods
All experimental procedures were approved by the Animal Ethics Committee of the Institute of Neurobiology, at the National Autonomous University of Mexico (UNAM), and conformed to the principles outlined in the Guide for the Care and Use of Laboratory Animals (NIH). All efforts were made to minimize the number of animals used and their suffering.
Experimental design and statistical analysis
We used male Long–Evans wild-type rats (n = 39; 250–700 g) and male Long–Evans rats LE-Tg (Drd1a-iCre-3Ottc; n = 10; 250–700 g). LE-Tg rats were obtained from the Rat Resource and Research Center at the University of Missouri (MTA-TO; NIMH Ref. No. 2018–0136) and reproduced in our animal facility. Animals were housed in pairs at stable temperature (23°C) and humidity (66%) under a constant 12/12 h light/dark cycle (lights on at 8 A.M.), with free access to food and water. All experimental procedures were conducted during the light phase of the cycle. Animals subjected to behavioral protocols in the bilateral coordination task were water restricted and consumed the totality of their liquids during performance of the task (∼25 ml/d). The weight of the animals was carefully monitored daily, and, in some cases, if the animals did not consume their daily water proportion, water was provided in their home cages for short periods after training. Animals were trained for 6 d every week, and 24 h of free access to water was granted every 7 d. Thirty-six rats were used for anesthetized electrophysiological experiments. Thirteen animals were trained in the bilateral coordination task and subjected to local and systemic infusions of cannabinoids (for local injections, four were implanted with cannulae directed to the SNr). Animals were bred and maintained in the satellite bioterium of our laboratory and constantly supervised by specialized personnel from the general animal facility of our Institute.
Statistics
The electrophysiological and behavioral data are presented as median + 25th and 75th percentiles. For all groups, normality was estimated with the Kolmogorov–Smirnov test. Statistical significance for group comparison was estimated using the Kruskal–Wallis test (K–W) for electrophysiological and behavioral data. Multiple comparison analysis was performed with the Bonferroni post hoc test (B-test). Statistical analysis was performed using MATLAB software (The MathWorks). Differences were considered statistically significant if p ≤ 0.05.
Anesthetized experiments
Animals were anesthetized with urethane (1 g/kg) and mounted on the stereotaxic frame; supplemental doses (0.15 g/kg) were given when necessary after ∼6 h of the initial dose. Silicon probe recordings were performed through a craniotomy (2 × 2 mm) centered at −5.5 mm anterior and 2.4 mm lateral to bregma (all stereotaxic coordinates were calculated based on the Paxinos and Watson brain atlas or Brain maps by L. W. Swanson; Swanson, 2018). Histologic confirmation of silicon probe positions in the brain was achieved by applying DiI lipophilic carbocyanine dye (1%; Sigma) to the back of the probes (Fig. 1B). For optogenetic experiments an optical fiber (diameter, 200 µm) was fixed onto the dorsolateral striatum (DLS) or the subthalamic nucleus (SthN) ∼100 μm over the infection sites. Probes were slowly inserted into the SNr (depth, 7300–8200 µm). For each animal, we performed one continuous recording that included a 15- to 20-min baseline and at least three injections of CP55940 separated by at least 20 min. Somesthetic stimulations were performed on the pads of the forelimb contralateral to the recording site with a bipolar electrode located on the medial (+) and lateral pads (–) (Fig. 1B). Each stimulus was presented for 5 ms. Stimulation was given every 5 s as a single stimulus or as trains of five stimuli (3.3 Hz). Immediately after the experiments, animals were injected with a lethal dose of pentobarbital and transcardially perfused; their brains were then extracted and processed for histologic quantifications. All viruses were obtained from the University of North Carolina Vector Core.
Figure 1.
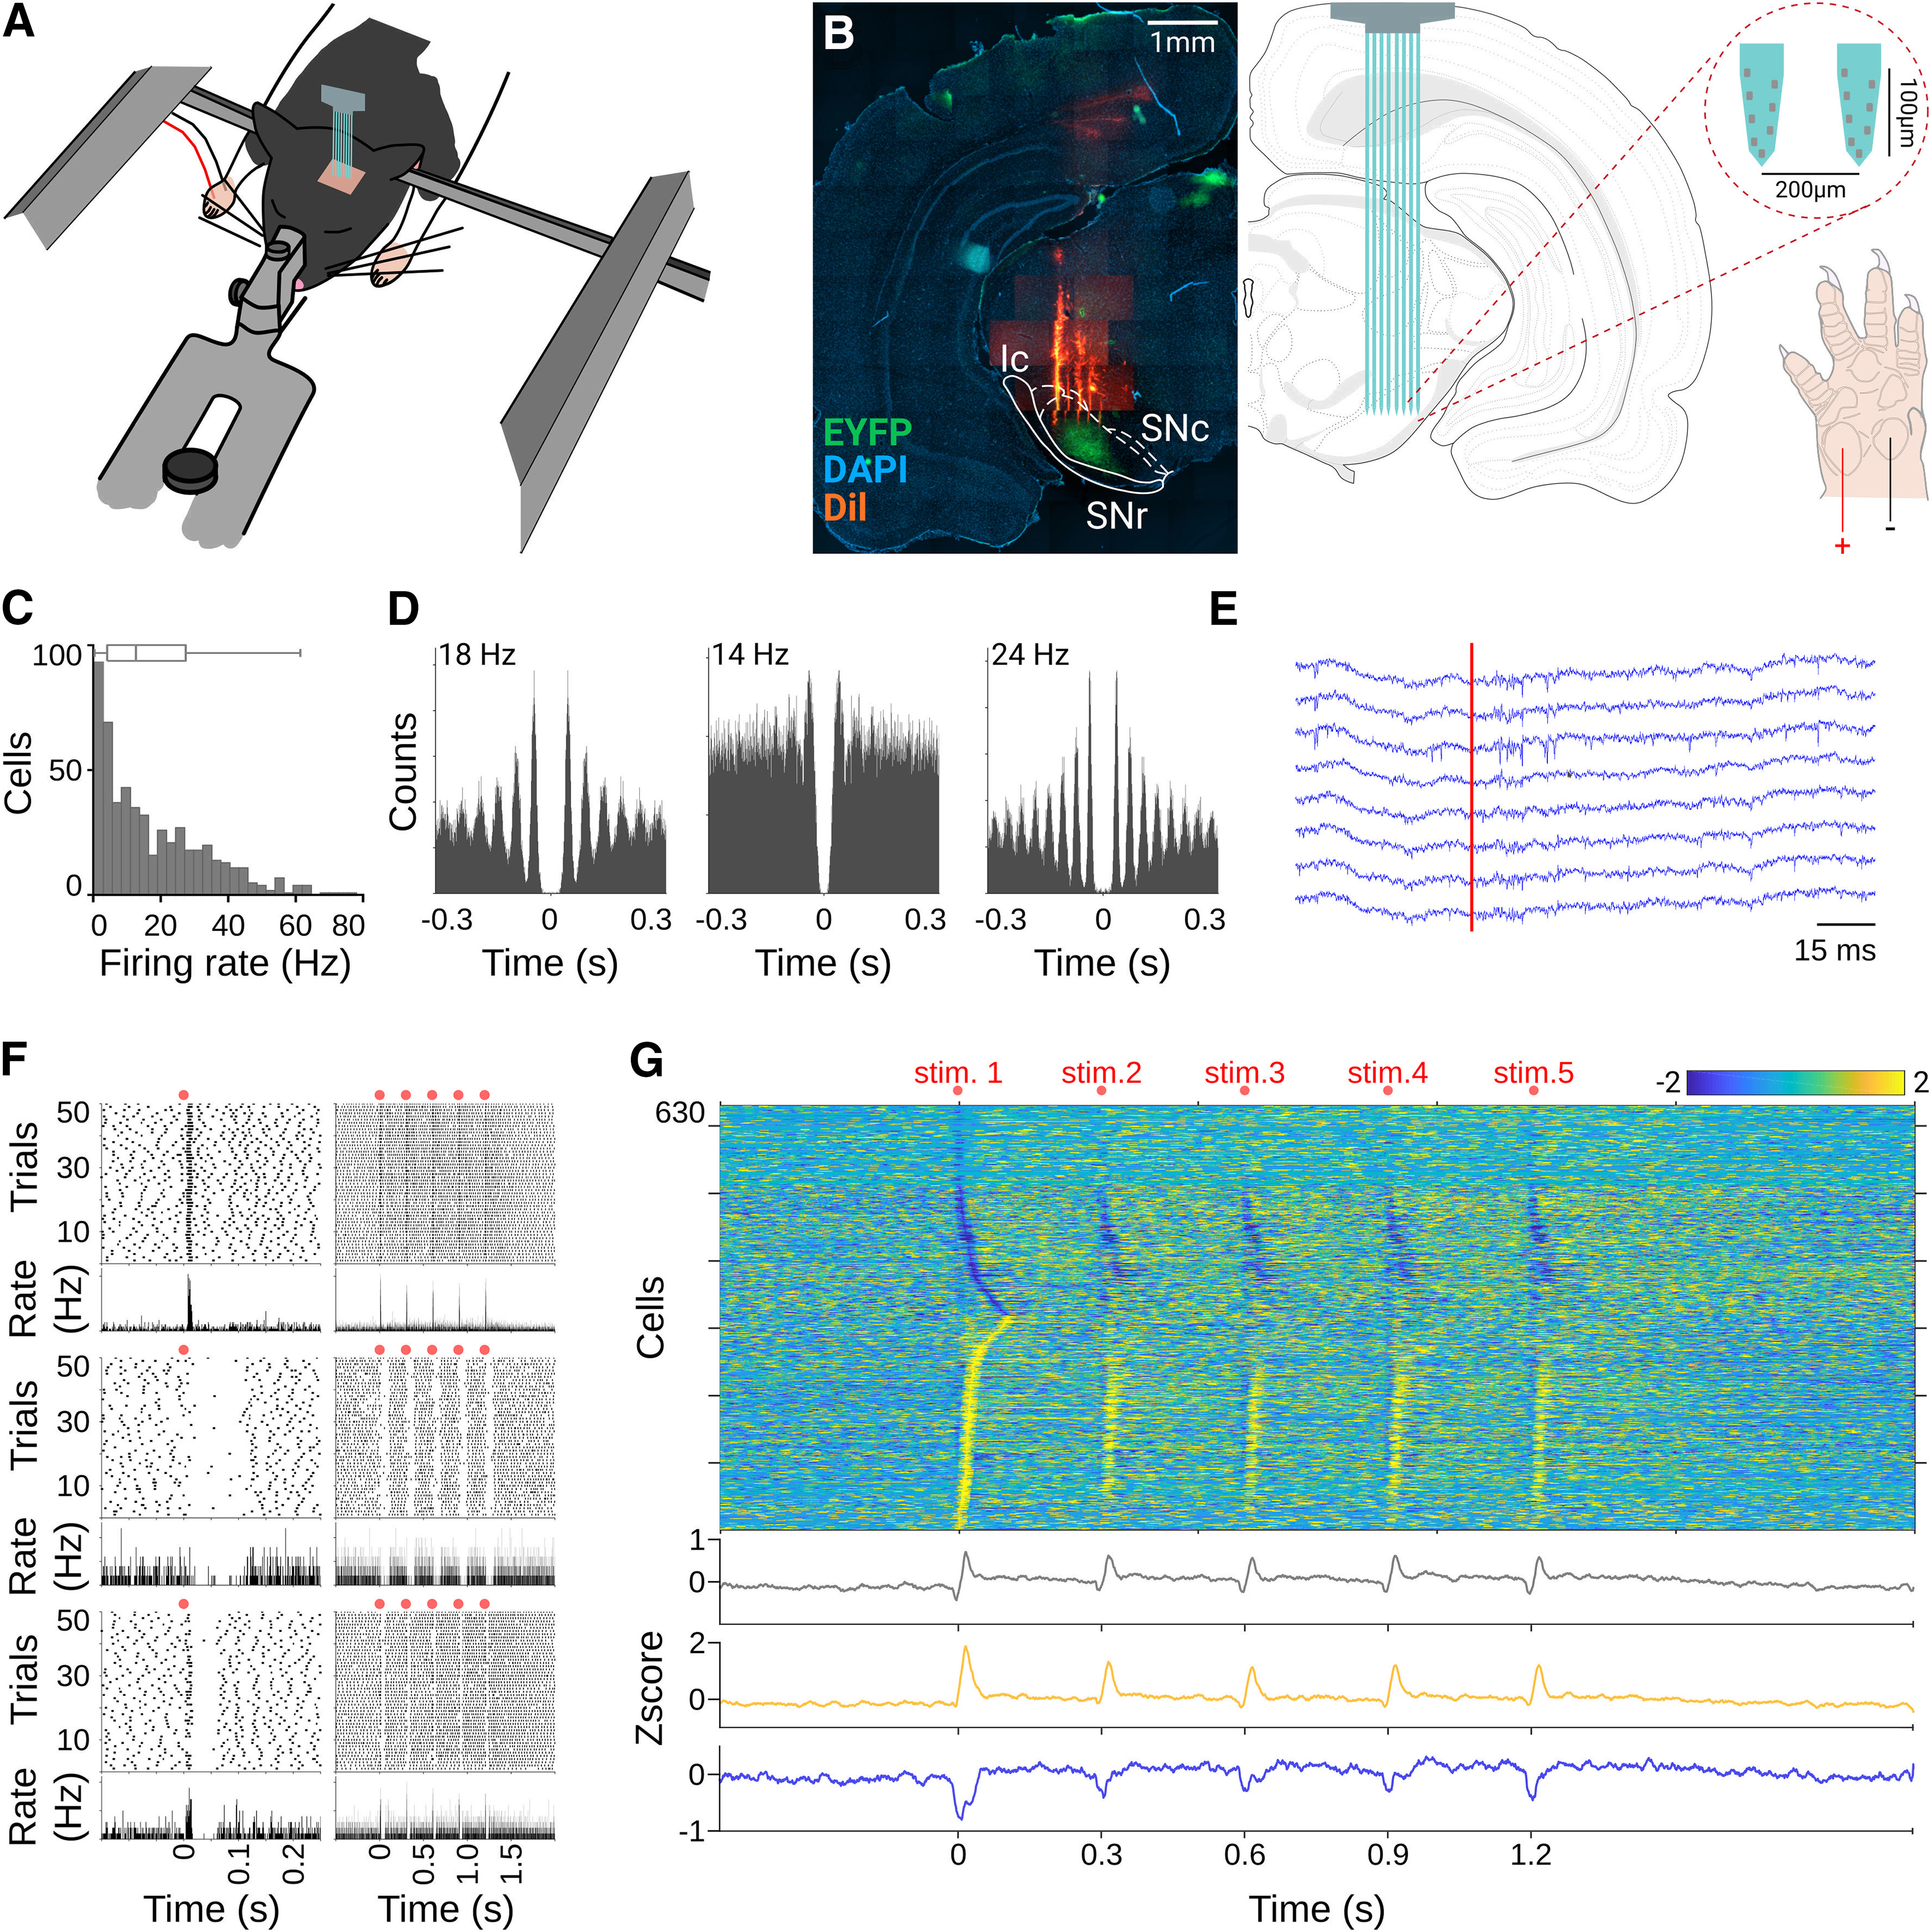
Sensory-evoked responses in the substantia nigra pars reticulata. A, Schematic representation of the anesthetized preparation. Recordings are performed on deeply anesthetized animals fixed on a stereotaxic frame; electrical stimulation is provided in the forepaw contralateral to the recording site. B, DAPI staining for histologic confirmation of the silicon probe position (DiI stained) in the SNr (left) and schematic view of the recording site (right). SNr is highlighted by the enhanced yellow fluorescent protein (EYFP) expressed in direct pathway terminals (see Materials and Methods). C, Firing rate histogram for all cells recorded in the SNr. D, Representative autocorrelograms for three cells during baseline recordings. E, Representative local field potential (LFP) response for eight channels after somesthetic stimulation in the contralateral forepaw (red line). F, Spike rasters (top) and average perievent histograms (bottom) are depicted for cells with different response patterns recorded in the SNr; red dots indicate somesthetic stimulations. Left and right columns depict responses to the first and fifth stimuli of the train. G, Averaged firing rates for cells recorded in the SNr expressed as Z-score (color coded) and sorted according to the time they reached the highest (bottom to top) or lowest (top to bottom) activity change after stimulus onset. Bottom traces represent averaged histograms of the population response latencies for all cells recorded (gray) or cells that increased (yellow) or decreased (blue) their firing rates after stimulations.
Electrophysiological data acquisition and processing
Wide-band (0.1–8000 Hz) neurophysiological signals from silicon probes (NeuroNexus, Buzsaki-64-Long) were amplified 1000 times via Intan RHD2000 series Amplifier System and continuously acquired at 20 kHz. Data visualization and processing were performed from raw data using Neuroscope and NDManager (http://neurosuite.sourceforge.net). Spike sorting was performed semi-automatically using the clustering software KlustaKwik (http://klustakwik.sourceforge.net; Harris et al., 2000) and the graphical spike-sorting application Klusters (http://neurosuite.sourceforge.net; Hazan et al., 2006).
Analysis of the neural data
Latencies
To determine the response latencies to mechanical or optical stimulation, the neuronal data were binarized to a resolution of 1 ms. Perievent histograms were constructed, and a confidence limit of 99% based on baseline activity (−1 s before each stimulation) was calculated for each cell. Responses to stimulation were considered significant if they exceeded the confidence limit by at least 1 ms, and the time of the first bin was defined as the response latency.
Amplitudes
The amplitude of the sensory-evoked responses was calculated in the Z-scored firing rates during the first 50 ms after the stimuli of the train. To create color-coded matrices of neural activity (Fig. 1G), average neural activity from the perievent histograms was transformed into Z-scores, and cells were divided into two subpopulations: cells that decreased and cells that increased their firing rates after somesthetic or optic stimulations. Finally, cells were sorted according to the time they reached their highest or lowest firing rates after the first stimulus of the stimulation train.
Behavioral apparatus and training
Apparatus
Animals were trained in customized behavioral boxes (50 × 50 × 50 cm) equipped with two sets of levers, a water port, a green LED to indicate correct trials, and two white LEDs to indicate the availability of a set of levers. Each set of levers consists of two levers protruding 5 cm from the wall. The levers can move vertically and horizontally and are connected to a voltage transducer (4 cm = 2.5 V). Voltage signals are digitized and stored at 250 Hz through National Instruments cards (NI PXIe-6363) and LabView custom-made routines. Animals are rewarded with water delivered with a solenoid valve through the center water port.
Task
Animals are trained to hold two levers, one with each paw, to simultaneously and vertically displace them at least 3 cm (vertical threshold) and for at least 750 ms continuously (time threshold). The position of the levers is constantly monitored to determine the exact moments the lever crosses spatial thresholds. The threshold to determine whether a lever was moved was established at 0.1 mm from the original position. Trials are self-initiated, do not have a time limit and end when the animals obtain a reward. Rewards are signaled by switching on the green LED (1 s). After this, the white LED is turned on again, indicating that the animal can obtain a new reward. In any given session, animals can perform an unlimited amount of trials in the lapse of 1 h to 1 h 30 min. Most of the animals performed around 250–300 trials per session. In each session, we continuously recorded the vertical and horizontal positions of both levers. All the execution parameters described below are calculated based on the raw position data from the levers. Interlimb correlation is calculated as the Pearson correlation coefficient between the raw position of the left and right levers from the beginning of the successful bilateral movement to the delivery of the reward. Onset synchrony is defined as the difference in time between the beginning of the movement of left and right levers for the rewarded movement. Overshoot is the amount of time that the levers remained under the spatial threshold after the reward was delivered. The effort/reward index is the average amount of time that the levers are pressed to obtain a single reward. Speed was calculated as the instantaneous difference in position in 4-ms time bins, and we report the average maximum per session.
Training
To accustom the animals to the training conditions, rats were introduced to the training cages in two 1-h sessions before the beginning of training. In these sessions, animals were not water-deprived; the general light of the training cage was on and the reward green and white LEDs above the levers were sporadically switched on. Drops of water were also randomly delivered in the water port. Then, we started the water deprivation, and animals were introduced into the training cages and trained to obtain water by simply touching any lever and then simultaneously touching the two levers. In general, all animals quickly learned the rule of touching both levers in the first two sessions. From session 3, rewards would be delivered only if the levers were slightly moved down (>0.1 mm). Animals also achieved this in a few trials. We progressively increased the spatial threshold until the animals reliably displaced both levers simultaneously at least 3 cm. This phase took between two and three sessions depending on the animal (200–300 trials). In the last pretraining phase, rewards would only be delivered if the levers were simultaneously maintained under the spatial threshold (3 cm) for at least 50 ms (temporal threshold). Finally, in a range of three to five sessions, spatial thresholds were progressively increased until 750 ms. The learning curves we report include only the sessions in which the animals pressed both levers simultaneously. Pharmacological manipulations were performed after at least 100 sessions of training in the 3-cm spatial and 750-ms time thresholds.
Systemic and local injections of cannabinergic compounds
For systemic injections, CP55940 (Sigma or Cayman) was diluted in saline + DMSO (5%, Sigma) + Cremophor (5%, Sigma). Drugs were injected in volumes of 1 ml/kg. For anesthetized electrophysiological recordings, we used final concentrations of 0.1, 0.3, and 0.5 mg/kg. All the injections were performed in the same recording session separated by 25–35 min between injections. To discard unspecific effects related to the length of recordings, in two animals, we performed three consecutives injections of vehicle (separated by 20–25 min). To address the reversibility of the effects of CP55940 by a CB1r antagonist, in seven animals, we performed a stimulation protocol after 15 min of baseline conditions. Immediately after, we performed a systemic injection of AM251 (1 mg/kg, three animals; 3 mg/kg, four animals) and 15 min later a systemic injection of CP55940 (0.5 mg/kg); 15 min after the injection of CP55940 (30 min after AM251), we repeated our stimulation protocols (Fig. 4I). For the injections during the execution of the bilateral coordination task, we used the same doses, but each dose was injected in individual sessions with at least two drug-free sessions between injections. For the local injection experiments, CP55940 and the CB1r antagonist AM251 were diluted in the same vehicle and injected in concentrations of 0.25, 1, 5, and 10 μg for CP55940 and a single concentration of 10 μg for AM251. For the local/systemic experiments we used 0.3 and 0.5 mg/kg of CP55940 combined with the local injections of AM251. Local injections (500 nl per site at 200 nl min−1) were performed 15 min before the behavioral sessions (for CP55940). For the local/systemic injections, AM251 was injected 15 min before the systemic injection of CP55940, and the behavioral session started 15 min after the systemic injection.
Figure 4.
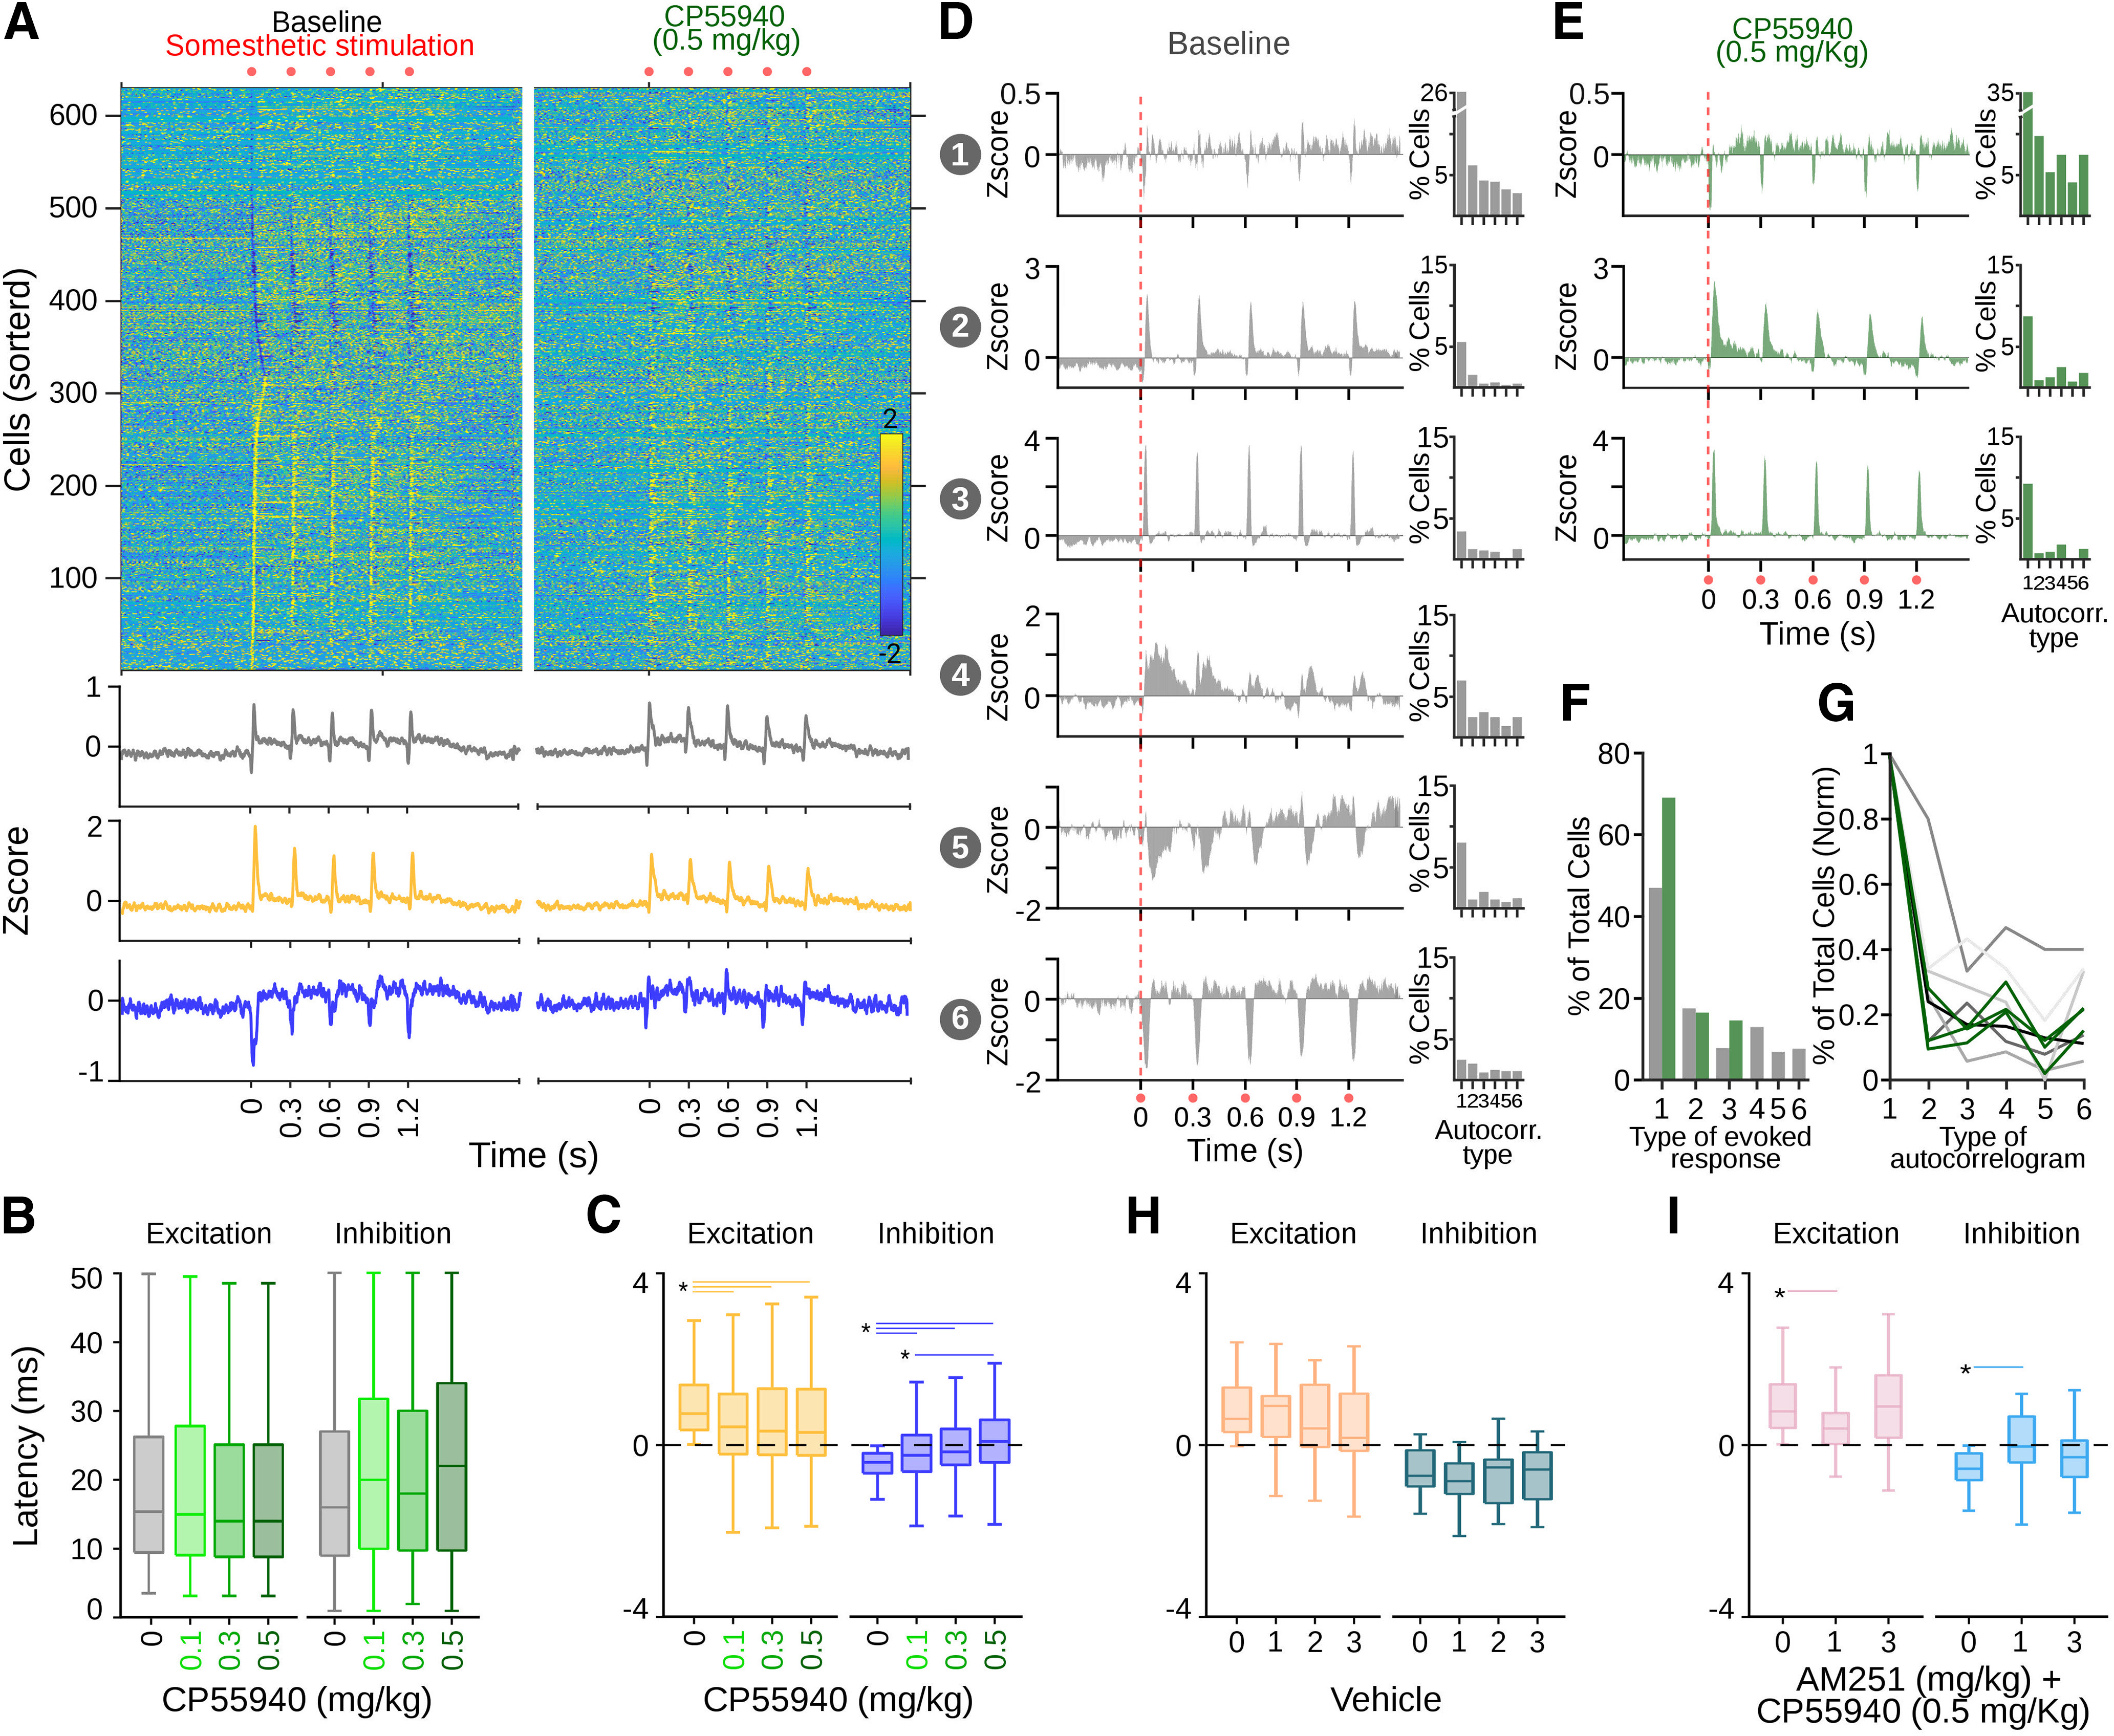
Cannabinergic effects on sensory-evoked SNr activity. A, Averaged firing rates for cells recorded in the SNr expressed as Z-score (color coded) and sorted according to the time they reached the highest (bottom to top) or lowest (top to bottom) activity after somesthetic stimulation on the contralateral forepaw. Bottom traces represent averaged histograms of the population response for all cells recorded (gray) or cells that increased (yellow) or decreased (blue) their firing rates after stimulations. Left and right panels represent population-evoked activity during control and the highest concentration of CP55940 administrations, respectively. B, Latencies for excitatory and inhibitory responses to somesthetic stimulations under different doses of CP55940 (color coded). C, Average amplitude of excitatory (yellow) and inhibitory (blue) populations evoked by somesthetic stimulations under different doses of CP55940. Average sensory-evoked responses for cells classified as part of specific patterns during baseline (D) and under the highest dose of CP55940 (E). Bar plots on the right of each pattern represent the percentage of cells of that specific sensory-evoked pattern expressing specific firing patterns in their autocorrelograms (as in Fig. 3). F, Percentage of cells belonging to the specific classified patterns of evoked responses displayed in D, E. G, Distributions of the percentage of cells expressing specific autocorrelogram patterns (from Fig. 3) normalized to the value of maximum prevalence. Each line represents the distribution for each sensory-evoked pattern in baseline conditions (gray, six patterns as in D) and under CP55940 (green, three patterns as in E). Average amplitude of excitatory and inhibitory populations evoked by somesthetic stimulations on baseline and three injections of vehicle (H) or two different systemic doses of AM251 before a systemic injection of CP55940 (I). Asterisks and lines indicate significant differences.
Surgeries
All surgical procedures were performed under deep sevoflurane (0.2–2%) or urethane anesthesia. Temperature and pain reflexes were continuously monitored. For optical stimulation during anesthetized recordings, we infected the DLS (injection coordinates: AP = 0.6; ML = 3.5; DV = 4; in millimeters with respect to bregma) or the SthN (injection coordinates: AP = −3.6; ML = 2.4; DV= −7.9; in millimeters with respect to bregma). Optical fibers were fixed 200 μm above the injection site. For the implantation procedures, guide cannulae (stainless steel, 26 gauge, WPI) were bilaterally implanted in the SNr (coordinates in millimeters with respect to bregma: AP = −5.5; ML = ±2.4; DV = −6.8; the injectors protruded the guide cannulae by 1 mm).
Results
Somesthetic stimulations in anesthetized animals reflect direct-indirect pathway activation
To evaluate the effects of cannabinoids on SNr activity, we implemented a preparation to perform silicon probe-based multiunitary recordings in urethane-anesthetized rats (Fig. 1A,B). In this preparation, electrical stimulation in the forelimb produces robust representations in the primary somatosensory cortex and the DLS (Hidalgo-Balbuena et al., 2019); hence, we expected to record sensory-evoked responses in the SNr (Nagy et al., 2005). To test this possibility, we evaluated spontaneous and sensory-evoked activity from 714 neurons from the SNr of 27 animals. Under these conditions, SNr cells exhibited baseline activities at around 15 Hz (Fig. 1C), and many cells presented spontaneous rhythmic modulations, clearly visible in their autocorrelograms (Fig. 1D), at different frequencies between 4 and 20 Hz (see next section). For sensory-evoked activity, we used a stimulation train protocol as in Hidalgo-Balbuena et al. (2019). Electrical stimulation of the forepaw pads contralateral to the recording sites (Fig. 1B) produced sensory-evoked responses in the SNr that were modestly visible in the local field potential (Fig. 1E), but with robust representations in the spiking activity of individual cells (Fig. 1F). As previously reported for auditory and sensorimotor cortex stimulation (Brown et al., 2014; Antonazzo et al., 2019), electrical or chemical activation of the striatum (Dray et al., 1976; Chevalier et al., 1985; Deniau and Chevalier, 1985), we found that our stimulation produced complex patterns consisting of transitory inactivations followed by transitory activations. These responses were visible in individual cells and the five stimuli of the train (Fig. 1G). While not all the cells presented both activation and inactivation, both types of responses were represented significantly in the population responses (Fig. 1G, top). Then, we separated the cells into two subpopulations: cells that in average increased and cells that decreased their firing rate during the first 30 ms after the first stimulus of the train. The averaged activity of these subpopulations revealed the presence of the two main components (excitation and inhibition) of the response (Fig. 1G, bottom). Thus, in this preparation, somesthetic stimulations produced somatosensory representations in the population dynamics of the SNr characterized by transient inhibitions followed by transient excitations, potentially reflecting a balanced direct-indirect pathway activation (Coffey et al., 2017).
CP55940 unbalanced the sensory representation in the SNr
In this urethane-based anesthetized preparation, motor commands are significantly reduced (Bermudez Contreras et al., 2013; Mochol et al., 2015). Hence, it is possible to evaluate the effects of systemic administrations of CB1r agonists on sensory processing in the SNr. Under these conditions, we systemically injected (intraperitoneally) different doses of the CB1r agonist CP55940 and evaluated its effects on spontaneous and sensory-evoked activity of the SNr. Given the nature of our experiments (i.e., animals can be recorded only once), in each recording session we delivered increasing doses of the drug ∼30-min intervals (0.1, 0.3, 0.5 mg/kg). This means that the last dose is an accumulation of the previous ones. First, we evaluated the changes in baseline parameters. We observed a significant decrease of the general population average firing rates with the highest dose of CP55940 (K–W, X2 = 20.7068, p = 0.001 and B-test, B vs 0.1, p = 1; B vs 0.3, p = 0.6459; B vs 0.5 p = 0.0010; 0.1 vs 0.5, p < 0.001; Fig. 2A). Then, when we analyzed the activity of single cells, we found three subpopulations: cells without significant changes (18.74%), with a significant increase (34.48%), and with a significant decrease (46.77%) in their firing rates. A visual inspection of the autocorrelograms during the analysis of firing patterns of individual neurons suggested that many cells changed their firing patterns in a dose-dependent manner (Fig. 2B). To quantify this possibility, we applied principal component analysis (PCA) during the first 60 ms of the autocorrelograms of individual cells (Latuske et al., 2015). Then, we projected the first three principal components and applied k-means to assign cells to specific clusters (Fig. 3B). To obtain the best projection, the process was repeated 1000 times with projections ranging from two to eight clusters. In each iteration, we scored the projection with the silhouette method (Taouali et al., 2017; Hidalgo-Balbuena et al., 2019) and selected the projections with the highest silhouette scores (Fig. 3A). This procedure was applied independently for baseline activity and the different doses of CP55940. We found that, in all conditions, the data were better explained in five or six clusters (Fig. 3B) corresponding to different firing patterns (Fig. 3C). The doses of CP55940 changed the proportions of cells comprising each cluster, resulting in a major prevalence of oscillatory patterns (Fig. 3C). Then, we analyzed the relative power of the oscillations in the autocorrelograms of each cell. CP55940 produced a clear increase in slow frequencies (0–3 Hz; K–W, X2 = 59.7706 p < 0.001; B-test, B vs 0.1, p < 0.001; B vs 0.3, p < 0.001; B vs 0.5 p < 0.001) and a decrease in fast oscillatory frequencies between 21 and 40 Hz (K–W, X2 = 28.59, p < 0.001; B-test, B vs 0.1, p = 0.003; B vs 0.3, p < 0.001; B vs 0.5, p < 0.001) and 91 and 120 Hz (K–W, X2 = 235.67, p < 0.001; B-test, B vs 0.1, p < 0.001; B vs 0.3, p < 0.001; B vs 0.5, p < 0.001), with no change in frequencies between 4 and 10 Hz (K–W, X2 = 7.7035, p = 0.05; Fig. 2C).
Figure 2.
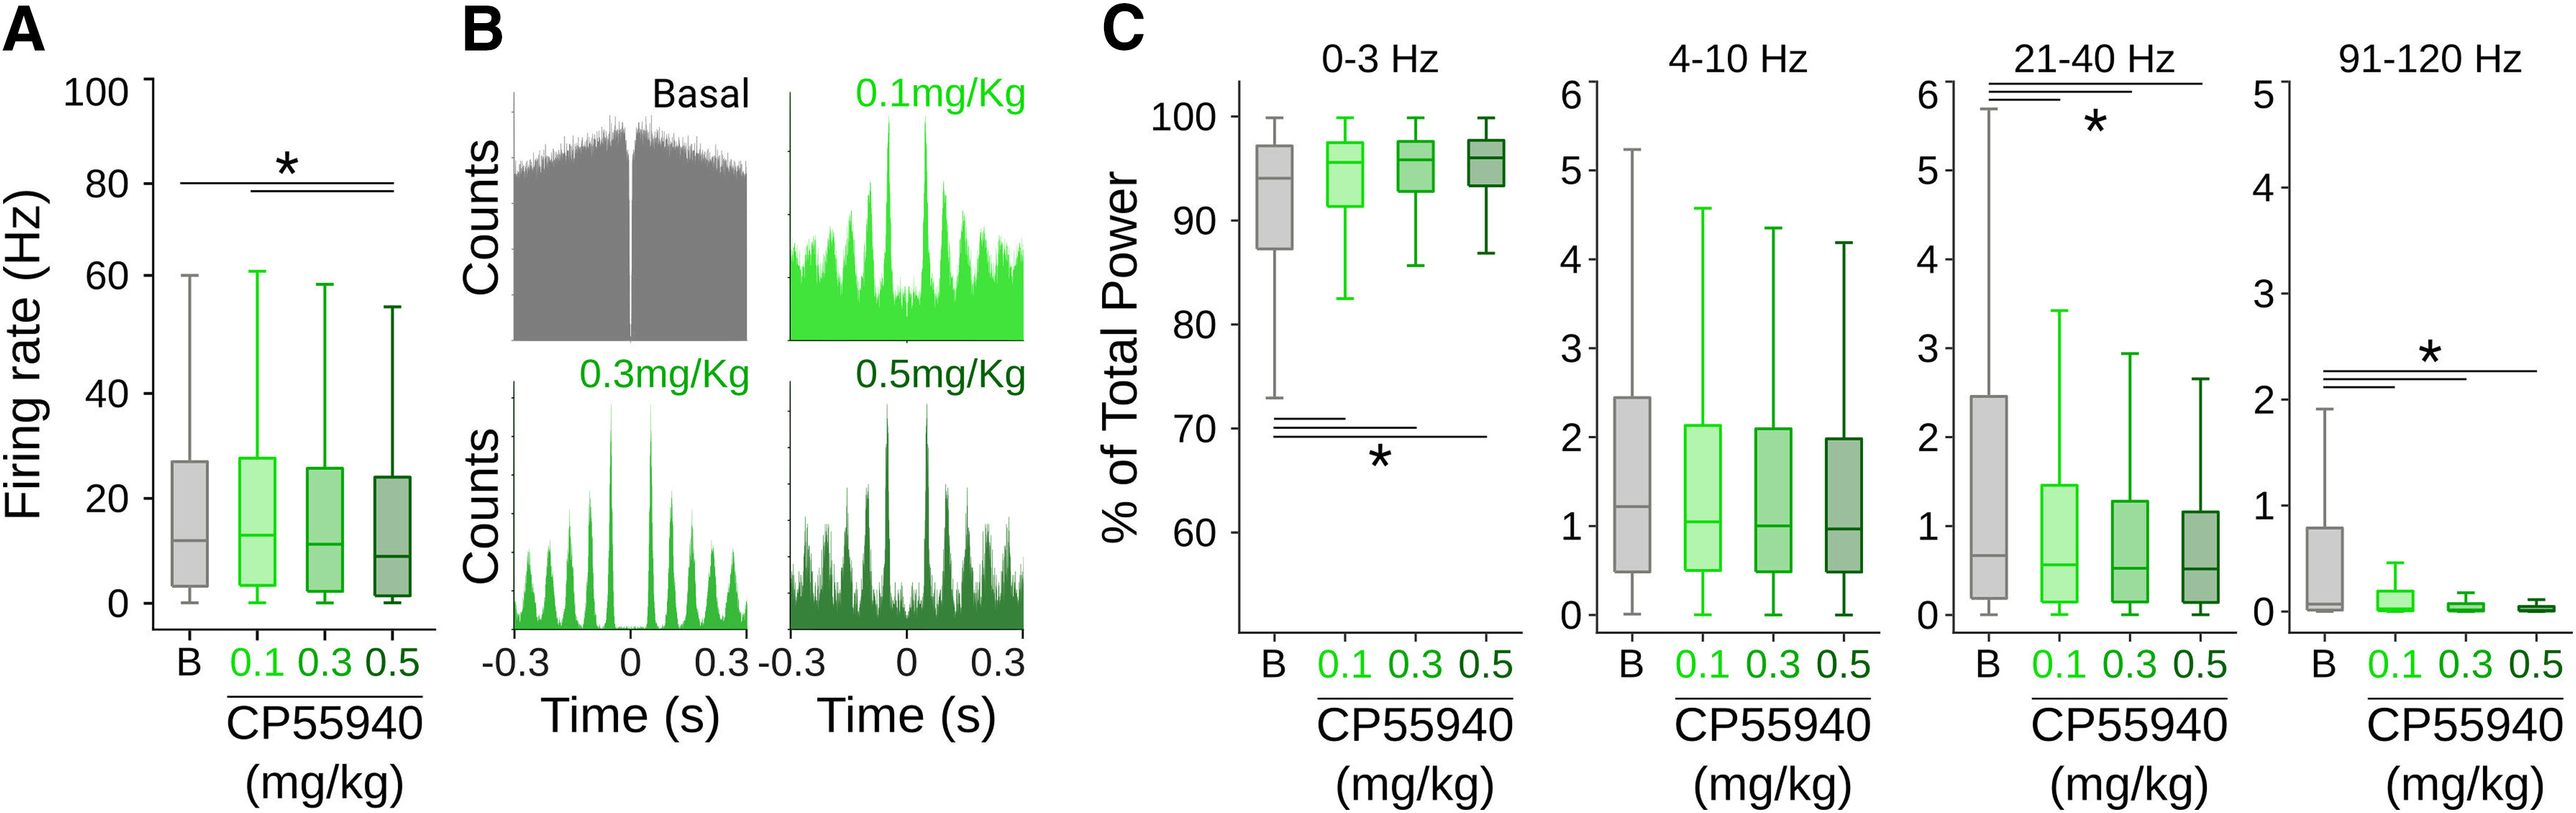
Cannabinergic effects on spontaneous SNr activity. A, Firing rates for all cells under different doses of CP55940. B, Representative autocorrelograms for one cell under different doses of CP55940. C, Relative contribution of specific band frequencies to the total local field potential (LFP) power under different doses of CP55940. Asterisks and lines indicate significant differences.
Figure 3.
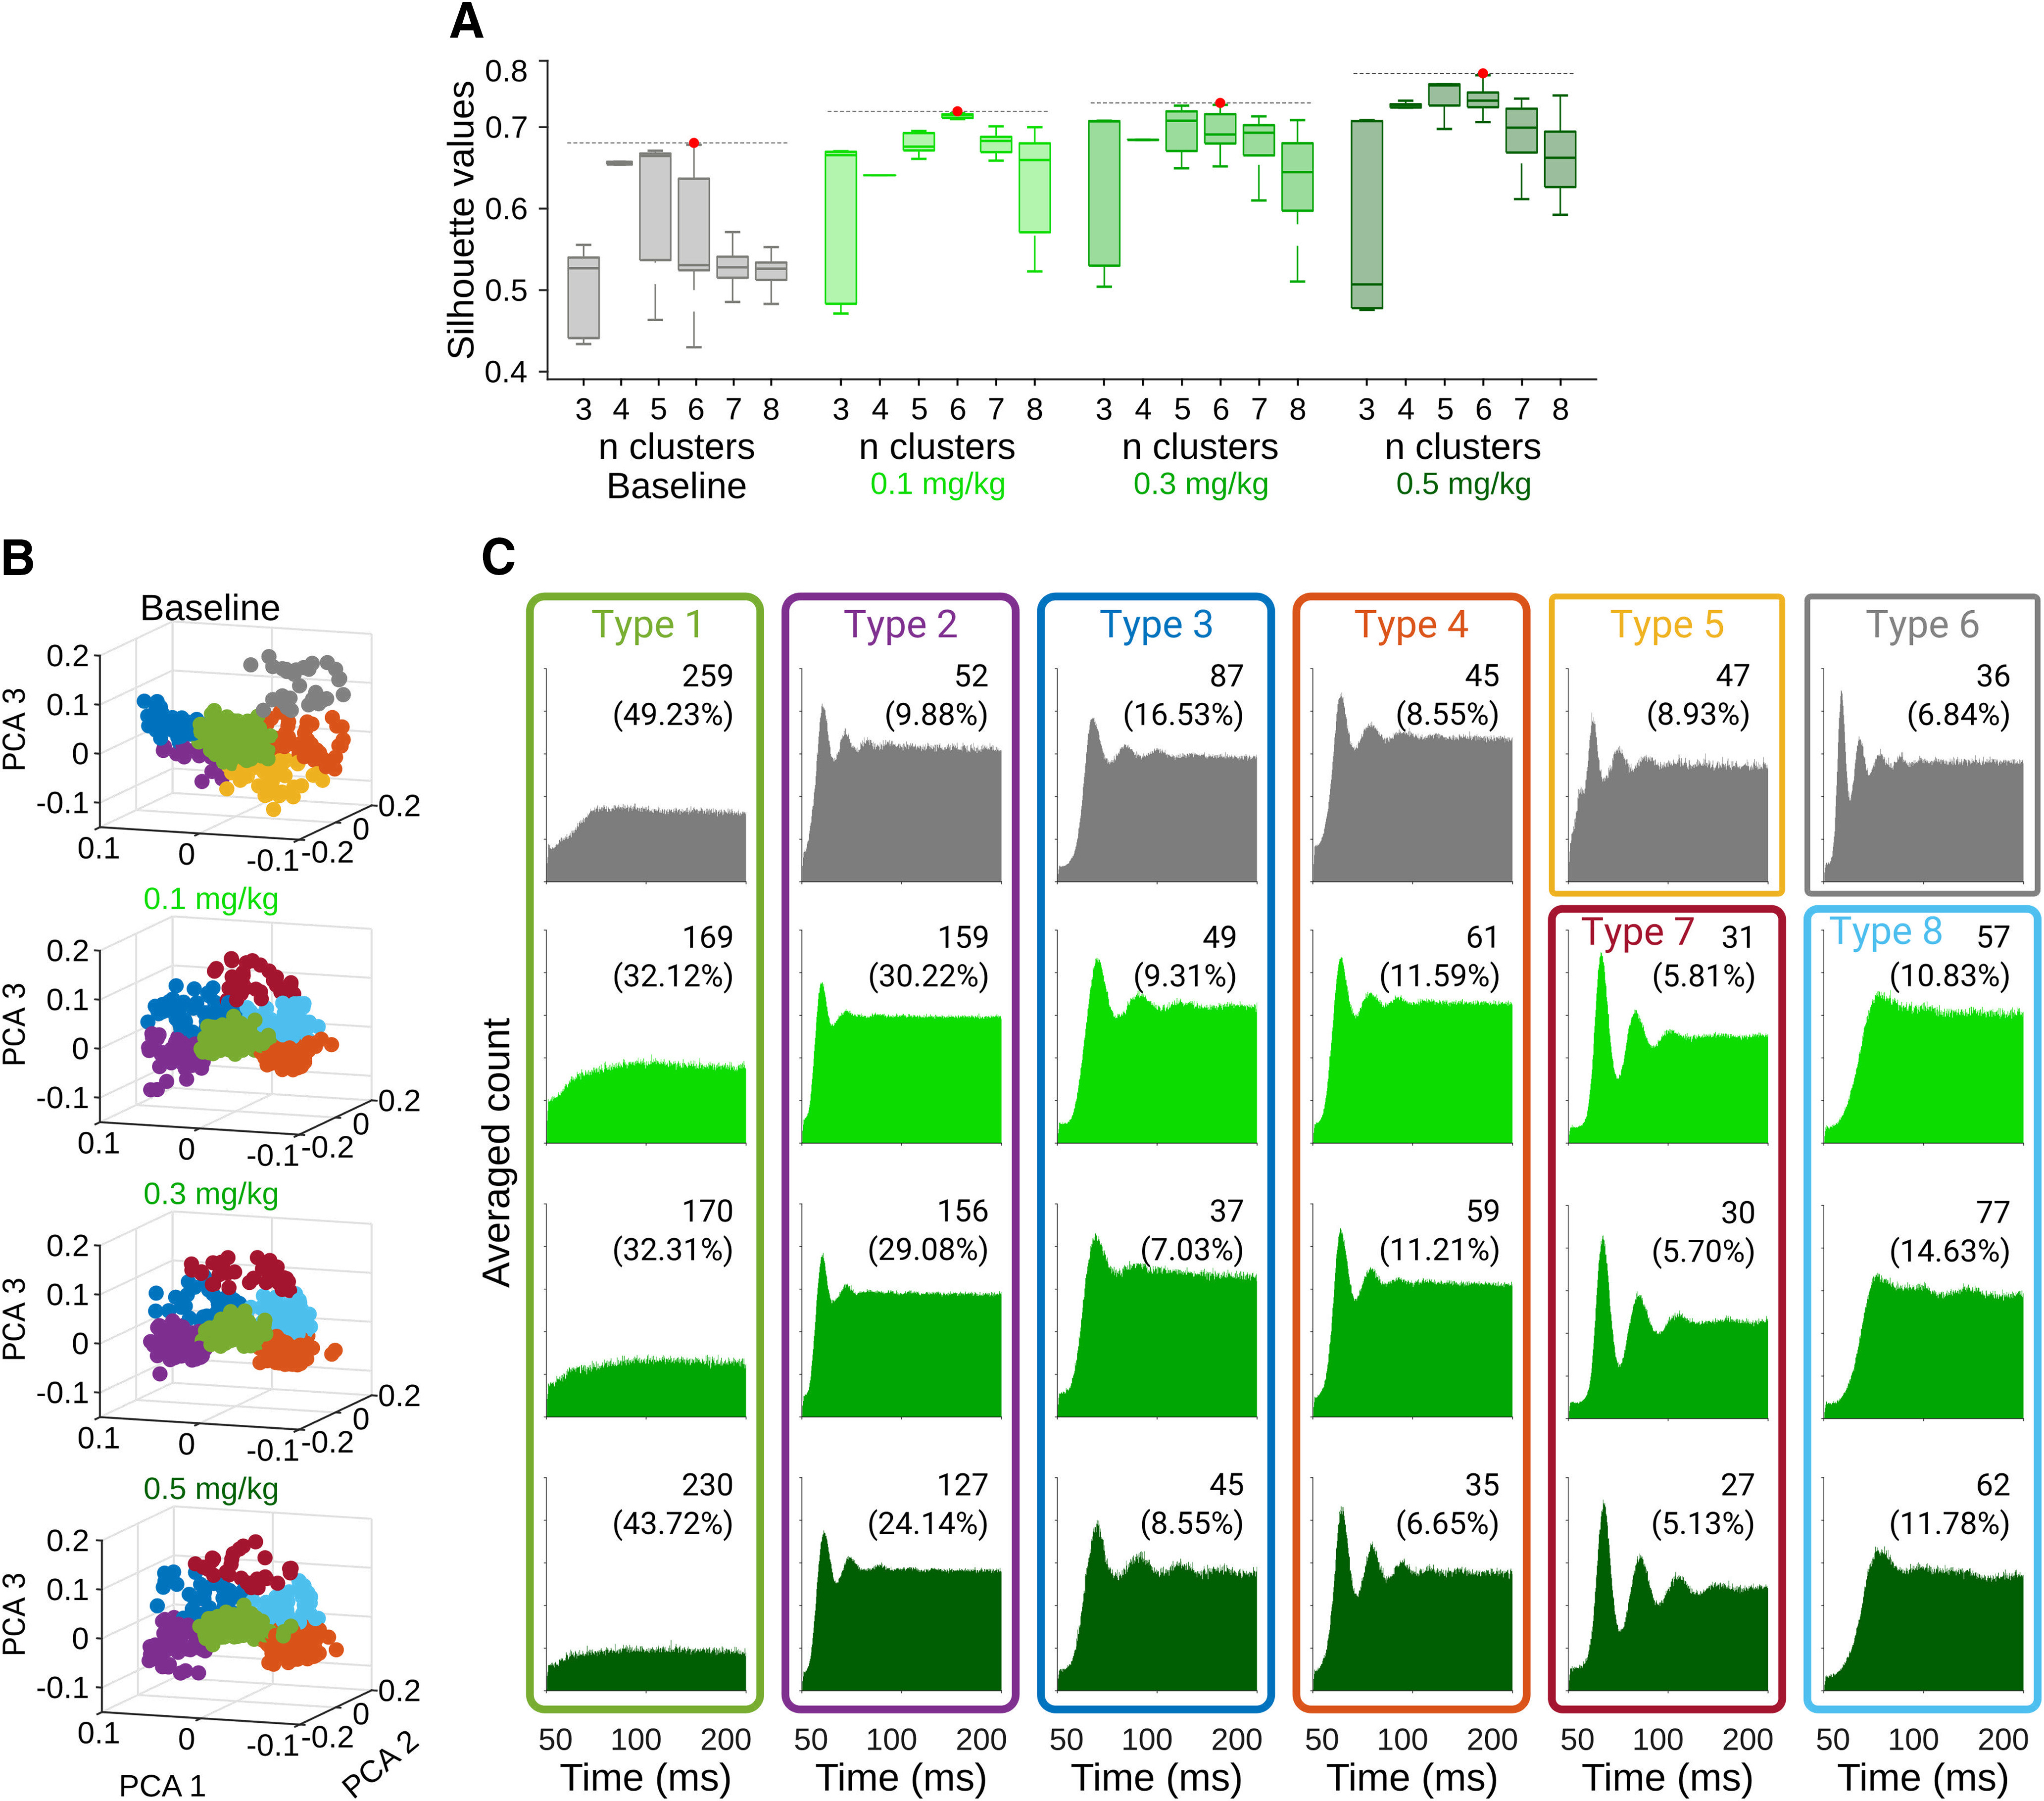
Cannabinergic effects on spontaneous SNr activity. A, Silhouette values for 1000 iterations in 3–8 k-means projections from the PCA on the autocorrelograms of the spiking activity for all cells recorded under different doses of CP55940. Red dots indicate the projection selected for display in B, C. B, PCA projections for six clusters (best projections, red dots in A) under different doses of CP55940. C, Average autocorrelograms for cells classified as part of specific clusters. Number and percentage of cells belonging to specific clusters (types) are displayed on top of each autocorrelogram.
Then, we investigated the effects of CP55940 on sensory-evoked responses and found a dose-dependent change in the population responses to somesthetic stimulations (Fig. 4A, top). The changes were characterized by a mild decrease in the amplitude of the excitatory component but a robust decrease in the inhibitory component of the evoked responses (Fig. 4A, bottom). To further characterize these changes, we first analyzed the latency of the excitatory and inhibitory components of the responses and observed no significant change induced by any dose of CP55940 (K–W X2 = 1.59, p = 0.66; Fig. 4B). Then, we estimated the average firing rate (Z-scored) for each cell during the 50 ms after the stimuli of each train and classified cells into groups based on their responses in the control condition (see Materials and Methods): cells that increased (excited cells; Fig. 4A, bottom, yellow code) and cells that decreased (inhibited cells; Fig. 4A, bottom, blue code) their average firing rates. We observed a significant dose-dependent decrease in the responses of the excited subpopulation. However, the responses did not disappear and most of these cells maintained their excitatory condition to the stimulation (K–W, X2 = 64.23, p < 0.001; B-test, B vs 0.1, p < 0.001; B vs 0.3, p < 0.001; B vs 0.5, p < 0.001; Fig. 4C, left). On the contrary, cells classified as inhibited suppressed their pauses in response to stimulations under CP55940 influence. At higher doses, there was a trend to shift from inhibitory to excitatory responses (K–W, X2 = 148, p < 0.001; B-test, B vs 0.1, p < 0.001; B vs 0.3, p < 0.001; B vs 0.5, p < 0.001; 0.1 vs 0.2, p < 0.001; 0.1 vs 0.3, p < 0.001; Fig. 4C, right). To further characterize the evoked responses, we used the same strategy as the one used in Figure 3 to identify firing patterns in the autocorrelograms, but this time we aimed to identify specific patterns of evoked activation (Fig. 4D,E). For each cell, we calculated the principal components in the averaged responses to the stimulation trains, projected the first three PCAs, applied k-means, and scored the projection with the silhouette method (1000 iterations). The best projections produced six clear patterns for the control condition (Fig. 4D) and three patterns for the cannabinoid condition (Fig. 4E). In both conditions, we observed the presence of a dominant pattern,but after cannabinoid administration, only three patterns remained, losing two patterns with predominantly inhibitory components (Fig. 4E–G). Then, we analyzed whether the cells expressing each of these evoked patterns would be associated with any particular autocorrelogram firing pattern (Fig. 3). The percentage of each type of autocorrelogram is expressed as bar plots on the right of each pattern of evoked activity (Fig. 4D,E). As expected, we observed that the autocorrelogram type 1, with the highest prevalence in all drug conditions, dominated all the evoked patterns of activation. To compare whether another type of autocorrelogram could be associated with a particular evoked pattern, we normalized the occurrence of the remaining patterns to the occurrence of the dominant pattern type 1. We did not find significant differences in the distributions of the autocorrelogram patterns (Fig. 4G).
Given the length of our recordings, a change in the amplitude of the excitatory or inhibitory components of the responses could also be explained by run-down/up effects and not necessarily by cannabinergic activation. To discard this possibility, we performed two type of experiments: First, we performed the same procedure, but instead of using three increasing doses of CP55940, we used three injections of vehicle (we recorded 58 cells from two animals), resulting in no significant changes in the amplitude of the evoked responses (Fig. 4H) nor in the evoked patterns or their distribution in the population of cells. Then, we aimed to block the effects of CP55940 (0.5 mg/kg) by the prior (15 min before) systemic administration of the CB1r antagonist AM251. We recorded 131 cells from seven animals; three and four rats received 1 and 3 mg/kg injections of AM251, respectively. Under the highest dose of AM251, CP55940 did not produce significant effects in the amplitude of the evoked responses (Fig. 4I) nor in the evoked patterns of activation or their distribution in the population of cells. Together, these results confirmed that the effects CP55940 were specifically related to CB1r activation.
CP55940 decreases direct pathway-associated inhibition
So far, our results show that, under cannabinoids, the balanced inhibition-excitation responses evoked by somesthetic stimulations changed into mainly excitatory responses. Since a major source of inhibitory inputs to the SNr are the medium spiny neurons from the direct pathway (MSNsD1; Fonnum et al., 1974; Di Chiara et al., 1980; Nagy and Fibiger, 1980; Smith and Bolam, 1989), it is possible that this pathway is more affected by cannabinoids. To test this possibility, we injected the virus rAAV5-Ef1-DIO-hchR2(H134R)-eYFP to express channelrhodopsin-2 (ChR2) in direct pathway neurons from transgenic rats, where Cre-recombinase is expressed under the promoter of D1 receptors (Pardo-Garcia et al., 2019). The virus was injected unilaterally (0.5–1 μl) in the DLS (Fig. 5A,B), and experiments were performed at least four weeks after injections, once the opsins exhibited significant expression levels (Fig. 5B,C). Silicon probe recordings in the SNr (Fig. 5A,C) were performed similarly to the previous experiments, except an optical fiber was fixed 200 μm above the site of infection to deliver optic stimulation to the MSNsD1 (460 nm; Fig. 5A). After the experiments concluded, every brain was processed for histologic confirmation of the infection (Fig. 5B) and recording (Fig. 5C) sites. We recorded 336 cells from 10 transgenic rats, and optic stimulation was delivered in trains with the same parameters as somesthetic stimulations (50 trains, five stimuli per train at 3.3 Hz; 10-ms stimulus). Direct pathway activation also evoked complex responses in SNr neurons characterized mainly by inhibitions, although a significant subpopulation of cells was also activated (Fig. 5D). Here the latencies of the excitatory responses were significantly higher than those evoked by somesthetic stimulations (K–W, X2 = 143.25, p < 0.001; B-test, B vs B, p < 0.001; 0.1 vs 0.1, p = 1.0; 0.3 vs 0.3, p < 0.001; 0.5 vs 0.5, p < 0.001) and were not affected by the systemic administrations of CP55940 (K–W, X2 = 143.26, p < 0.001; B-test, B vs 0.1, p = 1; B vs 0.3, p = 1; B vs 0.5, p = 1; Fig. 5E), suggesting that these excitations may be related to the intrinsic microcircuit dynamics previously reported for the SNr (Brown et al., 2014). As for somesthetic stimulation, we analyzed changes in spike rates calculated in the 50 ms after each stimulus in the presence of different doses of CP55940 (Fig. 5F). When we classified the cells as excited and inhibited by optic stimulation under control conditions, both inhibitory and excitatory responses were significantly diminished in a dose-dependent fashion (K–W, X2 = 42.063, p < 0.001; B-test, B vs 0.1, p < 0.001; B vs 0.3, p < 0.001; B vs 0.5, p < 0.001, right, K–W, X2 = 51.4, p < 0.001; B-test, B vs 0.1, p < 0.001; B vs 0.3, p < 0.001; B vs 0.5, p < 0.001; Fig. 5F, left). These effects were further confirmed when we identified three specific patterns of activation evoked by direct pathway stimulation (Fig. 5G). After cannabinergic activation, these patterns remained, but the amplitude of the inhibitory component of the responses was diminished (Fig. 5G,H). This set of data confirms that direct pathway projections to the SNr are significantly affected by systemic injections of CP55940.
Figure 5.

Cannabinergic effects on direct pathway activation. A, Schematic representation of the site of infection, stimulation, and recordings in the DLS and SNr. B, Representative histologic confirmation of the stimulation and infection site in the DLS (B) and recording site in the SNr (C). D, Averaged firing rates for cells recorded in the SNr expressed as Z-score (color coded) and sorted according to the time they reached the highest (bottom to top) or lowest (top to bottom) activity after optic stimulation of the DLS. Bottom traces represent averaged histograms of the population response latencies for all cells recorded (gray) or cells that increased (yellow) or decreased (blue) their firing rates after stimulations. Left and right panels represent population-evoked activity during control and the highest concentration of CP55940 administrations, respectively. E, Excitatory (top) and inhibitory (bottom) response latencies to optic (solid colors) and somesthetic (shaded colors) stimulations under different doses of CP55940 (color coded); asterisks indicate significant differences between pair of optic/somesthetic conditions. F, Average amplitude of excitatory and inhibitory populations evoked by optic stimulations under different doses of CP55940; values from the somesthetic stimulation experiments are plotted in gray; significant (asterisk) and non-significant (ns) differences are indicated by lines joining specific comparisons. G, Averaged evoked responses by optic, for cells classified as part of specific patterns during baseline (left, gray) and under the highest does of CP55940 (right, green). H, Distribution of specific patterns of activation in the population of cells (same color code as in G).
CP55940 has little effects on indirect pathway-associated activation
The somesthetic stimulation experiments (Fig. 4) indicated that the excitatory responses, potentially related to glutamatergic inputs from the indirect pathway, were less affected under CP55940. To evaluate this possibility, we injected the virus rAAV5-Camk2a-hchR2(H134R)-EYFP to express ChR2 in wild-type rats. Injections were performed unilaterally (∼0.5 μl) in the SthN, the main glutamatergic input to the SNr (Fig. 6A). Experiments were performed at least four weeks after injections. As in the previous cases, silicon probe recordings were performed in the SNr, except an optic fiber was fixed 200 μm above the site of infection to deliver optic stimulation directly to the SthN (Fig. 6A). After recordings, brains were processed for histologic confirmation of the infection and recording sites (Fig. 6B,C). We recorded 108 cells from five wild-type infected rats, and optic stimulations were delivered as in the previous experiment. Optic stimulation produced complex patterns of activation visible in the population responses (Fig. 6D). A subpopulation of cells presented prominent excitatory responses, and another subpopulation of cells presented marked transient inhibitions (Fig. 6D). As expected, the latencies for the excitatory and inhibitory responses were significantly shorter than for somesthetic stimulation experiments (K–W, X2 = 143.26, p < 0.001; B-test, B vs B, p < 0.001; 0.1 vs 0.1 p < 0.001; 0.3 vs 0.3 p < 0.001; 0.5 vs 0.5 p < 0.001) but were not affected by the different doses of CP55940 (K–W, X2 = 143.2598 p < 0.001, B-test, B vs 0.1, p = 1; B vs 0.3, p = 1; B vs 0.5, p = 1; Fig. 6E). It is important to note that the latency for the inhibitory responses was always longer than for the excitatory component, suggesting that this component depended on the excitatory component and not directly on the light stimulation. Then, we classified the cells as excited or inhibited depending on their responses to optic stimulation under control conditions. Here, the fast excitatory component evoked by SthN stimulation was not affected by CP55940 (K–W, X2 = 10.75 p = 0.0131; B-test, B vs 0.1, p = 0.0437; B vs 0.3, p = 0.020; B vs 0.5 p = 0.1636; Fig. 6F, left), whereas in the previous experiments, the inhibitory component of the response was significantly decreased (K–W, X2 = 11.9561 p = 0.0075; B-test, B vs 0.1, p = 0.9087; B vs 0.3, p = 0.1301; B vs 0.5 p = 0.0051; Fig. 6F, right). These results were also confirmed on analyzing the specific patterns evoked by the stimulation, as we identified four patterns in baseline conditions. Under cannabinoids, the prevalence and amplitude of excitatory components remained, whereas only one pattern with a marked inhibitory component was observed (Fig. 6G,H). These results confirm that, contrary to direct pathway projections, indirect pathway projections to the SNr were not significantly affected by cannabinergic activation. To further support this claim, we analyzed the latencies for the excitatory and inhibitory components of the responses in the PCA-based identified patterns for all experimental conditions. We observed that the shortest latencies for the excitatory and inhibitory components corresponded to patterns produced by optic stimulation of the indirect and direct pathways, respectively (Fig. 7A–C). Consistent with our previous results, inhibitory latencies associated with direct pathway stimulation became longer under cannabinergic activation (Fig. 7B), whereas excitatory latencies associated with indirect pathway stimulation remained without significant changes (Fig. 7C).
Figure 6.

Cannabinergic effects on indirect pathway activation. A, Schematic representation of the site of infection, stimulation, and recordings in the SthN and SNr. B, Representative histologic confirmation of the stimulation and infection site in the SthN (B) and recording site in the SNr (C). D, Averaged firing rates for cells recorded in SNr expressed as Z-score (color coded) and sorted according to the time they reached the highest (bottom to top) or lowest (top to bottom) activity after optic stimulations of the SthN. Bottom traces represent averaged histograms of the population response latencies for all cells recorded (gray) or cells that increased (yellow) or decreased (blue) their firing rates after stimulations. Left and right panels represent population-evoked activity during control and the highest concentration of CP55940 administrations, respectively. E, Excitatory (top) and inhibitory (bottom) response latencies to optic (solid colors) and somesthetic (shaded colors) stimulations under different doses of CP55940 (color coded); asterisks indicate significant differences between pair of optic/somesthetic conditions. F, Average amplitude of excitatory and inhibitory populations evoked by optic stimulations under different doses of CP55940; values from the somesthetic stimulation experiments are plotted in gray; significant (asterisk) and non-significant (ns) differences are indicated by lines joining specific comparisons. G, Averaged evoked responses by optic, for cells classified as part of specific patterns during baseline (left, gray) and under the highest does of CP55940 (right, green). Pattern number 5, highlighted in red, was not present during baseline conditions. H, Distribution of specific patterns of activation in the population of cells (same color code as in G).
Figure 7.

Latencies for the excitatory and inhibitory components of the evoked responses. Latencies evoked by somesthetic (A; K–W, X2 = 102.48, p < 0.001), direct pathway (B; K–W, X2 = 9.32, p = 0.09), or indirect pathway (C; K–W, X2 = 18.2, p = 0.01) stimulation. Latencies were calculated for the excitatory (indicated by “e”) or inhibitory (indicated by “i”) component of the responses, based on the pattern classification from Figures 4–6. Latencies were calculated for baseline (left, gray) and under the highest dose of CP55940 (right, green). Statistical differences (B-tests, p < 0.05) are indicated by lines for specific comparisons.
CP55940 impairs the kinematic properties of voluntary movements through CB1r activation in the SNr
Altogether, the previous results suggest that under the cannabinergic influence, sensory inputs to the BG would result in a net imbalance favoring indirect pathway activation of the SNr, increasing excitatory responses to sensory inputs (Miller and Walker, 1995). According to the GABAergic projections from the SNr to the motor thalamus (Gerfen et al., 1982; François et al., 2002), our results also suggest that the sensory-evoked imbalance would produce an increased “inhibitory tone” over motor thalamic nuclei and, perhaps, be a neural substrate of cannabinergic-related motor effects. To test this possibility, we developed a bilateral coordination behavioral protocol to monitor motor coordination and kinematic parameters of movement. In this task, rats are trained to vertically and simultaneously displace two levers (one with each forepaw) to obtain rewards (Fig. 8A; Movie 1). The bilateral coordinated movements are constrained by a spatial rule, a spatial threshold (displacements of at least 3 cm) and a temporal rule; both levers must be maintained at least 750 ms below the spatial threshold (Fig. 8A). Successfully coordinated movements are rewarded with a drop of water (∼80 μl/drop) delivered through a water port located 10 cm to the right of the set of levers and signaled by a green light located above the water port (Fig. 8A; Movie 1). The levers are coupled to voltage transducers, allowing us to precisely and continuously measure different parameters of movement over hundreds of sessions and thousands of trials (Fig. 8B,C). In our behavioral protocol, we evaluated the correlation between the movement of the left and right levers to obtain a general proxy of the interlimb coordination (Fig. 8D). We also measured the synchrony at the beginning of a movement, defined as the difference in time between the beginning of the movement of the left and right levers, from now on denominated “onset synchrony” (Fig. 8B,E). An efficient movement is also characterized by maintaining the levers below the spatial threshold only for the necessary time, e.g., 750 ms (end of movements). Hence, to evaluate how the animals finished bilateral movements, we measured the time that the levers remained under the spatial threshold after the reward was delivered (“overshoot”; Fig. 8B,F). In each trial, we also calculated the speed of movements and reported the averaged maximum speed of movement trajectories for each session (Fig. 8G). We also estimated the effort to obtain a single reward, defined as the amount of time each lever was pressed to obtain one drop of water (Fig. 8H). An efficient movement would require around 750 ms to obtain a single reward; animals with difficulties to maintain the position below the spatial threshold would increase this time. While in any given session animals perform around 250–300 trials in ∼60 min, we have observed that the animals are highly engaged in the task during the first 100–150 trials, which regularly occur one after the other, only pausing to move to the water port and consume the reward. After this period, animals make more pauses and wander around the box. For these reasons, the analysis during pharmacological manipulations was restricted to the first 100 trials of each session. As expected, at the beginning of training, animals performed uncoordinated left-right movement trajectories (Fig. 8B), with high onset synchrony and overshoot times. After long periods of training, the trajectories of the left and right levers overlapped in time and space, producing high interlimb correlation values (Fig. 8D) and short onset synchrony (Fig. 8E) and overshoot times (Fig. 8F). The speed of movement and the effort to obtain rewards remained relatively stable throughout the training (Fig. 8G,H). In Figure 8, we depict the learning curves of a representative animal (Fig. 8D–H, upper panels) and the median (25th and 75th percentiles) for the group of animals used in this study (n = 13; Fig. 8D–H, lower panels). For the cannabinoid administrations, animals were subjected to at least 100 sessions of training (>20,000 trials for each animal) before any pharmacological manipulation.
Figure 8.
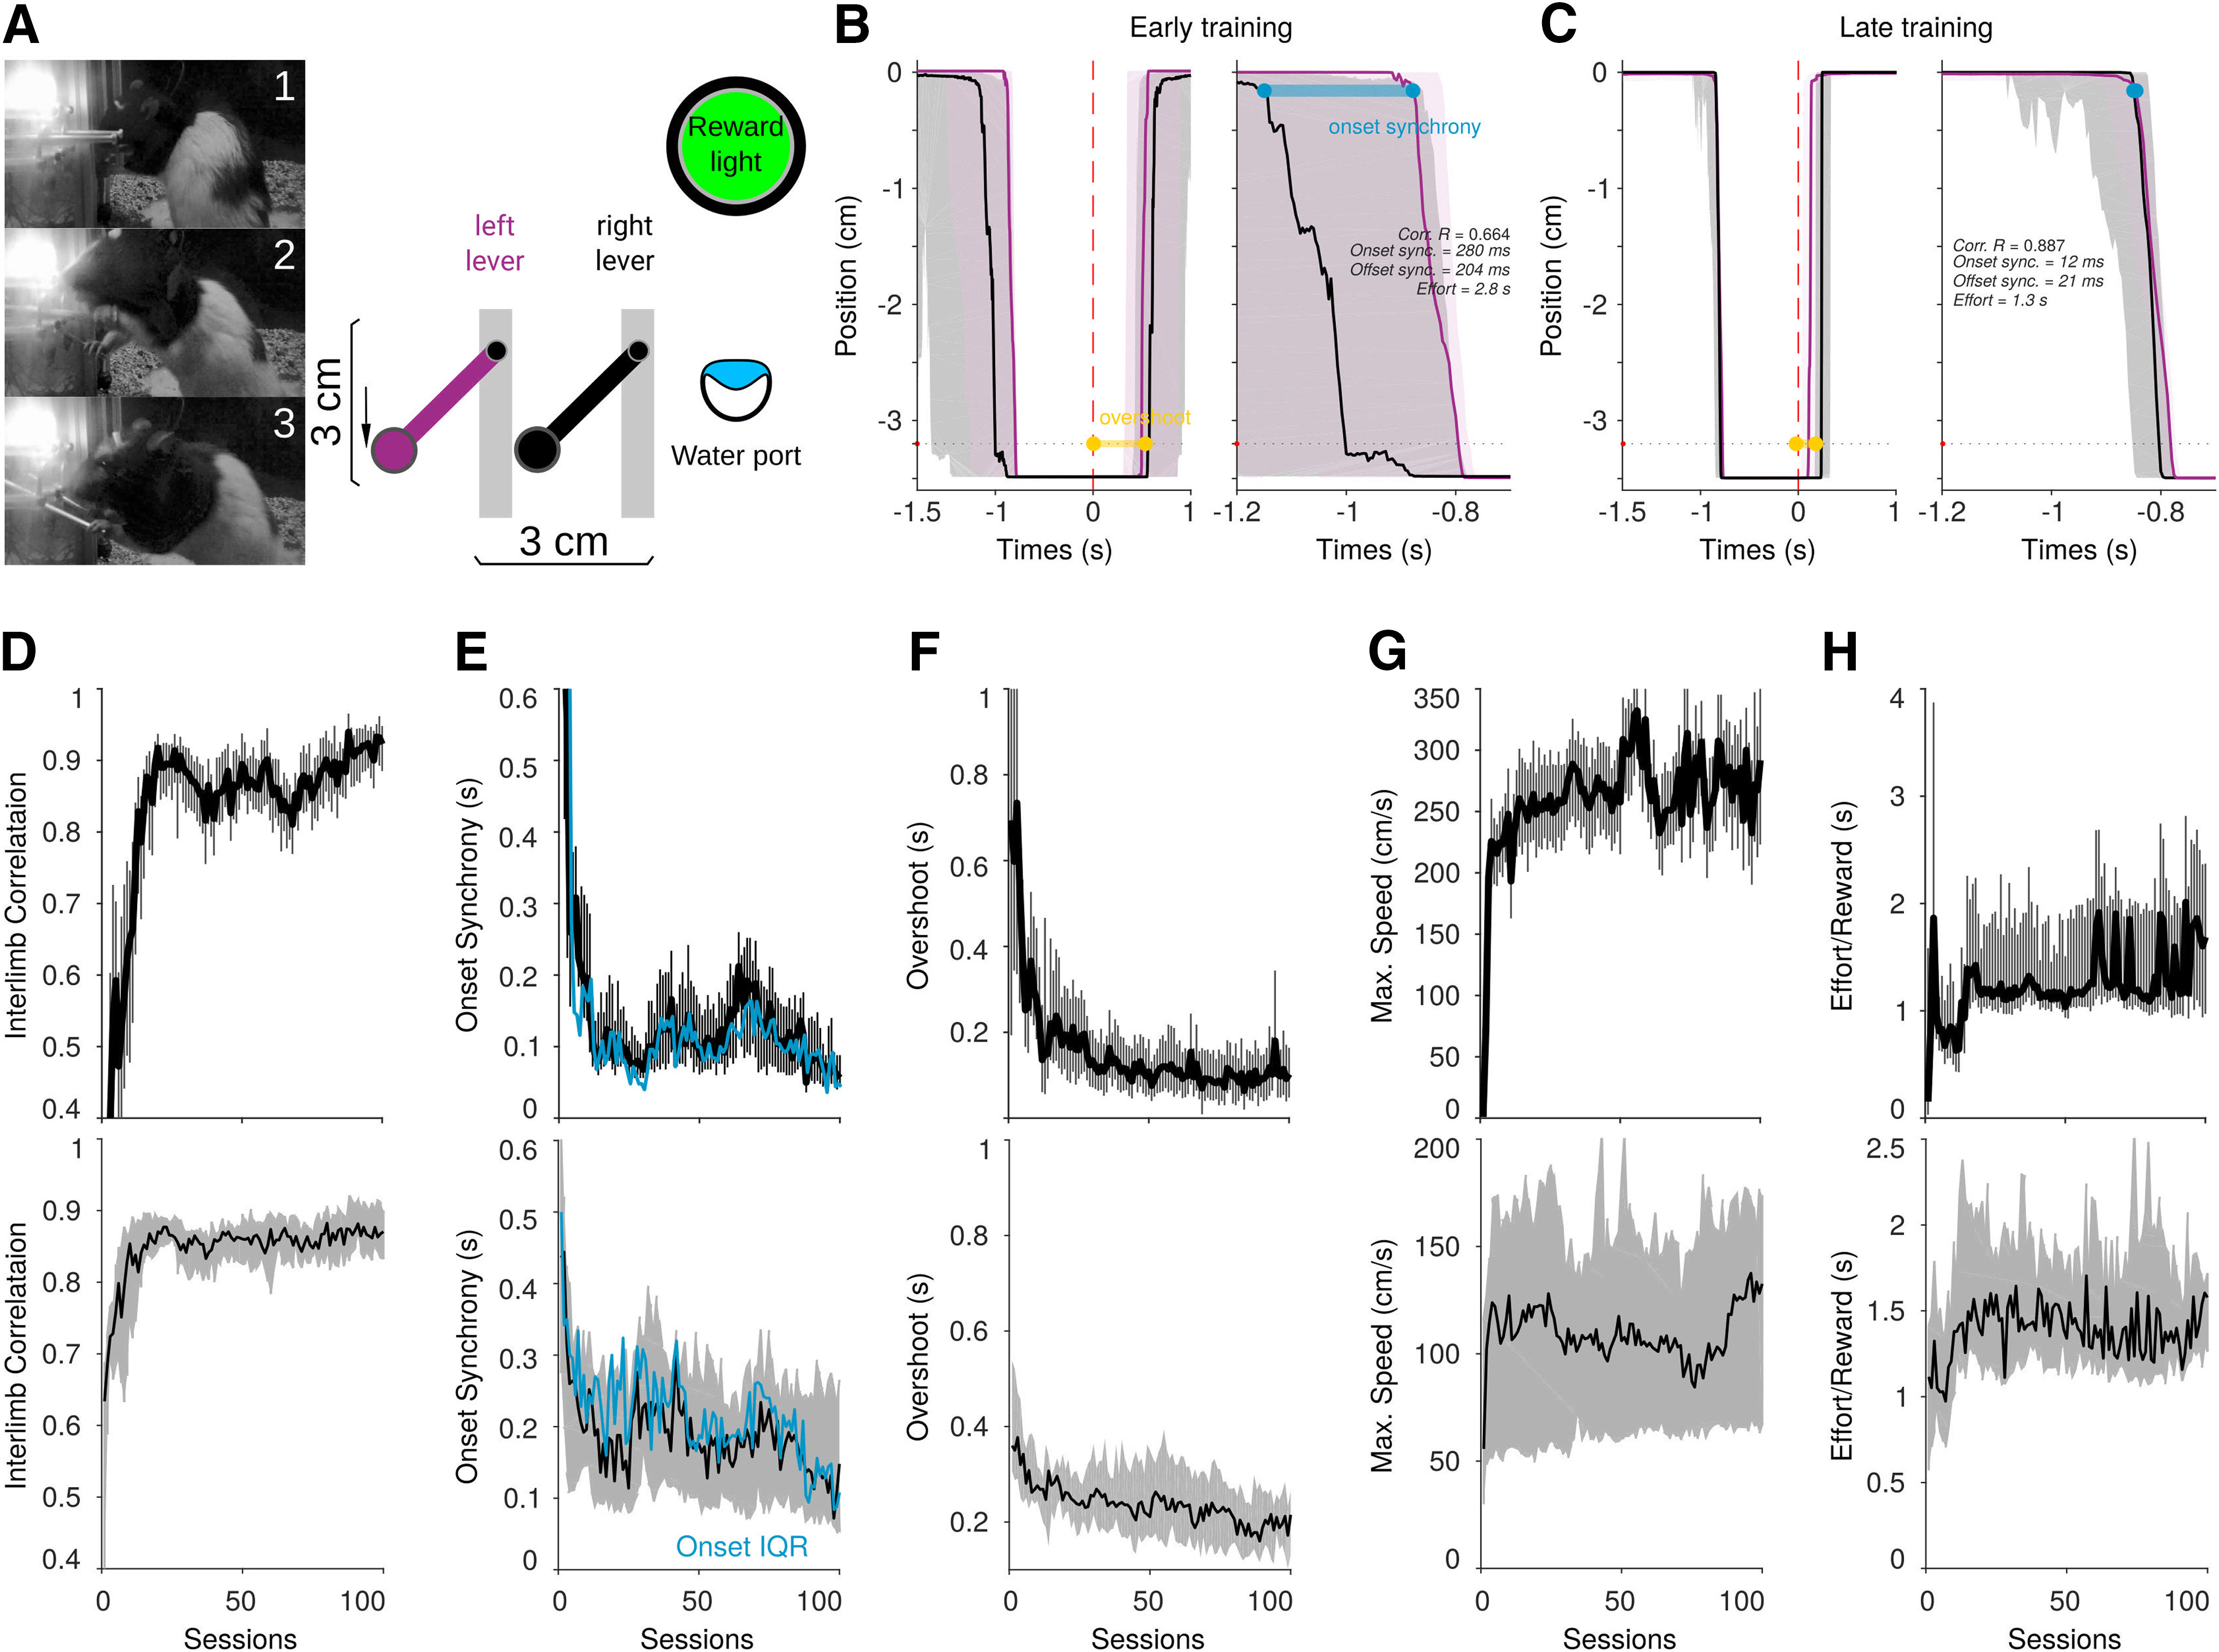
Bilateral coordination protocol for rats. A, Representative animal performing the task, (1) consuming the reward, (2) starting, and (3) finishing a bilateral movement. On the right, a schematic representation of the behavioral setup. B, C, Representative average trajectories (dashed area 25th and 75th percentiles) for the left (purple) and right (black) levers aligned to the moment when a reward is given (time 0, dotted red line), for a session in the early (B) and late (C) training. Left panels represent 2.5-s trajectories, and right panels are a close-up of 500 ms around the beginning of the coordinated movements. Onset synchrony and overshoot are indicated in blue and yellow. D–H, Learning curves for a representative animal (upper panels) and the group (n = 13; lower panels) are presented for interlimb correlations (D), onset synchrony (E), overshoot (F), maximum speed (G), and the effort to obtain single rewards (H).
Bilateral coordination task. Five randomly selected trials of a highly trained animal are presented. For better appreciation of the behavior, the first two trials are presented in slow motion.
After training, animals were subjected to systemic injections of CP55940 (0.1, 0.2, and 0.3 mg/kg). Each dose was given 15 min before the beginning of individual sessions (drug sessions). After drug sessions, animals had at least two drug-free sessions before being subjected to a new drug session. We conducted the following analyses in the first 100 trials of each session and compared at least two drug sessions (200 trials) for each dose and animal. In agreement with previous reports (Monory et al., 2007; Sales-Carbonell et al., 2013), systemic CP55940 administrations induced dose-dependent robust hypomobility, reflected in animals performing significantly fewer trials per session in a dose-dependent manner (control, median: 220 trials, range: 195–294 trials; CP55940 3 mg/kg, median: 125 trials, range: 96–208 trials). Even at the highest dose, animals still performed a considerable amount of trials (∼100 trials per session), indicating that the drugs did not affect the global representation of the task; i.e., animals did not forget what they needed to do to obtain a reward and remained motivated to perform, allowing us to analyze the effects of our treatments in purposeful movements. Under cannabinoids, forepaw movement trajectories became slower and more variable (Fig. 9A). Interestingly, interlimb correlations (K–W, X2 = 35.03, p < 0.001; Fig. 9B), onset synchrony (K–W, X2 = 2.17, p < 0.538; Fig. 9C) and the effort/reward (K–W, X2 = 4.2, p < 0.240; Fig. 9F) presented little or no significant changes compared with control sessions. These data indicate that even when movements were different, interlimb coordination remained stable under different cannabinergic concentrations. In contrast, the overshoot (K–W, X2 = 22.47, p = 0.001; B-test, 0 vs 0.1, p = 0.99; 0 vs 0.2, p = 0.012; 0 vs 0.3, p < 0.001; Fig. 9D) and movement speed (K–W, X2 = 20.35, p = 0.001; B-test, 0.0 vs 0.1, p = 0.98; 0 vs 0.2, p = 0.99; 0 vs 0.3, p = 0.003; Fig. 9E) significantly increased and decreased, respectively, in a dose-dependent fashion.
Figure 9.
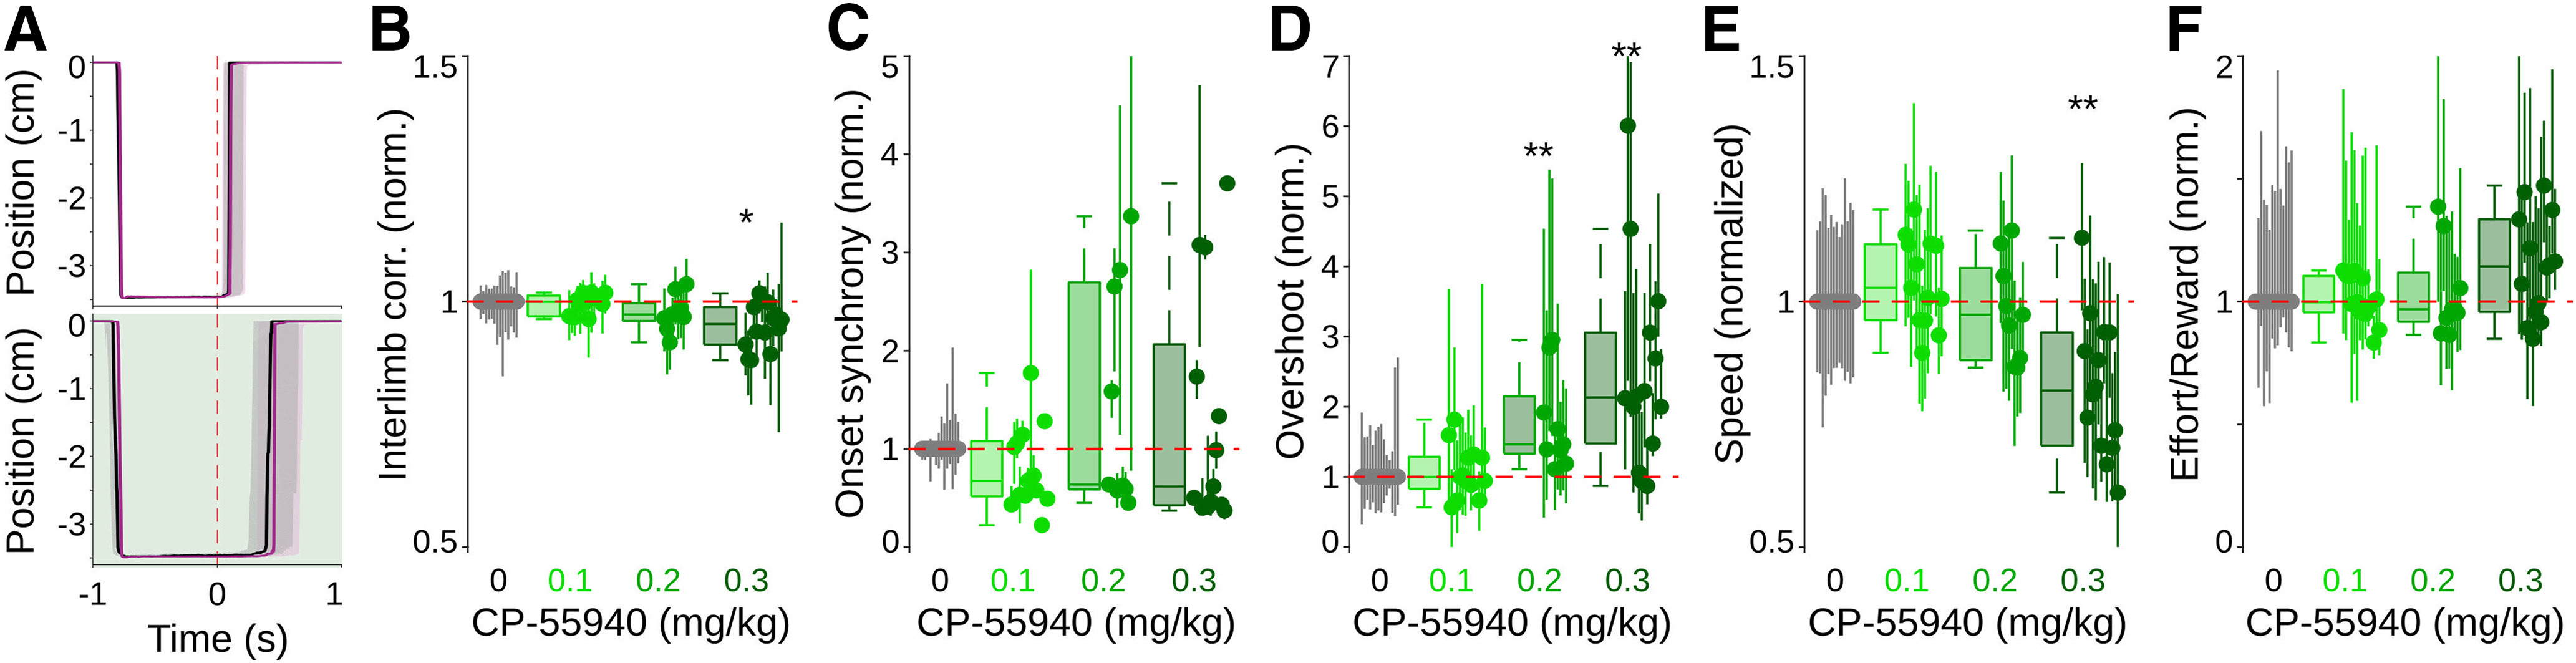
Cannabinergic effects on well-trained bilateral coordinated movements. A, Representative average trajectories (dashed area 25th and 75th percentiles) for the left (purple) and right (black) levers aligned to the moment when a reward is given (time 0, dotted red line), for a control session (upper panel) and a session when CP55940 (0.3 mg/kg) was systemically administered 15 min before behavioral evaluation. B–F, Normalized values for interlimb correlation (B), onset synchrony (C), overshoots (D), maximum speed (E), and effort to obtain single rewards (F), for control sessions and sessions where different doses of CP55940 were administered (color coded). Values were normalized to the median values of control sessions; box plots represent grouped data, and each animal is represented by dots (median) and vertical lines (25th and 75th percentiles). Asterisks indicate significant differences (*p < 0.05; **p < 001).
The behavioral data indicate that systemic administrations of cannabinoids affected primarily the kinematic of movements (speed and amplitude) but not the synchronized initiation and coordination of it. On the other hand, our electrophysiological experiments suggested that these behavioral effects may be related to a direct-indirect pathway imbalance in which information processing would lead to increased responses in the SNr. If this was the case, it would be possible to hypothesize that activating the CB1r directly in the SNr would be enough to produce similar motor effects and that blocking CB1r in the SNr would reverse the kinematic deficits induced by systemic administrations of CP55940. To test these hypotheses, we trained four more animals in the bilateral coordination task, and after at least 100 sessions of training, we implanted a bilateral cannula directed to the SNr (Fig. 10A). First, we tested whether injections of CP55940 directly into the SNr would be sufficient to produce similar motor effects to systemic administrations. Local injections of CP55940 into the SNr produced similar effects to those of systemic injections, with hypomobility reflected in fewer trials during drug sessions, particularly at the highest dose, 10 μg (K–W, X2 = 34.99, p < 0.001; B-test: 0.0 vs 0.2 μg, p = 0.45; 0.0 vs 1 μg, p = 0.97; 0.0 vs 5 μg, p = 0.54; 0.0 vs 10 μg, p = 0.01; 0.0 vs CPsyst, p = 0.04; 0.0 vs CPsyst+AM251local, p = 0.18; 0.0 vs AM251local, p = 0.97; Fig. 10B; CPsyst correspond to the systemic injection of 0.3 mg/kg of CP55940; AM251 local correspond to 10 μg of AM251 injected directly into the SNr). Intranigral injections did not produce significant changes in interlimb correlation (Fig. 10C; K–W, X2 = 12.54, p = 0.028; B-test: 0.0 vs 10 μg, p = 0.12; 0.0 vs CPsyst, p = 0.02; 0.0 vs CPsyst+AM251local, p = 0.16; 0.0 vs AM251local, p = 0.48; dose-dependent curve for local injections in Fig. 10H) or onset synchrony (Fig. 10D; K–W, X2 = 1.85, p = 0.86; dose-dependent curve for local injections in Fig. 10I). However, in the kinematic variables, we observed a significant decrease in speed (Fig. 10F; K–W, X2 = 13.98, p = 0.015; B-test: 0.0 vs 10 μg, p = 0.034; 0.0 vs CPsyst, p = 0.041; dose-dependent curve for local injections in Fig. 10K) and an increase in the amplitude of the movements, reflected in longer overshoots (Fig. 10E; K–W, X2 = 11.75, p = 0.039; B-test: 0.0 vs 10 μg, p = 0.010; 0.0 vs CPsyst, p = 0.027; 0.0 vs AM251local, p = 0.54; dose-dependent curve for local injections in Fig. 10J) and slightly higher but not significant effort values (Fig. 10G; K–W, X2 = 7.79, p = 0.16; dose-dependent curve for local injections in Fig. 10L) to obtain rewards. Then, to test whether motor effects induced by systemic injections could be prevented by blocking CB1r in the SNr, we systemically injected the highest dose of CP55940 and 15 min before 10 µg of the CB1r antagonist AM251 directly into the SNr. We found that the antagonist fully blocked the effects of systemic administrations of CP55940 (speed, B-test: 0.0 vs CPsyst+AM251local, p = 0.599; CPsyst vs CPsyst+AM251local, p = 0.045; overshoot, B-test: 0.0 vs CPsyst+AM251local, p = 0.098; CPsyst vs CPsyst+AM251local, p = 0.381; Fig. 10C–G, blue code), confirming that the slowness of movements produced by systemic administrations of cannabinoids is mainly related to the CB1r present in the SNr, most likely in the direct pathway terminals. The administration of AM251 alone did not produce significant behavioral changes (speed B-test: 0.0 vs AM251local, p = 0.16; overshoot B-test: AM251local, p = 0.54; Fig. 10C–G, orange code).
Figure 10.
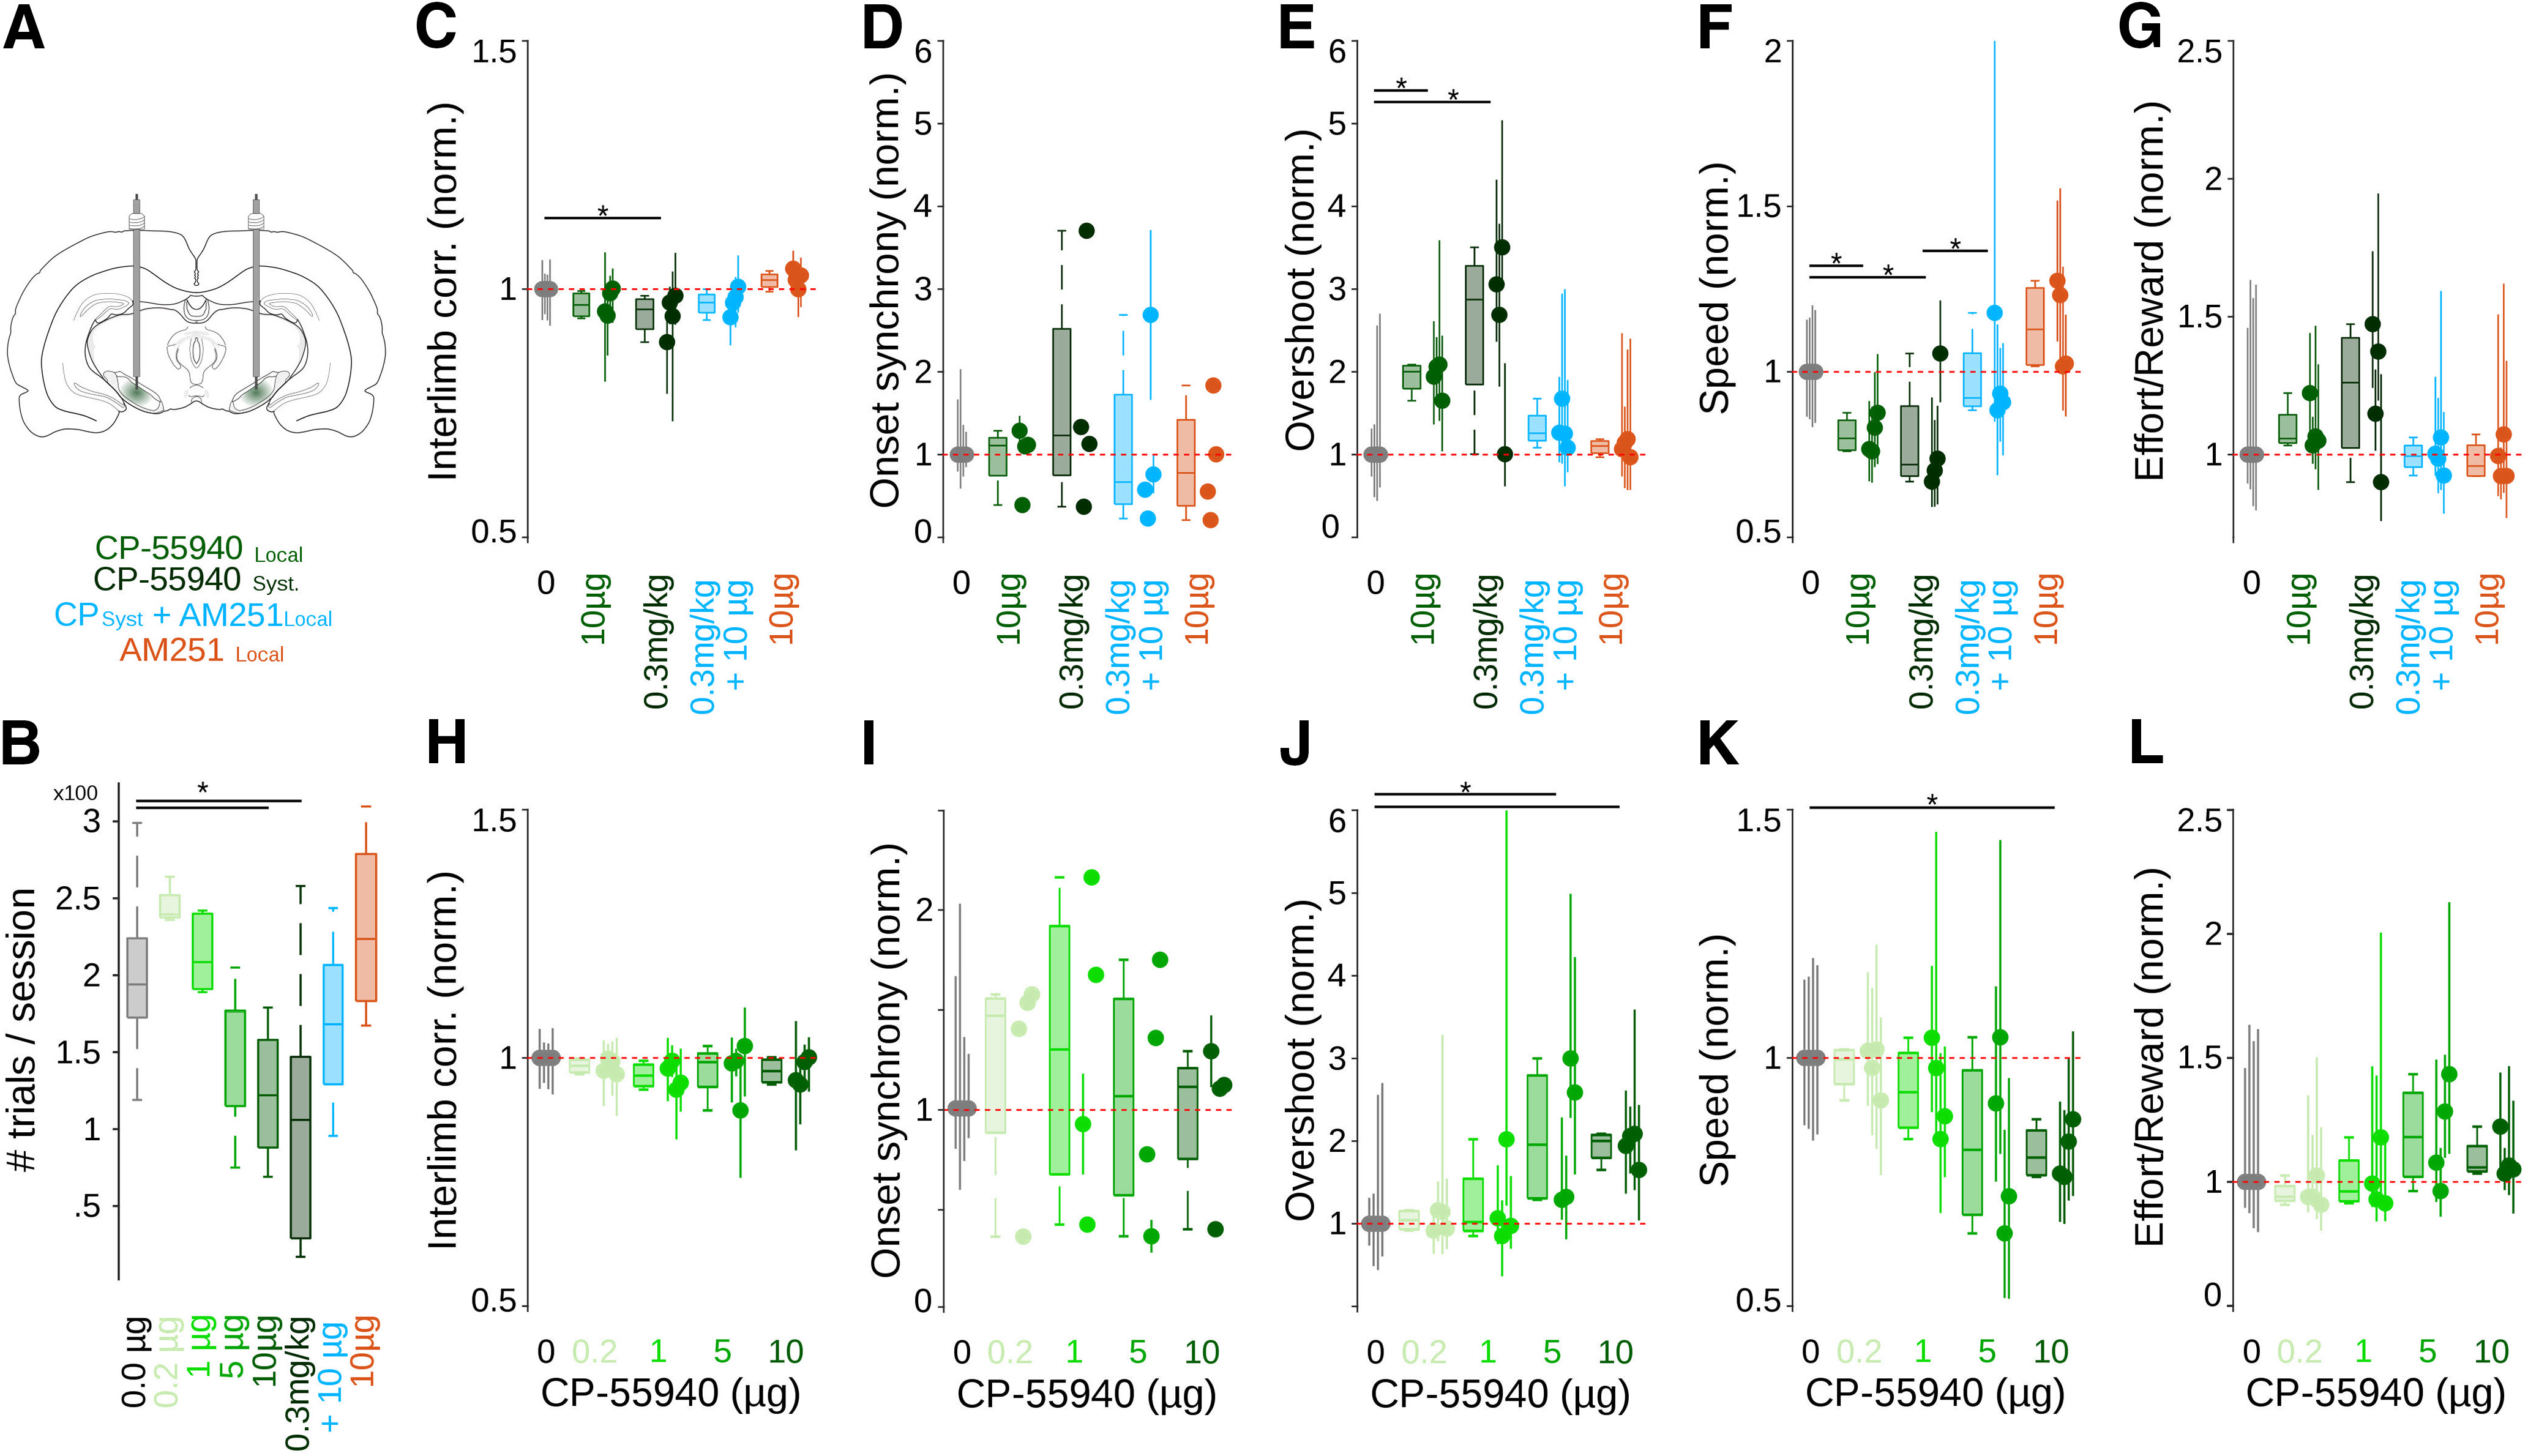
Effects of local administration of cannabinoids on well-trained bilateral coordinated movements. A, Schematic representation of injection sites in the SNr. B, Number of trials per session under different doses of CP55940, AM251, or their combination directly administered into the SNr. C–G, Normalized values for interlimb correlation (B), onset synchrony (C), overshoots (D), maximum speed (E), and effort to obtain single rewards (F), for control sessions (gray) and sessions where different doses of CP55940 and/or AM251 were administered systemically or locally into the SNr (color coded as in A). Dose-dependent curve for local administrations of CP55940, for interlimb correlation (H; K–W, X2 = 6.06, p = 0.19), onset synchrony (I; K–W, X2 = 1.17, p = 0.88), overshoots (J; K–W, X2 = 11.69, p = 0.01; B-test: *p < 0.05), maximum speed (K; K–W, X2 = 10.21, p = 0.04; B-test: *p < 0.05), and effort to obtain single rewards (L; K–W, X2 = 9.14, p = 0.06), for control sessions (gray) and sessions where different doses of CP55940 (green coded) were administered locally into the SNr. Values were normalized to the median values of control sessions; box plots represent grouped data, and each animal is represented by dots (median) and vertical lines (25th and 75th percentiles).
Discussion
Given the wide distribution of the CB1r in almost the entire nervous system (Tsou et al., 1998; Marsicano and Lutz, 1999; Egertovà and Elphick, 2000), it has been difficult to determine whether the behavioral effects associated with systemic administration of cannabinergic compounds are related to the modulation of particular brain regions or systems (Busquets-Garcia et al., 2015). In the case of motor effects, this has been complicated for two reasons. First, the CB1r is located in multiple synapses of the cortical-BG loops. Second, we still do not fully understand the relationship of each of these nuclei with specific components of movements. For example, it is unclear how the orchestrated function the BG is implicated in the composition of movements, such as movement initiation, maintenance, or termination; or movement speed, amplitude, or timing (Dudman and Krakauer, 2016; Robbe, 2018). In this study, we addressed these issues using a strategy that combined in vivo high-density electrophysiological recordings, optogenetic and pharmacological manipulations, and an ad hoc behavioral protocol in which multiple components of movements can be independently monitored. We found that somesthetic processing in urethanized animals results in a complex population response in the SNr composed of activations and inactivations potentially related to the activation of the direct and indirect pathways (Kolomiets et al., 2003; Freeze et al., 2013; Brown et al., 2014; Antonazzo et al., 2019). We showed that systemic administration of CP55940 favored the excitatory component of the response, potentially related to indirect pathway representations in the SNr. Behaviorally, cannabinergic activation resulted in robust speed and amplitude of movement impairments in a dose-dependent manner. Importantly, these effects were completely blocked by the intranigral application of the CB1r antagonist AM251.
Previous literature indicates that the CB1r in direct pathway cells is responsible for hypersynchronous thalamocortical oscillations (Sales-Carbonell et al., 2013), a potential mechanism behind altered cognitive states (Goodman and Packard, 2015) and epileptic processes (Marsicano and Lutz, 1999) related to cannabinoid consumption. In this study, we were interested in understanding how cannabinergic modulation influences the general processing of information in the SNr. Similar to the hippocampus (Robbe et al., 2006) and prefrontal cortex (Kucewicz et al., 2011), cannabinergic activation did not produce changes in the general averaged firing rates of SNr neurons (Fig. 2A). Nevertheless, when analyzing at the single cell level, we identified subpopulations that significantly increased and decreased their firing activity on cannabinergic activation. We also found that many cells changed their spontaneous firing patterns (Fig. 3), suggesting that these patterns are sensitive to presynaptic modulation and, in particular, to reduced inhibitory drive (Ibáñez-Sandoval et al., 2007). In our anesthetized preparation, direct pathway activation produced inhibitory and excitatory sequences in the SNr comparable to those reported in similar experiments in anesthetized and behaving rodents (Kolomiets et al., 2003; Freeze et al., 2013). Interestingly, the activations were characterized by longer latencies than those evoked by somesthetic stimulations (Fig. 5E), and most importantly, were significantly reduced by cannabinoids, suggesting that these activations were dependent on SNr (Brown et al., 2014) or striatal (Dray et al., 1976; Chevalier et al., 1985; Deniau and Chevalier, 1985) microcircuit dynamics evoked by the activation of the MSNsD1. This evidence also confirms the notion that inputs to the BG, even if targeting only one pathway, produce a general pattern of alternating excitations and inhibitions (Fig. 5; Kolomiets et al., 2003; Freeze et al., 2013; Brown et al., 2014). In our preparation, somesthetic stimulations potentially activating both pathways (Coffey et al., 2017) also produced inhibitory/excitatory patterns in the SNr (Fig. 1), similar to those previously described, but evoked by electrical stimulation of motor and premotor cortices (Antonazzo et al., 2019) or electrical and chemical activation of the striatum (Dray et al., 1976; Chevalier et al., 1985; Deniau and Chevalier, 1985). Interestingly, Antonazzo et al. (2019) reported a key component arising from the hyperdirect pathway. In our preparation, this component is most likely diminished because the stimulations primarily activated sensory pathways (Kolomiets et al., 2003; Hidalgo-Balbuena et al., 2019). Importantly, in both studies the cannabinergic activation produced similar effects; that is, an unbalanced activation characterized by a marked depression in the inhibitory component of the responses, potentially related to the direct pathway, with relatively minor effects on the excitatory component, potentially related to the indirect pathway.
What would be the behavioral consequence of such unbalanced activation? The role of the cannabinergic system in the BG and associated behavior has been primarily focused on the dorsal striatum (Lovinger and Mathur, 2012) and cognitive functions (Rueda-Orozco et al., 2008a,b; Goodman and Packard, 2015), making it difficult to directly hypothesize whether particular neural patterns are related to particular behaviors. Surprisingly, despite the paramount role of the SNr in motor functions (Hikosaka et al., 2019) and its highest CB1r content (Mátyás et al., 2006), the effects of nigral CB1r activations in motor function are still largely unknown. A previous report in which the CB1r was genetically deleted from specific groups of neurons (Monory et al., 2007) suggested that the motor effects induced by systemic administrations of Δ9-tetrahydrocannabinol were related to the CB1r present in glutamatergic cells and virtually independent from neurons expressing both the CB1r and the dopaminergic receptor 1, including the direct pathway cells. These data contrast with other reports in which systemic injections of cannabinoids produced clear changes in the spiking activity of multiple nuclei of the BG including the SNr (Shi et al., 2005). They also contrast with experiments showing that local injections of CP55940 into the SNr produced evident motor effects (Sañudo-Peña et al., 1996). The source of confusion may arise from the fact that behavioral effects were estimated through general parameters; for example, a decrease in movement in the open field test may be related to both motor and motivational effects.
In our data, systemic injections of CP55940 resulted in general hypomobility, reflected in a decrease in the number of trials; however, because of water restriction, our animals maintained enough motivation to perform goal-directed movements. Under these conditions, the CB1r antagonist AM251 directly infused into the SNr was sufficient to revert all motor effects of systemic injections of CP55940 (Fig. 10). These data are consistent with previous results indicating that cannabinergic effects may also be modulated differentially depending on the general behavioral state (Shi et al., 2005). In our experiments, animals were implicated in the execution of long-trained movement to obtain a reward. This strategy revealed a specific behavioral motor outcome characterized by slower and longer movements but sparing bilateral coordination.
The strategy of targeting the output nuclei of the BG suggests important consequences. First, the general recall of highly automatized behavior was not impaired by large doses of the systemic cannabinergic agonist, i.e., animals did not forget the basic rule of the task and were not affected in bilateral coordination parameters (Figs. 9B,C, 10C,D). Second, the effects were specific to the kinematic parameters of movement execution, i.e., the amplitude of movements increased while the speed decreased (Figs. 9D,E, 10E,F). According to the “classical” view of the functionality of the BG (Redgrave et al., 2010), by affecting the integrity of these circuits, for example, by manipulating the output nuclei, one could expect impairments in the initiation of actions (Albin et al., 1989). Nevertheless, this was not the case in our data; instead, we found that local administrations of cannabinergic compounds in the SNr mainly affected kinematic parameters and not the initiation or coordination of movements. Our data are consistent with earlier reports in primates where muscimol was injected directly into the output nucleus of the BG during the execution of a well-learned motor sequence (Desmurget and Turner, 2010). The authors found major impairments in kinematic parameters of execution but no evidence of impairment in the sequential component of the execution. On the other hand, our experiments point at the direct pathway as importantly related to cannabinergic motor effects and also suggest that this pathway may be crucial in the control of speed and kinematics (Bartholomew et al., 2016; Kim et al., 2019). Our results support recent findings that one of the main functions of the BG is to encode and modulate kinematic parameters of movements (Turner and Desmurget, 2010; Barter et al., 2015; Panigrahi et al., 2015; Rueda-Orozco and Robbe, 2015; Barbera et al., 2016; Bartholomew et al., 2016; Dudman and Krakauer, 2016). Altogether, our data suggest a mechanism underlying the motor effects related to cannabinergic activation and highlight the importance of fully understanding the effects of cannabinergic activations on particular synapses of specific systems (Busquets-Garcia et al., 2015). In this context, designing novel experiments could elucidate the role of the cannabinergic system in both direct and indirect pathways of the BG and help to tackle specific symptoms in motor-related diseases such as Parkinson's. (Fernández-Ruiz et al., 2011; Buhmann et al., 2019).
Footnotes
A.S.B.-C. is a Master's student supported by the Consejo Nacional de Ciencia y Tecnología (CONACyT) Fellowship 629793. A.K.P.-F. is a PhD student in the Programa de Doctorado en Ciencias Biomédicas and is supported by the CONACyT-Mexico Fellowship 463747. This work was funded by Programa de Apoyo a Proyectos de Investigación e Inovación Tecnológica, Uiversidad Nacional Autónoma de México, Grants IA201018 and IA201020 (to P.E.R.-O.) and by the CONACyT Grant FDC_1702 (to P.E.R.-O.).
We thank Dr. Ana Inácio, Dr. Fernando Peña-Ortega and Dr. Edgar Soria-Gomez for critically reading and discussing this MS. The authors thank all the members of Laboratory A-02 from the Institute of Neurobiology, UNAM for their support; Cuautli Pacheco for invaluable support in animal maintenance and care and in histology; Drive Oscar Prospéro for generous donations; Drive Siddhartha Mondragón for support in microscopy; Ericka de los Rios Arellano, Nydia Hernández, and Martín García for assistance in histology and animal care; Anaid Antaramian and Adriana González from Unidad de Proteogenómica, INB; Jessica Gonzalez-Norris for proofreading.
The authors declare no competing financial interests.
References
- Aceves JJ, Rueda-Orozco PE, Hernandez-Martinez R, Galarraga E, Bargas J (2011) Bidirectional plasticity in striatonigral synapses: a switch to balance direct and indirect basal ganglia pathways. Learn Mem 18:764–773. [DOI] [PubMed] [Google Scholar]
- Albin RL, Young AB, Penney JB (1989) The functional anatomy of basal ganglia disorders. Trends Neurosci 12:366–375. 10.1016/0166-2236(89)90074-X [DOI] [PubMed] [Google Scholar]
- Antonazzo M, Gutierrez-Ceballos A, Bustinza I, Ugedo L, Morera-Herreras T (2019) Cannabinoids differentially modulate cortical information transmission through the sensorimotor or medial prefrontal basal ganglia circuits. Br J Pharmacol 176:1156–1169. 10.1111/bph.14613 [DOI] [PMC free article] [PubMed] [Google Scholar]
- Barbera G, Liang B, Zhang L, Gerfen CR, Culurciello E, Chen R, Li Y, Lin DT (2016) Spatially compact neural clusters in the dorsal striatum encode locomotion relevant information. Neuron 92:202–213. 10.1016/j.neuron.2016.08.037 [DOI] [PMC free article] [PubMed] [Google Scholar]
- Barter JW, Li S, Sukharnikova T, Rossi MA, Bartholomew RA, Yin HH (2015) Basal ganglia outputs map instantaneous position coordinates during behavior. J Neurosci 35:2703–2716. 10.1523/JNEUROSCI.3245-14.2015 [DOI] [PMC free article] [PubMed] [Google Scholar]
- Bartholomew RA, Li H, Gaidis EJ, Stackmann M, Shoemaker CT, Rossi MA, Yin HH (2016) Striatonigral control of movement velocity in mice. Eur J Neurosci 43:1097–1110. 10.1111/ejn.13187 [DOI] [PubMed] [Google Scholar]
- Bermudez Contreras EJ, Gomez Palacio Schjetnan A, Muhammad A, Bartho P, McNaughton BL, Kolb B, Gruber AJ, Luczak A (2013) Formation and reverberation of sequential neural activity patterns evoked by sensory stimulation are enhanced during cortical desynchronization. Neuron 79:555–566. 10.1016/j.neuron.2013.06.013 [DOI] [PubMed] [Google Scholar]
- Brown J, Pan W-X, Dudman JT (2014) The inhibitory microcircuit of the substantia nigra provides feedback gain control of the basal ganglia output. Elife 3:e02397 10.7554/eLife.02397 [DOI] [PMC free article] [PubMed] [Google Scholar]
- Buhmann C, Mainka T, Ebersbach G, Gandor F (2019) Evidence for the use of cannabinoids in Parkinson's disease. J Neural Transm (Vienna) 126:913–924. 10.1007/s00702-019-02018-8 [DOI] [PubMed] [Google Scholar]
- Busquets-Garcia A, Desprez T, Metna-Laurent M, Bellocchio L, Marsicano G, Soria-Gomez E (2015) Dissecting the cannabinergic control of behavior: the where matters. BioEssays 37:1215–1225. 10.1002/bies.201500046 [DOI] [PubMed] [Google Scholar]
- Chevalier G, Vacher S, Deniau JM, Desban M (1985) Disinhibition as a basic process in the expression of striatal functions. I. The striato-nigral influence on tecto-spinal/tecto-diencephalic neurons. Brain Res 334:215–226. 10.1016/0006-8993(85)90213-6 [DOI] [PubMed] [Google Scholar]
- Coffey KR, Nader M, Bawa J, West MO (2017) Homogeneous processing in the striatal direct and indirect pathways: single body part sensitive type IIb neurons may express either dopamine receptor D1 or D2. Eur J Neurosci 46:2380–2391. 10.1111/ejn.13690 [DOI] [PMC free article] [PubMed] [Google Scholar]
- Deniau JM, Chevalier G (1985) Disinhibition as a basic process in the expression of striatal functions. II. The striato-nigral influence on thalamocortical cells of the ventromedial thalamic nucleus. Brain Res 334:227–233. 10.1016/0006-8993(85)90214-8 [DOI] [PubMed] [Google Scholar]
- Deniau JM, Mailly P, Maurice N, Charpier S (2007) The pars reticulata of the substantia nigra: a window to basal ganglia output. Prog Brain Res 160:151–172. [DOI] [PubMed] [Google Scholar]
- Desmurget M, Turner RS (2010) Motor sequences and the basal ganglia: kinematics, not habits. J Neurosci 30:7685–7690. 10.1523/JNEUROSCI.0163-10.2010 [DOI] [PMC free article] [PubMed] [Google Scholar]
- Di Chiara G, Morelli M, Porceddu ML, Mulas M, Del Fiacco M (1980) Effect of discrete kainic acid-induced lesions of corpus caudatus and globus pallidus on glutamic acid decarxylase of rat substantia nigra. Brain Res 189:193–208. 10.1016/0006-8993(80)90017-7 [DOI] [PubMed] [Google Scholar]
- Dray A, Gonye TJ, Oakley NR (1976) Caudate stimulation and substantia nigra activity in the rat. J Physiol 259:825–849. 10.1113/jphysiol.1976.sp011497 [DOI] [PMC free article] [PubMed] [Google Scholar]
- Dudman JT, Krakauer JW (2016) The basal ganglia: from motor commands to the control of vigor. Curr Opin Neurobiol 37:158–166. 10.1016/j.conb.2016.02.005 [DOI] [PubMed] [Google Scholar]
- Egertovà M, Elphick MR (2000) Localisation of cannabinoid receptors in the rat brain using antibodies to the intracellular C-terminal tail of CB1. J Comp Neurol 422:159–171. 10.1002/(SICI)1096-9861(20000626)422:2<159::AID-CNE1>3.0.CO;2-1 [DOI] [PubMed] [Google Scholar]
- Fernández-Ruiz J, Moreno-Martet M, Rodríguez-Cueto C, Palomo-Garo C, Gómez-Cañas M, Valdeolivas S, Guaza C, Romero J, Guzmán M, Mechoulam R, Ramos JA (2011) Prospects for cannabinoid therapies in basal ganglia disorders. Br J Pharmacol 163:1365–1378. 10.1111/j.1476-5381.2011.01365.x [DOI] [PMC free article] [PubMed] [Google Scholar]
- Fonnum F, Grofová I, Rinvik E, Storm-Mathisen J, Walberg F (1974) Origin and distribution of glutamate decarxylase in substantia nigra of the cat. Brain Res 71:77–92. 10.1016/0006-8993(74)90192-9 [DOI] [PubMed] [Google Scholar]
- François C, Tande D, Yelnik J, Hirsch EC (2002) Distribution and morphology of nigral axons projecting to the thalamus in primates. J Comp Neurol 447:249–260. 10.1002/cne.10227 [DOI] [PubMed] [Google Scholar]
- Freeze BS, Kravitz AV, Hammack N, Berke JD, Kreitzer AC (2013) Control of basal ganglia output by direct and indirect pathway projection neurons. J Neurosci 33:18531–18539. 10.1523/JNEUROSCI.1278-13.2013 [DOI] [PMC free article] [PubMed] [Google Scholar]
- Gerfen CR, Staines WA, Fibiger HC, Arbuthnott GW (1982) Crossed connections of the substantia nigra in the rat. J Comp Neurol 207:283–303. 10.1002/cne.902070308 [DOI] [PubMed] [Google Scholar]
- Goodman J, Packard MG (2015) The influence of cannabinoids on learning and memory processes of the dorsal striatum. Neurobiol Learn Mem 125:1–14. 10.1016/j.nlm.2015.06.008 [DOI] [PubMed] [Google Scholar]
- Graybiel AM. (2008) Habits, rituals, and the evaluative brain. Annu Rev Neurosci 31:359–387. 10.1146/annurev.neuro.29.051605.112851 [DOI] [PubMed] [Google Scholar]
- Harris KD, Henze DA, Csicsvari J, Hirase H, Buzsáki G (2000) Accuracy of tetrode spike separation as determined by simultaneous intracellular and extracellular measurements. J Neurophysiol 84:401–414. 10.1152/jn.2000.84.1.401 [DOI] [PubMed] [Google Scholar]
- Hazan L, Zugaro M, Buzsáki G (2006) Klusters, NeuroScope, NDManager: a free software suite for neurophysiological data processing and visualization. J Neurosci Methods 155:207–216. 10.1016/j.jneumeth.2006.01.017 [DOI] [PubMed] [Google Scholar]
- Hidalgo-Balbuena AE, Luma AY, Pimentel-Farfan AK, Peña-Rangel T, Rueda-Orozco PE (2019) Sensory representations in the striatum provide a temporal reference for learning and executing motor habits. Nat Commun 10:4074. 10.1038/s41467-019-12075-y [DOI] [PMC free article] [PubMed] [Google Scholar]
- Hikosaka O, Kim HF, Amita H, Yasuda M, Isoda M, Tachibana Y, Yoshida A (2019) Direct and indirect pathways for choosing objects and actions. Eur J Neurosci 49:637–645. 10.1111/ejn.13876 [DOI] [PMC free article] [PubMed] [Google Scholar]
- Ibáñez-Sandoval O, Carrillo-Reid L, Galarraga E, Tapia D, Mendoza E, Gomora JC, Aceves J, Bargas J (2007) Bursting in substantia nigra pars reticulata neurons in vitro: possible relevance for Parkinson disease. J Neurophysiol 98:2311–2323. 10.1152/jn.00620.2007 [DOI] [PubMed] [Google Scholar]
- Kim N, Li HE, Hughes RN, Watson GDR, Gallegos D, West AE, Kim IH, Yin HH (2019) A striatal interneuron circuit for continuous target pursuit. Nat Commun 10:2715. 10.1038/s41467-019-10716-w [DOI] [PMC free article] [PubMed] [Google Scholar]
- Kolomiets B, Deniau J, Glowinski J, Thierry A (2003) Basal ganglia and processing of cortical information: functional interactions between trans-striatal and trans-subthalamic circuits in the substantia nigra pars reticulata. Neuroscience 117:931–938. 10.1016/S0306-4522(02)00824-2 [DOI] [PubMed] [Google Scholar]
- Kucewicz MT, Tricklebank MD, Bogacz R, Jones MW (2011) Dysfunctional prefrontal cortical network activity and interactions following cannabinoid receptor activation. J Neurosci 31:15560–15568. 10.1523/JNEUROSCI.2970-11.2011 [DOI] [PMC free article] [PubMed] [Google Scholar]
- Latuske P, Toader O, Allen K (2015) Interspike intervals reveal functionally distinct cell populations in the medial entorhinal cortex. J Neurosci 35:10963–10976. 10.1523/JNEUROSCI.0276-15.2015 [DOI] [PMC free article] [PubMed] [Google Scholar]
- Lovinger DM, Mathur BN (2012) Endocannabinoids in striatal plasticity. Parkinsonism Relat Disord 18:S132–S134. 10.1016/S1353-8020(11)70041-4 [DOI] [PMC free article] [PubMed] [Google Scholar]
- Marsicano G, Lutz B (1999) Expression of the cannabinoid receptor CB1 in distinct neuronal subpopulations in the adult mouse forebrain. Eur J Neurosci 11:4213–4225. 10.1046/j.1460-9568.1999.00847.x [DOI] [PubMed] [Google Scholar]
- Mátyás F, Yanovsky Y, Mackie K, Kelsch W, Misgeld U, Freund TF (2006) Subcellular localization of type 1 cannabinoid receptors in the rat basal ganglia. Neuroscience 137:337–361. 10.1016/j.neuroscience.2005.09.005 [DOI] [PubMed] [Google Scholar]
- Miller AS, Walker JM (1995) Effects of a cannabinoid on spontaneous and evoked neuronal activity in the substantia nigra pars reticulata. Eur J Pharmacol 279:179–185. 10.1016/0014-2999(95)00151-A [DOI] [PubMed] [Google Scholar]
- Mochol G, Hermoso-Mendizabal A, Sakata S, Harris KD, de la Rocha J (2015) Stochastic transitions into silence cause noise correlations in cortical circuits. Proc Natl Acad Sci USA 112:3529–3534. 10.1073/pnas.1410509112 [DOI] [PMC free article] [PubMed] [Google Scholar]
- Monory K, Blaudzun H, Massa F, Kaiser N, Lemberger T, Schütz G, Wotjak CT, Lutz B, Marsicano G (2007) Genetic dissection of behavioural and autonomic effects of delta(9)-tetrahydrocannabinol in mice. PLoS Biol 5:e269 10.1371/journal.pbio.0050269 [DOI] [PMC free article] [PubMed] [Google Scholar]
- Nagy JI, Fibiger HC (1980) A striatal source of glutamic acid decarbocylase activity in the substantia nigra. Brain Res 187:237–242. 10.1016/0006-8993(80)90512-0 [DOI] [PubMed] [Google Scholar]
- Nagy A, Paróczy Z, Norita M, Benedek G (2005) Multisensory responses and receptive field properties of neurons in the substantia nigra and in the caudate nucleus. Eur J Neurosci 22:419–424. 10.1111/j.1460-9568.2005.04211.x [DOI] [PubMed] [Google Scholar]
- Panigrahi B, Martin KA, Li Y, Graves AR, Vollmer A, Olson L, Mensh BD, Karpova AY, Dudman JT (2015) Dopamine is required for the neural representation and control of movement vigor. Cell 162:1418–1430. 10.1016/j.cell.2015.08.014 [DOI] [PubMed] [Google Scholar]
- Pardo-Garcia TR, Garcia-Keller C, Penaloza T, Richie CT, Pickel J, Hope BT, Harvey BK, Kalivas PW, Heinsbroek JA (2019) Ventral pallidum is the primary target for accumbens D1 projections driving cocaine seeking. J Neurosci 39:2041–2051. 10.1523/JNEUROSCI.2822-18.2018 [DOI] [PMC free article] [PubMed] [Google Scholar]
- Redgrave P, Rodriguez M, Smith Y, Rodriguez-Oroz MC, Lehericy S, Bergman H, Agid Y, Delong MR, Obeso JA (2010) Goal-directed and habitual control in the basal ganglia: implications for Parkinson's disease. Nat Rev Neurosci 11:760–772. 10.1038/nrn2915 [DOI] [PMC free article] [PubMed] [Google Scholar]
- Robbe D. (2018) To move or to sense? Incorporating somatosensory representation into striatal functions. Curr Opin Neurobiol 52:123–130. 10.1016/j.conb.2018.04.009 [DOI] [PubMed] [Google Scholar]
- Robbe D, Montgomery SM, Thome A, Rueda-Orozco PE, McNaughton BL, Buzsaki G (2006) Cannabinoids reveal importance of spike timing coordination in hippocampal function. Nat Neurosci 9:1526–1533. 10.1038/nn1801 [DOI] [PubMed] [Google Scholar]
- Rodríguez de Fonseca F, Del Arco I, Martín-Calderón JL, Gorriti MA, Navarro M (1998) Role of the endogenous cannabinoid system in the regulation of motor activity. Neurobiol Dis 5:483–501. 10.1006/nbdi.1998.0217 [DOI] [PubMed] [Google Scholar]
- Rueda-Orozco PE, Robbe D (2015) The striatum multiplexes contextual and kinematic information to constrain motor habits execution. Nat Neurosci 18:453–460. 10.1038/nn.3924 [DOI] [PMC free article] [PubMed] [Google Scholar]
- Rueda-Orozco PE, Montes-Rodriguez CJ, Soria-Gomez E, Méndez-Díaz M, Prospéro-García O (2008a) Impairment of endocannabinoids activity in the dorsolateral striatum delays extinction of behavior in a procedural memory task in rats. Neuropharmacology 55:55–62. 10.1016/j.neuropharm.2008.04.013 [DOI] [PubMed] [Google Scholar]
- Rueda-Orozco PE, Soria-Gomez E, Montes-Rodriguez CJ, Martínez-Vargas M, Galicia O, Navarro L, Prospero-García O (2008b) A potential function of endocannabinoids in the selection of a navigation strategy by rats. Psychopharmacology (Berl) 198:565–576. 10.1007/s00213-007-0911-z [DOI] [PubMed] [Google Scholar]
- Sales-Carbonell C, Rueda-Orozco PE, Soria-Gómez E, Buzsáki G, Marsicano G, Robbe D (2013) Striatal GABAergic and cortical glutamatergic neurons mediate contrasting effects of cannabinoids on cortical network synchrony. Proc Natl Acad Sci USA 110:719–724. 10.1073/pnas.1217144110 [DOI] [PMC free article] [PubMed] [Google Scholar]
- Sañudo-Peña MC, Patrick SL, Patrick RL, Walker JM (1996) Effects of intranigral cannabinoids on rotational behavior in rats: interactions with the dopaminergic system. Neurosci Lett 206:21–24. 10.1016/0304-3940(96)12436-8 [DOI] [PubMed] [Google Scholar]
- Sarvestani IK, Lindahl M, Hellgren-Kotaleski J, Ekeberg Ö (2011) The arbitration–extension hypothesis: a hierarchical interpretation of the functional organization of the basal ganglia. Front Syst Neurosci 5:1–12. [DOI] [PMC free article] [PubMed] [Google Scholar]
- Shi LH, Luo F, Woodward DJ, Chang JY (2005) Dose and behavioral context dependent inhibition of movement and basal ganglia neural activity by ??9-tetrahydrocannabinol during spontaneous and treadmill locomotion tasks in rats. Synapse 55:1–16. 10.1002/syn.20088 [DOI] [PubMed] [Google Scholar]
- Smith Y, Bolam JP (1989) Neurons of the substantia nigra reticulata receive a dense GABA-containing input from the globus pallidus in the rat. Brain Res 493:160–167. 10.1016/0006-8993(89)91011-1 [DOI] [PubMed] [Google Scholar]
- Swanson LW. (2018) Brain maps 4.0-Structure of the rat brain: an open access atlas with global nervous system nomenclature ontology and flatmaps. J Comp Neurol 526:935–943. 10.1002/cne.24381 [DOI] [PMC free article] [PubMed] [Google Scholar]
- Szabo B, Wallmichrath I, Mathonia P, Pfreundtner C (2000) Cannabinoids inhibit excitatory neurotransmission in the substantia nigra pars reticulata. Neuroscience 97:89–97. 10.1016/S0306-4522(00)00036-1 [DOI] [PubMed] [Google Scholar]
- Taouali W, Rueda-Orozco PE, Robbe D (2017) A minority-ruled population coding of kinematics in the striatum. bioRxiv 130237. doi: 10.1101/130237. [DOI] [Google Scholar]
- Tsou K, Brown S, Sañudo-Peña M, Mackie K, Walker J (1998) Immunohistochemical distribution of cannabinoid CB1 receptors in the rat central nervous system. Neuroscience 83:393–411. 10.1016/S0306-4522(97)00436-3 [DOI] [PubMed] [Google Scholar]
- Turner RS, Desmurget M (2010) Basal ganglia contributions to motor control: a vigorous tutor. Curr Opin Neurobiol 20:704–716. 10.1016/j.conb.2010.08.022 [DOI] [PMC free article] [PubMed] [Google Scholar]
- Wallmichrath I, Szabo B (2002) Analysis of the effect of cannabinoids on GABAergic neurotransmission in the substantia nigra pars reticulata. Naunyn Schmiedebergs Arch Pharmacol 365:326–334. 10.1007/s00210-001-0520-z [DOI] [PubMed] [Google Scholar]
Associated Data
This section collects any data citations, data availability statements, or supplementary materials included in this article.
Supplementary Materials
Bilateral coordination task. Five randomly selected trials of a highly trained animal are presented. For better appreciation of the behavior, the first two trials are presented in slow motion.