

Summary
The brain’s complex microconnectivity underlies its computational abilities and vulnerability to injury and disease. It has been challenging to illuminate the features of this synaptic network due to the small size and dense packing of its elements. Here, we describe a rapid, accessible super-resolution imaging and analysis workflow—SEQUIN—that quantifies central synapses in human tissue and animal models, characterizes their nanostructural and molecular features, and enables volumetric imaging of mesoscale synaptic networks without the production of large histological arrays. Using SEQUIN we identify cortical synapse loss resulting from diffuse traumatic brain injury, a highly prevalent connectional disorder. Similar synapse loss is observed in three murine models of Alzheimer-related neurodegeneration, where SEQUIN mesoscale mapping identifies regional synaptic vulnerability. These results establish an easily implemented and robust nano-to-mesoscale synapse quantification and characterization method. They furthermore identify a shared mechanism—synaptopathy—between Alzheimer neurodegeneration and its best-established epigenetic risk factor, brain trauma.
eTOC Blurb
Sauerbeck et al. present SEQUIN, an imaging and analysis platform to rapidly quantify and characterize central synapses molecularly and nanostructurally across large brain regions. They show that diffuse TBI, an upstream trigger of neurodegeneration, causes synapse loss, and characterize patterns of synaptopathy resulting from tau and amyloid induced neurodegenerative cascades.
Introduction
Mammalian neural networks are complex systems in which nanoscopic synaptic specializations precisely connect mesoscopic local circuit elements, enabling the bottom-up emergence of behavior(Gürcan, 2014). Understanding the generation of such behavior therefore requires a detailed knowledge of synaptic architectures and phenotypes across multiple scales. Synaptic networks are also frequent targets of neurological injury, with pathological alterations in synaptic connectivity (synaptopathy) recognized as a central, shared mechanism of neurological disease(Henstridge et al., 2016). The clearest example of this is the rising public health crisis of Alzheimer’s disease (AD)(Holtzman et al., 2011; Long and Holtzman, 2019). Extensive (25–40%(Davies et al., 1987; Terry et al., 1991)) and widespread synapse loss occurs early in AD(Davies et al., 1987; Scheff et al., 2007), and is better correlated with cognitive decline than classic AD neuropathologies such as amyloid plaques and neurofibrillary tangles(DeKosky and Scheff, 1990; Masliah et al., 1989). Such early events and their antecedent triggers are widely recognized to be crucial therapeutic targets(Long and Holtzman, 2019), but are poorly understood.
Traumatic brain injury (TBI) is both the leading cause of death and disability for younger individuals (under the age of 45)(Langlois et al., 2006) and the best-established environmental risk factor for AD(Chauhan, 2014; Plassman et al., 2000). The subcellular foci of brain injury in TBI and their connections to AD, however, remain in question. As all connectional lesions likely impact function, understanding the effect of neurotrauma on synaptic networks could lead to novel approaches to reducing impairment after TBI, and interrupting its link to AD. Addressing these challenges requires approaches to synaptic network imaging and analysis that are broadly-accessible, robust and quantitative, and that extend the analysis of nanoscopic synaptic elements to mesoscale regions (millimeter-scale networks that typify connectivity across individuals(Bohland et al., 2009)).
Because of their size, dense packing, and the exceptionally complex subcellular environment in which they reside, synaptic structural analysis has been extremely challenging. Electron microscopic (EM) approaches, informed by ultrastructural hallmarks, have long been capable of identifying and quantifying synapses with high specificity. Advanced implementations involving lathe ultramicrotomes(Kasthuri et al., 2015), serial block-face scanning(Denk and Horstmann, 2004), or ion beam milling(Knott et al., 2008) are capable of mapping synaptic connectivity across mesoscale circuits with exquisite precision. These approaches, however, suffer from severe limitations in speed, laboriousness, and availability: scan times for local circuits (e.g., a murine cortical column) can extend to months or years(Briggman and Bock, 2012). Furthermore, the resulting voluminous imaging data must be annotated, frequently by hand, to catalogue structures of interest, and molecular phenotyping is largely limited to two-dimensional analysis with minimal multiplexing.
Array tomography (AT), a powerful extension of ultrasectioning-based synaptic characterization(Micheva and Smith, 2007), layers multiplexed immunofluorescent phenotyping onto EM. Unlike standard optical sectioning techniques that suffer from inadequate axial resolution to reliably separate neighboring synaptic elements, AT utilizes physical ultrathin sectioning (50–200 nm) to achieve axial super-resolution (S-R). AT has revealed numerous features of synapses(Collman et al., 2015). However, its reliance on laborious and technically challenging production, staining, imaging, and subsequent reassembly of ultrathin 2D tissue arrays remains a substantial impediment to widespread adoption(Eisenstein, 2015).
Optical implementations of S-R microscopy provide, in theory, a natively 3D alternative. Existing approaches, however, are technically challenging in their own right, often require specialized fluorophores incompatible with transgenic approaches, and struggle with large or 3D volumes, slow scan speeds, and/or poor signal strength(Lambert and Waters, 2016). Confocal microscopy is diffraction limited but benefits from straightforward sample preparation and imaging, compatibility with conventional exogenous and endogenous fluorescent probes, and rapid acquisition of large 3D image volumes. A recently optimized innovation in S-R imaging, image scanning microscopy (ISM)(Gregor and Enderlein, 2019; Sheppard, 1988), combines sub-diffraction limit (i.e., S-R) imaging with the well-developed labeling, hardware, accessibility, sensitivity, artifact resistance, and speed of confocal microscopy(Lambert and Waters, 2016). In the Airyscan implementation, this is accomplished via a 32-channel compound eye detector that reduces the effective confocal pinhole diameter while enhancing signal strength through parallelization of photon detection (Fig. 1A). Combined with appropriate image analysis workflows, ISM potentially represents an ideal balance of resolution, efficiency, and accessibility for the rapid assessment of synaptic networks at-scale.
Fig. 1: SEQUIN overview.

(A) Schematic of Airyscan detector. Each of 32 detector element operates as a 0.2 AU pinhole. (B) Comparison of confocal and Airyscan light paths. (C) Inter-PSD separation by EM (reanalysis of(Kasthuri et al., 2015)) and resolving limit of confocal compared to Airyscan microscopes relative to these separations. Percent synapses resolvable calculated from least resolved axis (axial, Z). (D) Overview of SEQUIN analysis method. Steps highlighted in blue are automatable. Abbreviations: postsyn., postsynaptic. See also Figure S1.
We set out to develop new histological and image analysis methodologies to rapidly detect and quantify synaptic loci in mammalian neuropil, and to characterize their structural and molecular diversity in situ. The resulting ‘SEQUIN’ technique (Synaptic Evaluation and QUantification by Imaging Nanostructure) is a combination of ISM imaging and localization-based analysis that identifies synaptic loci by virtue of intra-synaptic marker separations in-line with ultrastructural parameters. We demonstrate the utility of SEQUIN by analyzing synapse loss in models of AD-related neurodegeneration, and uncovering novel loci of circuit injury in diffuse TBI.
Results
SEQUIN volumetric imaging of synaptic puncta
ISM as implemented with the Airyscan microscope yields a 1.7-fold enhancement of lateral and axial resolution over confocal(Huff, 2015; Huff et al.), improving resolution to 140 × 140 × 350 nm (XYZ). S-R is achieved by reducing the effective pinhole diameter well below 1 Airy unit (AU), while avoiding concomitant loss of signal. The resulting light path lacks a pinhole aperture (Fig. 1A, B); each element of the detector instead acts as an independent 0.2 AU pinhole, while post-imaging pixel reassignment ties sensitivity to the complete 1.25 AU detector array (Fig. 1A).
Neighboring synapses of mammalian cortex are separated by an average of 595 nm (Kasthuri et al., 2015) (Fig 1C); below the axial resolution of diffraction-limited approaches. A 1.7-fold enhancement in resolution, however, resolves >97% of synaptic elements (Fig. 1C). Thus the improvements in optical sectioning afforded by ISM permit volumetric imaging of structures packed at synaptic density without resorting to physical ultrathin sectioning.
The SEQUIN technique consists of (1) immunofluorescent labeling, (2) tissue clearing, (3) ISM of pre-and postsynaptic markers, (4) pre-processing of resulting 32-channel imaging data, (5) localization of pre-and postsynaptic centroids, and (6) identification of synaptic loci by virtue of ultrastructurally-validated separation distances (Fig. 1D). We initially targeted synapsin and PSD-95—proteins abundantly expressed at central synapses where they play distinct roles in sculpting synaptic function(Cesca et al., 2010; Keith and El-Husseini, 2008)—as pre-and postsynaptic markers, respectively. Imaging in thick sections revealed excellent antibody penetration (Fig. S1A, B).
Light scattering and refraction remain pervasive challenges in volumetric imaging, particularly with sensitive S-R applications(Ke et al., 2016; Richardson and Lichtman, 2015). SEQUIN was initially tested without tissue clearing, but substantial degradation in image quality within a few microns of the tissue surface was observed (Fig. S1C). Clearing via refractive index matching in a water-soluble polyvinyl hydrocolloid (Mowiol 4–88) dramatically improved sensitivity and resolution, permitting excellent preservation of image quality throughout the labeled depth (Fig. S1C, D).
Following immunolabeling and tissue clearing, we ISM imaged pre-and postsynaptic markers using high numerical aperture objectives. SEQUIN data was acquired rapidly (< 0.01 sec/μm3). Image preprocessing entailed pixel reassignment and Weiner filter deconvolution (‘Airyscan processing’; Fig 1D, step 4), followed by correction of chromatic aberration (see STAR Methods).
Detection of synaptic loci via SEQUIN localization analysis
ISM and pre-processing of a small region of mouse cortex yielded a clear improvement in sensitivity and resolution over confocal imaging (Fig. 2A, B). As expected, densely-packed and less intense puncta were more readily distinguished using ISM, particularly those with close axial neighbors (Fig. 2A–C).
Fig. 2: Resolution and localization analysis with SEQUIN.

(A) Optimally resolved confocal image of PSD-95 puncta. Arrowhead indicates punctum depicted to right with 90° rotation revealing a possible second punctum separated primarily in Z. (B) Same field imaged by ISM. Note improved resolution of puncta and enhanced sensitivity. Intensity profiles in (C) taken along dotted lines in (A) and (B) reveal improved separation of puncta in Z with ISM. Representative data from n = 10 puncta pairs. (D) Schematic of DNA origami nanoruler. (E) Confocal and (F) S-R image and intensity profile of nanoruler demonstrating relative localization of fluorophore centroids. Colored bars (F) indicate inter-fluorophore distances quantified in G. Data (G) represented as mean +/−SEM from n = 5 nanorulers. (H) Low-power image of brain section labeled against pre-and postsynaptic markers with region in I indicated. (I) Higher magnification field from H; region depicted in J is indicated. (J) Boxed region from I with individual synaptic elements now visible. Fluorophore labels as per H.
Identifying synaptic loci by virtue of pre-to-postsynaptic marker separation requires localization of individual puncta to within tens of nanometers(Dani et al., 2010). Localization microscopy approaches permit localization of spectrally-distinct fluorophores relative to one another at distances well below the resolution limit of the microscope(Bierbaum et al., 2017; Crocker and Grier, 1996). To evaluate localization performance in the expected range of separation, DNA origami nanorulers with fluorophores separated by 70 and 140 nm were imaged (Fig. 2D–F). While fluorophores were not differentiable by confocal (Fig. 2E), the measured inter-fluorophore distance using ISM agreed closely with their known physical separation (Fig. 2F, G), confirming the accuracy of SEQUIN localization measurements at distances relevant to synaptic nanostructure.
We next replicated this analysis over all imaged pre-and postsynaptic puncta throughout a small cortical volume (Fig. 2H–J; see Fig. 1D, step 5). To accomplish this, we located the centroids of each pre-and postsynaptic punctum within the 3D volume (Fig. 3A–C). Spatial statistical analysis (Ripley’s K function(2002)) of the resulting intensity-filtered point patterns revealed that pre-and postsynaptic puncta were distributed randomly (Fig. 3D, E). When the distribution of presynaptic puncta was considered relative to postsynaptic puncta, however, a clear tendency to co-associate emerged (Fig. 3F).
Fig. 3: SEQUIN detection of synaptic loci.

(A-B) Individual postsynaptic puncta centroids are located in 3-dimensions (magenta ellipsoids) and added to presynaptic centroids (green ellipsoids) to construct a volumetric map of synaptic elements in murine cortex (C). Spatial statistical analysis of presynaptic (D) and postsynaptic (E) point patterns. Within-marker spatial associations are indistinguishable from random. (F) Between-marker (bivariate) spatial analysis demonstrates co-association above random. (G) Violin plots of pre-to-postsynaptic separation distances by SEQUIN localization analysis reveals a bimodal distribution of separations, which is lost when one point pattern (postsynaptic) is reflected about the Y axis. (H) Example of electron microscopic image used to measure distance (white line) between PSD (magenta outline) and synaptic vesicle reserve pool (green outline). (I) Frequency distribution of SEQUIN pre-to-postsynaptic separations before and after reflection of the postsynaptic point pattern compared to that measured by EM. Note correspondence between EM distances and the early peak of the SEQUIN analysis. Data represented as mean +/−SEM. (J) Intra-synaptic vector orientations across a volume of murine cortex lacks orientation bias. (K) Synaptic loci distribution in layer II/III murine cortex. Inset, rose plot of nearest neighbor orientations reveals a tendency for synaptic loci to reside along radial trajectories consistent with pyramidal dendrite anatomy (see schematic to left). Examples representative of n ≥ 3 animals for all panels. Abbreviations: SYN, synapsin; NN, nearest neighbor; SV, synaptic vesicle. See also Figures S2–S3.
We therefore identified the nearest potential trans-synaptic partner (i.e., the nearest neighbor of the opposite type) for each punctum in the volume and calculated their Euclidean separation. Examination of these relationships revealed a bimodal distribution of separations (Fig. 3G), with an early concentration at approximately 150 nm marker separation, and a broad secondary concentration of more distant associations. Suspecting that the early peak represented paired puncta at synaptic loci while the second consisted of random associations, we repeated the analysis after reflecting the PSD-95 image about its Y axis. This maneuver maintained puncta density and overall distribution while eliminating putative intra-synaptic relationships. As expected, the resulting distribution lacked the early peak, but retained the broad late peak of distant associations (Fig. 3G), indicating that these distant associations are non-synaptic. The early peak, in contrast, represents non-random, nanoscopic associations of pre-and postsynaptic markers consistent with synaptic loci. Closer examination of the bivariate K function (Fig. 3F) confirmed this interpretation: non-random associations appeared at short separation distances (<200 nm), but only random associations appeared at longer separations (the synapsin/PSD-95 K(r) did not further depart from random).
Prior S-R analyses (Dani et al., 2010; Gerth et al., 2017) indicate that pre-and postsynaptic markers associate at distances consistent with the early peak in the SEQUIN analysis. To further examine the nature of these pairings, we measured separations between post-synaptic densities and synaptic vesicle reserve pools (ultrastructural features expected to correspond to PSD-95 and synapsin centroids) using EM (Fig. 3H)(Thiel, 1993). The distribution of inter-marker separations in this dataset (n = 339 synapses, median 196 nm) closely overlapped with the early peak in the SEQUIN analysis (Fig. 3I), further indicating that this peak represents synaptic loci. Importantly, the appearance of a bimodal distribution of pre-to-postsynaptic separations was not a result of spectral cross-talk, antibody-related or image processing artifacts, and was replicated in an independent laboratory at a separate institution (Fig. S2). As expected based on correlated light-EM reports using synaptic marker antibodies(Collman et al., 2015), the number of nonsynaptic puncta (Fig. 3I, second peak) was larger than the number at synaptic loci (Fig. 3I, first peak), further highlighting the importance of locailzation analysis to reliably identify synaptic loci.
Several additional features of closely-associated pairs were consistent with synaptic loci. The intra-synaptic pre-to-postsynaptic directional orientation vector lacked bias (Fig. 3J; relative anisotropy = 0.006), in-line with anatomic expectations and despite the non-isotropic resolution. Moreover, the inter-synaptic orientation of synaptic loci exhibited radial anisotropy, consistent with the orientation of pyramidal dendritic arbors perpendicular to the cortical surface (Fig. 3K). Detection of synaptic loci using SEQUIN is robust to overall image intensity (Fig. S3), in contrast to methods dependent on image thresholding or densitometry. Thus SEQUIN is well suited for comparisons of tissues with varying labeling efficiency, background levels, and/or opacity.
Quantification of synaptic density
Multiple antibodies were tested to achieve the greatest labeling efficiency, yielding a cocktail of pre-and postsynaptic antibodies that maximized detection. Inspection of the distribution of pre-to-postsynaptic separation distances as a function of puncta intensity revealed that most close pairings were formed by bright puncta (Fig. 4A, B)—relatively dimmer puncta participated more often in pairings consistent with random associations. Histological variables that negatively impact signal strength (poor antibody penetration, inadequate RI matching, etc.) tended to increase the relative size of the late vs. the early peak (data not shown). All puncta intensity groups, however, contributed puncta pairs consistent with synaptic loci (Fig. 4B).
Fig. 4: Synaptic density quantification with SEQUIN.
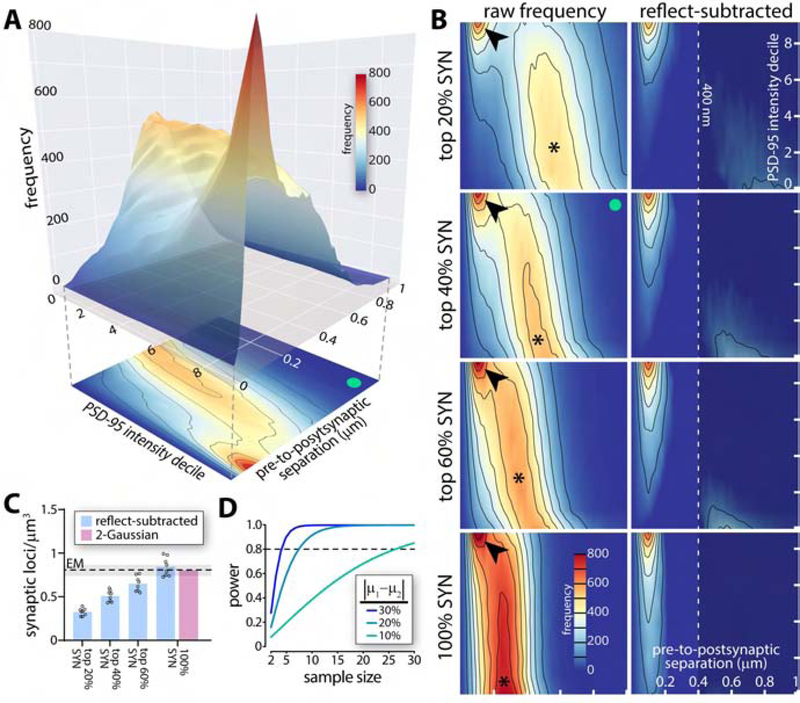
(A) Pre-to-postsynaptic separation distances as a function of intensity decile of PSD-95 puncta. Peak in separations consistent with synapses (red) is most pronounced with brighter PSD-95 puncta. 2D projection below exemplifies convention used in B (green dot, identical dataset in A, B). (B) Heatmaps of pre-to-postsynaptic separations vs. PSD-95 intensity decile with different synapsin puncta intensity bins. As additional synapsin puncta are added, the more distantly separated random association peak (∗) migrates left (closer separations due to greater overall puncta density). The early peak in associations consistent with synapses remains identifiable (arrowhead), but becomes challenging to isolate (see bottom left panel). Subtracting reflected frequency distributions containing only random associations isolates pairings consistent with synapses (right panels). Dotted line (400 nm; right panels) used as cut-off for quantification in C. (C) Quantification of synaptic loci identified using increasingly inclusive synapsin intensity bins after reflect subtraction or Gaussian unmixing. Mean and range of several EM estimates (references in text) shown. n = 7 animals, data represented as mean +/−SEM. (D) Power analysis of synaptic quantification in murine cortex (analysis for Ab cocktail shown). Abbreviations: SYN, synapsin. See also Figures S4 and S5.
Early and late peaks overlap substantially in such intensity-inclusive datasets (Fig. 4B). To quantify synaptic loci we therefore isolated anatomical colocalizations (those dependent on subcellular microstructure) from those formed randomly (those dependent only on puncta density and distribution) by subtracting the purely random colocalizations identified after reflection of the PSD-95 image (Fig. 4B, and see Fig. 3I). Quantification of resulting synaptic loci closely agreed with prior estimates from EM (0.85 vs. 0.82 synapses/μm3 by EM(Anton-Sanchez et al., 2014; Kasthuri et al., 2015; Korogod et al.; Santuy et al., 2018); Fig. 4C). Disentangling the SEQUIN separation distribution through modeling as a mixture of two Gaussians generated a remarkably similar estimate (0.81 synapses/μm3; Fig. 4C and S4). Reassuringly, there was minimal difference when using a post-(i.e., Fig. 4) or presynaptic marker as the reference dataset for pairing (0.847 (PSD-95 reference) vs 0.854 (synapsin reference) synapses/μm3; Fig. S4). Variability in the SEQUIN analysis was modest (coefficient of variation 12.1–12.7%), resulting in practical sample size estimates (n = 6.9 for a 20% difference at 80% power, α 0.05 for single marker antibodies; n = 7.4 for the antibody cocktail; Fig. 4D). Although the antibody cocktail maximized detection of synaptic loci, antibody species multiplexing limited flexibility for additional markers and required numerous additional controls (Fig. S5). Subsequent experiments were therefore conducted with single primary antibody combinations.
Pathological loss of synaptic loci measured with SEQUIN
Alzheimer disease is characterized by early synapse loss and fibrillar lesions including amyloid plaques and tau tangles(Holtzman et al., 2011; Koffie et al., 2011; Scheff, 2003). To test the ability of SEQUIN to detect synaptopathic alterations in this context, we turned to murine models of these processes. Cortical excitatory synaptic density was first measured in aged (18 mo) APP-PS1 mice (APPswe/PSEN1dE9(Borchelt et al., 1996; Jankowsky et al., 2001)) in the vicinity of amyloid plaques. As expected(Dong et al., 2007; Koffie et al., 2009), SEQUIN revealed a proximity-dependent loss of synapses in such regions (Fig. 5A, B). A similar effect was also observed in a knock-in model of amyloidosis (18 mo old APP NL-F(Saito et al., 2014)) (Fig. 5B). We next sought to determine whether amyloidosis resulted in diffuse, as opposed to plaque dependent, synapse loss using SEQUIN. We quantified synaptic density >25 μm from plaque cores (beyond which plaque-dependent synapse loss is undetectable; Fig. 5B) in aged APP NL-F mice. No decrement in synaptic density was found in such regions compared to age-matched controls (Fig. 5C), indicating that cortical synapse loss in this model is primarily or entirely plaque-associated.
Fig. 5: Synapse loss in models of AD-related pathology.

(A) Cortical region containing single amyloid plaque (HJ3.4 labeling). Concentric rings highlight regions used for quantification of synaptic loci in B. (B) Synaptic loci as a function of distance from plaque center, normalized to rings 7 and 8 for each genotype, with 95% CI of trend line indicated. Data represented as mean +/−SEM from n = 7 plaques from 3 animals (APP-PS1) or n = 13 plaques from 3 animals (APP NL-F). (C) Quantification of synaptic loci from cortical regions >25 μm from plaque cores in APP NL-F animals compared to age-matched controls. (D) Example of imaged sub-volumes from 9 mo old PS19 mice and WT littermate controls. (E) Quantification of synaptic loci in piriform cortex of 9 mo old PS19 and littermate control mice. ** p < 0.01. Abbreviations: ctl, control.
We next examined synaptic alterations in a model of tauopathy, PS19 mice(Yoshiyama et al., 2007), that lacks amyloid plaques. SEQUIN detected significantly fewer synaptic loci in piriform cortex of PS19 mice (9 mo old) compared to littermate controls (Fig. 5D, E). These findings implicate multiple mechanisms of cortical synaptotoxicity that likely contribute to AD-related synaptopathy and cognitive decline.
Traumatic brain injury (TBI) usually affects the brain diffusely, though white matter axons are the best studied injury focus(Hill et al., 2016). TBI furthermore triggers an indolent neurodegenerative process associated through unknown pathological mediators with an increased risk of developing AD and other dementias(Fleminger et al., 2003; Nordström and Nordström, 2018; Plassman et al., 2000). To reveal novel connectional lesions in diffuse TBI and uncover their potential links to AD, we investigated synaptic alterations following TBI using SEQUIN. TBI was induced using a tunable model of mild-moderate closed head brain injury called modCHIMERA (Fig. 6A, B)(Sauerbeck et al., 2018). Unlike predominant TBI models, modCHIMERA does not induce cortical neuron loss, diffuse or cortical atrophy (Fig. 6C and S6), yet results in persistent neurobehavioral deficits indicative of behavioral circuitry interruption(Sauerbeck et al., 2018). SEQUIN revealed that synaptic loci were preserved at acute time points post-injury but were significantly and progressively reduced at 7 and 30 days (Fig. 6F; 22.3% and 25.9% decline, Cohen’s d = 1.29 and 1.6 at 7 and 30 days, respectively).
Fig. 6: Cortical synapse loss after diffuse closed-head TBI.

(A) Schematic of the CHIMERA impactor device(Namjoshi et al., 2014; Sauerbeck et al., 2018). Mouse rests on platform with head over barrel. Piston travels up barrel striking head of mouse. (B) Rotational movement of mouse resulting from impact. Mouse travels 180° coming to rest on a padded platform. (C) Appearance of brain 7 days after modCHIMERA diffuse TBI. Note lack of focal cortical pathology. (D) Overview of immunolabeling with location of coronal section and example of imaged region in layer 1 cortex boxed (images collected bilaterally). (E) Example imaged sub-volumes from regions near boxed area in D at various time points post-injury. Fluorophore labels as per D. (F) SEQUIN quantification reveals loss of synaptic loci by 7 days that persists to at least 30 days post-TBI compared to controls. n ≥ 8 animals/group. (G) Example of intact synapse in control animal by EM and examples of dystrophic synapses 7 days post modCHIMERA TBI. Scale bar applies to all panels. (H) Quantification of synapses by EM in control animals and after TBI. n = 3 animals/group. * p < 0.05. Data represented as mean +/−SEM. Abbreviations: HPF, high power field. See also Figure S6.
To validate these results against gold standard (but far more laborious) methodology, EM was undertaken in a small parallel cohort. Synapses post-modCHIMERA TBI exhibited dystrophic features at 7 days post injury, including diffuse electron dense presynaptic material, enlarged synaptic vacuoles, and degenerating synaptic boutons (Fig. 6G and S6), that have been observed in AD and other forms of neurodegeneration(Kuljis et al., 1997; Lassmann et al., 1993; Masliah et al., 1991). Stereological quantification by EM paralleled findings from SEQUIN in magnitude (Fig. 6H; 27.1% decline, Cohen’s d = 2.37), though the analysis was underpowered. These results uncover a novel microstructural lesion in diffuse TBI with likely implications for acute neurological disability. They furthermore demonstrate the power of SEQUIN for quantifying synaptic alterations in acute and chronic neuropathological conditions, and supply a potential structural-mechanistic link (synapse loss) between AD and antecedent brain injury.
Analysis of distinct synaptic subsets
Synapses are multicomponent machines whose functional properties are determined by their wiring patterns and molecular composition. A complete understanding of synaptic connectivity requires the means to characterize such diversity in situ on the individual synapse and population levels. To evaluate the potential of SEQUIN to capture synaptic structural and molecular diversity, we first analyzed subsets of synapses with alternate afferent origin (vGluT2+ thalamocortical afferents(Fremeau et al., 2001)) and physiological properties (inhibitory synapses). Examination of the pattern of vGluT2+ synaptic loci in murine cortex revealed a concentration in layer IV consistent with the known laminar specificity of thalamocortical axon termination in somatosensory cortex (Fig. 7A, B). Labeling against the inhibitory postsynaptic marker gephyrin and the pan-presynaptic marker synapsin permitted quantification of inhibitory synaptic elements (Fig. 7C). Measurements of obligatory synaptic proteins can enable deeper analyses of synaptic networks(Zhu et al., 2018) (see Discussion). We therefore examined the alternate postsynaptic excitatory marker Homer 1 using SEQUIN. Similar to PSD-95, Homer 1 labeling enabled detection of synaptic loci (Fig. 7D).
Fig. 7: Application of SEQUIN to diverse synaptic populations and the human brain.
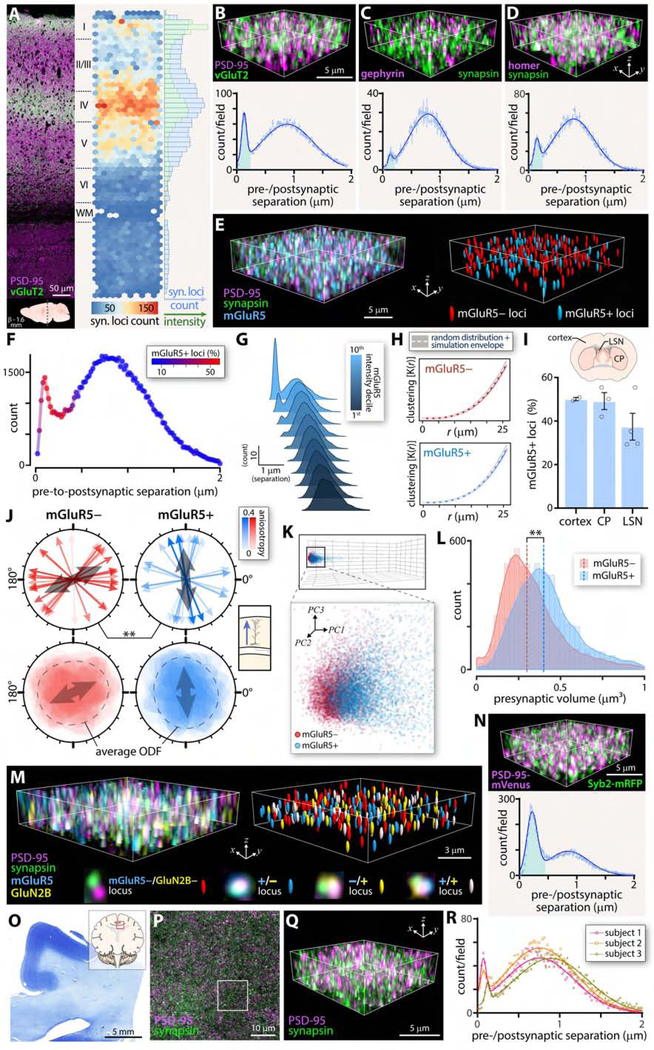
(A) Murine cortex labeled against vGluT2 and PSD-95 with lamina identified. Location noted below. Adjacent heatmap of vGluT2+ synaptic loci across cortical depth. Marginal histogram quantifies vGluT2+ synaptic loci (blue) and intensity of vGluT2+ axon terminals (green). (B) Example of quantified cortical subregion and frequency distribution of pre-to-postsynaptic puncta separations for vGluT2+ synaptic loci. Early peak consistent with synaptic ultrastructure highlighted in blue B-D and N. (C) Labeling of the inhibitory postsynaptic marker gephyrin and the pan-presynaptic marker synapsin and quantification. (D) Quantification of synaptic loci using the excitatory postsynaptic marker Homer 1. (E) Example of prefrontal subfield with pre-and postsynaptic markers labeled as well as mGluR5. Synaptic loci positive or negative for mGluR5 indicated to right. (F) SEQUIN frequency distribution of pre-to-postsynaptic separations with fraction of synaptic loci positive for mGluR5 indicated with color LUT. (G) Secondary localization analysis (separation of mGluR5 from PSD-95 puncta previously paired with synapsin puncta at synaptic separation distances). Lighter colors indicate more intense mGluR5 intensity deciles. (H) Spatial analysis (Ripley’s K function) of mGluR5+/mGluR5-synaptic loci in prefrontal cortex. (I) Percent mGluR5+ loci in several brain regions, as indicated. (J) Nearest neighbor orientation distribution for mGluR5+/mGluR5-synaptic loci. Upper panels depict primary axis of orientation distribution function (ODF) for each of 16 fields. Color LUT indicates fractional anisotropy of the ODF. Average orientation is indicated (grey arrow) and was statistically compared between populations. Bottom panels overlay rose plots for each field, with the average ODF indicated. Inset to right depicts orientation of pyramidal dendrites in the imaged region. (K) Principal component analysis of mGluR5+/mGluR5-loci features (see also Fig. S7). (L) Distribution of presynaptic marker (synapsin) volume in mGluR5+/mGluR5-loci. Median size indicated. (M) Example of S-R Imaging of mGluR5 and GluN2B in addition to pre-and postsynaptic markers in hippocampal CA1. Synaptic loci positive or negative for the subset markers indicated to right. Individual synaptic loci positive or negative for subset markers highlighted below. For individual loci images, GluN2B offset slightly for clarity (see Fig. S7 for aligned images). (N) Use of double knock-in pre-and postsynaptic marker fluorescent fusion proteins (Syb2-mRFP and PSD-95-mVenus) to quantify synaptic loci. (O) Low power image of human brain section used for quantification (subject 1) with location noted in inset. (P) Overview of labeled pre-and postsynaptic puncta, with region shown at higher magnification in Q boxed. (Q) High power image of synaptic elements in human brain. (R) Frequency distribution of pre-to-postsynaptic puncta separations for three human subjects. Note early peaks consistent with synapses. n = 3 animals each, A-D and N; 4 animals F-M. Abbreviations: syn., synaptic; CP, caudoputamen; LSN, lateral septal nucleus; ODF, orientation distribution function; PC, principal component. See also Figure S7.
mGluR5 is a group 1 metabotropic glutamate receptor expressed by subpopulations of primarily projection neurons in striatum and cortex(Lujan et al., 1997; Paquet and Smith, 2003; Shostak et al., 2014) that is implicated in multiple neurodegenerative, synaptopathic conditions(Ribeiro et al., 2017). Synaptic expression of mGluR5 influences network behavior (e.g.(Rodrigues et al., 2002)) and synaptopathic phenotype(Renner et al., 2010), but the patterns and features of mGluR5 positive and negative synaptic subsets have been challenging to reveal(Lujan et al., 1997; Paquet and Smith, 2003; Shostak et al., 2014). To gain further insight into synaptic subpopulations, we labeled against mGluR5 to classify synaptic loci (identified as above) as mGluR5 positive (mGluR5 centroid < 250 nm from the postsynaptic specialization) or negative (Fig. 7E). The majority of PSD-95 puncta with closely-associated mGluR5 puncta were located at distances from synapsin puncta consistent with synapses (Fig. 7F). Thus PSD-95 and mGluR5 appear to preferentially associate at synaptic loci, as expected. More intensely labeled mGluR5 puncta were observed in such synaptic associations (Fig. 7G), again supporting a specific perisynaptic localization.
We next explored the characteristics of these synaptic subpopulations as revealed by SEQUIN. Neither mGluR5+ nor mGluR5-synaptic loci exhibited substantial clustering (Fig. 7H), nor did we detect a significant difference in mGluR5 status in prefrontal cortex vs. two deep gray matter areas (Fig. 7I). Interestingly, mGluR5+, but not mGluR5-, synaptic loci tended to orient radially, consistent with observations that mGluR5 is principally expressed by radially oriented pyramidal neurons (Fig. 7J)(Shostak et al., 2014). mGluR5-loci exhibited a significantly different, tangential orientation, consistent with a preferential localization to second order pyramidal dendrites and/or interneurons. SEQUIN offers the potential to further characterize such inter-and intraneuronal synaptic subtype distributions via sparse neuron filling and masking approaches.
Nanostructural characterization of mGluR5+ and mGluR5-synaptic loci could shed light on the roles of these subtypes in network function and disease. We therefore characterized each population along a series of such features revealed by SEQUIN (Fig. S7). mGluR5 positive and negative synaptic loci could be separated into distinct but overlapping populations within this multivariate feature space (28.4% misclassification rate by lateral discriminate analysis; Fig. 7K). Examining one characteristic, presynaptic volume, in greater detail, we found that overall larger presynaptic structures innervated prefrontal mGluR5+ vs. mGluR5-synaptic loci (Fig. 7L). mGluR5 is a co-receptor for synaptopathic A-beta oligomers(Um et al., 2013). Synapse loss in AD, furthermore, leaves behind a pool of overall larger synapses(Scheff, 2003). Whether this results from adaptive enlargement of synapses or selective vulnerability of smaller synapses, however, is not clear (but see(Scheff and Price, 1993)). Our observations of presynaptic size dependence on mGluR5 status support the adaptive hypothesis. Synaptic subtype orientation distributions (Fig. 7J) further predict potential dendritic branch-order and/or neuron subtype stratification of synaptic vulnerability.
To demonstrate the capability of SEQUIN to capture synaptic subsets defined by combinations of molecular features(Reiner and Levitz, 2018), we expanded our analysis to a second glutamate receptor subtype, the GluN2B subunit of the NMDA receptor, a developmentally-regulated NR2 family member with key roles in plasticity and behavior(Wang et al., 2011). We imaged both receptor subtypes in addition to synapsin and PSD-95 in situ. This approach identified four synaptic subsets within the same volume of CA1 defined by the presence or absence of each receptor (Fig. 7M and S7).
Intravital analysis of synaptic alterations requires endogenous and/or vital labeling of synaptic structures. To evaluate SEQUIN for such an application, we generated a double knock-in mouse for spectrally-distinct pre-and postsynaptic fluorescent fusion proteins (Syb2-mRFP(Matti et al., 2013) and PSD-95-Venus(Fortin et al., 2014)). SEQUIN revealed punctate labeling of pre-and postsynaptic elements from such animals, and the expected peak in pre-to-postsynaptic separation distances consistent with synapses(Hu et al., 2005) (Fig. 7N and S2B).
Lastly we assessed the suitability of SEQUIN for human brain samples, a critical translational step. Formalin fixed human brain samples were processed and analyzed for SEQUIN analysis(Fig. 7O–R). In samples from three subjects a peak in pre-to-postsynaptic separations was identified consistent with synapses (Fig. 7R).
Mesoscale imaging of synaptic microconnectivity
Synapses exhibit diversity in abundance and in molecular and physiological properties across brain regions(Bohland et al., 2009; Emes and Grant, 2012; O’Rourke et al., 2012) that affect the function of parent networks and may impart unique resilience or vulnerability to disease(Zhu et al., 2018). Capturing such features requires nanoscopic analysis approaches scalable to mesoscales (brain regions encompassing functional neural circuits). The volumetric imaging and automation enabled by SEQUIN (Fig. 1D) permits application across such scales.
The hippocampus is involved in a number of cognitive functions, in particular storage of spatial information, and is uniquely affected by AD. To test the ability of SEQUIN to identify mesoscale patterns of nanoscopic synaptic features and neurodegenerative alterations, we imaged across mouse hippocampal sections from control and APP-PS1 animals (Fig. 8A, E, and S8). Images consisted of 431 – 583 individual tiles and required ~28 hrs to acquire (9.3 sec/1000 μm3). Imaging datasets were batch processed for synaptic localization analysis (required ~2.5 days to complete; ~90 min. active time).
Fig. 8: Mesoscale synaptic quantification with SEQUIN.
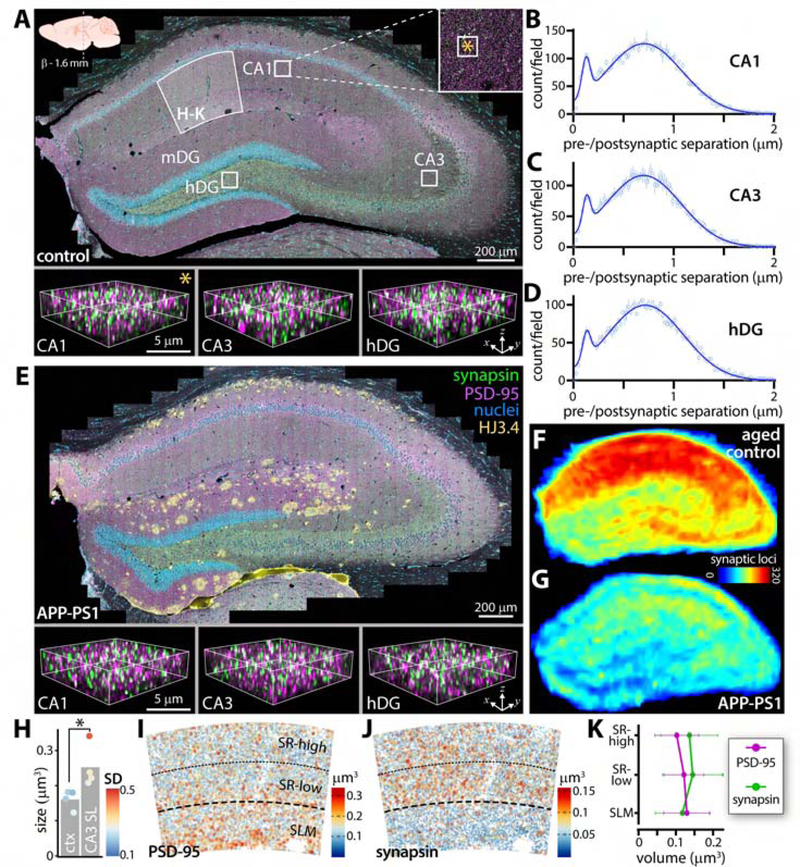
(A) Down sampled hippocampal tile scan from adult control animal. CA1, CA3, and dentate gyrus labeled along with approximate regions for localization analysis in B-D. CA1 boxed region shown in inset, with smaller box (∗) indicating size and location of subfield in bottom-left panel. Identically sized subfields from CA3 and dentate gyrus to right. Region of CA1 analyzed in H-K noted. Location of section relative to Bregma indicated, applicable to A and E. Immunolabels in E apply to A and E. HJ3.4 labels amyloid plaques. (B-D) Frequency distributions of pre-to-postsynaptic puncta separations from boxed regions in A. Data represented as mean +/−SEM. (E) Hippocampal tile scan from APP-PS1 animal with subfields highlighted from same regions as in A. (F, G) Average heatmaps of synaptic density across aged control and APP-PS1 (18 mo old) hippocampi from n = 2 animals each. Color LUT shows number of detected synaptic loci. (H) Comparison of presynaptic punta size between somatosensory cortex and CA3 of WT animal. Color LUT shows within-animal variability (standard deviation) of puncta sizes from n = 4 animals. * p < 0.05. (I) Volume of PSD-95 and synapsin (J) puncta in CA1 molecular layer, quantified in (K). Abbreviations: hDG/mDG, hilus/molecular layer of dentate gyrus; ctx, cortex; SL, stratum lucidum; SD, standard deviation; SR-high, stratum radiatum-superficial; SR-low, stratum radiatum-deep; SLM, stratum lacunosum moleculare. See also Figure S8.
Inspection of individual images from resulting composite maps revealed resolution of synaptic elements (Fig. 8A, E, and S8, lower panels) adequate for quantification of synaptic loci across numerous functionally significant regions (Fig. 8B–D). To highlight variation in synaptic density and identify regional susceptibility to neurodegeneration, we prepared heatmaps of synaptic density from aged control and APP-PS1 animals (both 18 mo old). Individual heatmaps were transformed to a common atlas space(Lein et al., 2007) for averaging and comparison (Fig. 8F, G). Consistent with a report in a non-human primate(Leranth et al., 2008), synaptic loci were denser in CA1 vs. CA3 or dentate gyrus hilus. Synapse loss in the AD model was non-uniform: the greatest loss occurred in CA1, with relative preservation in CA3 and dentate gyrus, demonstrating the capability of SEQUIN to capture mesoscale patterns of synaptic injury.
The CA1 molecular layer exhibits radial gradients of synapses with distinct physiological properties that contribute to spatial memory encoding(Andersen et al., 1980; Danielson et al., 2016; Igarashi et al., 2014). To better conceptualize the significance of regional variation in synaptic structure for network function, we examined pre-and postsynaptic elements sizes across CA1 laminae. The size of such elements correlates closely with synaptic strength(Bourne et al., 2013; Harris and Stevens, 1989; Schikorski and Stevens, 1997) and contributes to information storage(Bartol et al., 2015). We first evaluated SEQUIN’s ability to detect well-described variation in presynaptic size by comparing the large mossy fiber boutons of CA3 stratum lucidum (SL) with those of somatosensory cortex. Presynaptic elements of CA3 SL were significantly larger than neocortical puncta on average, though the magnitude of this difference was impacted by the mixture of large with small boutons in CA3(Rollenhagen and Lübke, 2010) (Fig. 8H).
Turning to CA1, we found that postsynaptic elements increased in size with distance from CA1 pyramidal somata (Fig. 8I, K), in agreement with reports using an orthogonal S-R approach(Broadhead et al., 2016). Interestingly, presynaptic puncta (reciprocal to PSD-95 synaptic puncta) exhibited stable size in proximal CA1 dendritic trees (within striatum radiatum), but were substantially smaller in distal arbors (in stratum lacunosum-moleculare; Fig. 8J, K). This observation suggests a previously unknown size-function relationship in CA1 synapses that may have implications for network behavior. Together, these results establish the utility of SEQUIN as a multiscale synaptic analysis tool that can reveal novel aspects of synaptic distributions, their features, and their differential response to neuropathological processes.
Discussion
Synaptic imaging
An expanding collection of innovative histological, imaging, and computational techniques is rapidly enhancing what can be gleaned from light microscopy datasets. While such approaches hold tremendous potential to address questions involving nervous system development, function, and malfunction, widespread application is hindered by numerous factors that limit their reach. Synapses offer an illustrative case study: although among the most important neural structures in health and disease, critical questions regarding their distribution, features, and population level dynamics remain unknown because of their inaccessibility in situ to most imaging methods.
Advanced synapse imaging approaches each present a unique combination of resolution, speed, molecular phenotyping, and accessibility, among other factors. SEQUIN occupies a particularly useful position within this parameter space. By providing a rapid, easily implemented, artifact resistant method to quantify synaptic endpoints based on familiar and widely available hardware, SEQUIN should broadly enable the application of synaptic analysis to problems of biological importance. The combination of standard histological processing with exogenous labeling furthermore maintains maximum flexibility with parallel experimental determinants, cross-species applications, and archived tissue. Although SEQUIN does not directly characterize physiology, several nanostructural features (e.g., pre-to-postsynaptic separation and synapse size) that closely correlate with synaptic strength can be measured. Combining SEQUIN with SynaptoZip(Ferro et al., 2017) or SynTagMA(Perez-Alvarez et al., 2019) offers the further possibility of cataloguing recent synaptic activity.
Alternate approaches may be more appropriate for specific questions. EM offers unparalleled resolution of synaptic ultrastructure (e.g.,(Kasthuri et al., 2015)). Array tomography provides proteomic multiplexing of markers(Micheva et al., 2010) and correlation with ultrastructure(Collman et al., 2015; Micheva and Smith, 2007). The exceptional resolution of single molecule localization approaches (STORM(Rust et al., 2006), PALM(Betzig et al., 2006; Hess et al., 2006), and related techniques) and stimulated emission depletion (STED)(Hell and Wichmann, 1994) microscopy can reveal nanoscale features of individual synapses challenging or impossible to detect with ISM(Broadhead et al., 2016; Tang et al., 2016). STED was also recently shown to be amenable to imaging postsynaptic structures in vivo through the use of a knock-in PSD-95 fusion protein and injection of a STED-appropriate fluorescent ligand(Masch et al., 2018). SEQUIN analysis of fluorescent synaptic fusion proteins (Fig. 7E and S2B) should permit similar in vivo investigations without exogenous labeling, using conventional or multiphoton excitation. Thus while each technique possesses unique strengths and limitations, SEQUIN’s high throughput pipeline and accessibility permits comparatively straightforward, rapid analysis of synaptic connectivity over mesoscales, while preserving the ability to explore functionally relevant nanostructural and molecular characteristics at the individual synapse and population level.
Synaptic injury in acute and chronic disease
Synaptic injury and loss is an early feature of many neurodegenerative conditions including Parkinson’s and Huntington’s disease, multiple sclerosis, AD, and others(Henstridge et al., 2016; Mallucci, 2009; Selkoe, 2002). Synapse loss is also the strongest pathological correlate of cognitive decline in healthy aging(Henstridge et al., 2016; Morrison and Baxter, 2012). Mutations in >130 human postsynaptic proteins are linked to neurological and psychiatric disease(Bayés et al., 2011). These findings suggest that synapses are the most vulnerable link in the chain of neurons that constitute functional networks. Understanding this phenomenon, in particular its evolution relative to better studied neuropathologies such as amyloid and tau deposition, is therefore a pressing translational goal. For example, we detected synapse loss in PS19 mice, but the pathway linking the P301S tau mutation with synaptopathy remains uncertain. Comparing synapse loss with metrics of tau-induced neurodegeneration could clarify such connections.
A further common theme in these conditions is the lack of a clear trigger that initiates neurodegeneration. The strong epidemiological link between early TBI and later neurodegeneration is likely an important clue. Hazard ratios for development of dementia following TBI are 1.29, 2.32, and 4.51 for concussive, moderate, and severe TBI, respectively(Fleminger et al., 2003; Nordström and Nordström, 2018; Plassman et al., 2000). Once thought to be a monophasic injury, TBI is now known to induce chronic neurophysiological changes and progressive cerebral atrophy in many individuals(Bigler, 2013; Cole et al., 2018; Faden and Loane, 2015). The nature of these gray matter alterations is not clear, despite their likely importance for understanding both acute impairments and long-term dementing sequelae. Our findings indicate that synapse loss may be an important component of such injury. Recently it has become clear that sufficient traumatic burden on its own leads to a form of dementia—chronic traumatic encephalopathy(McKee et al., 2012)—the pathological targets of which also primarily reside in gray matter(McKee et al., 2015).
Prior studies link brain trauma to altered APP and tau metabolism(Ikonomovic et al., 2017; Shahim et al., 2017; Tran et al., 2011a, 2011b; Walker and Tesco, 2013). Our findings indicate that diffuse TBI induces synaptic injury and loss. These observations may be connected: synapse loss may represent a link between traumatic tau/APP alterations and dementing neuropathology. Our finding that synapse loss in an amyloidosis model is principally tied to amyloid plaques supports a greater role for tau in this process, as do reports that traumatically dysregulated A-beta is not responsible for TBI-induced alterations in postsynaptic specializations(Winston et al., 2013). A direct synaptic susceptibility to biophysical stress has also been proposed(Przekwas et al., 2016). Our findings of spatiotemporally distinct subcellular injury processes in acute brain injury(Kummer et al., 2015) and across the hippocampus (Fig. 8) suggest that multiple mechanisms may conspire to damage synapses. Comparison of synapse loss in amyloidosis and tauopathy models (see Fig. 5) leads to a similar conclusion.
Synaptic dystrophy similar to our findings is reported by EM in contused cortex following TBI in humans(Castejòn et al., 1995). Likewise, perilesional synapse loss was observed in a model of direct cortical contusion via craniotomy(Perez et al., 2016; Scheff et al., 2005). Recently, peri-somatic loss of inhibitory synaptic terminals and axon initial segment alterations were reported in a clinically relevant model of direct cortical impact (Vascak et al., 2017). Our observations of diffuse excitatory synapse loss following TBI further reinforces the developing consensus that traumatic network injury entails far more complex and multifocal circuit disruption than previously appreciated. SEQUIN mesoscale analysis has the potential to shed further light on these gray matter alterations and connect them with up-and downstream white matter pathways, a perspective that thus far has proved elusive. Such multiscale approaches will be crucial to the development of connectional interventions for TBI.
From synapses to connectivity
Synapses connect axons and dendrites into a brain-wide network referred to cartographically as the connectome(Sporns et al., 2005; Swanson and Lichtman, 2016). Large-scale synaptic architecture, the ‘synaptome’(O’Rourke et al., 2012), is both a component of the connectome and may play crucial roles in its development, refinement, organization, and function. Synapses exhibit exceptional structural, molecular, and functional diversity(O’Rourke et al., 2012), with >1400 proteins identified in the PSD(Bayés et al., 2011) and >400 associated with synaptic vesicles(Takamori et al., 2006). Proteins expressed in synapses carry the signatures of their pre-and postsynaptic parent neurons(O’Rourke et al., 2012). Considering the inordinate number of genes encoding synaptic proteins, and the observation that >70% of genes are expressed in <20% of neurons(Lein et al., 2007), capturing this synaptic diversity using mesoscale analysis techniques such as SEQUIN has the potential to reveal crucial features of connectome organization and function.
Zhu and colleagues recently highlighted the power of such an approach using confocal imaging to capture features of postsynaptic structures canvasing large regions of mouse brain(Zhu et al., 2018). Synaptic diversity, defined based on imaging features of just two postsynaptic proteins, exhibited remarkable correlation with structural and functional connectome properties. In computational models, the distribution of these postsynaptic subtypes impacted patterns of activity in response to input, implicating synaptic diversity as a means of storing information in and shaping the behavior of neural circuits beyond their hard-wired anatomy. SEQUIN, by virtue of its accessibility, flexibility, resolution, and multiscale cataloguing of pre-and postsynaptic structures would be expected to enhance such efforts to characterize the synaptome, understand its role in coordinating connectome architecture and function, and leverage that knowledge to improve understanding of the neural basis of behavior.
STAR METHODS
Lead Contact
Further information and requests for resources and reagents should be directed to and will be fulfilled by the Lead Contact, Terrance Kummer (kummert@wustl.edu).
Material Availability
This study did not generate new unique reagents.
Data and Code Availability
The code generated during this study is available on GitHub at https://github.com/KummerLab/SEQUIN.
EXPERIMENTAL MODEL AND SUBJECT DETAILS
Animals
All animal experiments were approved by the Washington University Institutional Animal Care and Use Committee and performed in accordance with all relevant guidelines and regulations. Unless otherwise noted, all experiments were performed in 16 wk-old male C57Bl/6 mice (Jackson Labs #000664, Bar Harbor, ME, USA). Both APPswe/PSEN1dE9(Borchelt et al., 1996; Jankowsky et al., 2001) (APP-PS1) and APP NL-F(Saito et al., 2014) aged 18 mo were used as amyloidosis models. PS19 mice (Jackson Labs #008169) carrying the human P301S mutation(Yoshiyama et al., 2007) were back crossed with C57/Bl6 mice for three generations. 9 month old PS19 mice were used as a model of tauopothy. Experimental TBI was generated using the modCHIMERA platform at an impact energy of 2.1 J, as previously described(Sauerbeck et al., 2018). Analysis of endogenous synapse labelling was carried out in Syb2-mRFP(Matti et al., 2013) and PSD-95-Venus(Fortin et al., 2014) double knock-in mice.
METHOD DETAILS
Tissue collection and processing
Tissue for immunofluorescence was collected by anesthetizing animals with isoflurane and transcardially perfusing with ice-cold phosphate buffered saline (PBS) until the liver visibly cleared. Animals were then perfused with ice-cold 4% paraformaldehyde (PFA) in PBS for three minutes. The brain was carefully removed and stored in 4% PFA overnight at 4°C (6 hours for experiments conducted at Ludwig-Maximilians Universität München). The following day the brain was rinsed in PBS and transferred to 30% sucrose in PBS. The brain was left in this solution at 4°C until cutting (at least 48 hrs). Cryostat sections were obtained by placing the brain in a cryomold (Tissue-Tek #4557, Torrance, CA, USA) and surrounding it with a 1:4 mixture of 30% Sucrose in PBS and OCT (Fisher #4585, Hampton, NH, USA). Embedded samples were frozen with dry ice-cooled isopentane and frozen blocks were stored at −80°C until cryosectioning at 15 μm (Leica CM1950, Buffalo Grove, IL, USA). Sections were collected onto charged glass slides (Azer Scientific, Morgantown, PA, USA. or Globe Scientific, Mahwah, NJ, USA) and kept at room temperature (RT) for at least 30 minutes before storage at −80°C until immunolabeling. Microtome sections were obtained by removing whole brains from 30% sucrose solution, rapidly freezing with crushed dry ice, freezing to the microtome stage with PBS (Microm HM 430, ThermoFisher Scientific, Waltham, MA, USA), and sectioning at 50–150 μm. Sections were stored free-floating in a cryoprotectant solution (30% sucrose and 30% ethylene glycol in PBS) at −20°C until immunolabeling.
Tissue collection for electron microscopy (EM) was performed by anesthetizing the animal with isoflurane, transcardially perfusing with 37°C normal Ringer’s solution containing 0.2 mg/mL xylocaine and 20 units/mL heparin for 2 minutes, and then perfusing with 0.15 M cacodylate (pH 7.4) containing 2.5% glutaraldehyde, 2% formaldehyde, and 2 mM calcium chloride at 37°C for 5 minutes. Following perfusion, the brain was carefully removed and placed in the same fixative overnight at 4°C. Tissue sections were prepared for EM using the OTO method (osmium and thiocarbohydrazide liganding), as described(Deerinck et al., 2010).
For 15 μm cryostat sections, tissue was rewarmed to RT (~20 min) and isolated with a hydrophobic barrier (Vector Labs ImmEdge #H-4000, Burlingame, CA, USA) that was allowed to dry for ~20 min at RT. For microtome sections, free-floating tissue was placed in 6 well plates with netwell inserts containing PBS. Subsequent steps apply to both cryostat and microtome-cut tissue. Blocking solution, primary and secondary antibody mixtures were centrifuged at 17,000 g for 5 min just prior to use. Tissue was rinsed 3 × 5 min in PBS followed by blocking in 20% normal goat serum (NGS; Vector Labs S-1000, Burlingame, CA, USA) in PBS for 1 hr at RT. Tissue was then incubated overnight at RT with primary antibodies (Key Resources Table) in 10% NGS containing 0.3% Triton X-100 in PBS. The following day sections were rinsed 3 × 5 min in PBS followed by incubation in secondary antibodies (Key Resources Table) in 10% NGS containing 0.3% Triton X-100 in PBS for 4 hr at RT. For nuclear labeling, tissue was rinsed once in PBS followed by incubation in DAPI (1:50,000 in PBS) for 20 min and 3 × 5 min rinsing in PBS. Cryostat sections were briefly rinsed with distilled water prior to coverslipping. Free-floating microtome sections were mounted to charged slides in PBS, dried at RT, briefly rinsed in distilled water, and then coverslipped. Mounting media (~150 μL/slide) was prepared the day of use by mixing Tris-MWL 4–88 (Electron Microscopy Sciences #17977–150, Hatfield, PA) with AF300 (Electron Microscopy Sciences #17977–25) in a 9:1 ratio followed by vortexing and bench top centrifugation to remove bubbles. High precision 1.5H coverglass was used for all experiments (Marienfeld # 0107242). Coverglass was thoroughly cleaned with ethanol and air dried prior to use. Slides were allowed to cure protected from light at RT for at least one day before the short edges of the coverglass only were sealed with CoverGrip (Biotium #23005, Fremont, CA, USA).
Key Resources Table
| REAGENT or RESOURCE | SOURCE | IDENTIFIER |
|---|---|---|
| Antibodies | ||
| Rabbit anti-PSD-95 | Invitrogen | Cat# 51–6900, RRID:AB_2533914 |
| Goat anti-PSD-95 | Abcam | Cat# 12093, RRID:AB_298846 |
| Guinea Pig anti-Synapsin 1/2 | Synaptic Systems | Cat# 106004, RRID:AB_1106784 |
| Rabbit anti-Homer 1 | Synaptic Systems | Cat# 160006, RRID:AB_2631222 |
| Guinea Pig anti-vGlut2 | Synaptic Systems | Cat# 135404, RRID:AB_887884 |
| Mouse anti-Gephyrin | Synaptic Systems | Cat# 147011, RRID:AB_887717 |
| Mouse anti-Aβ HJ3.4 | (Bero et al., 2012) | N/A |
| Goat anti-Rabbit IgG-Alexa 594 | Invitrogen | Cat# A11037, RRID:AB_2534095 |
| Goat anti-Guinea Pig IgG-Alexa 488 | Invitrogen | Cat# A11073, RRID:AB_2534117 |
| Donkey anti-Goat IgG-Alexa 594 | Invitrogen | Cat# A11058, RRID:AB_2534105 |
| Mouse anti-NR2B | BD Biosciences | Cat# 610416, RRID:AB_397796 |
| Chicken anti-mGlur5 | Aves Labs | Cat# ER5, RRID:AB_2313544 |
| Streptavidin conjugated ATTO 490LS | ATTO-TEC | Cat# ATTO-490LS |
| Deposited Data | ||
| Spatial position of postsynaptic density in threedimensional electron microscopy data set. | Saturated Reconstruction of a Volume of Neocortex. Kasthuri et al., 2015 | N/A |
| Experimental Models: Organisms/Strains | ||
| Mouse: C57/Bl6J | The Jackson Labs | RRID: IMSR_JAX:000664 |
| Mouse: Synaptobrevin-mRFP | Dr. Jens Rettig(Matti et al., 2013 | N/A |
| Mouse: PSD-95-Venus | Dr. Haining Zhong(Fortin et al., 2014 | N/A |
| Mouse: APP PS1 | The Jackson Labs(Borchelt et al., 1996; Jankowsky et al., 2001) |
RRID:MMRRC_034829-JAX |
| Mouse: APP NL-F | Dr. Takaomi C. Saido(Saito et al., 2014) |
RRID:IMSR_RBRC06343 |
| Mouse: PS19 P301S | The Jackson Labs(Yoshiyama et al., 2007 |
RRID:IMSR_JAX:008169 |
| Software and Algorithms | ||
| SEQUIN Matlab code for synapse analysis | This report | https://github.com/KummerLab/SEQUIN |
| ImageJ 1.51n | National Institutes of | https://imagej.nih.gov/ij/ |
| Health | ||
| Imaris 9 | Bitplane | https://imaris.oxinst.com/ |
| Matlab 2018b and 2019b | MathWorks | https://www.mathworks.com/products/matlab.html |
| Prism 8 | GraphPad | https://www.graphpad.com/scientific-software/prism/ |
| Excel | Microsoft | https://products.office.com/en-us/excel |
| R Studio | R Studio | https://rstudio.com/ |
| Other | ||
| Nanoruler | GATTAQUANT | Cat# Nanoruler SIM 140YBY |
For sections thicker than 50 μm, imary antibody incubation was extended to 3 days (with sodium azide at 0.2%) and secondary antibody incubation to 1 day. NGS was replaced with 4% bovine serum albumin when primary antibodies raised in goat were used.
Human subjects
Human tissue was acquired from 3 subjects with causes of death including non-blast TBI (subjects 1 and 2) and complications of chemotherapy (subject 3). Post-mortem interval for these subjects is unknown.
Refractive index matching
Images of entire sections to demonstrate RI matching were generated using an Epson (Perfection V33) flatbed scanner and a reference grid (2 mm x 2 mm). PBS and Mowiol 4–88 mounted sections were scanned using identical parameters. Plots of intensity by depth were generated in ImageJ using the ‘Plot Profile’ function on a representative orthogonal projection.
Image acquisition
Images were acquired on a Zeiss LSM 880 microscopy with AiryScan detector (Zeiss, Oberkochen, Germany). Either 63× 1.4NA (primary) or 100× 1.46NA (secondary) oil immersion objectives were used for all experiments. Images were acquired using a magnification factor of at least 1.8x. XY pixel size was optimized per Zeiss Zen software (43 nm pixel size). Z pixel dimension was set to modestly oversample (120 nm Z-step; 30% oversampling) or to optimal (180 nm Z-step; for hippocampal tile scans). Laser power and Z-ramp (when necessary) for each channel was set independently to equalize signal at the top and bottom of the imaging stack and to occupy the first ~1/3 of the detector dynamic range. Scan speed was set to maximum, scan averages to 1, gain to 800, and digital gain to 1. Confirmation of AiryScan detector alignment was performed before image acquisition and was rechecked with every new slide. Hippocampal mesoscale imaging was conducted at the center of 50 μm microtome sections. The convex hull function in Zeiss Zen was used to outline the borders of the hippocampus defining the region to be imaged prior to unsupervised, automated image acquisition. Cortical mesoscans (vGluT2 and PSD-95) were acquired similarly. During each imaging session, a within-tissue, within-antigen, within-experiment channel alignment control was also imaged. This consisted of an experimental brain section labeled during each experiment against synapsin and a 1:1 mix of secondary antibodies bearing all spectrally-distinct fluorophores used in the experiment. All experimental image acquisition involving group comparisons was conducted in a fully blinded fashion.
Image pre-processing
Following acquisition, images were 3D Airyscan processed in Zeiss Zen Black. For TBI experiments, the Wiener parameter (10-f) was set with an f value (the Airyscan filter strength) for the entire experiment equivalent to the lowest automatically-determined value in Zen Black. This and subsequent imaging experiments revealed that the automatically-determined f value was generally very close to 6, and that departures within the range of automatically-determined values had no substantial impact on synaptic quantification. We therefore used a fixed f value/Airyscan filter strength of 6 for all other experiments. Following Airyscan processing, the channel alignment images were inspected to determine the magnitude of lateral and axial chromatic aberration for that imaging session. A manual correction was applied in Zen Black to eliminate misalignment, and this correction was propagated to all experimental images.
Pre-and postsynaptic puncta and synaptic loci analysis
Pre-and postsynaptic puncta detection: Puncta detection was performed using Imaris software (Bitplane, Zurich, Switzerland), version 9. The spots detection function was applied to each channel. Spot size was adjusted to maximize detection of visually evident puncta (XY size of 0.2 μm for rabbit anti-PSD-95 labeling, and 0.09 μm for goat + rabbit anti-PSD-95 labeling) with integrated background subtraction. A Z size of 0.6 μm (rabbit anti-PSD-95) or 0.27 μm (goat + rabbit anti-PSD-95) was used for spots parameter extraction. Above parameters (histological processing, imaging, pre-processing, and puncta identification) were selected to balance sensitivity with specificity (ratio of the early peak to the second peak of random associations). In considering SEQUIN applications, some questions may demand maximal detection of synaptic loci, and may therefore benefit from antibody cocktails, smaller Imaris spots detection size, and inclusion of a wide range of puncta intensities, despite larger random association peaks (see Fig. 4A, B). Other applications may benefit from a more specific result, achieved with more conservative parameters (e.g., the top 20% of puncta intensities used for all experiments outside of Fig. 4).
Following spots identification, a 0.1 μm XY, 0.3 μm Z guard was applied to eliminate spots clipped by the image border from further analysis (to ensure a maximally inclusive dataset for subsequent analysis, no further filters were applied). Region growing was also applied using an automatically determined absolute intensity threshold to determine pre-and postsynaptic puncta volumes in hippocampus and cortex (Bregma −1.6 mm). All such measurements were internally controlled. The XYZ position of the centroid of every spot, along with extracted parameters, was output to spreadsheets for further processing. In some cases (to assess purely random puncta associations; Fig. 3G, I and Fig. 4B, C) the postsynaptic coordinates were reflected in the Y dimension prior to synaptic loci detection.
Synaptic loci identification: Nearest neighbor analysis was performed using custom scripts in MATLAB (Mathworks, Natick, MA, USA) to analyze the XYZ centroid position and mean intensity of all puncta. The SEQUIN code first applied a user defined intensity range filter to select the desired spots for nearest neighbor calculation. The 20% most intense puncta for both pre-and postsynaptic channels were used for all experiments except those in Fig. 4, S4, and 7G in which multiple intensity ranges were assessed. The SEQUIN code then calculated the 3-dimensional Euclidean distance (d, Eq. 1) between each postsynaptic punctum and its nearest presynaptic neighbor (run with a presynaptic reference for Fig. S4).
| Eq. 1: |
Linear DNA origami nanorulers consisting of two Alexa Fluor 568 fluorophore markers each 70 nm from a central Alexa Fluor 488 fluorophore marker (GATTAquant SIM 140YBY, Hiltpoltstein, Germany) were analyzed using SEQUIN localization analysis. Images were initially spatially oversampled (pixel size 9 × 9 × 20 nm XYZ), then downsampled to standard SEQUIN pixel size for localization analysis.
Synaptic loci quantification: Unless otherwise noted, cut-off of 200 nm pre-to-postsynaptic separation was used to quantify synaptic loci for all experiments. To quantify synaptic loci via Gaussian unmixing, the Nonlinear Least Squares function in R (The R Foundation, Vienna, Austria) was used to derive mean, amplitude (A), and standard deviation (σ) of the underlying Gaussian distributions. Fits were visually inspected, and synaptic density calculated from the Gaussian distribution representing the early peak in the pre-to-postsynaptic separation frequency distribution (Eq. 2; see Fig. S4).
| Eq. 2: |
Intensity invariance of puncta: To evaluate intensity ranges both dimmer and brighter than typically utilized, a fixed region was repeatedly imaged at varying laser power (low to high to minimize photobleaching). To avoid any quantitative confounds from decreased signal as a result of potential photobleaching, the final analysis was based upon the mean intensity of the image rather than the laser power used to acquire it.
Pathological synapse loss: Quantification of diffuse synapse loss after experimental TBI was performed in layer 1 cortex at Bregma −1.6 mm (primary somatosensory cortex). Two images were collected from both the left and right sides of the brain, for a total of four images per animal. The number of detected synaptic loci were averaged on a per animal basis for groupwise comparison. Strict blinding was maintained during imaging and image analysis. Quantification of synaptic density as a function of distance from amyloid plaques was carried out in 50 μm microtome sections from APP-PS1 and APP NL-F mice labeled against PSD-95, synapsin, and amyloid plaques (HJ3.4; Key Resources Table). Following imaging, the XY center position of each plaque was manually marked and used for subsequent plaque position-relative quantification of synaptic loci within 10–20 μm-wide rings centered on the plaque core. The density of synaptic loci within each ring was internally normalized to the average of the 7th and 8th rings for that image, corresponding to synaptic loci 70–110μm away from the plaque. For analysis of synaptic density distant from plaques, aged APP NL-F mice were used as cortical plaque burden is saturated in aged APP-PS1 mice. Aged (18 month old) male C57Bl/6 mice were used as controls. Plaques were first identified based on HJ3.4 labeling(Bero et al., 2012). Four fields >25 μm away all plaques in XYZ were imaged. Images in control mice devoid of plaques were positioned to match those taken from APP NL-F mice. Synapse loss in the PS19 model of tauopathy was performed in the polymorph layer of Piriform cortex at Bregma −2.48 using six images per animal. WT littermates were used as controls. Autofluorescence was eliminated using a mean intensity cutoff equal to the 95% percent of control animals. The final synaptic density was then calculated using reflect–subtraction, as in Figure 4B, with a pre-to-postsynaptic separation cutoff of 400 nm.
Spatial statistics: Spatial statistics of pre-and postsynaptic puncta and synaptic loci were analyzed using the Spatstat package(Baddeley, Adrian et al.) in R. Ripley’s K function(2002) and applied using the Kest (univariate; synapsin or PSD-95) and Kcross (bivariate; synapsin and PSD-95) functions. Nearest neighbor orientations of synaptic loci were analyzed using the nnorient function. Fractional anisotropy of the fieldwise orientation of synaptic loci (Fig. 7J) was calculated using Eq3.
| Eq. 3: |
Analysis of mGluR5 synaptic subsets was performed in tissue from Bregma +0.145 stained with antibodies against PSD-95, synapsin, and mGluR5. PSD-95 and synapsin were first used to identify synaptic loci (separation <250 nm). The PSD-95 partner from each identified synaptic locus was then used in a secondary colocalization analysis against the top 20% brightest mGluR5 puncta from the same field. mGluR5-positive synaptic loci were defined as those with a PSD-mGluR5 separation <250 nm (Paquet and Smith, 2003). For quantification of pre-synaptic size of subtype specific terminals, Regions Growing was used in Imaris with the Local Contrast method of thresholding. Principle component and lateral discriminate analysis of mGluR5 synaptic subsets was performed in R (Fig. S7 table). Simultaneous multiplexing of multiple synaptic subtype markers in the same section was performed using four channel imaging. To achieve spectral separation of all channels, the ATTO 490 long Strokes shift fluorophore (ATTO 490LS, Atto-Tec, Siegen, Germany) was utilized in combination with AlexaFlour 488, 594, and 647 fluorophores (Fig. S7B, C).
Heatmaps of synaptic density: To create heatmaps of identified hippocampal synaptic loci, background subtraction was first applied by eliminating pre-and postsynaptic signal < 2x as intense as the auto-determined (Imaris) diffuse background level in white matter, followed by SEQUIN identification of synaptic loci. Autofluorescence (predominantly in the APP-PS1 mice) was eliminated from hippocampal mesoscans using the Region Growing feature in Imaris set to absolute intensity. Each tile from the scan was divided into four quadrants and the number of reflect-subtracted colocalizations was calculated on a subfield basis. The number of synaptic loci for each subfield was then used to create an untransformed heatmap for each animal. These heatmaps were transformed to match a reference atlas(Lein et al., 2007) in Matlab using a Local Weighted Mean Transformation with control points based on a high resolution structural image. Groupwise averaged scans were matched to each other using the a moving least squares affine transformation (ImageJ Landmark Correspondences tool). vGluT2 heatmaps were generated using the ggplot2 and hexbin packages in R (geom_hex) using a binwidth of 20 μm.
SEQUIN replication
All sample processing, imaging, and analysis was conducted in an independent laboratory at a separate institution (Ludwig-Maximilians Universität München, Munich, Germany). Tissue samples for analysis were obtained from offspring of C57Bl/6J-Biozzi and Thy1 GFP line-M(Feng et al., 2000) mouse line crosses. Anti-synapsin and anti-PSD-95 (raised in rabbit) antibodies were per Key Resources Table. Secondary antibodies were conjugated to Alexafluor 555 and 647 (Invitrogen A21435 and A21244, Carlsbad, CA, USA). Images were obtained on a Zeiss LSM800 microscope with Airyscan detector. Processing was performed using Imaris version 8 (Bitplane, Zurich, Switzerland) and MATLAB (Mathworks, Natick, MA, USA) using identical processes and scripts.
Cortical thickness measurements
Measurement of cortical thickness was performed on Nissl stained modCHIMERA tissue collected at 7 and 30 days post-injury. Images were acquired on a Zeiss Axioscan automated slide scanner with a 5x objective from sections located at Bregma −1.6 mm. Following image export, Image J was utilized to measure the thickness of the entire cortex as well as layer 1. All measurements were blinded. For the measurement of total cortical thickness, a measurement line was drawn parallel to the central sulcus from the superior-most extent of the corpus callosum (the cingulum bundle) to the cortical surface (Fig. S6A; green line). For the measurement of layer one cortex thickness, a measurement line overlapping the prior line was drawn from the deep border of layer one cortex to the cortical surface (Fig. S6A; red line).
Electron microscopy
Electron micrographs with 10 nm resolution were acquired on a Zeiss Merlin FE-SEM. For measurement of dis tances between pre-and postsynaptic marker equivalents, synapses were first identified by the presence of a clear presynaptic vesicle pool and post-synaptic electron density. Both the vesicle reserve pool and the PSD were manually traced in ImageJ and the XY center position of these traces were used to calculate the trans-synaptic Euclidean distance.
Quantification of synaptic density after experimental TBI was performed in a fully blinded fashion on electron micrographs with 7 nm resolution. Systematic random sampling was performed by first organizing the raw images onto an XY grid of non-overlapping imaging fields. A square dissector was then overlaid on each individual image containing two inclusion and two exclusion borders. Synapses were identified as above. Synapses were counted if the vesicle pool was fully inside the dissector or touching the inclusion border. Synapses were excluded if the vesicle pool touched the dissector’s exclusion border.
QUANTIFICATION AND STATISTICAL ANALYSIS
Statistics
Parametric statistics were used for all tests except where group numbers were n < 5, a test of normality (Shapiro-Wilk test), or visual inspection of the data indicated a non-normal distribution, as noted below. All tests were two sided except the EM analysis of synaptic density after experimental TBI, where an exclusive, pre-specified directionality based on SEQUIN analysis was of interest. α < 0.05 was used to determine statistical significance for all comparisons. Analysis of synaptic density by EM post-TBI, mGluR5 positive loci across brain regions and analysis of size differences (Fig. 7I, L), and presynaptic puncta volume in somatosensory cortex and CA3 (Fig. 8H) involved n < 5 subjects. The Mann-Whitney U-test or Kruskal-Wallis tests were therefore utilized. Analysis of synaptic density away from plaques (Fig. 5C) utilized a t-test. SEQUIN analysis of synaptic loci after TBI (Fig 6F) and analysis of cortical thickness (Fig. S6B, C) were carried out with a one-way ANOVA with Holm-Sidak post-test. SEQUIN analysis of synaptic loci in PS19 mice (Fig 5E) utilized a Mann-Whitney U-test as the number of synaptic loci in transgenic PS19 mice was not normally distributed.
Supplementary Material
Highlights.
SEQUIN is a straightforward, accessible method for quantifying synaptic loci in situ
Molecular & nanostructural synaptic features are assessed across mesoscale regions
Unique patterns of synapse loss are detected in models of amyloidosis and tauopathy
Diffuse TBI, associated with neurodegeneration, causes progressive synapse loss
Acknowledgements
The authors wish to thank Drs. Jens Rettig, Haining Zhong, and Hao Jiang for providing synaptobrevin and PSD-95 labeled mouse lines, Dr. James Fitzpatrick and Matthew Curtis for imaging discussions, Drs. Krikor Dikranian and Joseph Ojo for discussion of EM data, and Dr. James Fitzpatrick for manuscript appraisal.
This study was supported by the BrightFocus and Brain Research Foundation, the McDonnell Center for Cellular and Molecular Neurobiology, and an NIH K08 grant (1K08NS094760–01; all to T.T.K.). Experiments were performed in part through the Washington University Center for Cellular Imaging supported by Washington University School of Medicine, The Children’s Discovery Institute, St. Louis Children’s Hospital (CDI-CORE-2015–505), the Foundation for Barnes-Jewish Hospital (3770), and the NIH Office of Research Infrastructure Programs (OD021629).
Footnotes
Declaration of Interests
DMH co-founded C2N Diagnostics, LLC, and advises/consults for C2N, Genentech, Denali, and Idorsia.
Publisher's Disclaimer: This is a PDF file of an unedited manuscript that has been accepted for publication. As a service to our customers we are providing this early version of the manuscript. The manuscript will undergo copyediting, typesetting, and review of the resulting proof before it is published in its final form. Please note that during the production process errors may be discovered which could affect the content, and all legal disclaimers that apply to the journal pertain.
References
- Andersen P, Silfvenius H, Sundberg SH, and Sveen O. (1980). A comparison of distal and proximal dendritic synapses on CA1 pyramids in guinea-pig hippocampal slices in vitro. J Physiol 307, 273–299. [DOI] [PMC free article] [PubMed] [Google Scholar]
- Anton-Sanchez L, Bielza C, Merchán-Pérez A, RodrÃ-guez J-R, DeFelipe J, and Larrañaga P. (2014). Three-dimensional distribution of cortical synapses: a replicated point pattern-based analysis. Frontiers in Neuroanatomy 8. [DOI] [PMC free article] [PubMed] [Google Scholar]
- Baddeley Adrian, Rubak Ege, and Turner Rolf Spatial Point Patterns: Methodology and Applications with R. [Google Scholar]
- Bartol TM Jr, Bromer C, Kinney J, Chirillo MA, Bourne JN, Harris KM, and Sejnowski TJ (2015). Nanoconnectomic upper bound on the variability of synaptic plasticity. ELife 4, e10778. [DOI] [PMC free article] [PubMed] [Google Scholar]
- Bayés À, van de Lagemaat LN, Collins MO, Croning MDR, Whittle IR, Choudhary JS, and Grant SGN (2011). Characterization of the proteome, diseases and evolution of the human postsynaptic density. Nature Neuroscience 14, 19–21. [DOI] [PMC free article] [PubMed] [Google Scholar]
- Bero AW, Bauer AQ, Stewart FR, White BR, Cirrito JR, Raichle ME, Culver JP, and Holtzman DM (2012). Bidirectional Relationship between Functional Connectivity and Amyloid-Deposition in Mouse Brain. Journal of Neuroscience 32, 4334–4340. [DOI] [PMC free article] [PubMed] [Google Scholar]
- Betzig E, Patterson GH, Sougrat R, Lindwasser OW, Olenych S, Bonifacino JS, Davidson MW, Lippincott-Schwartz J, and Hess HF (2006). Imaging Intracellular Fluorescent Proteins at Nanometer Resolution. Science 313, 1642–1645. [DOI] [PubMed] [Google Scholar]
- Bierbaum M, Leahy BD, Alemi AA, Cohen I, and Sethna JP (2017). Light Microscopy at Maximal Precision. Phys. Rev. X 7, 041007. [Google Scholar]
- Bigler ED (2013). Traumatic brain injury, neuroimaging, and neurodegeneration. Front Hum Neurosci 7. [DOI] [PMC free article] [PubMed] [Google Scholar]
- Bohland JW, Wu C, Barbas H, Bokil H, Bota M, Breiter HC, Cline HT, Doyle JC, Freed PJ, Greenspan RJ, et al. (2009). A Proposal for a Coordinated Effort for the Determination of Brainwide Neuroanatomical Connectivity in Model Organisms at a Mesoscopic Scale. PLOS Computational Biology 5, e1000334. [DOI] [PMC free article] [PubMed] [Google Scholar]
- Borchelt DR, Thinakaran G, Eckman CB, Lee MK, Davenport F, Ratovitsky T, Prada C-M, Kim G, Seekins S, Yager D, et al. (1996). Familial Alzheimer’s Disease–Linked Presenilin 1 Variants Elevate Aβ1–42/1–40 Ratio In Vitro and In Vivo. Neuron 17, 1005–1013. [DOI] [PubMed] [Google Scholar]
- Bourne JN, Chirillo MA, and Harris KM (2013). Presynaptic Ultrastructural Plasticity Along CA3→CA1 Axons During Long-Term Potentiation in Mature Hippocampus. Journal of Comparative Neurology 521, 3898–3912. [DOI] [PMC free article] [PubMed] [Google Scholar]
- Briggman KL, and Bock DD (2012). Volume electron microscopy for neuronal circuit reconstruction. Current Opinion in Neurobiology 22, 154–161. [DOI] [PubMed] [Google Scholar]
- Broadhead MJ, Horrocks MH, Zhu F, Muresan L, Benavides-Piccione R, DeFelipe J, Fricker D, Kopanitsa MV, Duncan RR, Klenerman D, et al. (2016). PSD95 nanoclusters are postsynaptic building blocks in hippocampus circuits. Scientific Reports 6, 24626. [DOI] [PMC free article] [PubMed] [Google Scholar]
- Castejòn OJ, Valero C, and Dìaz M. (1995). Synaptic degenerative changes in human traumatic brain edema. An electron microscopic study of cerebral cortical biopsies. J Neurosurg Sci 39, 47–65. [PubMed] [Google Scholar]
- Cesca F, Baldelli P, Valtorta F, and Benfenati F. (2010). The synapsins: Key actors of synapse function and plasticity. Progress in Neurobiology 91, 313–348. [DOI] [PubMed] [Google Scholar]
- Chauhan NB (2014). Chronic neurodegenerative consequences of traumatic brain injury. Restorative Neurology and Neuroscience 32, 337–365. [DOI] [PubMed] [Google Scholar]
- Cole JH, Jolly A, de Simoni S, Bourke N, Patel MC, Scott G, and Sharp DJ (2018). Spatial patterns of progressive brain volume loss after moderate-severe traumatic brain injury. Brain 141, 822–836. [DOI] [PMC free article] [PubMed] [Google Scholar]
- Collman F, Buchanan J, Phend KD, Micheva KD, Weinberg RJ, and Smith SJ (2015). Mapping Synapses by Conjugate Light-Electron Array Tomography. J. Neurosci 35, 5792–5807. [DOI] [PMC free article] [PubMed] [Google Scholar]
- Crocker JC, and Grier DG (1996). Methods of Digital Video Microscopy for Colloidal Studies. Journal of Colloid and Interface Science 179, 298–310. [Google Scholar]
- Dani A, Huang B, Bergan J, Dulac C, and Zhuang X. (2010). Superresolution Imaging of Chemical Synapses in the Brain. Neuron 68, 843–856. [DOI] [PMC free article] [PubMed] [Google Scholar]
- Danielson NB, Zaremba JD, Kaifosh P, Bowler J, Ladow M, and Losonczy A. (2016). Sublayer-specific coding dynamics during spatial navigation and learning in hippocampal area CA1. Neuron 91, 652–665. [DOI] [PMC free article] [PubMed] [Google Scholar]
- Davies CA, Mann DMA, Sumpter PQ, and Yates PO (1987). A quantitative morphometric analysis of the neuronal and synaptic content of the frontal and temporal cortex in patients with Alzheimer’s disease. Journal of the Neurological Sciences 78, 151–164. [DOI] [PubMed] [Google Scholar]
- Deerinck TJ, Bushong E, Thor A, Ellisman M, Deerinck T, Thor A, Deerinck TJ, Bushong EA, Thor CA, and Ellisman MH (2010). NCMIR methods for 3D EM: A new protocol for preparation of biological specimens for serial block face scanning electron microscopy. [Google Scholar]
- DeKosky ST, and Scheff SW (1990). Synapse loss in frontal cortex biopsies in Alzheimer’s disease: Correlation with cognitive severity. Ann Neurol. 27, 457–464. [DOI] [PubMed] [Google Scholar]
- Denk W, and Horstmann H. (2004). Serial Block-Face Scanning Electron Microscopy to Reconstruct Three-Dimensional Tissue Nanostructure. PLOS Biology 2, e329. [DOI] [PMC free article] [PubMed] [Google Scholar]
- Dong H, Martin MV, Chambers S, and Csernansky JG (2007). Spatial relationship between synapse loss and β-amyloid deposition in Tg2576 mice. Journal of Comparative Neurology 500, 311–321. [DOI] [PMC free article] [PubMed] [Google Scholar]
- Eisenstein M. (2015). Super-resolve me: from micro to nano. Nature 526, 459–462. [DOI] [PubMed] [Google Scholar]
- Emes RD, and Grant SGN (2012). Evolution of Synapse Complexity and Diversity. Annual Review of Neuroscience 35, 111–131. [DOI] [PubMed] [Google Scholar]
- Faden AI, and Loane DJ (2015). Chronic Neurodegeneration After Traumatic Brain Injury: Alzheimer Disease, Chronic Traumatic Encephalopathy, or Persistent Neuroinflammation? Neurotherapeutics 12, 143–150. [DOI] [PMC free article] [PubMed] [Google Scholar]
- Feng G, Mellor RH, Bernstein M, Keller-Peck C, Nguyen QT, Wallace M, Nerbonne JM, Lichtman JW, and Sanes JR (2000). Imaging Neuronal Subsets in Transgenic Mice Expressing Multiple Spectral Variants of GFP. Neuron 28, 41–51. [DOI] [PubMed] [Google Scholar]
- Ferro M, Lamanna J, Ripamonti M, Racchetti G, Arena A, Spadini S, Montesano G, Cortese R, Zimarino V, and Malgaroli A. (2017). Functional mapping of brain synapses by the enriching activity-marker SynaptoZip. Nat Commun 8. [DOI] [PMC free article] [PubMed] [Google Scholar]
- Fleminger S, Oliver DL, Lovestone S, Rabe-Hesketh S, and Giora A. (2003). Head injury as a risk factor for Alzheimer’s disease: the evidence 10 years on; a partial replication. Journal of Neurology, Neurosurgery & Psychiatry 74, 857–862. [DOI] [PMC free article] [PubMed] [Google Scholar]
- Fortin DA, Tillo SE, Yang G, Rah J-C, Melander JB, Bai S, Soler-Cedeno O, Qin M, Zemelman BV, Guo C, et al. (2014). Live Imaging of Endogenous PSD-95 Using ENABLED: A Conditional Strategy to Fluorescently Label Endogenous Proteins. Journal of Neuroscience 34, 16698–16712. [DOI] [PMC free article] [PubMed] [Google Scholar]
- Fremeau RT, Troyer MD, Pahner I, Nygaard GO, Tran CH, Reimer RJ, Bellocchio EE, Fortin D, Storm-Mathisen J, and Edwards RH (2001). The Expression of Vesicular Glutamate Transporters Defines Two Classes of Excitatory Synapse. Neuron 31, 247–260. [DOI] [PubMed] [Google Scholar]
- Gerth F, Jäpel M, Pechstein A, Kochlamazashvili G, Lehmann M, Puchkov D, Onofri F, Benfenati F, Nikonenko AG, Fredrich K, et al. (2017). Intersectin associates with synapsin and regulates its nanoscale localization and function. PNAS 114, 12057–12062. [DOI] [PMC free article] [PubMed] [Google Scholar]
- Gregor I, and Enderlein J. (2019). Image scanning microscopy. Current Opinion in Chemical Biology 51, 74–83. [DOI] [PubMed] [Google Scholar]
- Gürcan Ö (2014). Effective connectivity at synaptic level in humans: a review and future prospects. Biol Cybern 108, 713–733. [DOI] [PubMed] [Google Scholar]
- Harris KM, and Stevens JK (1989). Dendritic spines of CA 1 pyramidal cells in the rat hippocampus: serial electron microscopy with reference to their biophysical characteristics. J. Neurosci 9, 2982–2997. [DOI] [PMC free article] [PubMed] [Google Scholar]
- Hell SW, and Wichmann J. (1994). Breaking the diffraction resolution limit by stimulated emission: stimulated-emission-depletion fluorescence microscopy. Opt. Lett., OL 19, 780–782. [DOI] [PubMed] [Google Scholar]
- Henstridge CM, Pickett E, and Spires-Jones TL (2016). Synaptic pathology: A shared mechanism in neurological disease. Ageing Research Reviews 28, 72–84. [DOI] [PubMed] [Google Scholar]
- Hess ST, Girirajan TPK, and Mason MD (2006). Ultra-High Resolution Imaging by Fluorescence Photoactivation Localization Microscopy. Biophysical Journal 91, 4258–4272. [DOI] [PMC free article] [PubMed] [Google Scholar]
- Hill CS, Coleman MP, and Menon DK (2016). Traumatic Axonal Injury: Mechanisms and Translational Opportunities. Trends in Neurosciences 39, 311–324. [DOI] [PMC free article] [PubMed] [Google Scholar]
- Holtzman DM, Morris JC, and Goate AM (2011). Alzheimer’s Disease: The Challenge of the Second Century. Science Translational Medicine 3, 77sr1–77sr1. [DOI] [PMC free article] [PubMed] [Google Scholar]
- Hu B, Nikolakopoulou AM, and Cohen-Cory S. (2005). BDNF stabilizes synapses and maintains the structural complexity of optic axons in vivo. Development 132, 4285–4298. [DOI] [PubMed] [Google Scholar]
- Huff J. (2015). The Airyscan detector from ZEISS: confocal imaging with improved signal-to-noise ratio and super-resolution. Nat Meth 12. [Google Scholar]
- Huff J, Bergter A, Birkenbeil J, Kleppe I, and Engelmann R. The New 2D Superresolution Mode for ZEISS Airyscan – 120 nm Lateral Resolution without Acquiring a Z-stack. 6. [Google Scholar]
- Igarashi KM, Ito HT, Moser EI, and Moser M-B (2014). Functional diversity along the transverse axis of hippocampal area CA1. FEBS Letters 588, 2470–2476. [DOI] [PubMed] [Google Scholar]
- Ikonomovic MD, Mi Z, and Abrahamson EE (2017). Disordered APP metabolism and neurovasculature in trauma and aging: Combined risks for chronic neurodegenerative disorders. Ageing Res Rev 34, 51–63. [DOI] [PMC free article] [PubMed] [Google Scholar]
- Jankowsky JL, Slunt HH, Ratovitski T, Jenkins NA, Copeland NG, and Borchelt DR (2001). Co-expression of multiple transgenes in mouse CNS: a comparison of strategies. Biomol. Eng 17, 157–165. [DOI] [PubMed] [Google Scholar]
- Kasthuri N, Hayworth KJ, Berger DR, Schalek RL, Conchello JA, Knowles-Barley S, Lee D, Vázquez-Reina A, Kaynig V, Jones TR, et al. (2015). Saturated Reconstruction of a Volume of Neocortex. Cell 162, 648–661. [DOI] [PubMed] [Google Scholar]
- Ke M-T, Nakai Y, Fujimoto S, Takayama R, Yoshida S, Kitajima TS, Sato M, and Imai T. (2016). Super-Resolution Mapping of Neuronal Circuitry With an Index-Optimized Clearing Agent. Cell Reports 14, 2718–2732. [DOI] [PubMed] [Google Scholar]
- Keith D, and El-Husseini A. (2008). Excitation Control: Balancing PSD-95 Function at the Synapse. Front Mol Neurosci 1. [DOI] [PMC free article] [PubMed] [Google Scholar]
- Knott G, Marchman H, Wall D, and Lich B. (2008). Serial Section Scanning Electron Microscopy of Adult Brain Tissue Using Focused Ion Beam Milling. J. Neurosci 28, 2959–2964. [DOI] [PMC free article] [PubMed] [Google Scholar]
- Koffie RM, Meyer-Luehmann M, Hashimoto T, Adams KW, Mielke ML, Garcia-Alloza M, Micheva KD, Smith SJ, Kim ML, Lee VM, et al. (2009). Oligomeric amyloid β associates with postsynaptic densities and correlates with excitatory synapse loss near senile plaques. PNAS 106, 4012–4017. [DOI] [PMC free article] [PubMed] [Google Scholar]
- Koffie RM, Hyman BT, and Spires-Jones TL (2011). Alzheimer’s disease: synapses gone cold. Molecular Neurodegeneration 6, 63. [DOI] [PMC free article] [PubMed] [Google Scholar]
- Korogod N, Petersen CC, and Knott GW Ultrastructural analysis of adult mouse neocortex comparing aldehyde perfusion with cryo fixation. ELife 4. [DOI] [PMC free article] [PubMed] [Google Scholar]
- Kuljis RO, Xu Y, Aguila MC, and Baltimore D. (1997). Degeneration of neurons, synapses, and neuropil and glial activation in a murine Atm knockout model of ataxia–telangiectasia. PNAS 94, 12688–12693. [DOI] [PMC free article] [PubMed] [Google Scholar]
- Kummer TT, Magnoni S, MacDonald CL, Dikranian K, Milner E, Sorrell J, Conte V, Benetatos JJ, Zipfel GJ, and Brody DL (2015). Experimental subarachnoid haemorrhage results in multifocal axonal injury. Brain 138, 2608–2618. [DOI] [PMC free article] [PubMed] [Google Scholar]
- Lambert TJ, and Waters JC (2016). Navigating challenges in the application of superresolution microscopy. J Cell Biol jcb.201610011. [DOI] [PMC free article] [PubMed] [Google Scholar]
- Langlois JAS, Rutland-Brown W, and Wald MMM (2006). The Epidemiology and Impact of Traumatic Brain Injury: A Brief Overview. Journal of Head Trauma Rehabilitation Highlights From the 2nd Federal TBI Interagency Conference 21, 375–378. [DOI] [PubMed] [Google Scholar]
- Lassmann H, Fischer P, and Jellinger K. (1993). Synaptic Pathology of Alzheimer’s Diseasea. Annals of the New York Academy of Sciences 695, 59–64. [DOI] [PubMed] [Google Scholar]
- Lein ES, Hawrylycz MJ, Ao N, Ayres M, Bensinger A, Bernard A, Boe AF, Boguski MS, Brockway KS, Byrnes EJ, et al. (2007). Genome-wide atlas of gene expression in the adult mouse brain. Nature 445, 168–176. [DOI] [PubMed] [Google Scholar]
- Leranth C, Hajszan T, Szigeti-Buck K, Bober J, and MacLusky NJ (2008). Bisphenol A prevents the synaptogenic response to estradiol in hippocampus and prefrontal cortex of ovariectomized nonhuman primates. Proc. Natl. Acad. Sci. U.S.A 105, 14187–14191. [DOI] [PMC free article] [PubMed] [Google Scholar]
- Long JM, and Holtzman DM (2019). Alzheimer Disease: An Update on Pathobiology and Treatment Strategies. Cell 179, 312–339. [DOI] [PMC free article] [PubMed] [Google Scholar]
- Lujan R, Roberts JDB, Shigemoto R, Ohishi H, and Somogyi P. (1997). Differential plasma membrane distribution of metabotropic glutamate receptors mGluR1h, mGluR2 and mGluR5, relative to neurotransmitter release sites. Journal of Chemical Neuroanatomy 23. [DOI] [PubMed] [Google Scholar]
- Mallucci GR (2009). Prion neurodegeneration. Prion 3, 195–201. [DOI] [PMC free article] [PubMed] [Google Scholar]
- Masch J-M, Steffens H, Fischer J, Engelhardt J, Hubrich J, Keller-Findeisen J, D’Este E, Urban NT, Grant SGN, Sahl SJ, et al. (2018). Robust nanoscopy of a synaptic protein in living mice by organic-fluorophore labeling. PNAS 115, E8047–E8056. [DOI] [PMC free article] [PubMed] [Google Scholar]
- Masliah E, Terry RD, DeTeresa RM, and Hansen LA (1989). Immunohistochemical quantification of the synapse-related protein synaptophysin in Alzheimer disease. Neuroscience Letters 103, 234–239. [DOI] [PubMed] [Google Scholar]
- Masliah E, Hansen L, Albright T, Mallory M, and Terry RD (1991). Immunoelectron microscopic study of synaptic pathology in Alzheimer’s disease. Acta Neuropathol 81, 428–433. [DOI] [PubMed] [Google Scholar]
- Matti U, Pattu V, Halimani M, Schirra C, Krause E, Liu Y, Weins L, Fang Chang H, Guzman R, Olausson J, et al. (2013). Synaptobrevin2 is the v-SNARE required for cytotoxic T-lymphocyte lytic granule fusion. Nature Communications 4, 1439. [DOI] [PubMed] [Google Scholar]
- McKee AC, Stein TD, Nowinski CJ, Stern RA, Daneshvar DH, Alvarez VE, Lee H-S, Hall G, Wojtowicz SM, Baugh CM, et al. (2012). The spectrum of disease in chronic traumatic encephalopathy. Brain. [DOI] [PMC free article] [PubMed] [Google Scholar]
- McKee AC, Stein TD, Kiernan PT, and Alvarez VE (2015). The Neuropathology of Chronic Traumatic Encephalopathy. Brain Pathology 25, 350–364. [DOI] [PMC free article] [PubMed] [Google Scholar]
- Micheva KD, and Smith SJ (2007). Array Tomography: A New Tool for Imaging the Molecular Architecture and Ultrastructure of Neural Circuits. Neuron 55, 25–36. [DOI] [PMC free article] [PubMed] [Google Scholar]
- Micheva KD, Busse B, Weiler NC, O’Rourke N, and Smith SJ (2010). Single-Synapse Analysis of a Diverse Synapse Population: Proteomic Imaging Methods and Markers. Neuron 68, 639–653. [DOI] [PMC free article] [PubMed] [Google Scholar]
- Morrison JH, and Baxter MG (2012). The Aging Cortical Synapse: Hallmarks and Implications for Cognitive Decline. Nat Rev Neurosci 13, 240–250. [DOI] [PMC free article] [PubMed] [Google Scholar]
- Namjoshi DR, Cheng WH, McInnes KA, Martens KM, Carr M, Wilkinson A, Fan J, Robert J, Hayat A, Cripton PA, et al. (2014). Merging pathology with biomechanics using CHIMERA (Closed-Head Impact Model of Engineered Rotational Acceleration): a novel, surgery-free model of traumatic brain injury. Molecular Neurodegeneration 9, 55. [DOI] [PMC free article] [PubMed] [Google Scholar]
- Nordström A, and Nordström P. (2018). Traumatic brain injury and the risk of dementia diagnosis: A nationwide cohort study. PLOS Medicine 15, e1002496. [DOI] [PMC free article] [PubMed] [Google Scholar]
- O’Rourke NA, Weiler NC, Micheva KD, and Smith SJ (2012). Deep molecular diversity of mammalian synapses: why it matters and how to measure it. Nature Reviews Neuroscience 13, 365–379. [DOI] [PMC free article] [PubMed] [Google Scholar]
- Paquet M, and Smith Y. (2003). Group I Metabotropic Glutamate Receptors in the Monkey Striatum: Subsynaptic Association with Glutamatergic and Dopaminergic Afferents. J. Neurosci 23, 7659–7669. [DOI] [PMC free article] [PubMed] [Google Scholar]
- Perez EJ, Cepero ML, Perez SU, Coyle JT, Sick TJ, and Liebl DJ (2016). EphB3 signaling propagates synaptic dysfunction in the traumatic injured brain. Neurobiology of Disease 94, 73–84. [DOI] [PMC free article] [PubMed] [Google Scholar]
- Perez-Alvarez A, Fearey B, Schulze C, O’Toole RJ, Moeyaert B, Mohr MA, Arganda-Carreras I, Yang W, Wiegert JS, Schreiter ER, et al. (2019). Freeze-frame imaging of synaptic activity using SynTagMA. BioRxiv 538041. [DOI] [PMC free article] [PubMed] [Google Scholar]
- Plassman BL, Havlik RJ, Steffens DC, Helms MJ, Newman TN, Drosdick D, Phillips C, Gau BA, Welsh–Bohmer KA, Burke JR, et al. (2000). Documented head injury in early adulthood and risk of Alzheimer’s disease and other dementias. Neurology 55, 1158–1166. [DOI] [PubMed] [Google Scholar]
- Przekwas A, Somayaji MR, and Gupta RK (2016). Synaptic Mechanisms of Blast-Induced Brain Injury. Front. Neurol 2. [DOI] [PMC free article] [PubMed] [Google Scholar]
- Reiner A, and Levitz J. (2018). Glutamatergic Signaling in the Central Nervous System: Ionotropic and Metabotropic Receptors in Concert. Neuron 98, 1080–1098. [DOI] [PMC free article] [PubMed] [Google Scholar]
- Renner M, Lacor PN, Velasco PT, Xu J, Contractor A, Klein WL, and Triller A. (2010). Deleterious Effects of Amyloid β Oligomers Acting as an Extracellular Scaffold for mGluR5. Neuron 66, 739–754. [DOI] [PMC free article] [PubMed] [Google Scholar]
- Ribeiro FM, Vieira LB, Pires RGW, Olmo RP, and Ferguson SSG (2017). Metabotropic glutamate receptors and neurodegenerative diseases. Pharmacological Research 115, 179–191. [DOI] [PubMed] [Google Scholar]
- Richardson DS, and Lichtman JW (2015). Clarifying Tissue Clearing. Cell 162, 246–257. [DOI] [PMC free article] [PubMed] [Google Scholar]
- Rodrigues SM, Bauer EP, Farb CR, Schafe GE, and LeDoux JE (2002). The Group I Metabotropic Glutamate Receptor mGluR5 Is Required for Fear Memory Formation and Long-Term Potentiation in the Lateral Amygdala. J. Neurosci 22, 5219–5229. [DOI] [PMC free article] [PubMed] [Google Scholar]
- Rollenhagen A, and Lübke JHR (2010). The Mossy Fiber Bouton: the “Common” or the “Unique” Synapse? Front Synaptic Neurosci 2. [DOI] [PMC free article] [PubMed] [Google Scholar]
- Rust MJ, Bates M, and Zhuang X. (2006). Sub-diffraction-limit imaging by stochastic optical reconstruction microscopy (STORM). Nature Methods 3, 793. [DOI] [PMC free article] [PubMed] [Google Scholar]
- Saito T, Matsuba Y, Mihira N, Takano J, Nilsson P, Itohara S, Iwata N, and Saido TC (2014). Single App knock-in mouse models of Alzheimer’s disease. Nat Neurosci 17, 661–663. [DOI] [PubMed] [Google Scholar]
- Santuy A, Rodriguez JR, DeFelipe J, and Merchan-Perez A. (2018). Volume electron microscopy of the distribution of synapses in the neuropil of the juvenile rat somatosensory cortex. Brain Struct Funct 223, 77–90. [DOI] [PMC free article] [PubMed] [Google Scholar]
- Sauerbeck AD, Fanizzi C, Kim JH, Gangolli M, Bayly PV, Wellington CL, Brody DL, and Kummer TT (2018). modCHIMERA: a novel murine closed-head model of moderate traumatic brain injury. Scientific Reports 8, 7677. [DOI] [PMC free article] [PubMed] [Google Scholar]
- Scheff S. (2003). Synaptic pathology in Alzheimer’s disease: a review of ultrastructural studies. Neurobiology of Aging 24, 1029–1046. [DOI] [PubMed] [Google Scholar]
- Scheff SW, and Price DA (1993). Synapse loss in the temporal lobe in Alzheimer’s disease. Annals of Neurology 33, 190–199. [DOI] [PubMed] [Google Scholar]
- Scheff S. w., Price D. a., Hicks R. r., Baldwin S. a., Robinson S, and Brackney C. (2005). Synaptogenesis in the Hippocampal CA1 Field following Traumatic Brain Injury. Journal of Neurotrauma 22, 719–732. [DOI] [PubMed] [Google Scholar]
- Scheff SW, Price DA, Schmitt FA, DeKosky ST, and Mufson EJ (2007). Synaptic alterations in CA1 in mild Alzheimer disease and mild cognitive impairment. Neurology 68, 1501–1508. [DOI] [PubMed] [Google Scholar]
- Schikorski T, and Stevens CF (1997). Quantitative Ultrastructural Analysis of Hippocampal Excitatory Synapses. J. Neurosci 17, 5858–5867. [DOI] [PMC free article] [PubMed] [Google Scholar]
- Selkoe DJ (2002). Alzheimer’s Disease Is a Synaptic Failure. Science 298, 789–791. [DOI] [PubMed] [Google Scholar]
- Shahim P, Tegner Y, Marklund N, Höglund K, Portelius E, Brody DL, Blennow K, and Zetterberg H. (2017). Astroglial activation and altered amyloid metabolism in human repetitive concussion. Neurology 88, 1400–1407. [DOI] [PMC free article] [PubMed] [Google Scholar]
- Sheppard CJR (1988). Super-resolution in confocal imaging. Optik (Jena) 80, 53–54. [Google Scholar]
- Shostak Y, Wenger A, Mavity-Hudson J, and Casagrande VA (2014). Metabotropic glutamate receptor 5 shows different patterns of localization within the parallel visual pathways in macaque and squirrel monkeys. Eye Brain 6, 29–43. [DOI] [PMC free article] [PubMed] [Google Scholar]
- Sporns O, Tononi G, and Kötter R. (2005). The human connectome: A structural description of the human brain. PLoS Comput. Biol 1, e42. [DOI] [PMC free article] [PubMed] [Google Scholar]
- Swanson LW, and Lichtman JW (2016). From Cajal to Connectome and Beyond. Annual Review of Neuroscience 39, 197–216. [DOI] [PubMed] [Google Scholar]
- Takamori S, Holt M, Stenius K, Lemke EA, Grønborg M, Riedel D, Urlaub H, Schenck S, Brügger B, Ringler P, et al. (2006). Molecular Anatomy of a Trafficking Organelle. Cell 127, 831–846. [DOI] [PubMed] [Google Scholar]
- Tang A-H, Chen H, Li TP, Metzbower SR, MacGillavry HD, and Blanpied TA (2016). A trans-synaptic nanocolumn aligns neurotransmitter release to receptors. Nature 536, 210–214. [DOI] [PMC free article] [PubMed] [Google Scholar]
- Terry RD, Masliah E, Salmon DP, Butters N, DeTeresa R, Hill R, Hansen LA, and Katzman R. (1991). Physical basis of cognitive alterations in alzheimer’s disease: Synapse loss is the major correlate of cognitive impairment. Ann Neurol. 30, 572–580. [DOI] [PubMed] [Google Scholar]
- Thiel G. (1993). Synapsin I, Synapsin II, and Synaptophysin: Marker Proteins of Synaptic Vesicles. Brain Pathology 3, 87–95. [DOI] [PubMed] [Google Scholar]
- Tran HT, LaFerla FM, Holtzman DM, and Brody DL (2011a). Controlled Cortical Impact Traumatic Brain Injury in 3xTg-AD Mice Causes Acute Intra-axonal Amyloid-beta Accumulation and Independently Accelerates the Development of Tau Abnormalities. J Neurosci 31, 9513–9525. [DOI] [PMC free article] [PubMed] [Google Scholar]
- Tran HT, Sanchez L, Esparza TJ, and Brody DL (2011b). Distinct Temporal and Anatomical Distributions of Amyloid-β and Tau Abnormalities following Controlled Cortical Impact in Transgenic Mice. PLoS One 6. [DOI] [PMC free article] [PubMed] [Google Scholar]
- Um JW, Kaufman AC, Kostylev M, Heiss JK, Stagi M, Takahashi H, Kerrisk ME, Vortmeyer A, Wisniewski T, Koleske AJ, et al. (2013). Metabotropic Glutamate Receptor 5 Is a Coreceptor for Alzheimer Aβ Oligomer Bound to Cellular Prion Protein. Neuron 79, 887–902. [DOI] [PMC free article] [PubMed] [Google Scholar]
- Vascak M, Sun J, Baer M, Jacobs KM, and Povlishock JT (2017). Mild Traumatic Brain Injury Evokes Pyramidal Neuron Axon Initial Segment Plasticity and Diffuse Presynaptic Inhibitory Terminal Loss. Front. Cell. Neurosci 11. [DOI] [PMC free article] [PubMed] [Google Scholar]
- Walker KR, and Tesco G. (2013). Molecular mechanisms of cognitive dysfunction following traumatic brain injury. Front Aging Neurosci 5. [DOI] [PMC free article] [PubMed] [Google Scholar]
- Wang C-C, Held RG, Chang S-C, Yang L, Delpire E, Ghosh A, and Hall BJ (2011). A Critical Role for GluN2B-Containing NMDA Receptors in Cortical Development and Function. Neuron 72, 789–805. [DOI] [PubMed] [Google Scholar]
- Winston CN, Chellappa D, Wilkins T, Barton DJ, Washington PM, Loane DJ, Zapple DN, and Burns MP (2013). Controlled Cortical Impact Results in an Extensive Loss of Dendritic Spines that Is Not Mediated by Injury-Induced Amyloid-Beta Accumulation. Journal of Neurotrauma 30, 1966–1972. [DOI] [PMC free article] [PubMed] [Google Scholar]
- Yoshiyama Y, Higuchi M, Zhang B, Huang S-M, Iwata N, Saido TC, Maeda J, Suhara T, Trojanowski JQ, and Lee VM-Y (2007). Synapse Loss and Microglial Activation Precede Tangles in a P301S Tauopathy Mouse Model. Neuron 53, 337–351. [DOI] [PubMed] [Google Scholar]
- Zhu F, Cizeron M, Qiu Z, Benavides-Piccione R, Kopanitsa MV, Skene NG, Koniaris B, DeFelipe J, Fransén E, Komiyama NH, et al. (2018). Architecture of the Mouse Brain Synaptome. Neuron 99, 781–799.e10. [DOI] [PMC free article] [PubMed] [Google Scholar]
- (2002). Ripley’s K function. Encyclopedia of Environmetrics.
Associated Data
This section collects any data citations, data availability statements, or supplementary materials included in this article.
Supplementary Materials
Data Availability Statement
The code generated during this study is available on GitHub at https://github.com/KummerLab/SEQUIN.