Abstract
Bacterial toxins represent a vast reservoir of biochemical diversity that can be repurposed for biomedical applications. Such proteins include a group of predicted interbacterial toxins of the deaminase superfamily, members of which have found application in gene-editing techniques1,2. Since previously described cytidine deaminases operate on single-stranded nucleic acids3, their use in base editing requires the unwinding of double-stranded DNA (dsDNA), for example, by a CRISPR–Cas9 system. Base editing within mitochondrial DNA (mtDNA), however, has thus far been hindered by challenges associated with the delivery of guide RNA into the mitochondria4. Here we describe an interbacterial toxin, which we named DddA, that catalyses the deamination of cytidines within dsDNA. We engineered split-DddA halves that are non-toxic and inactive until brought together on target DNA by adjacently bound programmable DNA-binding proteins. Fusions of the split-DddA halves, transcription activator-like effector array proteins, and a uracil glycosylase inhibitor resulted in RNA-free DddA-derived cytosine base editors (DdCBEs) that catalyse C•G-to-T•A conversions in human mtDNA with high target specificity and product purity. We used DdCBEs to model a disease-associated mtDNA mutation in human cells, resulting in changes in respiration rates and oxidative phosphorylation. CRISPR-free DdCBEs enable the precise manipulation of mtDNA, rather than the elimination of mtDNA copies that results from its cleavage by targeted nucleases, with broad implications for the study and potential treatment of mitochondrial disorders.
Reporting summary
Further information on research design is available in the Nature Research Reporting Summary linked to this paper.
Inherited or acquired mutations in mtDNA are associated with a range of human diseases5,6. Tools for introducing specific modifications into mtDNA are urgently needed both to model and to potentially treat these diseases. The development of such tools, however, has been hindered by the challenge of transporting RNAs into mitochondria, including guide RNAs that are required to program CRISPR-associated proteins4.
Each mammalian cell contains many copies of a circular mtDNA that can exist in a heteroplasmic mixture of wild-type and mutant alleles7. Current approaches to manipulate mtDNA rely on RNA-free programmable nucleases, such as transcription activator-like effector nucleases (TALENs)8,9 and zinc finger nucleases10, fused to mitochondrial targeting signal (MTS) sequences to induce double-strand breaks in mtDNA. Linearized mtDNA is rapidly degraded11,12, resulting in heteroplasmic shifts to favour uncut mtDNA genomes. As a candidate therapeutic or disease-modelling tool, this approach cannot introduce specific nucleotide changes in mtDNA, and cannot be applied to homoplasmic mtDNA mutations because destroying all mtDNA copies is presumed to be harmful7.
An alternative to the targeted destruction of mtDNA through double-strand breaks is precision genome editing, a capability that—to the best of our knowledge—has not been previously reported for mtDNA. The ability to precisely install or correct pathogenic mutations could accelerate the modelling of diseases caused by mtDNA mutations, facilitate preclinical drug candidate testing, and potentially enable therapeutic approaches that directly correct pathogenic mtDNA mutations. Although cytidine and adenosine deaminases are important for precision genome editing by enabling base editing in the nucleus1,2,13,14, their biochemical and functional diversity remain largely unexplored. Bacterial genomes contain various uncharacterized deaminases15, raising the possibility that some may possess unique activities that enable new genome-editing capabilities.
An interbacterial deaminase-like toxin
Some predicted bacterial deaminases contain sequences that suggest them to be substrates for intercellular protein delivery systems, such as the type VI secretion system (T6SS)15. This system mediates antagonism between Gram-negative bacteria by transferring antibacterial toxins into contacting cells16,17. Given their sequence divergence from characterized deaminases, we sought to define the biochemical activity of T6SS-associated deaminases. We focused on a predicted deaminase belonging to the SCP1.201-like family15, henceforth referred to as DddA, encoded by Burkholderia cenocepacia (Fig. 1a). A B. cenocepacia strain lacking dddA and the downstream predicted immunity gene (dddIA) exhibited a marked growth defect when co-cultivated with the wild-type strain (Fig. 1b, Extended Data Fig. 1a, b). This defect was not observed in co-culture with a strain that lacked the activity of a T6SS (ΔicmF1) or a strain that expressed DddA containing an amino acid substitution of a predicted catalytic residue (dddAE1347A) . These data establish DddA as a T6SS-delivered antibacterial toxin.
Fig. 1 |. DddA is a double-stranded DNA cytidine deaminase that mediates T6SS-dependent interbacterial antagonism.
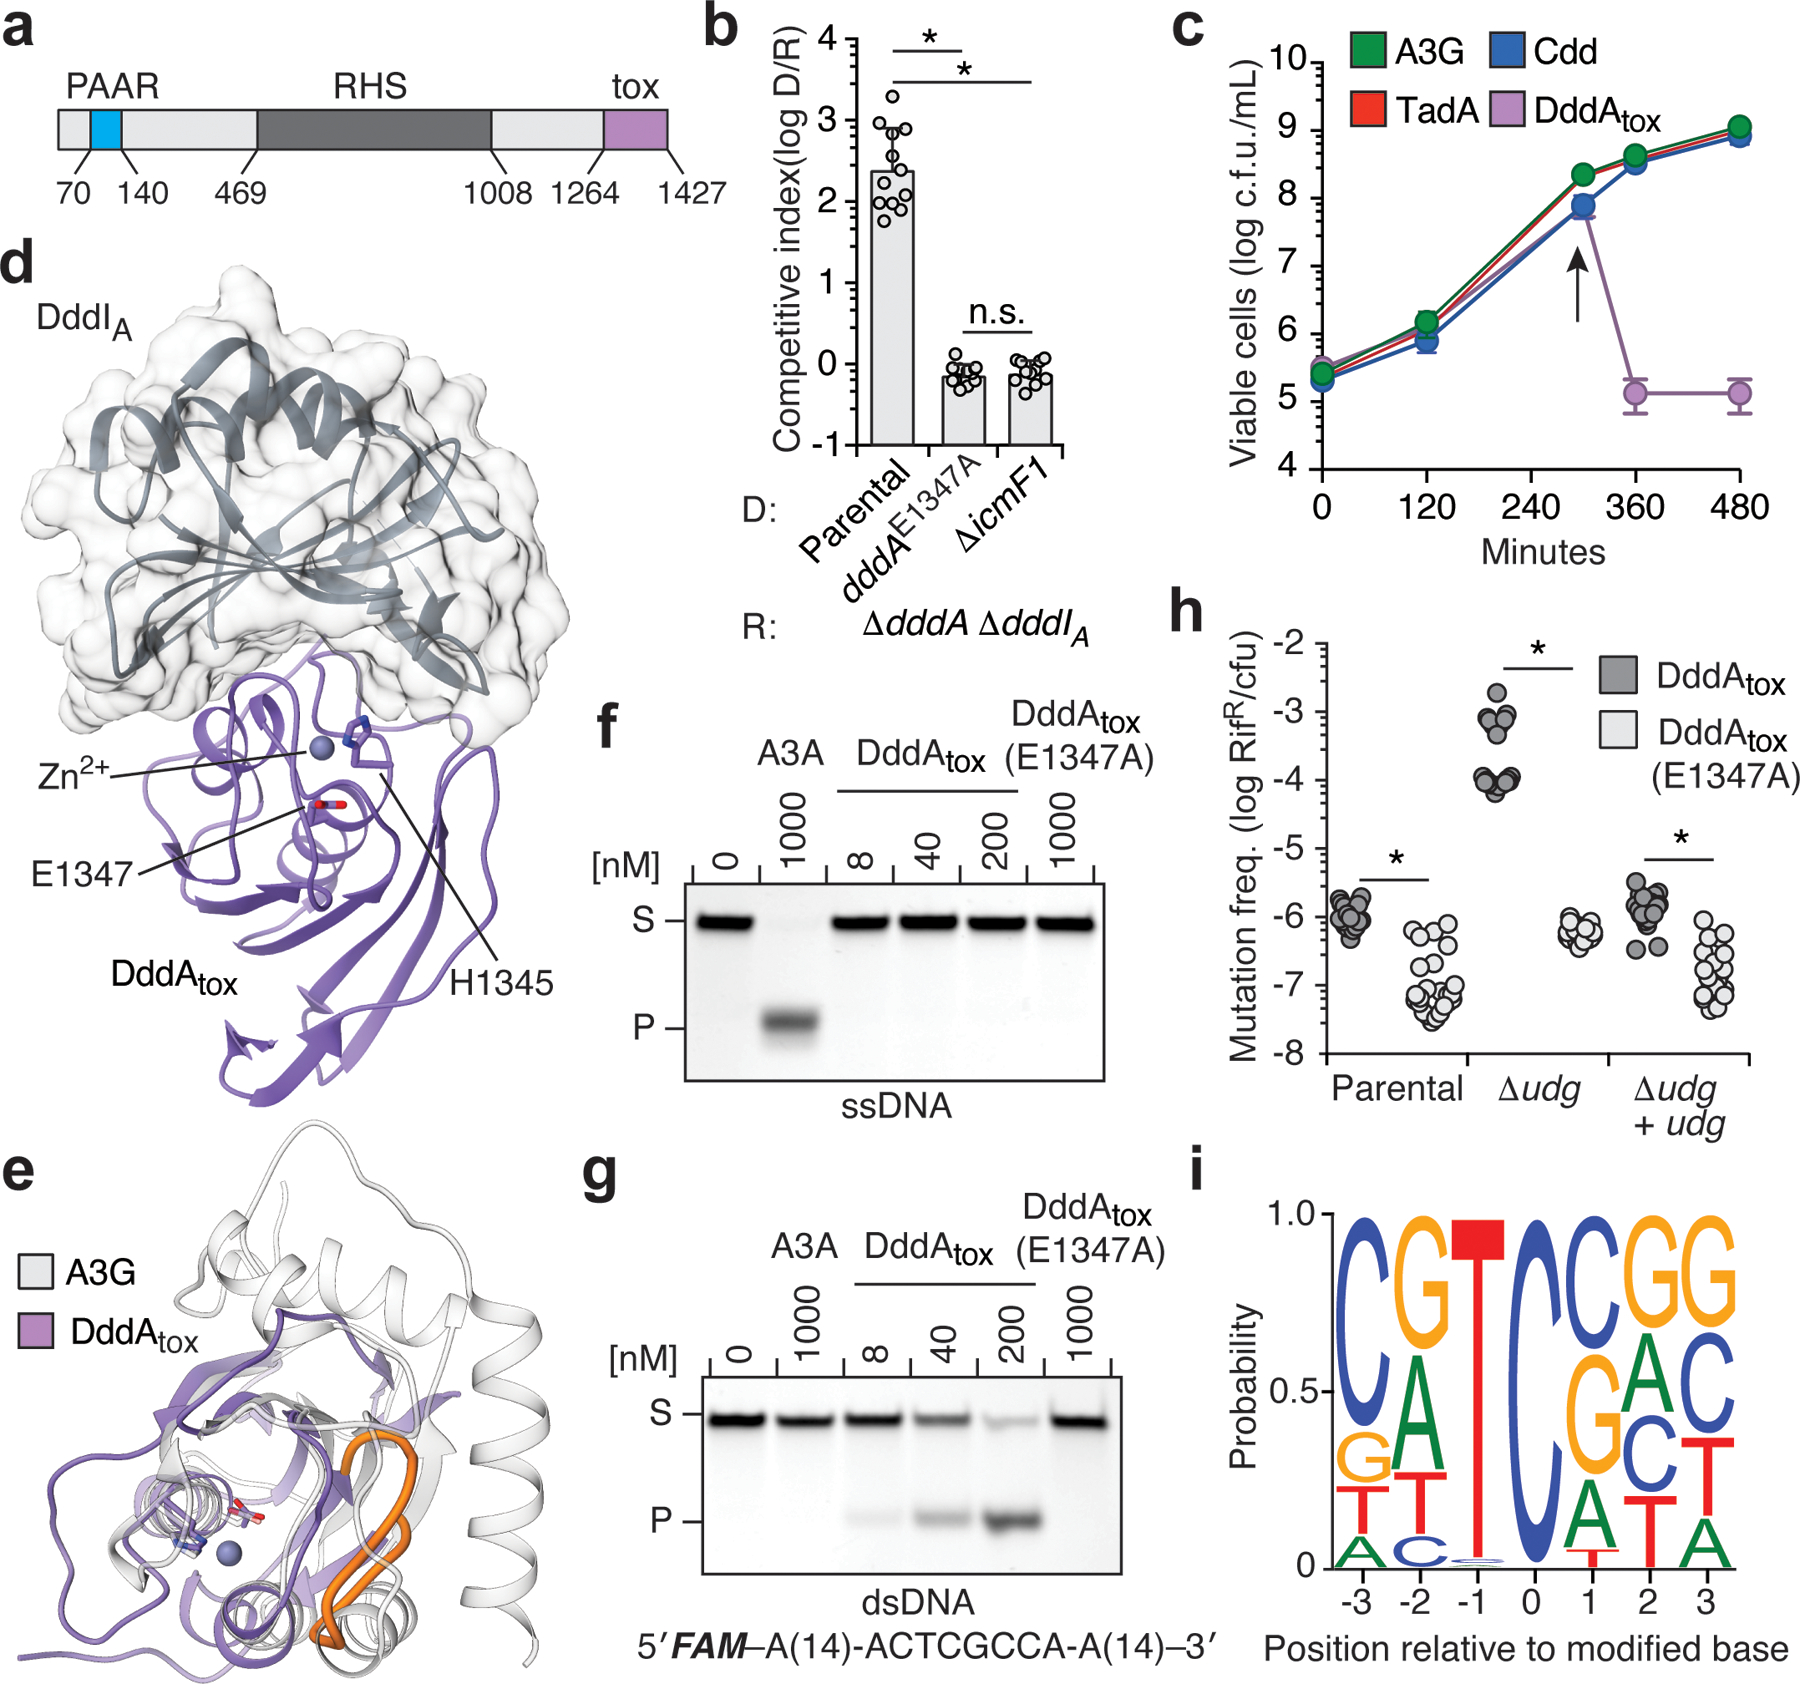
a, Domains of full-length DddA. PAAR, proline-alanine-alanine-arginine; RHS, rearrangement hotspot; Tox, toxin domain. b, Competitiveness of the indicated donor B. cenocepacia strains (D) towards the B. cenocepacia ΔdddAΔdddIA recipient strain (R). c, Viability of E. coli populations expressing the indicated deaminases, induced at 300 min (arrow). A3G, APOBEC3G; Cdd, E. coli cytidine deaminase; TadA, tRNA adenosine deaminase A; cfu, colony-forming units. d, Crystal structure of DddAtox (purple) complexed with DddIA (grey). e, Structural alignment of DddAtox (purple) and APOBEC3G (white). The intervening loop of DddAtox that is absent in APOBEC3G is shown in orange. f, g, In vitro cytidine deamination assays using a single-stranded (f) or double-stranded (g) 36-nt 6-carboxyfluorescein (FAM)-labelled DNA substrate (S), which contains AC, TC, CC and GC as indicated in g. Cytidine deamination leads to products (P) with increased mobility. A3A, APOBEC3A. Gels are representative of three replicates. h, Mutation frequency in E. coli strains expressing DddAtox or catalytically inactive DddAtox(E1347A). pBAD24::udg was used for complementation of Δudg (+udg). Values are derived from eight independent biological replicates. RifR, rifampicin resistant colonies. i, Probability sequence logo of the region flanking mutated cytosines in five E. coli Δudg isolates serially exposed to a low level of DddAtox. Values and error bars reflect mean ± s.d. of n = 4 (in b) or n = 3 (in c) independent biological replicates. *P < 0.0001; NS, not significant (P > 0.05) by Student’s unpaired two-tailed t-test.
Members of the deaminase superfamily are known to catalyse the deamination of single-stranded DNA (ssDNA), RNA, free nucleosides, nucleotides, nucleobases and other nucleotide derivatives15. To define the substrate of DddA, which belongs to a clade of predicted deaminases that lack a characterized member15, we first determined whether deaminases that represent the substrate range of the superfamily are toxic if expressed in bacteria. The growth of Escherichia coli was unaffected by the production of deaminases that act on ssDNA, tRNA or free cytidine (Fig. 1c). By contrast, DddA markedly reduced the viability of E. coli (Fig. 1c, Extended Data Fig. 1c). We identified amino acids 1264–1427 of DddA as the domain that confers toxicity, referred to henceforth as DddAtox (see Methods for details of the identification of the toxin domain). These findings suggested that DddA may act on a previously undescribed deaminase substrate.
DddA is a double-stranded DNA deaminase
To further clarify the substrate and mechanism of DddAtox, we determined a co-crystal structure of DddAtox bound to the immunity protein DddIA at 2.5 Å resolution (Supplementary Table 1). DddAtox adopts a typical deaminase fold consisting of a five-stranded β-sheet with buttressing helices that contribute catalytic residues (Fig. 1d). DddIA contains a central β-sheet that occludes the active site of DddAtox (Fig. 1d). Structure-based homology searches revealed APOBEC enzymes as the closest structural relatives of DddAtox, with divergence at the C-terminal β-strands; these strands are antiparallel with an extended intervening loop in DddAtox, whereas they are parallel with an intervening α-helix in APOBEC enzymes (Fig. 1d, e).
So far, all reported DNA cytidine deaminases operate predominantly on ssDNA, often with a preference for the base immediately 5′ of the substrate C1. We measured the in vitro activity of DddAtox on a ssDNA substrate containing cytosine in all four possible 5′-NC contexts. Whereas the activity of APOBEC3A was readily detected, DddAtox did not catalyse uracil formation within ssDNA sequences (Fig. 1f). As a control, we included a related dsDNA substrate. Consistent with previous studies18, APOBEC3A did not display measurable activity against dsDNA. Unexpectedly, however, DddAtox efficiently converted cytosine to uracil within dsDNA (Fig. 1g, Extended Data Fig. 1d). The catalytically inactive enzyme, DddAtox(E1347A), showed no uracil formation, indicating that deamination was dependent on the activity of DddAtox. We did not detect deamination of single-stranded or double-stranded RNA substrates by DddAtox (Extended Data Fig. 1e, f). These results collectively establish DddAtox as a cytidine deaminase that operates preferentially on dsDNA; the enzyme was therefore named ‘double-stranded DNA deaminase toxin A’, or DddA.
If DddAtox converts cytosine to uracil specifically within dsDNA, the enzyme should be mutagenic in a manner that is dependent on uracil DNA glycosylase (UDG), which initiates base excision repair through uracil removal19. Indeed, expression of sub-lethal levels of DddAtox in E. coli substantially increased the mutation frequency, and these mutagenic effects of DddAtox were enhanced more than 100-fold in an E. coli strain lacking UDG (Fig. 1h). We next used the high mutation rate caused by sub-lethal DddAtox levels to profile the sequence context preference of the enzyme. We performed whole-genome sequencing on five E. coli lineages that experienced serial DddAtox exposure and clonal bottlenecking, and five control strains that underwent a similar regimen in the presence of DddAtox(E1347A). Consistent with our mutation-frequency measurements, we observed approximately 50-fold more total single-nucleotide polymorphisms (SNPs) in strains exposed to active DddAtox (997) than in strains producing the inactive enzyme (17), and more than 99% of the DddAtox-dependent SNPs were C•G-to-T•A transitions (Extended Data Fig. 2a–c). The alignment of sequences flanking the converted cytosine within these C•G-to-T•A mutations revealed a strong preference for 5′-TC contexts (Fig. 1i), matching the sequence preference of the enzyme in vitro (Extended Data Fig. 2d). Together, these findings reveal that DddAtox deaminates dsDNA substrates in vitro and in bacterial cells with a preference for 5′-TC contexts.
Splitting DddAtox into non-toxic halves
Current base editors deaminate nucleotides in ssDNA loops created by RNA-guided CRISPR proteins1,13,14. The ability of DddAtox to deaminate cytidines in dsDNA raises the possibility of using RNA-free programmable dsDNA-binding proteins, such as zinc-finger arrays20 or TALE repeat arrays21, to direct DddAtox to mtDNA targets without requiring CRISPR or guide RNAs.
As expected (Fig. 1b, c), the expression of intact DddAtox fused to programmable DNA-binding proteins was toxic to human HEK293T cells (Supplementary Discussion). To avoid this toxicity, we proposed splitting the protein into two inactive halves, one containing the N terminus of DddAtox (DddAtox-N) and the other containing the C terminus (DddAtox-C). These halves would reconstitute deamination activity only when assembled adjacently on target DNA, analogous to the assembly of FokI monomers to reconstitute dsDNA nuclease activity in zinc finger nucleases20 and TALENs21.
On the basis of the crystal structure of apo-DddAtox, we split DddAtox into DddAtox-N and DddAtox-C halves at seven sites within loops (Fig. 2a), naming each split to reflect the last residue of DddAtox-N. Screening of split sites was performed with CRISPR–Cas9 proteins to facilitate testing of split DddAtox variants directed to target DNA half-sites with different spacing region lengths22 (Supplementary Table 2). Each DddAtox half was fused to the N terminus of dSpCas923 or an orthogonal Staphylococcus aureus Cas9 variant (SaKKH-Cas9)24. Each split was assayed in its two possible fusion orientations: SaKKH-Cas9 fused either to DddAtox-N (‘aureus-N’) or to DddAtox-C (‘aureus-C’) (Fig. 2b, c). The top DNA strand of test sites contained more TC motifs than the bottom strand and was therefore more likely to be edited by DddAtox (Extended Data Fig. 3). To enhance edits at target sites, we used SaKKH-Cas9(D10A) nickase25to nick the bottom strand, in order to promote its resynthesis using the edited top DNA strand as a template13,14,26,27.
Fig. 2 |. Non-toxic split-DddAtox halves reconstitute activity when co-localized on DNA in HEK293T cells.
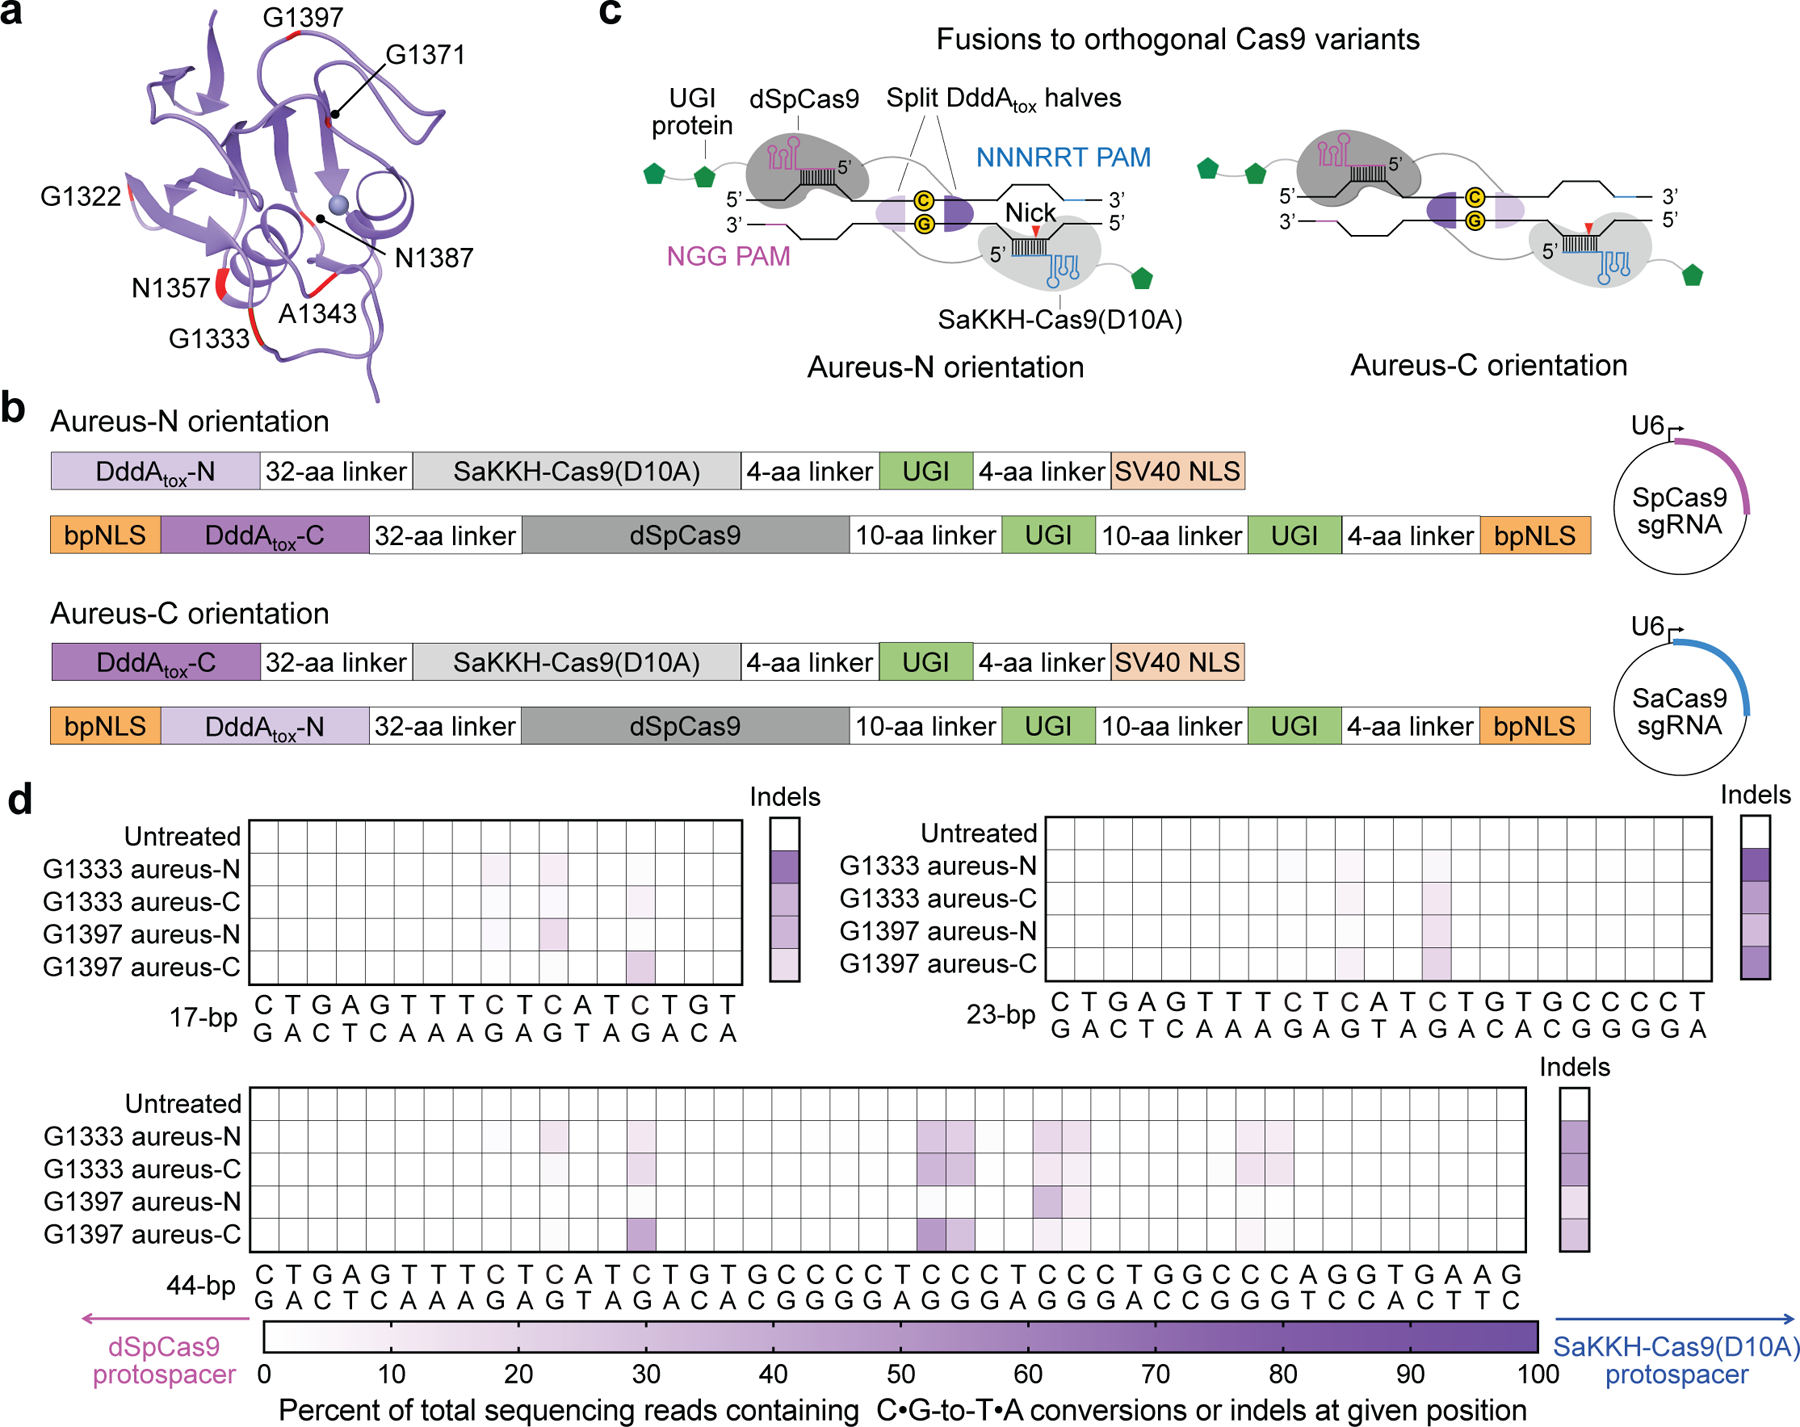
a, DddAtox was split at the peptide bond between each labelled amino acid and the following residue. b, Architectures of split-DddAtox–Cas9 fusions. DddAtox-N and DddAtox-C contain the N terminus and C terminus of DddAtox, respectively. Two fusion orientations (aureus-N or aureus-C) are possible for a given split. sgRNA, single guide RNA. c, Fusions of split-DddAtox halves to orthogonal Cas9 variants enable reassembly of active DddAtox, without creating non-functional homodimers. PAM, protospacer adjacent motif. d, Heat maps showing C•G-to-T•A conversion and indel frequencies for G1333 and G1397 splits at the nuclear EMX1. The split orientations and positions of dSpCas9 (pink) and SaKKH-Cas9(D10A) (blue) protospacers are shown. Colours reflect the mean of n = 2 independent biological replicates.
Among active split-DddAtox–Cas9 fusions, we observed C•G-to-T•A conversions in the spacing region between the two protospacers (Fig. 2d, Extended Data Fig. 3). All editing efficiencies in this study report the fraction of sequenced alleles with the desired C•G-to-T•A edit among all treated cells with no enrichment. Notably, we observed no on-target editing in the absence of guide RNAs or when only one DddAtox–Cas9 half and its guide RNA were present (Supplementary Table 3), indicating that editing is strictly dependent on the reassembly of both DddAtox halves at the Cas9-specified target site.
Among the seven splits tested, splits at G1333 and G1397 yielded the highest editing efficiencies of 22%–48% at the most highly edited position within the target spacing region (Extended Data Fig. 3b, g, h, Supplementary Discussion). For a given fusion orientation, the editing efficiencies of target bases were dependent on their positions within the spacing region; for example, G1397 aureus-C yielded 20%–22% editing at a target TC14 (the 14th nucleotide of the spacing region between the two target protospacers) within 17- and 23-bp spacing regions, and 41% within a 44-bp spacing region (Fig. 2d). These results collectively suggest that splitting DddAtox at G1333 and G1397 produces halves that reconstitute at a target site to mediate C•G-to-T•A conversion in human cells. Spacing region length, target cytosine position and split orientation are all determinants of the base-editing efficiency of split-DddAtox.
Nuclear base editing by TALE–DddAtox
Because DddAtox split at G1333 or G1397 can deaminate target TCs within a modest spacing region (Supplementary Discussion), we speculated that fusing split DddAtox halves to TALE array proteins that bind neighbouring DNA sites might result in CRISPR-free, RNA-free base editing in human cells.
We fused DddAtox halves split at G1333 to TALE array proteins containing a bipartite nuclear localization signal (bpNLS) to bind nuclear DNA sequences flanking an 18-bp spacing region within CCR5 in U2OS cells (Extended Data Fig. 4a). Compared with simple fusions that do not contain a uracil glycosylase inhibitor (UGI), appending two copies of UGI (2×-UGI)14,28 to the N terminus increased the editing efficiency at C9 by approximately 8-fold (to 22%–27%) and reduced indels to less than 2.3 ± 0.31%. Fusing 2×-UGI to the C terminus through a 2- or a 16-amino-acid linker resulted in lower editing efficiencies of 12 ± 3.5% or 3.3 ± 1.3%, respectively (Extended Data Fig. 4a). These results collectively demonstrate that split DddAtox can be fused to TALE arrays to mediate C•G-to-T•A conversions in human nuclear DNA, and that fusing UGI to these proteins enhances editing efficiencies and reduces indel byproducts14,28.
Mitochondrial base editing by TALE–DddAtox
To apply TALE–split DddAtox fusions for mitochondrial base editing, we fused split DddAtox halves to MTS-linked TALE proteins that target MT-ND69, a mitochondrial gene that encodes the NADH dehydrogenase 6 subunit of complex I (Supplementary Table 4). Among fusions that did not contain UGI, we observed the highest level of mtDNA target editing (4.9 ± 0.17%) for the architecture that comprised the C-terminal half of DddAtox split at G1397 and bound to the right TALE assembled with the N-terminal half of DddAtox split at G1397 and bound to the left TALE (Right–G1397-C + Left–G1397-N; Extended Data Fig. 5a, b).
In contrast to nuclear-localized TALE–DddAtox, fusing one or two UGI proteins to the N terminus of each mitoTALE–DddAtox half did not enhance C•G-to-T•A conversion. Appending one UGI to the C terminus, however, increased editing levels by three- to tenfold compared with constructs that lacked UGI (up to 16%–27% for C6, C7 and C13 in TC contexts). Adding a second copy of UGI to the C terminus did not further increase mtDNA editing efficiencies (Fig. 3a). UGI probably inhibits mitochondrial UDG1 to enhance editing efficiencies by impeding uracil excision29. Removing the MTS sequences or replacing them with a bpNLS was found to abrogate editing, demonstrating that MT-ND6 editing is dependent on the mitochondrial localization of the mitoTALE–DddAtox fusions (Fig. 3a).
Fig. 3 |. TALE–split DddAtox fusions for mitochondrial base editing in HEK293T cells.
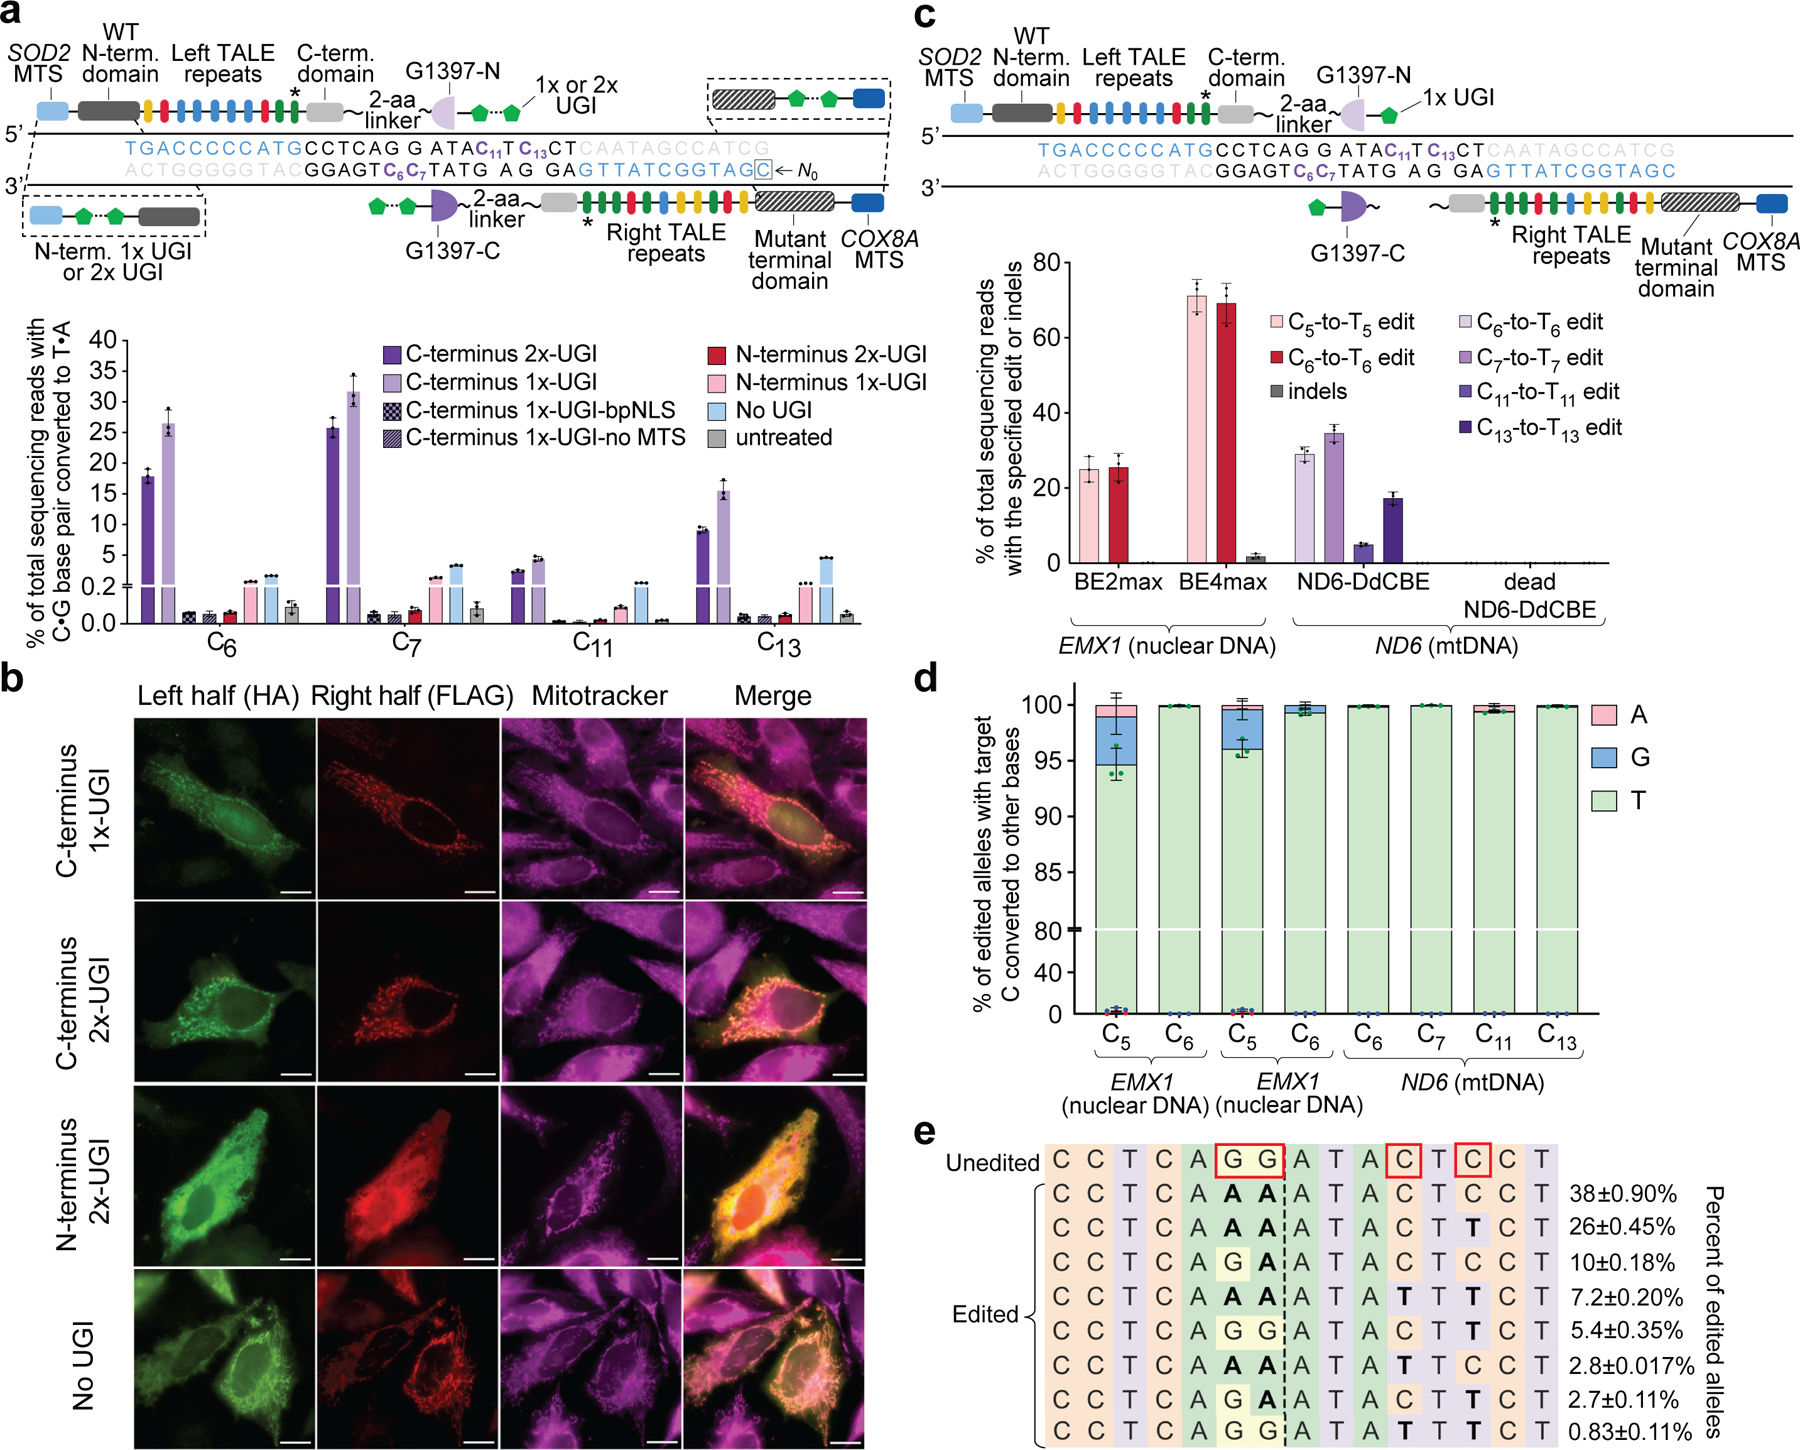
a, Top, candidate TALE–split DddAtox fusions to target MT-ND6. Target cytosines and TALE-binding sites are shown in purple and blue, respectively. Bottom, MT-ND6 editing efficiencies from fusions containing 1×- or 2×-UGI at the N- or C terminus 3 days post-transfection. b, Fluorescence imaging of HA- and FLAG-tagged halves of UGI–TALE–split DddAtox and TALE–split DddAtox–UGI pairs in HeLa cells 24 h after plasmid transfection. Mitochondrial localization was followed using MitoTracker (magenta). Scale bars, 10 μm. Images are representative of 3 independent biological replicates. c, Top, optimized DdCBE architecture containing one UGI fused to the C terminus of each TALE–split DddAtox fusion. Bottom, editing and indel frequencies at MT-ND6 (mtDNA) and EMX1 (nuclear DNA) 3 days post-transfection.BE2max, rAPOBEC1–dSpCas9–2×-UGI. For a and c, the last TALE repeat (*) does not match the reference genome9(see Supplementary Table 4). d, Outcomes among edited alleles in c are shown for the indicated DdCBE variants. e, Frequencies of MT-ND6 alleles in c. Edited cytosines are boxed. Values and error bars for a, c–e reflect the mean ± s.d. of n = 3 independent biological replicates.
Fluorescence microscopy images revealed that, whereas MTS–mitoTALE–split-DddAtox–UGI fusions localized to the mitochondria in HeLa cells, MTS–UGI–mitoTALE–split-DddAtox fusions remained diffused throughout the cytoplasm (Fig. 3b). These findings explain the observed dependence of editing efficiency on the position of UGI fusion and suggest that proximity between the MTS and an N-terminal UGI may impede mitochondrial import of the fusion protein.
These results collectively suggested the following optimized mitoTALE–split-DddAtox architecture (in N- to C-terminus order): an MTS, a TALE array, a two-amino-acid linker, a DddAtox half from the G1333 or G1397 split, and one UGI protein (Fig. 3c). This architecture, hereafter referred to as DddA-derived cytosine base editor (DdCBE), represents—to our knowledge—the first agent that is capable of performing precise genome editing in mtDNA. The application of DdCBE contrast with previously reported uses of nucleases to make double-strand breaks in mtDNA, which result in the loss of targeted mtDNA copies and in heteroplasmic shifts8–10.
Given that DddAtox can edit cytosines on either DNA strand, intermediates that contain uracils on opposing DNA strands could produce double-strand breaks during DNA repair, causing unwanted indels. Although the standard cytosine base editor BE4max30—when targeted to EMX1 in the nucleus—resulted in 1.8 ± 0.67% indels in HEK293T cells, indels were not detected (less than 0.1%) at MT-ND6 despite DdCBE editing both mtDNA strands (Fig. 3c, Extended Data Fig. 4b, c). Indeed, we observed very high product purities (at least 99.5%) for DdCBE-mediated mtDNA base editing of MT-ND6 in HEK293T cells and in U2OS cells—exceeding the product purities resulting from the editing of CCR5 by nuclear-targeted BE4max (96 ± 0.78%) and by nuclear-targeted DdCBE (95 ± 0.52%) (Fig. 3d, Extended Data Fig. 4d). These results suggest that the DNA repair processes that lead to indels and other byproducts in nuclear DNA19 are inefficient in mitochondria (Supplementary Discussion; see Fig. 3e for MT-ND6 allele frequencies in HEK293T cells after treatment with ND6-DdCBE). Instead, lesion-containing mtDNA is degraded rather than repaired11, resulting in the selective maintenance of cleanly edited mtDNA copies.
These findings establish a precision mtDNA editing platform, which uses a dsDNA-specific cytidine deaminase that is split to mitigate toxicity, programmable dsDNA-binding TALE arrays localized to the mitochondria, and a UGI to achieve RNA-free base editing in the mitochondria.
Base editing of five mtDNA genes
To explore the generality of DdCBE for mtDNA editing, we engineered or adapted seven pairs of TALE arrays (Supplementary Table 4) to target five mitochondrial genes: MT-ND1, MT-ND2, MT-ND4, MT-ND5 and MT-ATP8.
Three to six days after treatment, mitochondrial base-editing efficiencies of DdCBEs in HEK293T cells varied between 4.6% and 49% depending on the split type, split orientation and target cytosine position within the spacing region. For DdCBEs using the G1333 split, the Right–G1333-C + Left–G1333-N orientation resulted in 2.1- to 15-fold higher editing efficiencies than the Right–G1333-N + Left–G1333-C orientation, regardless of the spacing length and positions of TC target bases (Fig. 4a–e, g). By contrast, the effect of split orientation on editing efficiencies was more site-dependent for G1397 (Fig. 4b, d–f).
Fig. 4 |. DdCBE editing at five mtDNA genes in HEK293T cells.
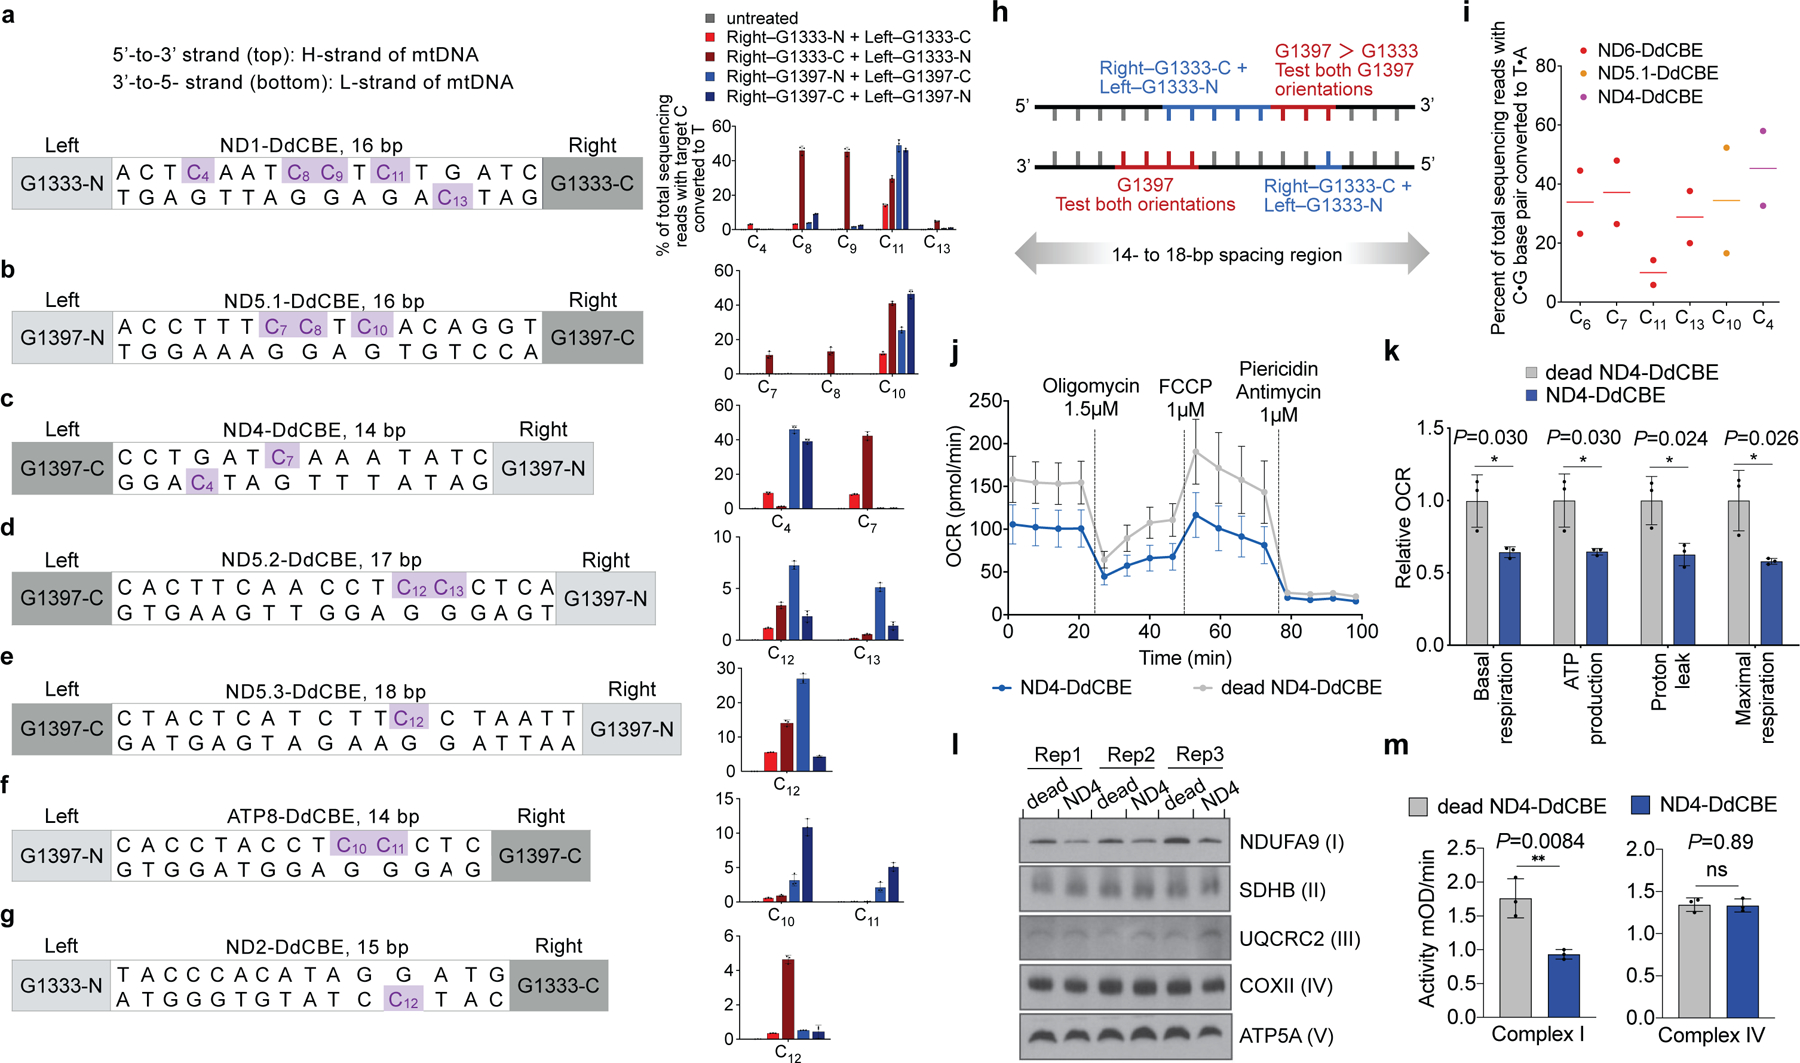
a–g, Target spacing regions and the split DddAtox orientation that resulted in the highest editing efficiencies are shown for ND1-DdCBE (a), ND5.1-DdCBE (b), ND4-DdCBE (c), ND5.2-DdCBE (d), ND5.3-DdCBE (e), ATP8-DdCBE (f) and ND2-DdCBE (g). Editing efficiencies are shown on the right. Genomic DNA was collected 3 days (b, d, f) or 6 days (a, c, e, g) post-transfection. h, DdCBE orientations and corresponding approximate windows (red and blue) within which target cytosines are edited. i, Mitochondrial DNA editing efficiencies in untransformed human primary fibroblasts 5 days after nucleofection of mRNA encoding the DdCBEs shown; n = 2 independent biological replicates. j, k, Oxygen consumption rate (OCR) (j) and relative values of respiratory parameters (k) in ND4-DdCBE-treated HEK293T cells. FCCP, carbonyl cyanide-4 (trifluoromethoxy) phenylhydrazone. l, Blue-native PAGE of HEK293T mitochondrial lysates treated with ND4-DdCBE, visualized with antibodies against the indicated subunits of mitochondrial complexes; n = 3 independent biological replicates. m, The activities of complex I (left) and complex IV (right). mOD: absorbance at optical density of 450 nm. Values and error bars in a–g, j, k and m reflect the mean ± s.d. of n = 3 independent biological replicates. *P < 0.05; **P < 0.01; NS, not significant (P > 0.05) by Student’s unpaired two-tailed t-test.
Collectively, optimized G1397-split DdCBEs mediated average base-editing efficiencies of 42% at each of four well-edited mtDNA sites (Fig. 4a–c, e) and average efficiencies of 9.0% at two modestly edited sites (Fig. 4d, f), whereas the most efficient G1333-split DdCBEs yielded 43% average conversion at three sites (Fig. 4a–c) and 7.4% average efficiencies at three other sites (Fig. 4d, e, g). We did not detect indels or base editing outside the spacing region (Supplementary Tables 5, 6).
Within 14–18-bp spacing regions, G1397-split DdCBE preferentially edited TCs that were positioned approximately 4–7 nucleotides upstream of the 3′ end of the spacing region in either mtDNA strand. By contrast, G1333-split DdCBE preferentially edited TCs that were positioned approximately 4–10 nucleotides from the 5′ end of the spacing region in either mtDNA strand (Fig. 4h). These results indicate that each split edits TCs with a preference for specific windows in the spacing region. For a given target sequence, we recommend testing G1397 and G1333 splits in both orientations, using spacing lengths and TALE-binding sites guided by the above principles (Supplementary Discussion).
We confirmed the durability of mtDNA edits in HEK293T cells over 18 days (Extended Data Fig. 6a–d, Supplementary Discussion). In addition, mtDNA editing did not reduce cell viability, produced no large mtDNA deletions, and did not perturb mtDNA copy numbers (Extended Data Fig. 6g–i, Supplementary Discussion). We observed a substantial reduction in editing when mtDNA replication was blocked by induced expression of a dominant negative mitochondrial polymerase gamma mutant31 (Extended Data Fig. 7). We speculate that during mtDNA replication, replicative polymerases incorporate A opposite U to resolve the U•G intermediate into a T•A base pair. DdCBE-mediated mtDNA editing in non-dividing cells should be feasible because mtDNA replication proceeds even in post-mitotic cells32. Indeed, untransformed primary human fibroblasts also supported efficient mtDNA base editing (typically 30%–40%) (Fig. 4i) despite dividing much less frequently than HEK293T cells, indicating that the use of DdCBE is not limited to immortalized cell lines.
Given that mutations in mtDNA genes that encode complex I subunits are thought to be pathogenic in rare tumours of the thyroid and kidney6,33, we investigated the consequences of editing MT-ND4 in cells containing the m.11922G>A mutation (for the characterization of other edited sites, see Extended Data Fig. 8c–f and Supplementary Discussion). Compared with control cells treated with catalytically inactive DdCBE, cells treated with ND4-DdCBE had lower rates of oxidative phosphorylation (Fig. 4j) and decreased basal and uncoupled respiration rates (Fig. 4k)—consistent with the disruption of complex I. Mitochondrial DNA homeostasis and associated transcripts were unchanged (Extended Data Fig. 8a, b). Also consistent with a specific defect in complex I, the enzymatic activity and assembly of complex I—but not of complex IV—were markedly reduced in these cells (Fig. 4l, m). These results establish that precise DdCBE editing can be applied to study mitochondrial phenotypes arising from disease-associated mtDNA mutations.
Off-target editing by DdCBEs
To profile the off-target activity of DdCBE in the human mitochondrial genome, we transfected HEK293T cells with plasmids that constitutively expressed optimized DdCBE or the corresponding dead-DdCBE control in order to distinguish DdCBE-induced single-nucleotide variants (SNVs) from background heteroplasmy. To test for possible editing arising as a result of the spontaneous assembly of split DddAtox in the absence of TALE-directed DNA binding, cells were also transfected with plasmids expressing MTS–G1397 split–UGI, with no TALE array (Fig. 5a).
Fig. 5 |. Mitochondrial genome-wide off-target DNA editing by DdCBEs.
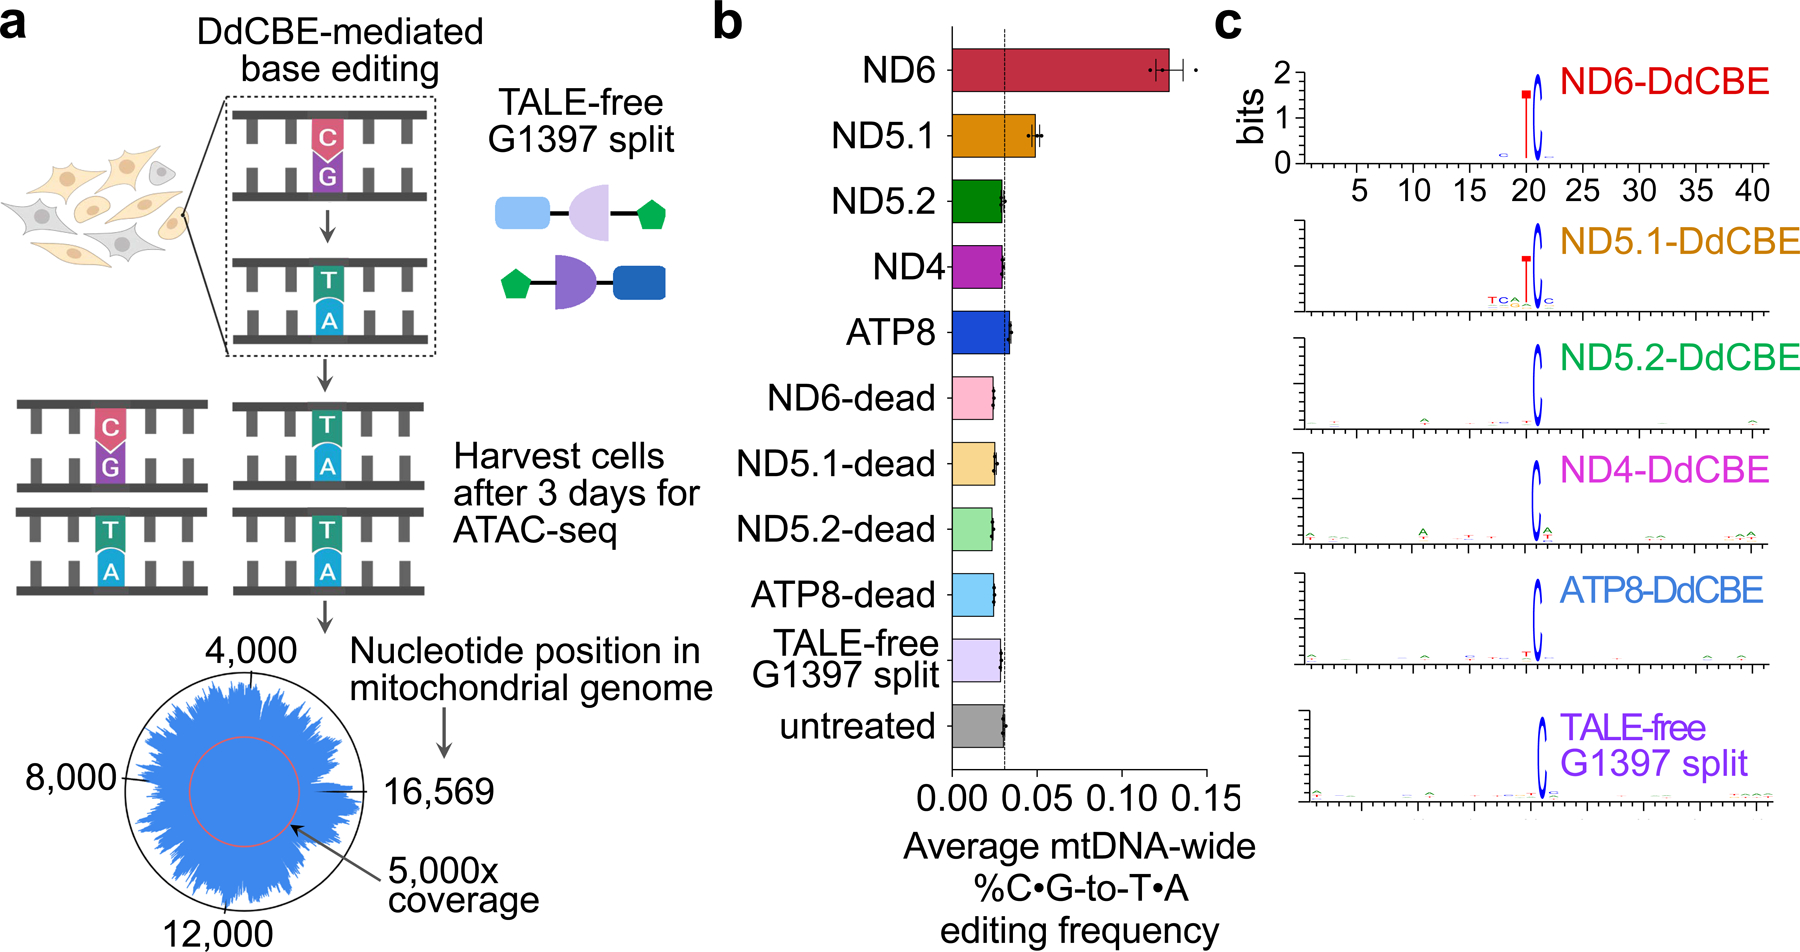
a, HEK293T cells were transfected with plasmids encoding active DdCBE, dead-DdCBE or TALE-free MTS–split DddAtox–UGI. The average coverage of each base was 5,100- to 9,900-fold (see Supplementary Data 1). b, Average percentage of genome-wide C•G-to-T•A off-target editing in mtDNA for each DdCBE and for controls. The vertical line represents the percentage of endogenous C•G-to-T•A conversions in mtDNA in untreated cells. Values and error bars reflect the mean ± s.e.m. of n = 3 independent biological replicates. c, Sequence logos generated from off-target C•G-to-T•A conversions by each indicated DdCBE. Bits reflect sequence conservation at a given position.
The average frequencies of mitochondrial genome-wide off-target C•G-to-T•A editing by MTND5P2-DdCBE (denoted as ND5.2-DdCBE), ND4-DdCBE and ATP8-DdCBE (0.030%–0.034%) were similar to those of the untreated and dead-DdCBE controls (0.024%–0.030%), whereas MTND5P1-DdCBE (denoted as ND5.1-DdCBE)had a 1.6-fold higher average off-target editing frequency (0.049%) compared with the untreated control (Fig. 5b). We attribute the unusually high average off-target editing frequency by ND6-DdCBE (0.13%) to the permissive mutant N-terminal domain (NTD) of TALE (Fig. 3a), which may increase the non-specific binding of TALE arrays. Off-target mutations from the spontaneous reassembly of TALE-free split DddAtox were not detected at greater levels than in untreated cells (Fig. 5b). Notably, we did not observe significant off-target editing at nuclear pseudogenes, even though they differ by only 1–2 bp from the mtDNA on-target sites (Extended Data Fig. 9).
DdCBEs with standard NTDs generally exhibited 150- to 860-fold higher on-target editing relative to off-target editing, with no strong correlation between on-target editing efficiencies and off-target activity (Supplementary Table 8). Because all of these standard DdCBEs exhibit similar protein expression levels (Extended Data Fig. 6f) and share wild-type NTDs and deaminase domains but have different TALE repeats, we conclude that TALE domains influence off-target activity. Moreover, TALE–split DddA fusions must be positioned in close proximity for both on-target and off-target editing (Extended Data Fig. 10).
To further investigate the nature of off-target edits (see Extended Data Fig. 11 for predicted effect of off-target SNVs on protein function), we searched the 20-bp regions flanking each off-target SNV for any sequence homology to the on-target TALE-binding sites. Although we noted a strong 5′-TC-3′ preference for ND6-DdCBE and ND5.1-DdCBE off-target edits that matches the sequence preference for free DddAtox in E. coli (Fig. 1i, Supplementary Discussion), we did not observe any consensus off-target sequences that closely resemble on-target TALE binding sites (Fig. 5c). In addition, up to 20%–80% of SNVs identified for each DdCBE overlapped with those of other DdCBEs containing distinct TALE arrays programmed to bind different on-target sites (Supplementary Data 2, Supplementary Table 9). Collectively, these results suggest that off-target editing does not arise from editing at sequences similar to on-target sites. Instead, we speculate that DdCBE halves containing TALE arrays with greater non-specific DNA binding activity34 are more likely to bind proximally to transiently reassemble active DddAtox, which can then engage off-target mtDNA regions with no necessary homology to the on-target site.
Discussion
This study describes an interbacterial cytidine deaminase toxin specific for dsDNA, and its development into a CRISPR-free, RNA-free base editor that can install targeted mutations in the human mitochondrial genome with typial efficiencies ranging between 5% and 50%. The resulting DdCBEs enable programmable C•G-to-T•A conversions in mtDNA without requiring double-strand breaks, a capability that has the potential to model mitochondrial disease mutations, correct pathogenic variants (Supplementary Table 10) and expand our knowledge of mitochondrial biology.
Additional research will be needed to fully elucidate the principles that govern the efficiency and specificity of DdCBE. Developing in vitro and in vivo strategies to deliver DdCBEs will be essential for exploring their therapeutic potential in other cell types and in animal models of mitochondrial diseases. Exploring additional sources of natural diversity among bacterial DNA deaminases, or engineering DddAtox variants with altered sequence context and substrate preferences beyond 5′-TC-3′, would further expand the scope of mtDNA editing. Finally, although this study has focused on the use of DdCBE for mitochondrial base editing, some features of DdCBE (or zinc-finger array variants35)—such as its all-protein composition, its lack of requirement for a protospacer adjacent motif, and its independence from CRISPR components—may also offer advantages for base editing in cells and organelles beyond mitochondria.
METHODS
Bacterial strains and culture conditions
Unless otherwise noted, all bacterial strains used in this study were grown in Lysogeny Broth (LB) at 37 °C or on LB medium solidified with agar (LBA, 1.5% w/v, except as noted). When required, media was supplemented with the following: carbenicillin (150 μg ml−1) gentamycin (15 μg ml−1), IPTG (80 μM, except as noted), rhamnose (0.05% w/v, except as noted), chloramphenicol (10 μg ml−1) or tetracycline (20 μg ml−1 for E. coli, 120 μg ml−1 for B. cenocepacia). E. coli strains DH5α, XK1502 and BL21 were used for plasmid maintenance, toxicity and mutagenesis assays, and protein expression, respectively. B. cenocepacia strains were derived from the cystic fibrosis clinical isolate H111. A detailed description of the bacterial strains and plasmids used in this study is provided in Supplementary Table 11.
Genetic techniques and plasmid construction for bacterial expression
All procedures for DNA manipulation and transformation were performed with standard methods. Molecular biology reagents, Phusion high fidelity DNA polymerase, restriction enzymes, UDG, and Gibson Assembly Reagent were obtained from New England Biolabs (NEB). GoTaq Green Master Mix was obtained from Promega. Primers and gBlocks used in this study were synthesized by Integrated DNA Technologies (IDT). A list of all primers is provided in Supplementary Table 12.
Protein expression constructs were generated by Gibson assembly. The toxin domain of DddA was identified by remote homology with characterized deaminase domains identified through HMMER36. For functional protein expression assays of DddAtox, TadA and CDD, the relevant genes or gene fragments were amplified from B. cenocepacia (DddAtox) or E. coli genomic DNA and cloned into the vector pSCRhaB2. The gene encoding DddIA was amplified from B. cenocepacia and cloned into pPSV39, and the expression construct for DddAtox(E1347A) was generated by overlap extension PCR followed by Gibson assembly with pSCRhaB2. For the APOBEC3G expression construct, the gene sequence was codon optimized for expression in E. coli, generated by synthesis as a gBLOCK (IDT) and cloned into pSCRhaB2. For protein purification, genes encoding DddAtox and DddAI were amplified from B. cenocepacia and cloned into pETDuet.
In-frame gene deletions and nucleotide substitutions in B. cenocepacia were performed by homologous recombination using the plasmid pDONRPEX18Tp-SceI-pheS, followed by counter-selection using the plasmid pDAI-SceI and plasmid curing using 0.1% (w/v) p-chlorophenylalanine, as described previously37. B. cenocepacia contains two complete T6SSs38 and both were inactivated (ΔicmF1, I35_RS01770; ΔicmF2, I35_RS17395) and tested in this study. The ΔicmF2 mutation did not influence DddA-dependent intercellular intoxication and is thus not included in Fig. 1b for the sake of brevity. Gentamycin-resistant B. cenocepacia was generated by insertion of a resistance cassette at the Tn7 site attachment site as described previously39.
Plasmid construction for mammalian expression
PCR was performed using Phusion U Green Multiplex PCR Master Mix (Thermo Fisher Scientific), Phusion U Green Hot Start DNA Polymerase (Thermo Fisher Scientific) or Q5 Hot Start High-Fidelity DNA Polymerase (New England Biolabs). All plasmids were constructed using USER cloning (New England Biolabs). DddAtox and mitoTALE genes were synthesized as gene blocks and codon optimized for human expression (Genscript). BE4max was obtained according to a previous report30. BE2max (rAPOBEC1–dSpCas9–UGI–UGI) was cloned from a BE4max plasmid. Compared with BE214, BE2max contains an extra UGI protein and uses codon optimization from BE4max. DddAtox–Cas9 fusions and DdCBE variants were cloned into pCMV (mammalian codon-optimized) backbones. sgRNA plasmids were constructed by blunt-end ligation of a linear polymerase chain reaction (PCR) product generated by encoding the 20- to 23-nt variable protospacer sequence onto the 5′ end of an amplification primer and treating the resulting piece with KLD Enzyme Mix (New England Biolabs) according to the manufacturer’s instructions. Mach1 chemically competent E. coli cells (Thermo Fisher Scientific) were used for plasmid construction. E. coli strain DH5α:dddI was used to construct intact DddAtox–Cas9 plasmids. Plasmids for mammalian transfection were purified using ZymoPURE II Plasmid Midiprep Kits (Zymo Research), as previously described40. A list of all primers used in mammalian expression constructs is provided in Supplementary Table 13.
Bacterial competition experiments
Bacterial competition experiments were used to evaluate the fitness of B. cenocepacia strains in interbacterial interactions. Donor and recipient strains were grown overnight and mixed in a 10:1 (v/v) ratio for donor and recipient, respectively. Cell suspensions were then concentrated to a total optical density at 600 nm (OD600) of 10, and 10 μl was spotted on a 0.2 μm nitrocellulose membrane placed on LBA (3% w/v) and incubated for 6 h at 37 °C. After incubation, cells were scraped from the membrane surface and resuspended in 1 ml LB. The initial donor:recipient ratio and the post-incubation ratio were determined by plating on LB agar (LBA) to determine the total number of colony forming units (cfu) and on LBA with gentamycin to quantify cfu of the recipient strain.
Toxicity assays
To evaluate the toxicity of deaminases expressed heterologously, overnight cultures of E. coli XK1502 containing the appropriate plasmids were diluted 1:1,000 into fresh medium and grown until they reached exponential phase (OD600 0.6), at which point deaminase expression was induced with rhamnose (0.2% w/v). Aliquots of cultures were then collected periodically until 480 min of growth and were diluted and plated onto LBA for c.f.u determination.
Crystallization and structure determination
Crystals of the selenomethionine derivative hexahistidine-tagged DddAtox (aa 1264–1427)·DddIA complex were obtained at 5–10 mg ml−1 in crystallization buffer (15 mM Tris pH 7.5, 150 mM NaCl, 1.0 mM tris(2-carboxyethyl)phosphine (TCEP)), mixed 1:1 with crystallization solution containing 25% (w/v) PEG 3350, 0.1 M Bis-Tris:HCl pH 6.5, 200 mM MgCl2. Rectangular crystals grew to 400 × 200 × 100 μm over 5 days. Selenomethionine DddAtox·DddIA crystals displayed the symmetry of space group P21212 (a = 126.8 Å, b = 145.0 Å, c = 64.2 Å, α = β = γ = 90°), with four dimers in the asymmetric unit. Before data collection, crystals were cryoprotected in crystallization solution 15% glycerol, 25% PEG3350, 100 mM MgCl2, 100 mM NaCl, 7.5 mM Tris pH 7.5, 50 mM Bis-Tris pH 6.5, 0.5 mM TCEP.
Highly redundant anomalous (SAD) data were obtained at 0.9790 Å (peak) wavelength from a single selenomethionine crystal at 100 K temperature at the BL502 beamline (ALS, Lawrence Berkeley National Laboratory). Data were processed using HKL200041. Heavy-atom searching using phenix.autosol identified 18 possible sites, and refinement yielded an estimated Bayes correlation coefficient of 55.9 to 2.5 Å resolution. After density modification, the estimated Bayes correlation coefficient increased to 61.2. Approximately 70% of the selenomethionine model was constructed automatically, and the remaining portion was built manually. The current model (Supplementary Table 1) contains four DddA·DddIA dimers.
Refinement was carried out against peak anomalous data with Bijvoet pairs kept separate using phenix.refine42 interspersed with manual model revisions using the program Coot43 and consisted of conjugate-gradient minimization and calculation of individual atomic displacement and translation/libration/screw parameters44. Residues that could not be identified in the electron density were: 1250–1289 and 1423–1427 for DddA, and 71–73 for DddIA. Both models exhibit excellent geometry, as determined by MolProbity45. Ramachandran analysis identified 99.1% favoured, 0.9% allowed and 0% disallowed residues for the model. Coordinates and structure factors are deposited in the RCSB Protein Data Bank (PDB ID: 6U08).
Mutation frequency determination and SNP generation assay
To determine the frequency of mutations induced by expression of DddAtox and DddAtox(E1347A), overnight cultures of E. coli containing the expression plasmids for these proteins together with the plasmid for expression of DddIA were diluted 1:1,000 into fresh medium and grown until they reached the exponential phase (OD600 0.6). The cultures were then induced with IPTG (0.08 mM) for DddIA and rhamnose (0.04% w/v) for DddAtox or DddAtox(E1347A) expression. The combined expression of both toxin and immunity proteins at this low level enables the cells expressing DddAtox to suffer growth arrest but does not result in a decrease in culture viability. After 1 h under these inducing conditions, cultures were supplemented with 1 mM of IPTG to increase DddIA expression and thus block DddA toxicity and were then grown for an additional 16 h. After this recovery period, the cultures were plated onto LBA containing rifampicin (100 μg ml−1) or no antibiotics. Mutation frequency was determined dividing the number of rifampicin resistant colonies by the total c.f.u obtained on non-selective medium.
For the genome-wide identification of SNPs that accumulate after low level expression of DddAtox or DddAtox(E1347A), E. coli Δudg strain carrying plasmids for expression of one of these proteins plus the plasmid for expressing DddIA was submitted to seven rounds of expression and recovery as described above, with cultures being plated after recovery and single colonies being selected and used to inoculate the subsequent round of expression. Randomly chosen single colonies were used to avoid introducing selection for increased fitness under the culture conditions46. Five isolated colonies from each starting population subjected to this regimen were selected for whole genome sequencing. We confirmed the presence of non-mutagenized DddAtox and DddAtox(E1347A) in these sequencing data.
Western blot for deaminase expression in E. coli
Western blotting to detect deaminases expressed in E. coli was performed using rabbit anti-VSV-G (diluted 1:5,000, Sigma) and detected with anti-rabbit horseradish peroxidase-conjugated secondary antibodies (diluted 1:5,000, Sigma). Loading control was performed with mouse anti-RNAP (diluted 1:500, BioLegend) and detected with sheep anti-mouse (diluted 1:500, Millipore). Western blots were developed using chemiluminescent substrate (SuperSignal West Pico Substrate, Thermo Scientific) and imaged with a C600 imager (Azure Biosystems).
Western blot for deaminase expression in mammalian cells
HEK293T cells were transfected as described below. For preparation of cell lysate for western blot analysis of DdCBE, cells were lysed in 150 μl of ice-cold 1x RIPA buffer (Sigma) with added protease inhibitor (Roche Complete Mini) by incubating for 30 min at 4 °C with agitation. Lysates were cleared by pelleting at 12,000 g for 10 min at 4 °C.
Next, 60 μl of cleared lysate supernatant was added to 20 μl of 4X LDS sample loading buffer (Thermo Fisher Scientific) with a final DTT (Sigma Aldrich) concentration of 10 mM. Lysates were boiled for 10 min at 95 °C. Then 15–20 μl of protein lysate was loaded into the wells of a Bolt 4–12% Bis-Tris Plus (Thermo Fisher Scientific) pre-cast gel. 6 μl of Precision Plus Protein Dual Colour Standard (Bio-Rad) was used as a reference. Samples were separated by electrophoresis at 180 V for 45 min in Bolt MES SDS running buffer (Thermo Fisher Scientific). Transfer to a PVDF membrane was performed using an iBlot 2 Gel Transfer Device (Thermo Fisher Scientific) according to the manufacturer’s protocols. The membrane was blocked in Odyssey Blocking Buffer (LI-COR) for 1 h at room temperature, then incubated with rat anti-Flag (Thermo Fisher Scientific MA1–142; 1:2,000 dilution), mouse anti-HA (Thermo Fisher Scientific 26183; 1:2,000 dilution) and rabbit anti-actin (CST 4970; 1:2,000 dilution) in blocking buffer (0.5% Tween-20 in 1x PBS, 0.2 μm filtered) overnight at 4 °C. The membrane was washed three times with TBST (1x TBS in 0.5% Tween-20, 0.2-μm filtered) for 10 min each at room temperature, then incubated with IRDye-labelled secondary antibodies goat anti-rat 680RD (LI-COR 926–68076), goat anti-mouse 800CW (LI-COR 926–32210) and donkey anti-rabbit 800CW (LI-COR 926–32213) diluted 1:5,000 in blocking buffer for 1 h at room temperature. The membrane was washed as before, then imaged using an Odyssey Imaging System (LI-COR).
Mitochondria isolation and blue-native-PAGE analysis
Mitochondria isolation was performed as described47. Cells were collected from the plates by pipetting in NKM buffer (1 mM Tris–HCl, pH 7.4, 130 mM NaCl, 5 mM KCl, 7.5 mM MgCl2) followed by centrifugation at 400g at 4 °C for 8 min. Pellets were resuspended in ice-cold 0.1x homogenization buffer (4 mM Tris-HCl, pH 7.8, 2.5 mM NaCl, 0.5 mM MgCl2) and incubated for 5 min on ice. Twenty strokes of a tight-fitting pestle (Dounce homogenizer) were applied to homogenize cells and buffer was adjusted to isotonic conditions by addition of one-ninth volume of 10x homogenization buffer. Cell debris and nuclei were pelleted by two succeeding centrifugations at 900g at 4 °C for 4 min and mitochondria were collected by centrifugation at 10,000 g at 4 °C for 2 min. Then 50 μg of mitochondria were suspended in NativePAGE solubilization buffer (Thermo Fisher) with addition of digitonin at a ratio of 4 g digitonin per g protein and incubated on ice for 10 min. Samples were centrifuged 16,000 g at 4 °C for 10 min, supernatants were collected to new tubes and NativePAGE G-250 Sample Additive (Thermo Fisher) was added to each sample to a final concentration of 0.25%. Samples were loaded onto NativePAGE 3–12% Bis-Tris Gels (Thermo Fisher) and electrophoresis was performed with the use of NativePAGE Running Buffer system (Thermo Fisher) at constant 150 V for 45 min at 4 °C followed by 250 V for 90 min at room temperature. After initial 45 min electrophoresis, the Dark Blue Cathode Buffer was replaced with the Light Blue Cathode Buffer. After electrophoresis, transfer to a PVDF membrane (BioRad) was performed using semi-dry Trans Blot Turbo transfer system (BioRad). Membranes were incubated for 5 min in 8% v/v acetic acid and washed briefly with methanol following 5 min incubation in distilled H2O. Membranes were washed twice with TBST (TBS-Tween-20, Boston BioProducts) and blocked with 5% w/v Blotting-Grade Blocker (BioRad) in TBST. Membranes were incubated with primary antibodies overnight at 4 °C (mouse anti-NDUFA9, Abcam 14713, 1:1,000 dilution; rabbit anti-UQCRC2, Abcam 103616, 1:1,000 dilution; mouse anti-ATP5A, Abcam 14748, 1:6,000 dilution; mouse anti-MTCO2, Abcam 110258, 1:1,000 dilution; mouse anti-SDHB, Abcam 14714, 1:1,000 dilution). Membranes were washed 3 times for 10 min with TBST and incubated with secondary antibodies for 1 h at room temperature followed by washing 3 times for 10 min with TBST. Membranes were incubated with Western Lightning Plus-ECL (PerkinElmer) and signal was registered on the Amersham Hyperfilm high performance autoradiography film (GE Healthcare). Films were scanned and 8-bit greyscale files were used for quantification with Fiji software48. For each image, a region of interest of the same size was used to quantify all bands and their corresponding background signals. Obtained values were inverted so that white pixels = 0 and black pixels = 255. Net values were calculated as a difference between band values and background values. Obtained net values were used to calculate the protein ratio of ND4-DdCBE-treated cells relative to mock-edited cells.
Purification of proteins for bacterial biochemical assays
Overnight cultures of E. coli BL21 pETDuet-1::dddAtox-dddIA, or E. coli BL21 pETDuet-1::dddAtox(E1347A) were used to inoculate 2 L of LB broth in a 1:100 dilution and cultures were grown to approximately OD600 0.6. At this point, plasmid expression was induced with 0.5 mM IPTG and the cultures were incubated for 16 h at 18 °C in a shaking incubator. Cell pellets were collected by centrifugation at 4,000g for 20 min, followed by resuspension in 50 ml of lysis buffer (50 mM Tris-HCl pH 7.5, 500 mM NaCl, 30 mM imidazole, 1 mM DTT, and 1 mg ml−1 lysozyme). Cell pellets were then lysed by sonication (5 pulses, 10 s each) and supernatant was separated by centrifugation at 25,000g for 30 min.
The DddAtox–DddIA complex or DddAtox(E1347A) was purified from cell lysates by nickel affinity chromatography using 4 ml of Ni-NTA agarose beads loaded onto a gravity-flow column. The supernatant was loaded onto the column and resin was washed with 50 ml of wash buffer (50 mM Tris-HCl pH 7.5, 500 mM NaCl, 30 mM imidazole, 1 mM DTT). Proteins of interest were eluted with 5 ml elution buffer (50 mM Tris-HCl pH 7.5, 300 mM imidazole, 500 mM NaCl, 30 mM imidazole, 1 mM DTT). When DddAtox(E1347A) was purified, the eluted samples were applied directly to size-exclusion chromatography. For DddA–DddIA, the eluted samples underwent a denaturation and renaturation step to isolate only the toxin. In this case, the eluted proteins were added to 50 ml 8 M urea denaturing buffer (50 mM Tris-HCl pH 7.5, 300 mM imidazole, 500 mM NaCl and 1 mM DTT) and incubated for 16 h at 4 °C. The 8 M urea denaturing buffer with the eluted proteins was loaded on a gravity-flow column with 4 ml Ni-NTA agarose beads. The column was washed with 50 ml 8 M urea denaturing buffer to remove any remaining DddIA. While still bound to Ni-NTA agarose beads, DddAtox was renatured by sequential washes with 25 ml denaturing buffer with decreasing concentrations of urea (6 M, 4 M, 2 M, 1 M), and a last wash with wash buffer to remove remaining traces of urea. Proteins bound to the column were then eluted with 5 ml elution buffer. The eluted samples were purified again by size-exclusion chromatography using fast protein liquid chromatography (FPLC) with gel filtration on a Superdex200 column (GE Healthcare) in sizing buffer (20 mM Tris-HCl pH 7.5, 200 mM NaCl, 1 mM DTT, 5% (w/v) glycerol). The fraction purity was evaluated by SDS–PAGE gel stained with Coomassie blue and the highest quality factions were stored at −80 °C.
DNA deamination assays
All the DNA substrates were purchased from IDT, and a 6-FAM fluorophore was added for visualization (see Supplementary Table 12 for substrate sequences). Reactions were performed in 10 μl of deamination buffer (20 mM MES pH 6.4, 200 mM NaCl, 1 mM DTT, 8% Ficoll 70 and 1 μM substrate) with APOBEC3A, DddAtox or DddAtox(E1347A) at the concentrations indicated in Fig. 1f, g and Extended Data Fig. 1d. Reactions were incubated for 1 h at 37 °C, followed by the addition of 5 μl of UDG solution (New England Biolabs, 0.02 U μl−1 UDG in 1X UDG buffer) and further incubated for 30 min. Cleavage of substrates was induced by addition of 100 mM NaOH and incubation at 95 °C for 3 min. Samples were analysed by denaturing 15% acrylamide gel electrophoresis and the resulting fluorescent DNA fragments were detected by fluorescence imaging with Azure Biosystems.
Poisoned primer extension assay for RNA deamination
All substrate sequences are listed in Supplementary Table 12. The RNA substrates and the oligonucleotide containing a 5′ 6-FAM fluorophore for visualization were purchased from IDT. Deamination reactions were performed in 10 μl of RNA deamination buffer (Tris-HCl pH 7.5, 200 mM NaCl, 1 mM DTT) with the addition of 1 μM of DddAtox or DddAtox(E1347A). Substrate combinations and concentrations were added as indicated in Extended Data Fig. 1e–f, and reactions were incubated for 1 h at 37 °C. cDNA synthesis was performed in a 10-μl reaction (2.5 U μl−1 MultiScribe Reverse Transcriptase (Thermo Fisher), 1 μl deamination reaction, 1.5 μM oligonucleotide, 100 μM dATP, 100 μM dCTP, 100 μM dTTP, and 100 μM ddGTP). The reaction was incubated at 37 °C for 10 min and samples were analysed by denaturing 15% acrylamide gel electrophoresis. The synthesized cDNA fragments were detected by fluorescence imaging with a C600 (Azure Biosystems).
Genome sequencing and SNP identification in bacteria
Overnight cultures from isolated colonies were used for total gDNA extraction with the DNeasy Blood & Tissue kit (Qiagen), and extraction yield was quantified using a Qubit (Thermo Fisher Scientific). Sequencing libraries were constructed using the Nextera DNA Flex Library Prep Kit (Illumina). Library quality and concentration was evaluated with a Qubit and TapeStation System (Agilent). Sequencing was performed with an Illumina MiSeq instrument (300 cycles paired end program). Genome mapping was performed with BWA49 using the E. coli MG1655 (NC_000913.3) genome as a reference. Pileup data from alignments were generated with SAMtools and variant calling was performed with VarScan250. SNPs were considered valid if they were present at a frequency greater than 90%.
Mammalian cell culture
All cells were cultured and maintained at 37 °C with 5% CO2. Antibiotics were not used for cell culture of HEK293T cells, U2OS cells, T-Rex-293-based POLGdn cells and primary fibroblasts. HEK293T cells (CRL-3216, American Type Culture Collection (ATCC)) were cultured in DMEM with GlutaMax (Thermo Fisher Scientific) supplemented with 10% (v/v) fetal bovine serum (Gibco). U2OS cells (HTB-96, ATCC) were cultured in McCoy’s 5A medium with GlutaMax (Thermo Fisher Scientific) supplemented with 10% (v/v) fetal bovine serum (Gibco). HeLa cells (ATCC CCL-2) were cultured in high glucose DMEM (Gibco) with 10% fetal bovine serum (Atlanta Biological), and 100 U ml−1 penicillin (Sigma-Aldrich). Primary human fibroblasts (GM04541, Coriell) were cultured in DMEM with GlutaMAX supplemented with 20% (v/v) FBS (Thermo Fisher Scientific). T-Rex-293-based POLGdn cells were obtained from V.K.M. and were cultured in DMEM with GlutaMax (Thermo Fisher Scientific) supplemented with 10% (v/v) fetal bovine serum (Gibco), 1 mM sodium pyruvate and 50 μg ml−1 uridine (Sigma-Aldrich). Cell lines were authenticated by their respective suppliers and tested negative for mycoplasma.
HEK293T and T-Rex-293-based POLGdn mammalian cell lipofection
Cells were seeded on 48-well collagen-coated plates (Corning) at a density of 2 × 10⁵ cells per ml (250 μl total per well), 18–24 h before lipofection. Lipofection was performed at a cell density of approximately 70%. For split DddAtox–Cas9 screening, cells were transfected with 375 ng of split DddAtox–dSpCas9 monomer expression plasmid, 375 ng of split DddAtox–SaKKH-Cas9(D10A) monomer expression plasmid, 125 ng of SpCas9 guide RNA (gRNA) expression plasmid and 125 ng of SaKKH gRNA plasmid. pUC19 was used as a filler DNA for monomer and no-gRNA control experiments to make up to 1,000 ng of total plasmid DNA. For DdCBE experiments, cells were transfected with 500 ng of each mitoTALE monomer to make up 1,000 ng of total plasmid DNA. Lipofectamine 2000 (1.5 μl, Thermo Fisher Scientific) was used per well. Cells were collected at the indicated time point.
For western blot analysis of DdCBEs expressed in mammalian cells, HEK293T cells were seeded on 6-well tissue culture-treated plates (Corning) at a density of 2 × 10⁵ cells per ml (2 ml total per well), 18–24 h before lipofection. Cells were transfected with 4,000 ng of each mitoTALE monomer to make up 8,000 ng of total plasmid DNA. Lipofectamine 2000 (12 μl; ThermoFisher Scientific) was used per well. Cells were collected at the indicated time point.
U2OS cell plasmid nucleofection
We combined 500 ng of Left DdCBE monomer and 500 ng of Right DdCBE monomer in a volume that did not exceed 2 μl. This combined plasmid mixture was nucleofected in a final volume of 22 μl per sample in a 16-well Nucleocuvette strip (Lonza). U2OS cells were nucleofected using the SE Cell Line 4D-Nucleofector X Kit (Lonza) with 30,000–50,000 cells per sample (program DN-100), according to the manufacturer’s protocol.
Cas9 mRNA in vitro transcription
A DNA fragment containing a T7 promoter driving expression of polyadenylated Cas9 transcript was isolated from purified plasmid (5 μg) using SpeI-HF restriction digestion (New England Biolabs) and purified with the MinElute PCR Purification Kit (Qiagen). mRNA was transcribed using the HiScribe T7 ARCA mRNA Kit (NEB) and purified using MEGAclear Transcription Clean-up kit (Thermo Fisher) according to the manufacturer’s instructions and stored at −80 °C.
Human primary fibroblast nucleofection
Human primary fibroblasts were nucleofected as previously described51. In brief, 500 ng of in vitro-transcribed Left-DdCBE mRNA and 500 ng of in vitro-transcribed Right-DdCBE mRNA were combined in a volume that did not exceed 2 μl. This combined mRNA mixture was nucleofected in a final volume of 22 μl per sample in a 16-well Nucleocuvette strip (Lonza). Human primary fibroblasts (GM04541, Coriell) were nucleofected using the P2 Primary Cell 4D-Nucleofector kit (Lonza) with 2.5 × 10⁵ cells per sample (program DS-150), according to the manufacturer’s protocol. The medium was changed after 24 h of nucleofection and cultured for 5 days before collection for high-throughput sequencing.
Cell viability assays
Cell viability was measured every 3 to 6 days over an 18-day time course using the CellTiter-Glo 2.0 assay (Promega) according to the manufacturer’s protocol. Luminescence was measured in 96-well flat black-bottomed polystyrene microplates (Corning) using a M1000 Pro microplate reader (Tecan) with a 1-s integration time.
Genomic DNA isolation from mammalian cell culture
Medium was removed, and cells were washed once with 1× Dulbecco’s phosphate-buffered saline (Thermo Fisher Scientific). Genomic DNA extraction was performed by addition of 40 μl freshly prepared lysis buffer (10 mM Tris-HCl (pH 8.0), 0.05% SDS, and proteinase K (20 μg ml−1; Thermo Fisher Scientific)) directly into the 48-well culture well. The extraction solution was incubated at 37 °C for 60 min and then 80 °C for 20 min. The resulting genomic DNA was subjected to bead cleanup with AMPure DNAdvance beads according to the manufacturer’s instructions (Beckman Coulter A48705).
For DNA isolation and Sanger sequencing of ND4-edited cells, total DNA was extracted from cells with the use of DNeasy Blood & Tissue Kit (Qiagen). The ND4 gene fragment spanning the edited m.11922 site was amplified with the use of AccuPrime Taq DNA Polymerase System (Thermo Fisher). Primers used for the PCR are listed in Supplementary Table 13. PCR reaction products were purified by gel extraction with the use of QIAquick Gel Extraction Kit (Qiagen) and subjected to Sanger sequencing at Genwiz.
High-throughput DNA sequencing of genomic DNA samples
Genomic sites of interest were amplified from genomic DNA samples and sequenced on an Illumina MiSeq as previously described with the following modifications52. Amplification primers containing Illumina forward and reverse adapters (Supplementary Table 13) were used for a first round of PCR (PCR 1) to amplify the genomic region of interest. In brief, 1 μl of purified genomic DNA was used as input into the first round of PCR (PCR1). For PCR1, DNA was amplified to the top of the linear range using Phusion Hot Start II High-Fidelity DNA Polymerase (Thermo Fisher Scientific), according to the manufacturer’s instructions but with the addition of 0.5x SYBR Green Nucleic Acid Gel Stain (Lonza) in each 25-μl reaction. For all amplicons, the PCR1 protocol used was an initial heating step of 2 min at 98 °C followed by an optimized number of amplification cycles (10 s at 98 °C, 20 s at 62 °C, 30 s at 72 °C). Quantitative PCR was performed to determine the optimal cycle number for each amplicon. The number of cycles needed to reach the top of the linear range of amplification are about 27–28 cycles for nuclear DNA amplicons and about 17–19 cycles for mtDNA amplicons. Barcoding PCR2 reactions (25 μl) were performed with 1 μl of unpurified PCR1 product and amplified with Q5 Hot Start MasterMix (NEB) using the following protocol: 98 °C for 2 min, then 9 cycles of (98 °C for 10 s, 61 °C for 20 s, and 72 °C for 30 s), followed by a final 72 °C extension for 2 min. PCR products were evaluated analytically by electrophoresis in a 1.5% agarose gel. After PCR2, up to 300 samples with different barcode combinations were combined and purified by gel extraction using the QIAquick Gel Extraction Kit (Qiagen). DNA concentration was quantified using the Qubit ssDNA HS Assay Kit (Thermo Fisher Scientific) to make up a 4 nM library. The library concentration was further verified by qPCR (KAPA Library Quantification Kit-Illumina, Kapa Biosystems) and sequenced using an Illumina MiSeq with 210- to 300-bp single-end reads.
Analysis of high-throughput sequencing data for DNA sequencing and targeted amplicon sequencing
Sequencing reads were demultiplexed using MiSeq Reporter (Illumina). Batch analysis with CRISPResso253 was used for targeted amplicon and DNA sequencing analysis. A 10-bp window was used to quantify indels centred around the middle of the dsDNA spacing. To set the cleavage offset, a hypothetical 15-or 16-bp spacing region has a cleavage offset of −8. Otherwise, the default parameters were used for analysis. The output file “Reference.NUCLEOTIDE_PERCENTAGE_SUMMARY.txt” was imported into Microsoft Excel for quantification of editing frequencies. Reads containing indels within the 10-bp window are excluded for calculation of editing frequencies. The output file “CRISPRessoBatch_quantification_of_editing_frequency.txt” was imported into Microsoft Excel for quantification of indel frequencies. Indel frequencies were computed by dividing the sum of insertions and deletions over the total number of aligned reads.
Determination of relative total mitochondrial DNA levels by quantitative PCR
Quantitative PCR (qPCR) reactions were performed on a Bio-Rad CFX96/C1000 qPCR machine performed using SYBR green (Lonza). For Extended Data Fig. 6i, 5 ng of purified DNA was used as template input in a 25-μl reaction volume. For Extended Data Fig. 8a, 8 ng of purified DNA was used as template input in a 25-μl reaction volume. For all reactions, the protocol used was an initial heating step of 2 min at 98 °C followed by 40 cycles of amplification (10 s at 98 °C, 20 s at 62 °C, 15 s at 72 °C). Single threshold values (ΔC) were determined by manufacturer’s software. For Extended Data Fig. 6i, the level of mtDNA was determined by the calculating the ratio of total mtDNA to genomic DNA (β-actin) (Ratio = EmtDNAΔC(DdCBE – dead DdCBE)/Eβ-actin ΔC(DdCBE – dead DdCBE), where E is the efficiency of the qPCR reaction; END6 = 0.858, END5 = 0.844, EATP8 = 0.995, Eβ-actin = 1.05). For the assessment of mtDNA level in Extended Data Fig. 8a, 8 ng of isolated DNA was used in qPCR reaction performed with the use of iQ SYBR Green Supermix (Bio-Rad). Relative abundance of the amplified ND1 gene fragment was normalized to the amplified B2M gene fragment. See Supplementary Table 13 for list of primers used. NC_012920 was used as the reference for mtDNA; NG_003019 was used as the reference for human ACTBP2.
RNA isolation and RT-qPCR
Total RNA was extracted from cells with the use of RNeasy Mini Kit (Qiagen) and digested with DNase I (Qiagen). Isolated RNA (500 ng) was used for reverse transcription performed with the use of SuperScript III First-Strand Synthesis SuperMix for qRT–PCR (Thermo Fisher). The obtained cDNA was used for qPCR. Analysis of mitochondrial gene expression was performed with the use of iQ SYBR Green Supermix (BioRad) using primers listed in Supplementary Table 13. Data was normalized to B2M abundance.
Oxygen consumption analysis by Seahorse XF analyser
Seahorse plate was coated with 0.01% (w/v) poly-l-lysine (Sigma). Cells (1.6 × 10⁴) were seeded on the coated Seahorse plate 16 h before the analysis in the Seahorse XFe96 Analyzer (Agilent). Analysis was performed in the Seahorse XF DMEM Medium pH 7.4 (Agilent) supplemented with 10 mM glucose (Agilent), 2 mM l-glutamine (Gibco) and 1 mM sodium pyruvate (Gibco). Mito stress protocol was applied with the use of 1.5 mM oligomycin, 1 mM FCCP and 1 mM piericidin + 1 mM antimycin.
Complex I and IV activity assay
Complex I activity assay was performed with the use of colorimetric Complex I Enzyme Activity Microplate Assay Kit (Abcam) according to the manufacturer’s protocol. Complex IV activity assay was performed with the use of colorimetric Complex IV Human Enzyme Activity Microplate Assay Kit (Abcam) according to the manufacturer’s protocol. In brief, cells were collected and washed twice with PBS (Gibco) followed by protein extraction and incubation of clarified cell lysates at concentration of 0.25 mg ml−1 on the microplates for 3 h at room temperature. Complex I activity was determined by measurement of absorbance at OD = 450 nm, which is increased by reduction of a dye simultaneous to NADH to NAD+ oxidation. Complex IV activity was determined by measurement of absorbance at OD = 550 nm, which decreases following oxidation of reduced cytochrome c.
Long-range PCR to detect mtDNA deletions
Long-range PCR was performed on purified genomic DNA as previously with listed primers (Supplementary Table 13) to capture the whole mtDNA genome as two overlapping fragment of around 8 kb each. In brief, around 50–200 ng of purified DNA was used as input for amplification by PRIMESTAR GXL DNA polymerase (Takara). For all reactions, the protocol used was an initial heating step of 1 min at 94 °C followed by 30 cycles of amplification (30 s at 98 °C, 30 s at 60 °C, 9 min at 72 °C). Unpurified PCR products were run on 0.8% agarose gel and stained with ethidium bromide.
Immunocytochemical studies of DdCBE localization
HeLa cells were transfected with a total of 1 ug of plasmid DNA (500 ng for each monomer) to express left (HA-tagged) or right (FLAG-tagged) monomers of each DdCBE using Lipofectamine 3000 (Thermo Fisher) according to the manufacturer’s protocol. After 24 h incubation, cells were labelled with MitoTracker Deep Red (Thermo Fisher) at a final concentration of 100 nM for 30 min at 37 °C, 5% CO2 incubator. Cells were then seeded on an 8-well chamber glass slide (Ibidi) and fixed in 4% paraformaldehyde/PBS for 15 min at room temperature. Next, cells were washed twice with PBS and permeabilized in PBS containing 0.1% saponin and 1% BSA for 30 min at room temperature. Cells were then immunostained with anti-HA (Biolegend) or anti-FLAG (Sigma Aldrich), followed by Alexa-Fluor conjugated anti-mouse (HA tag) or anti-rabbit (Flag tag) secondary antibodies (Thermo Fisher). Images were taken using a 60× objective with the high-resolution widefield Nikon system. Acquired images were processed in Fiji48.
Bulk ATAC–seq for whole mitochondrial genome sequencing
Assay for transposase-accessible chromatin with sequencing (ATAC–seq) was performed as previously described54. In brief, 5,000–10,000 cells were trypsinzed, washed with cold 1X PBS, pelleted by centrifugation (500 g at 4 °C for 5 min) and lysed in 50 μl of cold and freshly prepared lysis buffer (0.1% Igepal CA-360 (v/v %), 10 mM Tris-HCl, 10 mM NaCl and 3 mM MgCl2 in nuclease-free water). Lysates were incubated on ice for 3 min, pelleted at 500 g for 10 min at 4 °C and tagmented with 2.5 μl of Tn5 transposase (Illumina, 15027865) in a total volume of 10 μl containing 1x TD buffer (Illumina, 15027866), 0.1% NP-40 (Sigma) and 0.3x PBS. Samples were incubated at 37 °C for 30 min on a thermomixer at 300 rpm. DNA was purified using the MinElute PCR Kit (Qiagen) and eluted in 10 μl elution buffer. All 10 μl of the eluate was amplified using indexed primers (1.25 μM each) listed in Supplementary Table 13 and NEBNext High-Fidelity 2X PCR Master Mix (NEB) in a total volume of 50 μl using the following protocol: 72 °C for 5 min, 98 °C for 30 s, then 5 cycles of (98 °C for 10 s, 63 °C for 30 s, and 72 °C for 60 s), followed by a final 72 °C extension for 1 min. After the initial 5 cycles of pre-amplification, 5 μl of partially amplified library was used as input DNA in a total volume of 15 μl for quantitative PCR using SYBR Green (0.5x, Lonza) to determine the number of additional cycles needed to reach 1/3 of the maximum fluorescence intensity. Typically, 3–8 cycles were conducted on the remaining 45 μl of partially amplified library. The final library was purified using a MinElute PCR kit (Qiagen) and quantified using a Qubit dsDNA HS Assay kit (Invitrogen) and a High Sensitivity DNA chip run on a Bioanalyzer 2100 system (Agilent). All libraries were sequenced using Nextseq High Output Cartridge kits on an Illumina Nextseq 500 sequencer. Libraries were sequenced using paired-end 2×75 cycles and demultiplexed using the bcl2fastq program.
Targeted amplicon sequencing for nuclear DNA off-target analyses
Genomic DNA was isolated and purified as described in “Genomic DNA isolation from mammalian cell culture”. The on-target mtDNA binding sites for ND6-, ND5.1- and ND4-DdCBE were aligned to the NCBI reference sequence for human chromosome 5 (NC_000005.10) to identify MTND6P4, MTND5P11 and MTND4P12. These pseudogenes are regions in the nuclear DNA that contain the greatest homology to their respective DdCBE binding sites in mtDNA. Samples were prepared for high-throughput sequencing as described in “High-throughput DNA sequencing of genomic DNA samples”. The following primers were used for appending sequencing adapters to MTND6P4: MTND6P4 forward: ACACTCTTTCCCTACACGACGCTCTTCCGATCTNNNNGTTGTAGCCCGTGCAAGAATAATG; MTND6P4 reverse: TGGAGTTCAGACGTGTGCTCTTCCGATCTTAACACTAATCCTACTTCCATC. For MTND5P11 and MTND4P12, a 5 kb region was amplified with primer set 1 (Forward 1 and Forward 2) to ensure selective amplification of nuclear DNA rather than mtDNA. The 5-kb fragment was purified using MinElute PCR Kit (Qiagen) and used as the DNA input for subsequent amplification steps using the indicated sequencing adaptor primers: Forward 1: CTAATTCTCTTTGAGGAGCATGGTTAG; Forward 2: TATCACTTCCAGCCACCTATTTCC; MTND5P11 forward: ACACTCTTTCCCTACACGACGCTCTTCCGATCTNNNNGGAAGCGAGGCTGACCTGTTA; MTND5P11 reverse: TGGAGTTCAGACGTGTGCTCTTCCGATCTCCACGCCTTCTTCAAAGCCAT; MTND4P12 forward: ACACTCTTTCCCTACACGACGCTCTTCCGATCTNNNNCTATATTTACAGGAGGAAAACCCGG; MTND4P12 reverse: TGGAGTTCAGACGTGTGCTCTTCCGATCTGACTTCTAGCAAGCCTCACTAATC.
Genome sequencing and SNP identification in mitochondria
SNP identification in mitochondria was performed similarly to in bacteria, with the following modifications. Genome mapping was performed with BWA (v.0.7.17) using NC_012920 genome as a reference. Duplicates were marked using Picard tools (v.2.20.7). Pileup data from alignments were generated with SAMtools (v.1.9) and variant calling was performed with VarScan2 (v.2.4.3). Variants that were present at a frequency greater than 0.1% and a P value less than 0.05 (Fisher’s exact test) were called as high-confidence SNPs independently in each biological replicate. Only reads with a Phred quality score (Q) of greater than 30 at a given position were taken into account when calling SNPs at that particular position.
Calculation of average off-target C•G-to-T•A editing frequency
To calculate the mitochondrial genome-wide average off-target editing frequency for each DdCBE in Fig. 5b, we used REDItools (v.1.2.1)55. All nucleobases except cytosines and guanines were removed and the number of reads covering each C•G base pair with a Phred quality score greater than 30 (Q > 30) was calculated. The on-target C•G base pairs (depending on the DdCBE used in each treatment) were excluded in order to consider only off-target effects. C•G-to-T•A SNVs present at high frequencies (greater than 50%) in both treated and untreated samples (that therefore did not arise from DdCBE treatment) were also excluded. The average off-target editing frequency was then calculated independently for each biological replicate of each treatment condition as: (number of reads in which a given C•G base pair was called as a T•A base pair, summed over all non-target C•G base pairs)/(total number of reads that covered all non-target C•G base pair). Sequence logos in Fig. 5c, depicting the local sequence context of all off-target SNVs, were generated as described previously56. For Supplementary Tables 8 and 9, the average frequency of each SNV was calculated by taking the average of three frequencies from the biological triplicates.
Effect prediction of the C•G-to-T•A off-target SNVs identified by ATAC–seq
SIFT57 (https://sift.bii.a-star.edu.sg/) was used to predict the outcome of nonsynonymous mutations on protein function. High- and low-confidence calls were made using standard SIFT parameters with GRCh37.74 database as the reference genome.
Extended Data
Extended Data Fig. 1 |. Analysis of the bactericidal activity of DddA and its activity against dsDNA and RNA substrates.
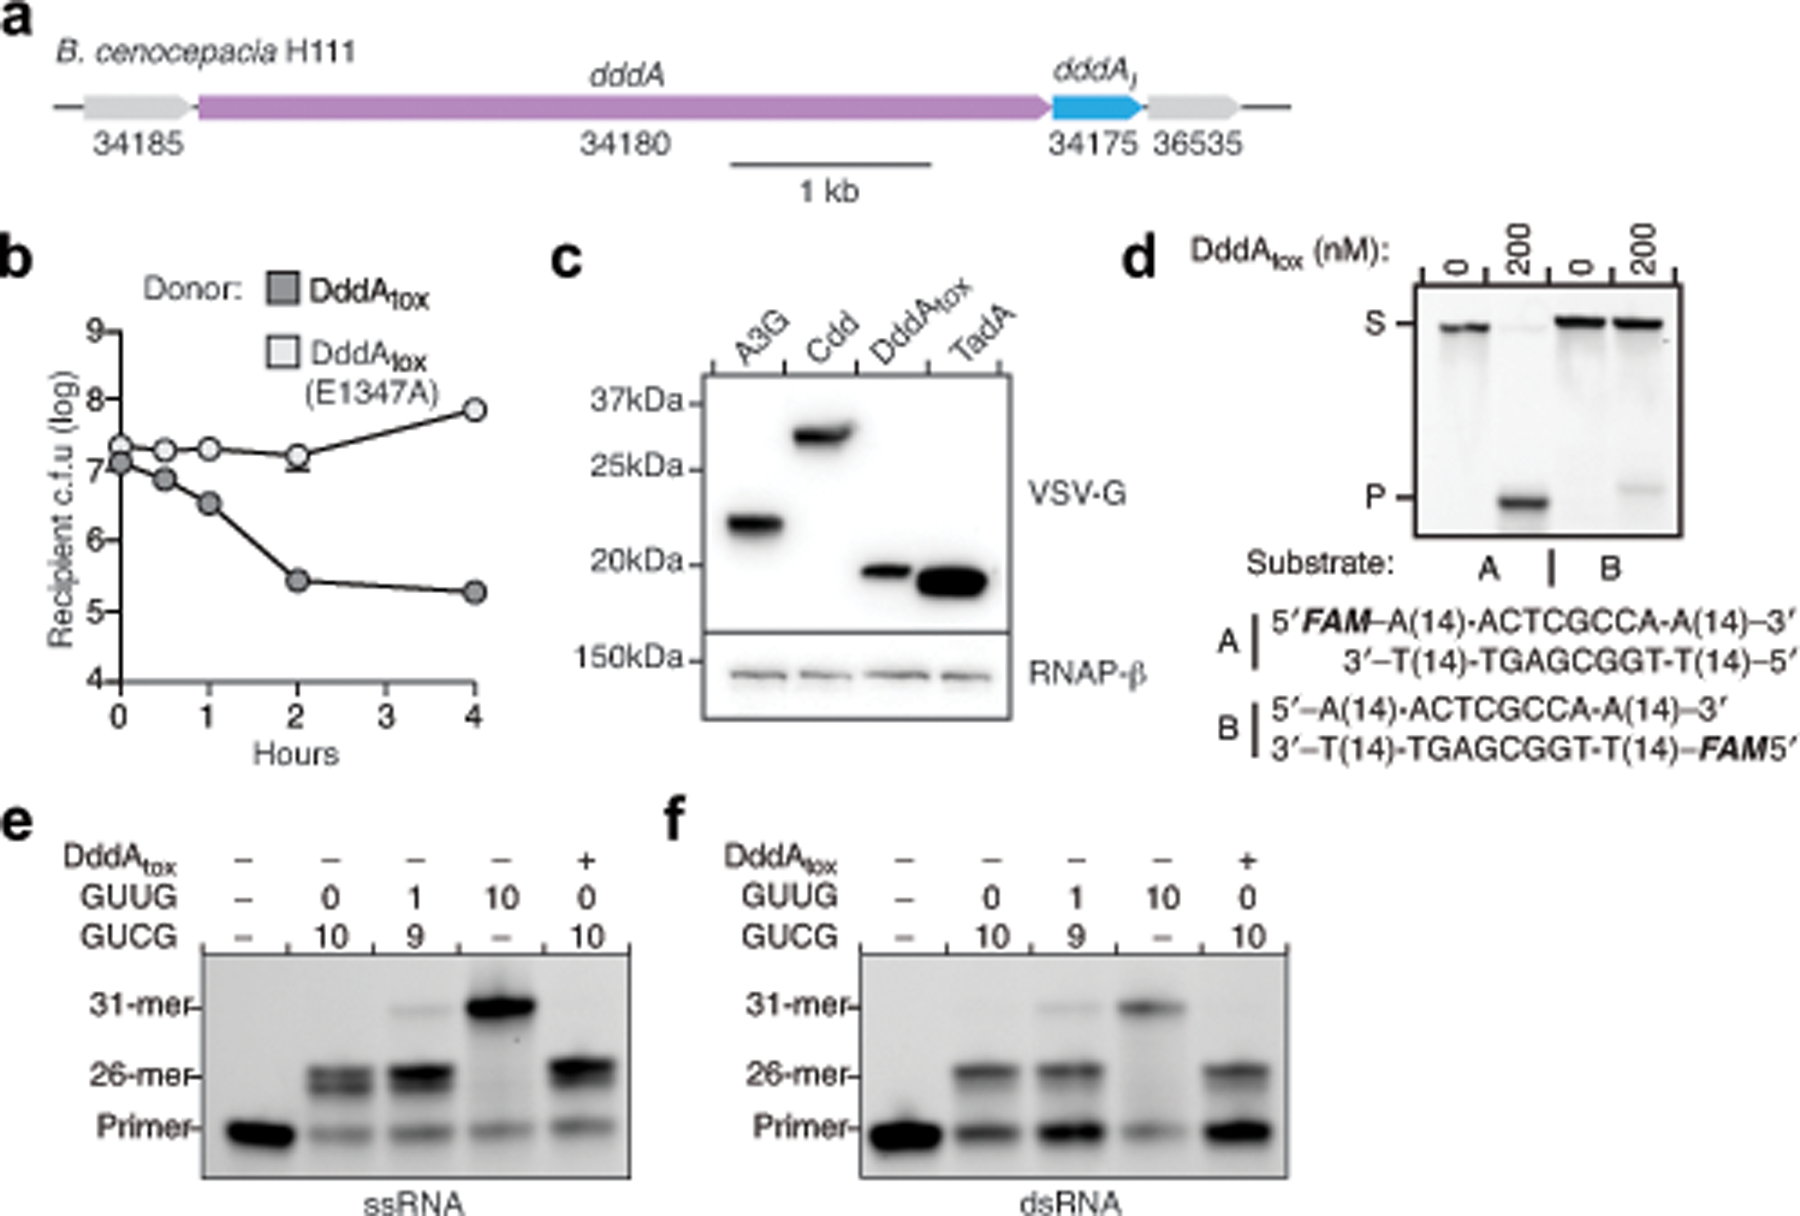
a, Genomic context of dddA (purple) and dddIA (blue) in B. cenocepacia H111. b, Viability of B. cenocepacia ΔdddA ΔdddIA (recipient) over time during competition with B. cenocepacia donor strains carrying wild-type dddAtox or dddAtoxE1347A. Values and error bars represent the mean ± s.d. of three technical replicates. The experiment was repeated three times with similar results. c, α-VSV-g western blot analysis of total cell lysates of E. coli expressing the indicated deaminases tagged with VSV-G epitope. RNAP-β was used as a loading control. Results are representative of n = 2 independent biological replicates. d, In vitro DNA cytidine deamination assays using double-stranded 36-nt DNA substrates containing AC, TC, CC, and GC with a FAM fluorophore on the forward (A) or reverse (B) strand. Deamination activity results in a cleaved product (P). Images are representative of n = 2 independent biological replicates. e, f, Poisoned primer extension assay to detect deamination of cytidine in single-stranded (e) or double-stranded (f) RNA substrates. Images are representative of n = 2 independent biological replicates. A mix of RNA substrates containing the sequences GUCG or GUUG at the indicated ratios were incubated with purified DddAtox and reverse transcriptase. Primer extension was performed in reactions with ddGTP to terminate primer extension at cytidines. Cytidine deamination yields the 31-mer product.
Extended Data Fig. 2 |. DddAtox deaminates cytidines in bacteria with strong sequence context preference.
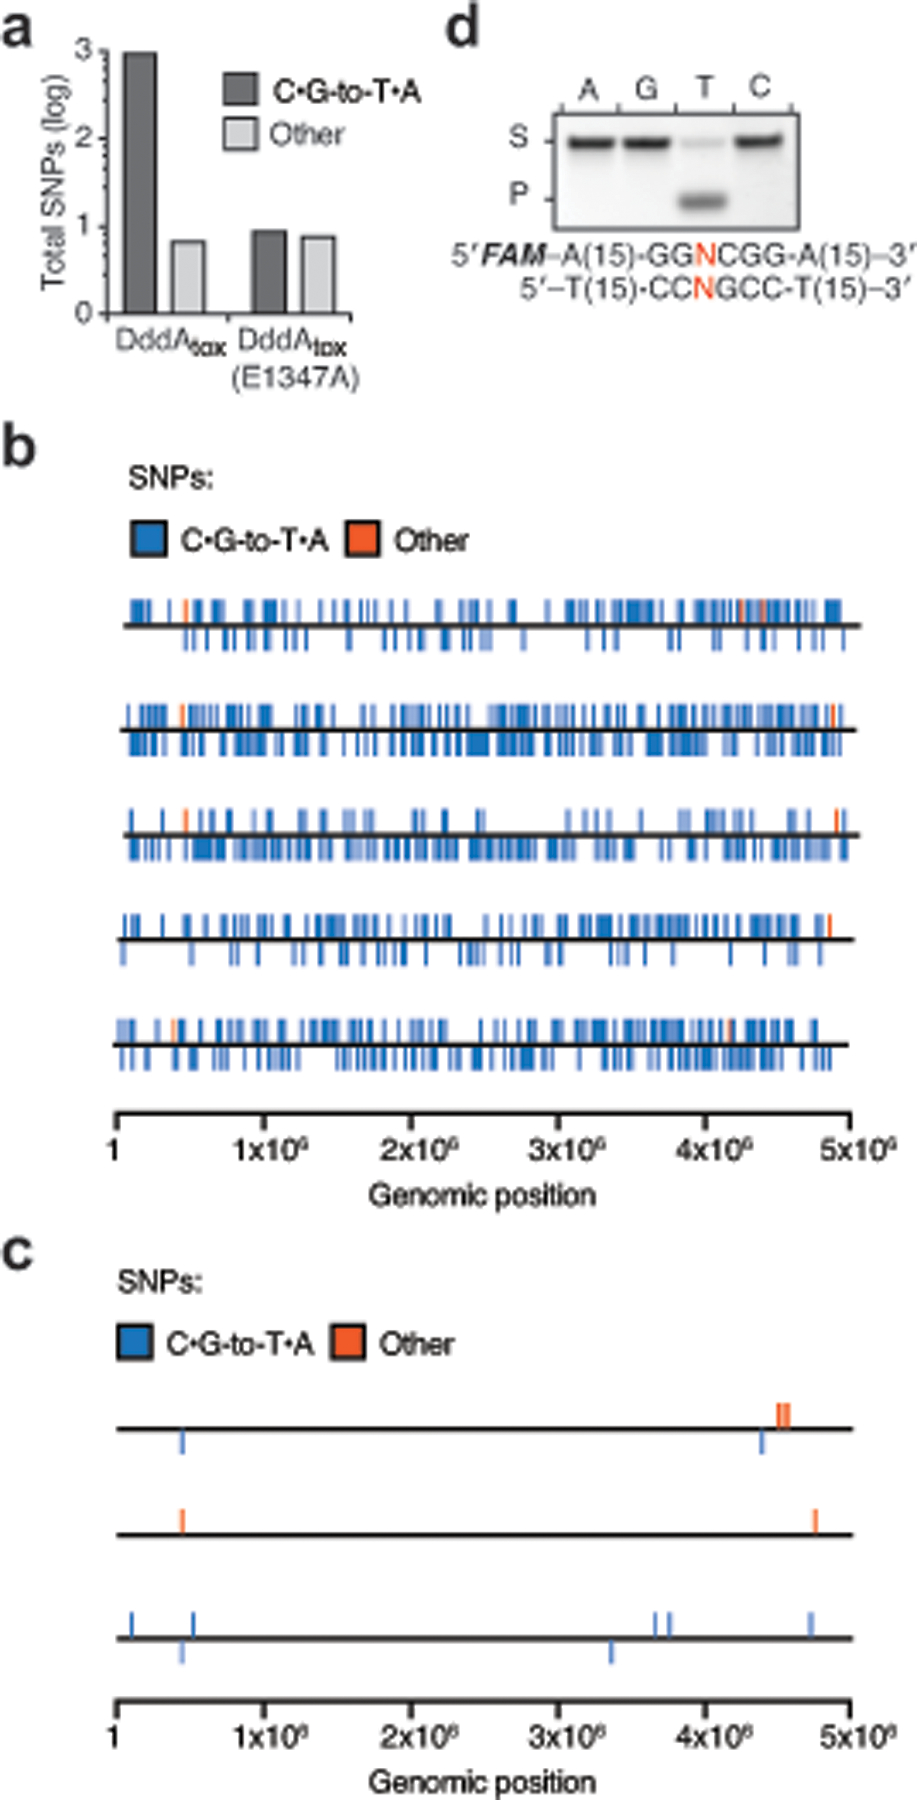
a, Number of SNPs from the indicated nucleotide classifications observed in E. coli Δudg following intoxication with DddAtox or DddAtox(E1347A). b, c, The position of SNPs on the chromosome of E. coli Δudg isolates intoxicated with DddAtox (b) or DddAtox(E1347A) (c). SNPs above the line indicate C-to-T transitions on the plus strand; SNPs below indicate C-to-T transitions on the minus strand. Other mutations are represented on the plus strand. Sequencing coverage was 203–265-fold. d, Deamination assay on DddAtox with double-stranded DNA substrates containing a single C with different nucleotides (A, T, C or G) at the position immediately 5′ of the C (red) (S, substrate; P, product). Images are representative of n = 3 independent biological replicates.
Extended Data Fig. 3 |. Base-editing efficiencies and indel frequencies of all DddAtox splits in HEK293T cells.
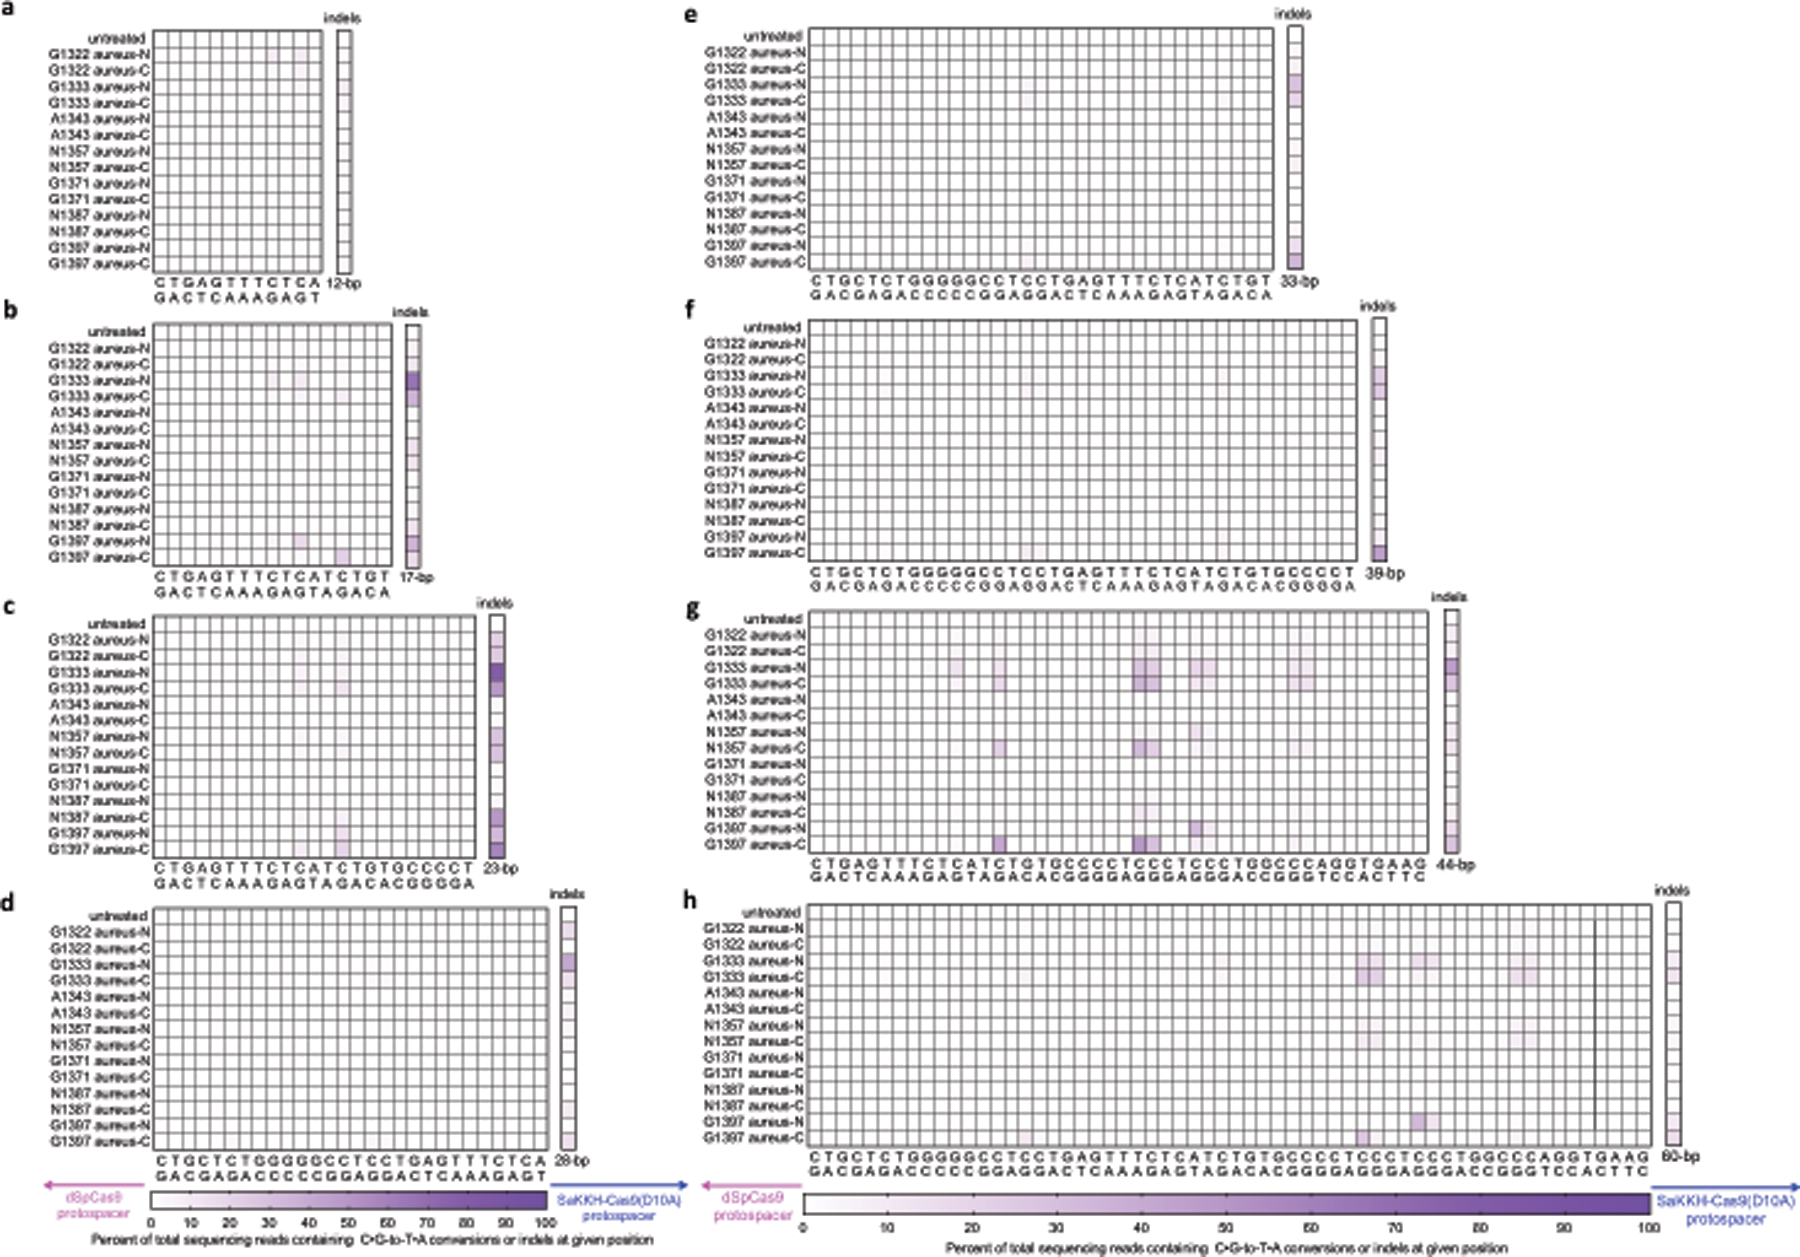
a–h, Each split was assayed in the aureus-N and aureus-C orientation (see Fig. 2b) across spacing region lengths of 12-bp (a), 17-bp (b), 23-bp (c), 28-bp (d), 33-bp (e), 39-bp (f), 44-bp (g) and 60-bp (h). Cells were collected 3 days post-transfection for DNA sequencing. Colours reflect the mean of n = 2 independent biological replicates.
Extended Data Fig. 4 |. TALE–split DddAtox proteins mediate efficient base editing in nuclear DNA of U2OS cells.
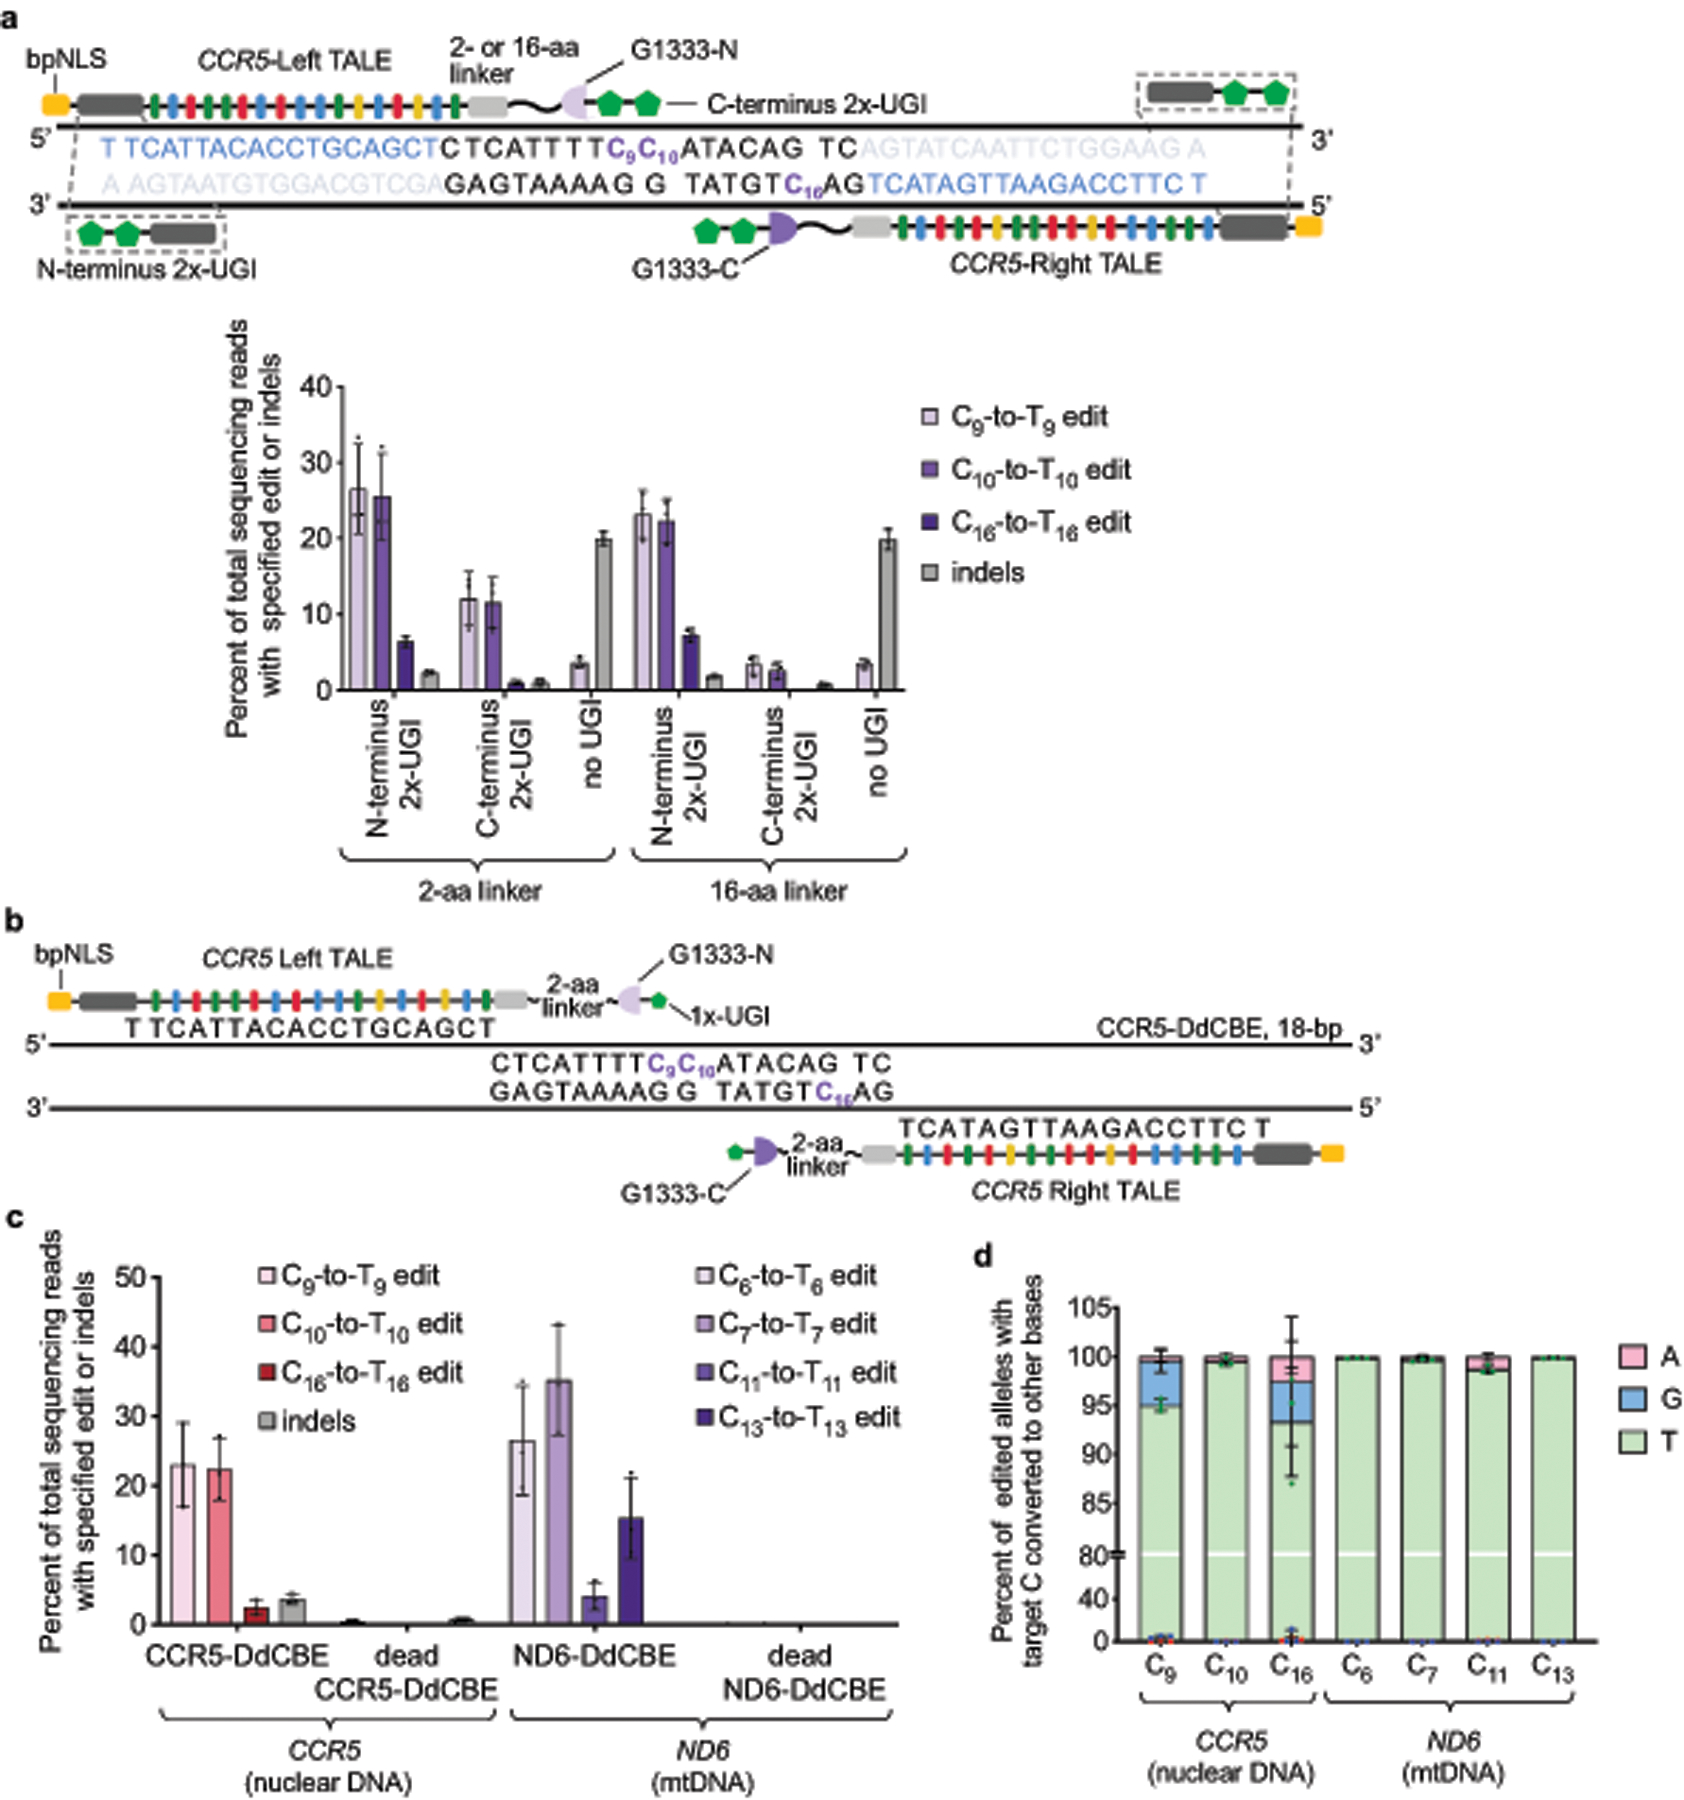
a, Left–G1333-DddAtox-N and Right–G1333-DddAtox-C bind DNA sequences within CCR5. Target cytosines are shown in purple and TALE binding sites are shown in blue. Two copies of UGI proteins (2×-UGI) were fused to the N- or C terminus through a 2- or 16-amino acid linker. Editing efficiencies and indel frequencies for the possible combinations of UGI positions and linker lengths are shown. In the absence of UGI protein, only C9-to-T9 edit was observed. b, Architecture of nuclear-targeting CCR5-DdCBE (see Fig. 3c for optimized DdCBE architecture targeting mtDNA). Target cytosines are shown in purple. c, Editing efficiencies and indel frequencies of cells treated with CCR5-DdCBE and ND6-DdCBE 3-days-post transfection are shown. Dead-DdCBEs containing the inactive DddAtox(E1347A) mutant were used as negative controls. d, Outcomes among edited alleles in which the specified target C is mutated are shown for the indicated base editor. Values and error bars in a, c and d reflect the mean ± s.d. of n = 3 independent biological replicates.
Extended Data Fig. 5 |. Unoptimized mitoTALE–split DddAtox fusions mediate modest editing of mitochondrial ND6 in HEK293T cells.
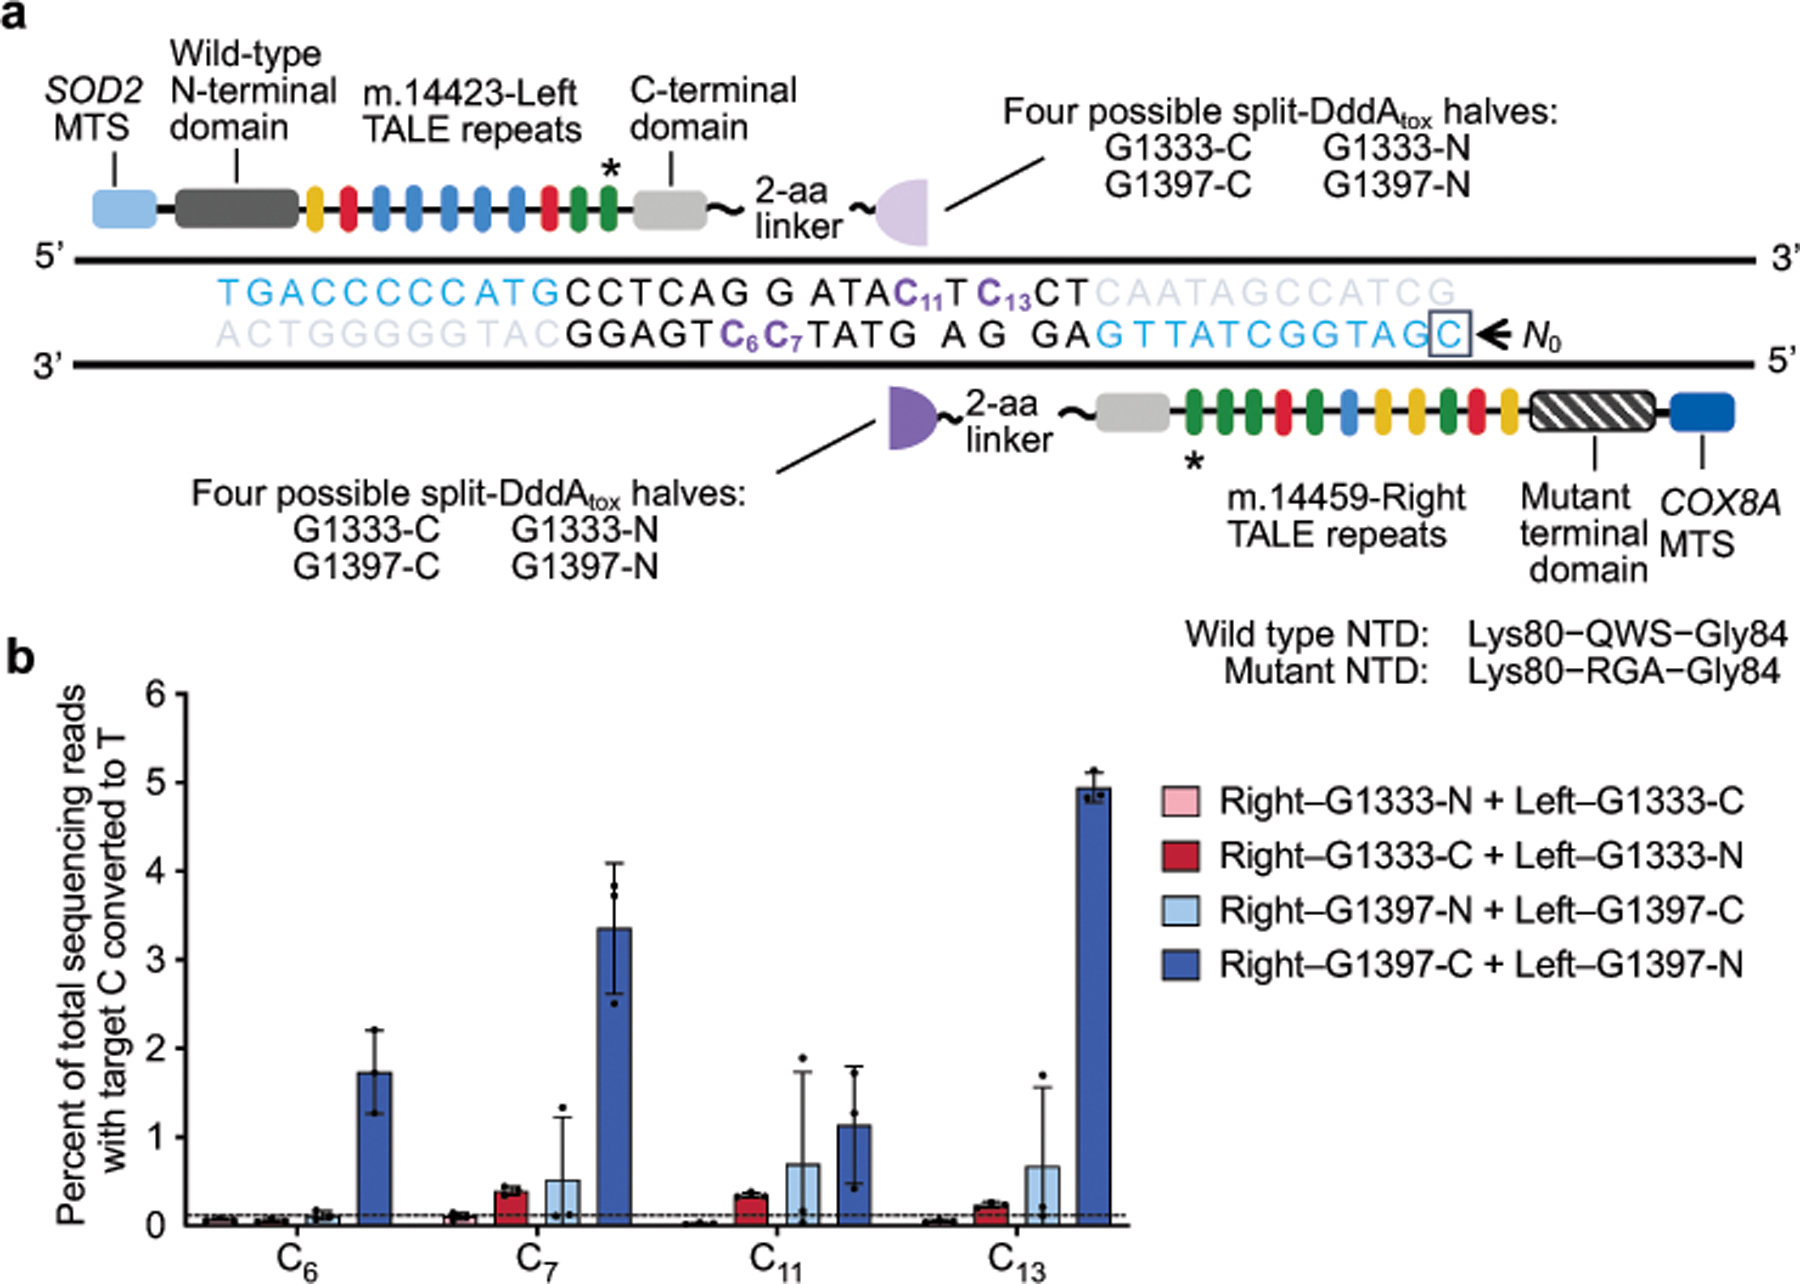
a, Architectures of non-UGI containing ND6-mitoTALE–DddAtox fusion pair. DddAtox was split at G1333 or G1397, with each half fused to either the left TALE or the right TALE. TALEs bind to mtDNA sequences (blue) that flank a 15-bp spacing region in mitochondrial ND6. Target cytosines are shown in purple. The last TALE repeat (*) did not match the reference genome9 (see Supplementary Table 4). b, mtDNA editing efficiencies of mitoTALE–DddAtox pairs in the listed split orientations. The dashed line is drawn at 0.1%. Values and error bars reflect the mean ± s.d. of n = 3 independent biological replicates.
Extended Data Fig. 6 |. DdCBE editing in HEK293T cells persist over multiple divisions while maintaining cell viability and mitochondrial DNA integrity.
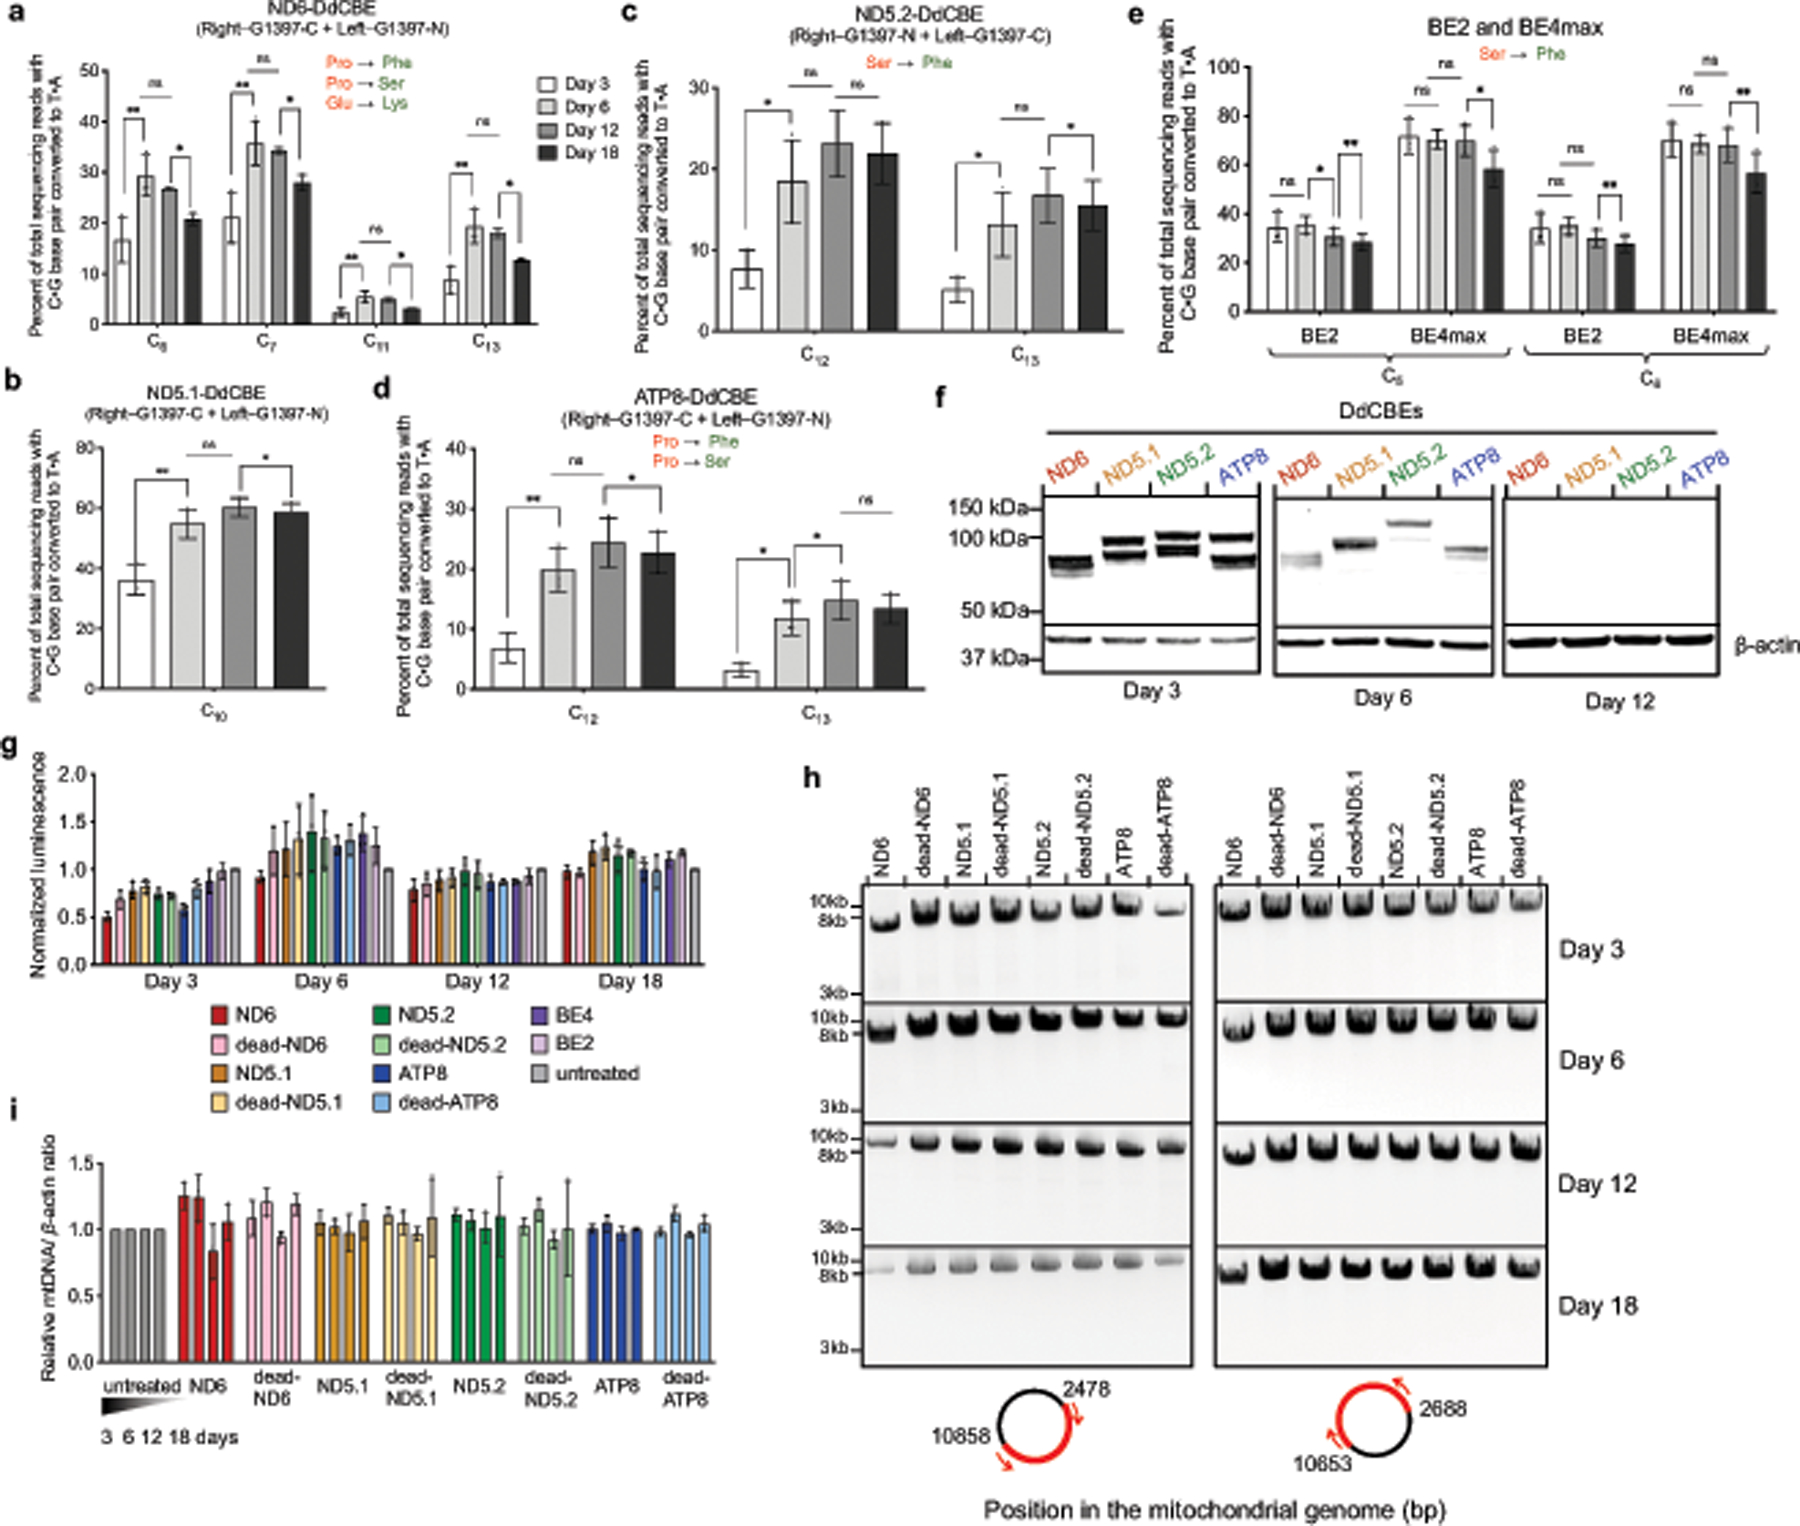
a–e, Editing efficiencies for optimized ND6-DdCBE (a), MTND5P1-DdCBE (denoted ND5.1-DdCBE) (b), MTND5P2-DdCBE (denoted ND5.2-DdCBE) (c), ATP8-DdCBE (d) and BE2max and BE4max (e) are shown for each time point. C•G-to-T•A conversions at protein-coding genes that generate missense mutations (green) of the putative amino acid (red) are shown. f, Western blots of ND6-, ND5.1-, ND5.2- and ATP8-DdCBE at various time points. The right halves were FLAG-tagged and the left halves were HA-tagged. Day 3 images are representative of n = 3 independent biological replicates; n = 1 for day 6 and day 12 images (see Supplementary Data 3 for uncropped images and fluorescent tagging of each half). Nuclear β-actin was used as a loading control. g, Cell viability was measured by recording the luminescence at the indicated time points. Luminescence values were normalized to the untreated control. h, DNA gel of PCR-amplified mtDNA captured as two amplicons (red). Images are representative of n = 3 independent biological replicates (see Supplementary Data 4 for uncropped images). i, mtDNA levels of DdCBE-edited cells were measured by qPCR relative to untreated cells. Values and error bars in a–e, g and i reflect the mean ± s.d. of n = 3 independent biological replicates. For a–e, asterisks indicate significant editing based on a comparison between indicated time points. *P < 0.05 and **P < 0.01 by Student’s two-tailed paired t-test. Individual P values are listed in Supplementary Table 7.
Extended Data Fig. 7 |. Stalling mtDNA replication impairs mitochondrial base editing in human cells.
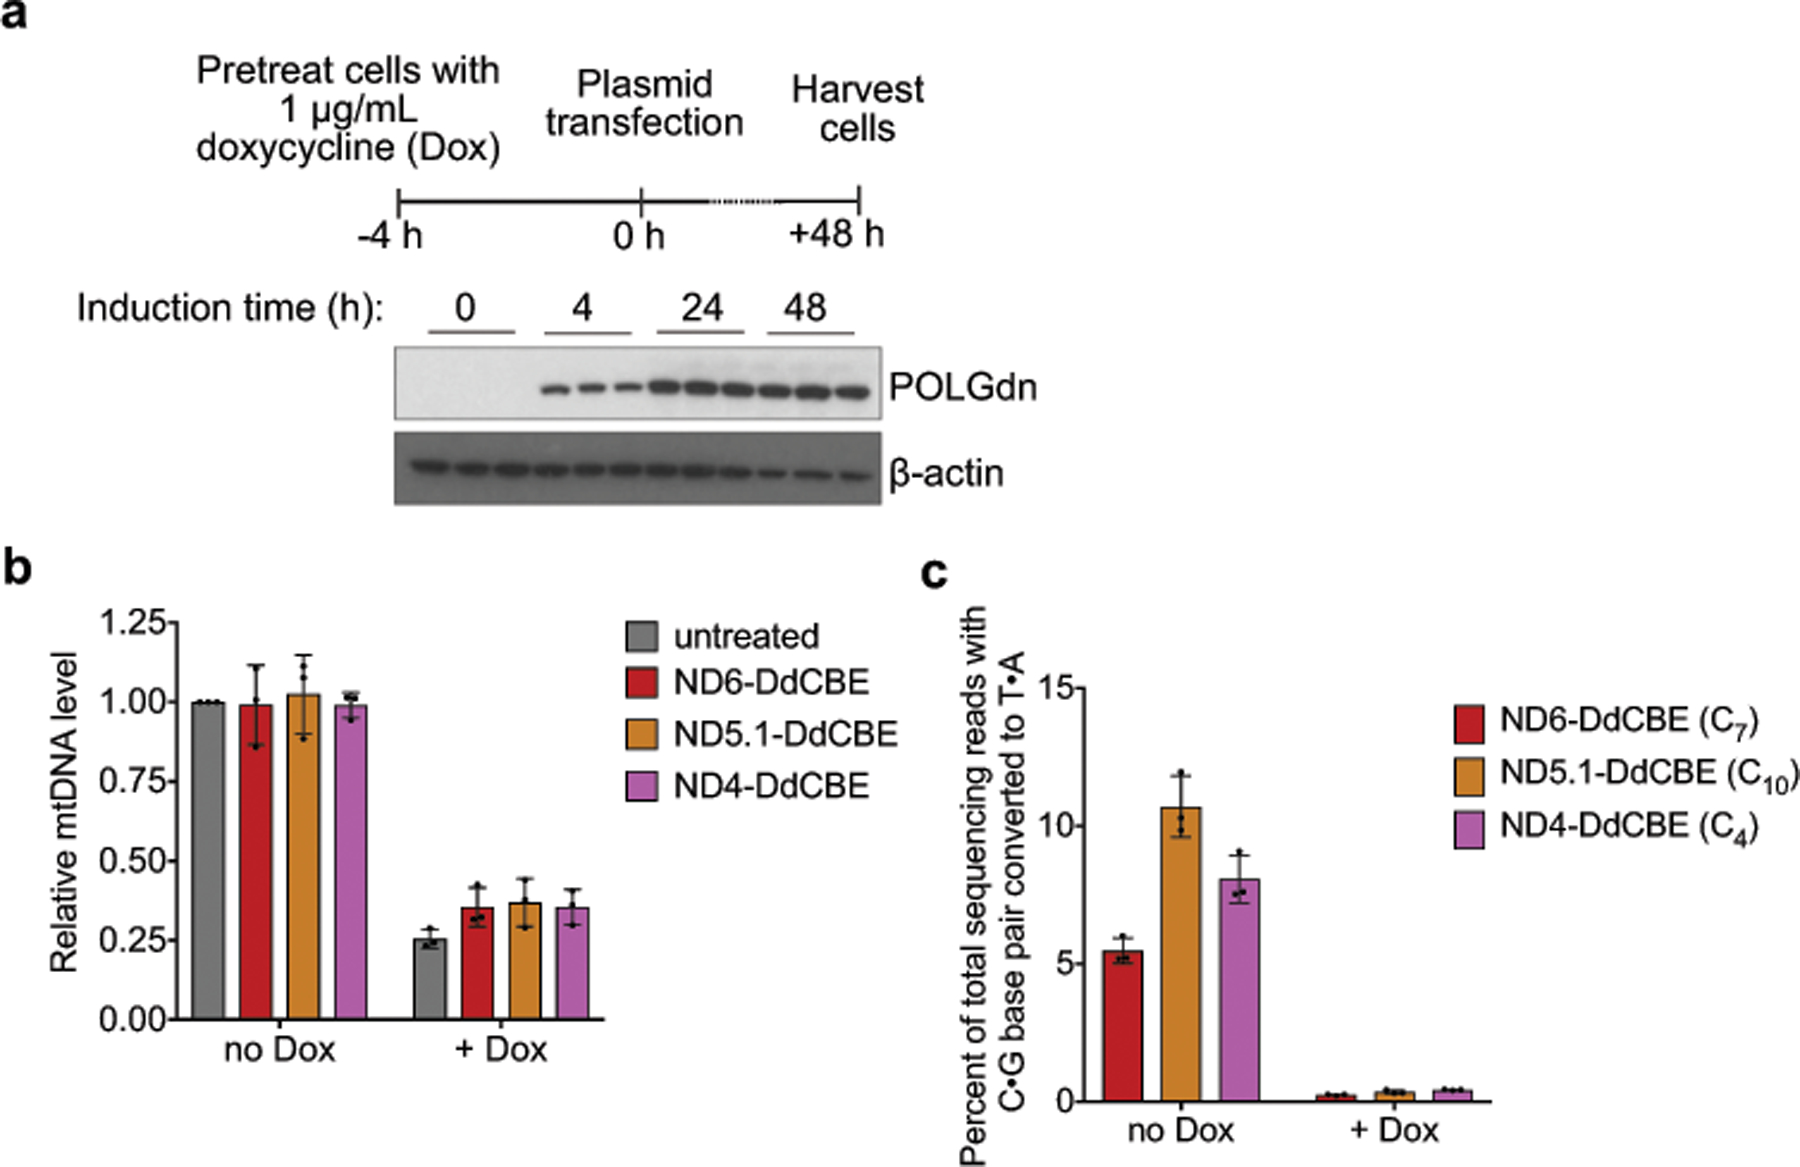
a, Schematic of experimental design. Addition of doxycycline (Dox) induces the stable expression of a dominant-negative mutant of DNA polymerase-gamma containing a D1153A substitution (POLGdn) in a HEK293-derived cell line31. Total cell lysate was collected at indicated time points for western blotting of POLGdn in n = 3 independent biological replicates. b, mtDNA levels of uninduced (no Dox) and induced (+Dox) cells treated with indicated DdCBE 48 h post-transfection. mtDNA levels were measured by qPCR and normalized to uninduced cells without DdCBE treatment. c, Editing efficiencies of indicated DdCBE in uninduced and induced cells 48 h post-transfection. All values and error bars in b and c reflect the mean ± s.d. of n = 3 independent biological replicates.
Extended Data Fig. 8 |. Effect of DdCBE editing on mitochondrial function and mtDNA homeostasis.
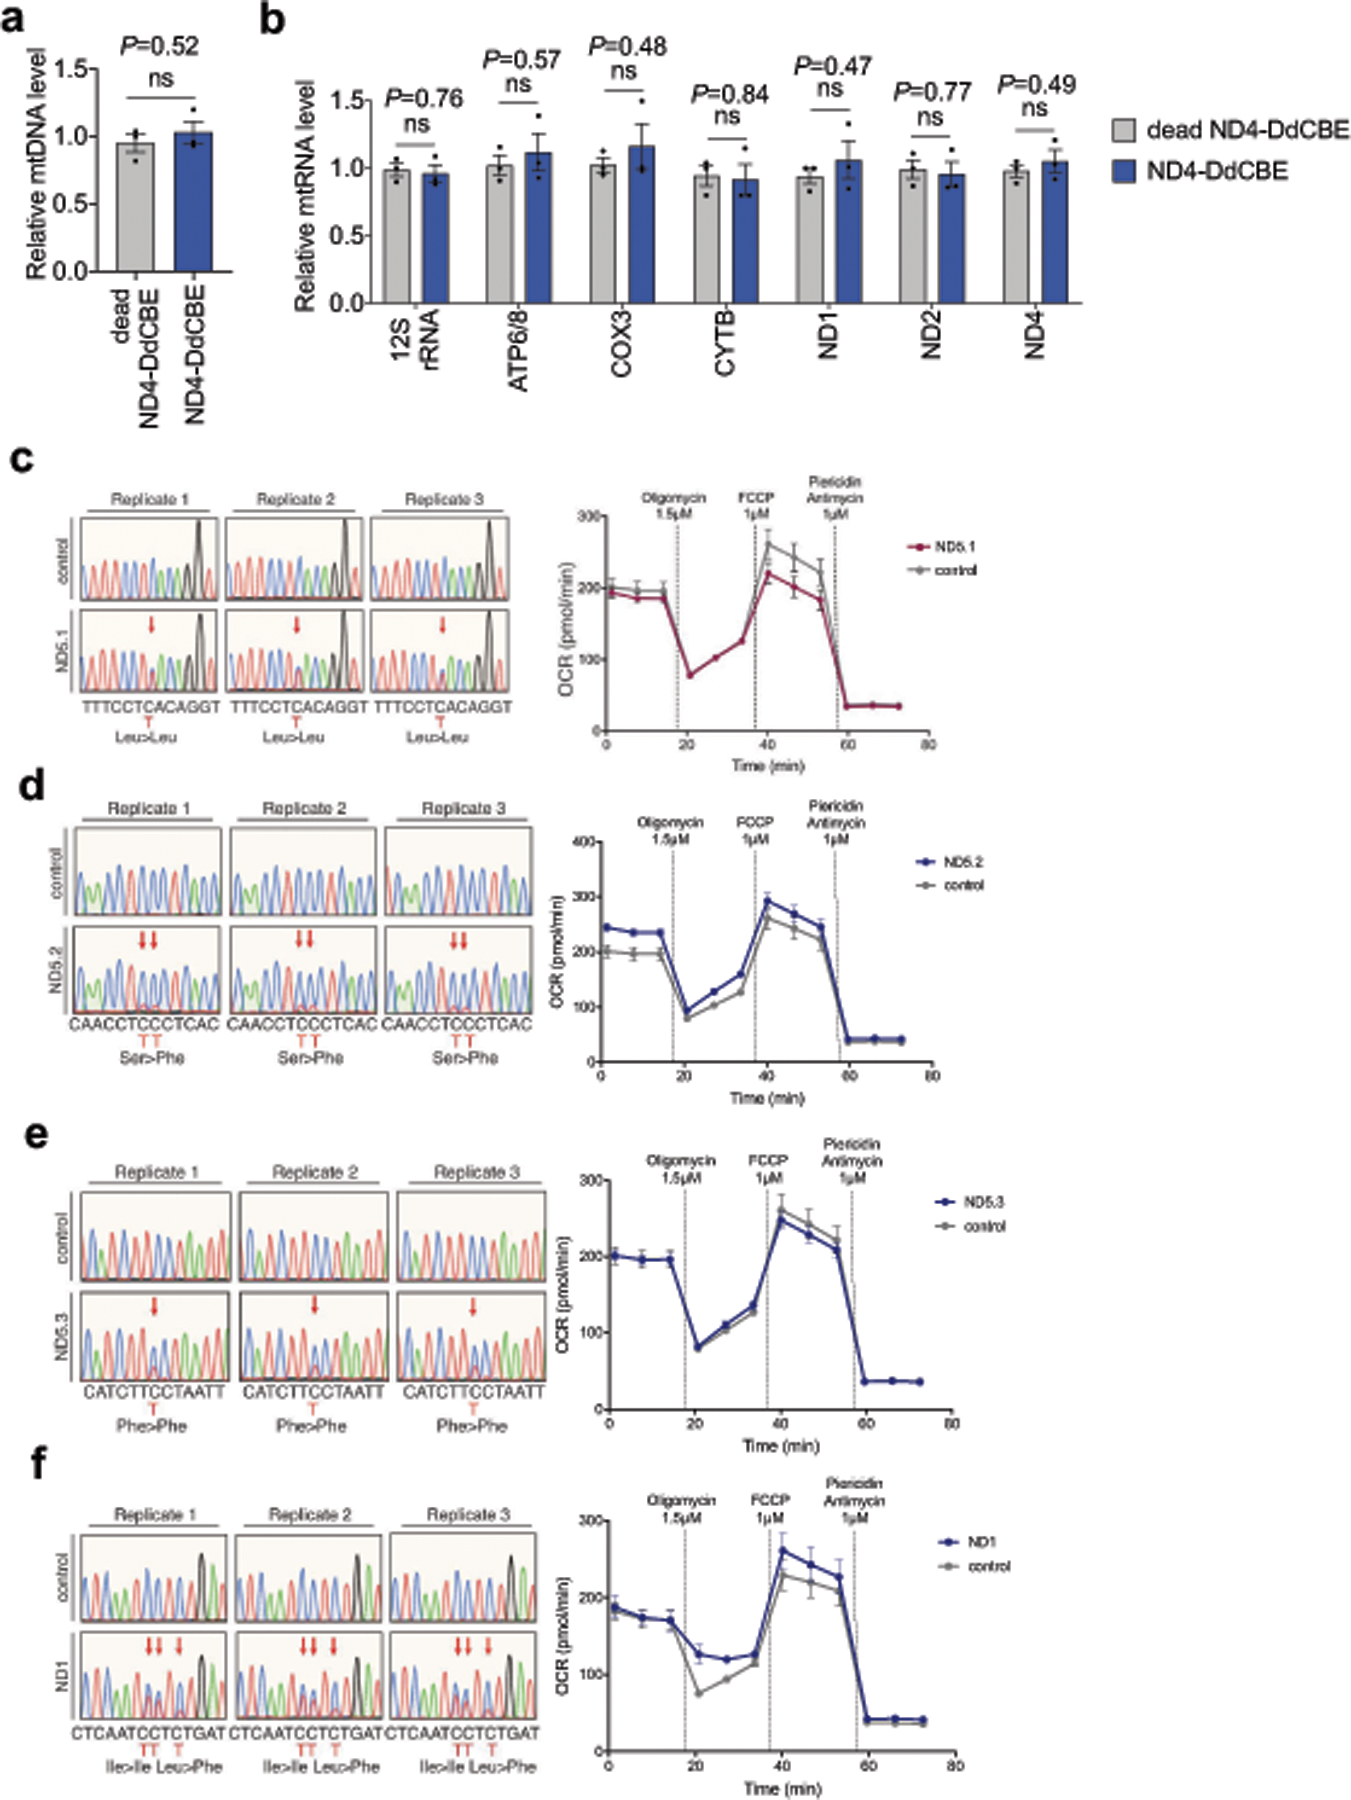
a, mtDNA levels of ND4-edited cells measured by qPCR relative to cells treated with dead ND4-DdCBE. b, mtRNA levels of ND4-edited cells measured by reverse transcription-qPCRrelative to cells treated with dead ND4-DdCBE. c–f, Confirmation of editing by Sanger sequencing and OCR of cells treated with ND5.1-DdCBE (c), ND5.2-DdCBE (d), MTND5P3-DdCBE (denoted ND5.3-DdCBE) (e) and ND1-DdCBE (f). Untreated cells were used as controls. All cells were collected 6 days post-transfection. For all Sanger sequencing plots, n = 3 independent biological replicates. All values and error bars shown in a, b and OCR plots in c–f reflect the mean ± s.e.m. of n = 3 independent biological replicates. For a and b, Student’s unpaired two-tailed t-test was applied. NS, not significant (P > 0.05).
Extended Data Fig. 9 |. Off-target editing activity of DdCBEs in nuclear DNA of HEK293T cells.
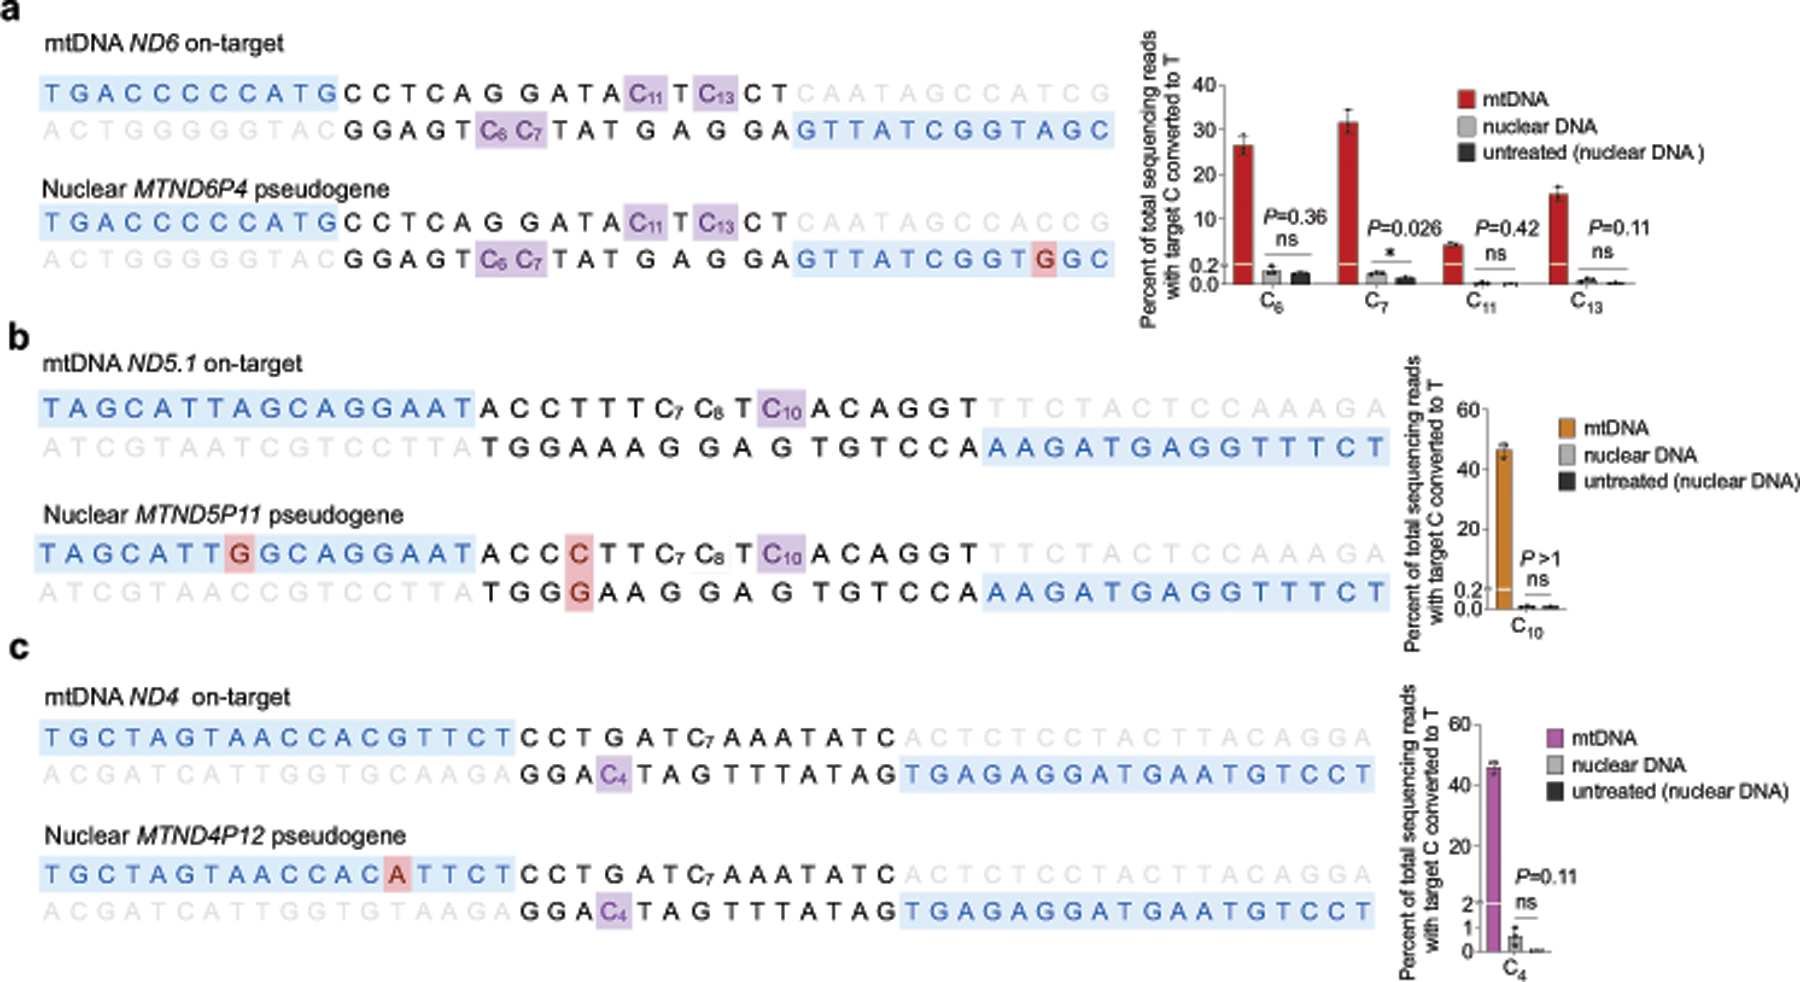
a–c, The on-target editing site in mtDNA and the corresponding nuclear DNA sequence with the greatest homology are shown for ND6-DdCBE (a), ND5.1-DdCBE (b) and ND4-DdCBE (c). TALE binding sites begin at N0 and are shown in blue. Target cytosines are in purple. Nucleotide mismatches between the mtDNA and nuclear pseudogene are in red. Editing efficiencies are measured by targeted amplicon sequencing 3 days post-transfection (a, b) or six days post-transfection (c) (see Methods for primer sequences). Each amplicon was sequenced at 44,000× coverage. All values and error bars reflect the mean ± s.d. of n = 3 independent biological replicates. Student’s unpaired two-tailed t-test was applied. NS, not significant (P > 0.05).
Extended Data Fig. 10 |. TALE arrays need to bind to mtDNA sequences positioned in close proximity to reassemble catalytically active DddAtox for off-target editing.
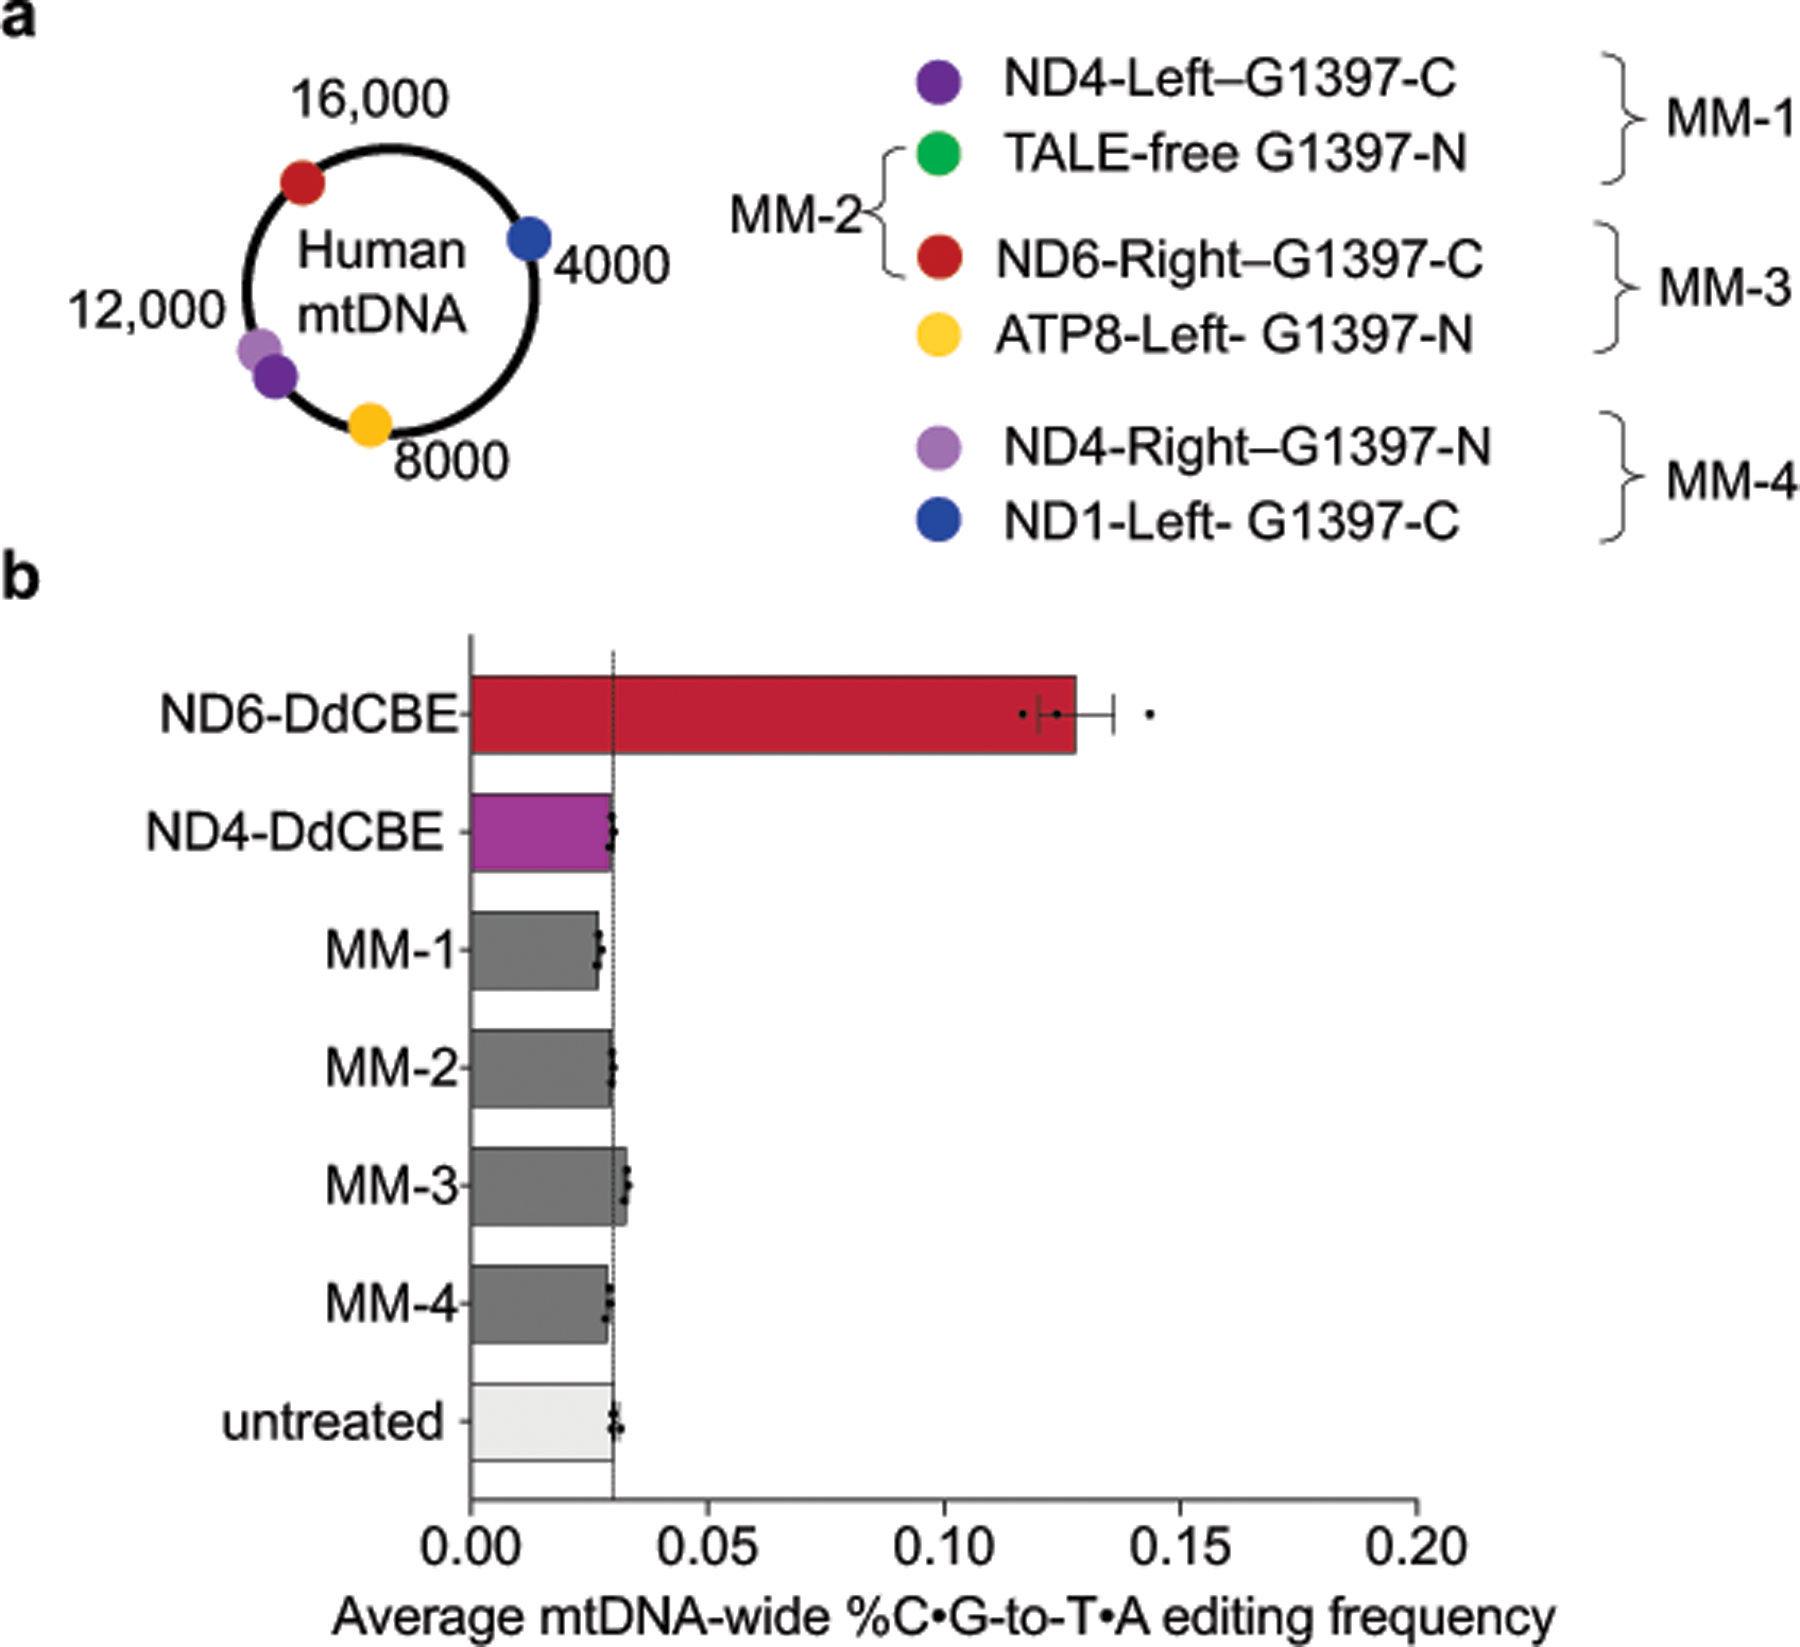
a, The identities and relative binding positions of each mismatched (MM) TALE–DddAtox half is shown. MM-1 and MM-2 contain a TALE-bound DddAtox half and a TALE-free DddAtox half. MM-3 and MM-4 contain DddAtox halves fused to TALE repeat arrays that bind to distant regions in mtDNA. ND6-Right TALE contains a permissive N-terminal domain (see Supplementary Table 4). b, The average percentage of genome-wide C•G-to-T•A off-target editing in mtDNA by indicated DdCBE and MM pairs are shown. The dashed line represents the percentage of endogenous C•G-to-T•A conversions in mtDNA as measured in the untreated control. Values and error bars reflect the mean ± s.e.m. of n = 3 independent biological replicates.
Extended Data Fig. 11 |. Predicted effects of off-target SNVs on mitochondrial DNA sequence and protein function.
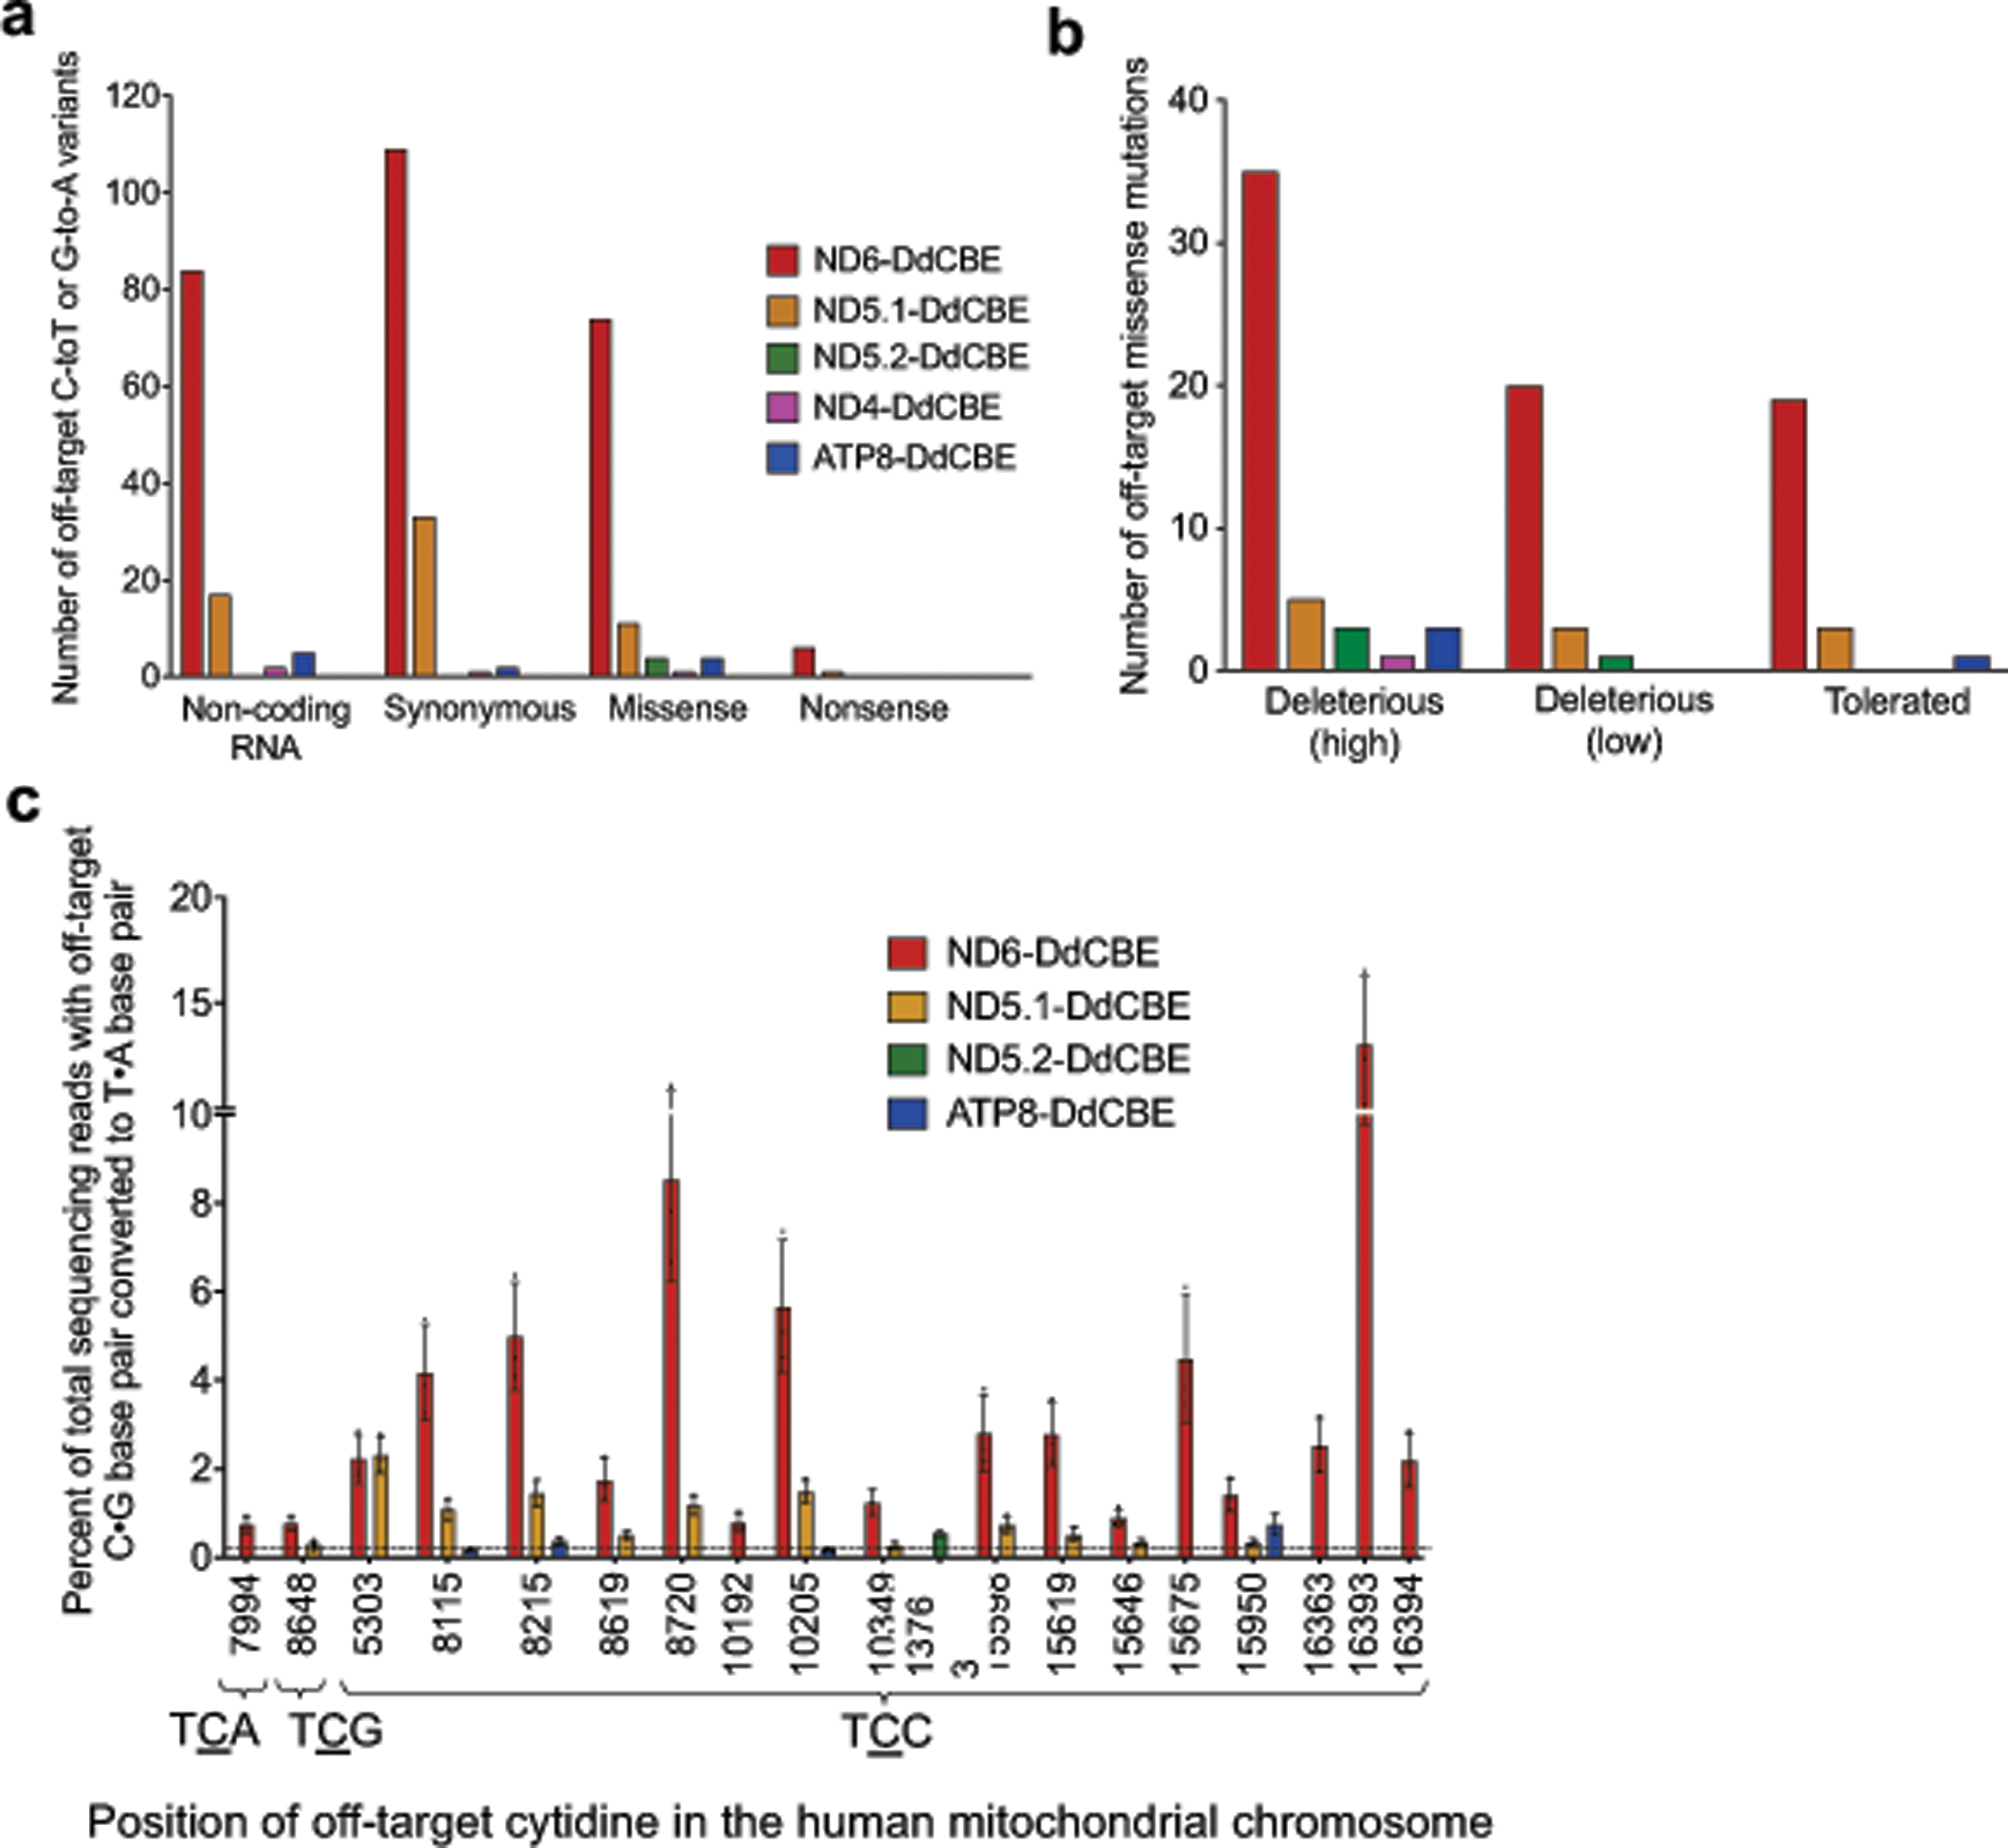
a, Classification of off-target SNVs into noncoding or coding mutations. Mutations occurring in protein-coding regions of mtDNA were further categorized into synonymous, missense or nonsense mutations. b, For nonsynonymous SNVs, SIFT was used to predict the effect of these mutations on protein function. High- or low-confidence calls (indicated in parentheses) were made according to the standard parameters of the prediction software. c, Editing efficiencies of selected off-target TC bases in the indicated sequence contexts are shown. HEK293T cells were treated with the indicated DdCBE and collected 3 days post-transfection for DNA sequencing. Values and error bars reflect the mean ± s.d. of n = 3 independent biological replicates.
Supplementary Material
Acknowledgements
We thank C. Wilson, L. Ludwig, T. Wang, K. Zhao, W.H. Yeh, S. Miller, A. Sousa, H. Hayden and A. Vo for materials and technical advice. R. Harris provided APOBEC3A and L. Eberl provided B. cen H111. This work was supported by the Merkin Institute of Transformative Technologies in Healthcare; US National Institutes of Health (NIH) grants R01AI080609, U01AI142756, RM1HG009490, R35GM122455, R35GM118062 and P30DK089507; US Defense Threat Reduction Agency (DTRA) grant 1-13-1-0014; and the University of Washington Cystic Fibrosis Foundation Research Development Program (RDP) SINGH15R0. B.Y.M. was supported by a Singapore A*STAR National Science Scholarship (NSS) fellowship; M.H.d.M. was supported by Cystic Fibrosis Foundation Fellowship DEMORAA18F0; A.V.K. was supported by a National Science Centre (NCN) Poland mobility grant UMO-2019/32/T/NZ1/00459; and A.R. was supported by NIH T32 GM095450 and a National Science Foundation graduate research fellowship. V.K.M., J.D.M. and D.R.L. are supported by the Howard Hughes Medical Institute.
Footnotes
Competing interests
The Broad Institute and the University of Washington have filed provisional patent applications on base-editing systems described in this study, listing B.Y.M., M.H.d.M., S.B.P., J.D.M. and D.R.L. as inventors. D.R.L. is a consultant and co-founder of Prime Medicine, Beam Therapeutics, Pairwise Plants and Editas Medicine, companies that use genome editing. V.K.M. is a consultant to 5am Ventures and Janssen Pharmaceuticals.
Additional information
Supplementary information is available for this paper at
Peer review information Nature thanks Rahul Kohli, Fyodor Urnov and the other, anonymous, reviewer(s) for their contribution to the peer review of this work.
Online content Any methods, additional references, Nature Research reporting summaries, source data, extended data, supplementary information, acknowledgements, peer review information; details of author contributions and competing interests; and statements of data and code availability are available at
Data availability
Coordinates and structure factors for DddA have been deposited in the PDB under accession code 6U08. High-throughput sequencing and whole-mitochondria sequencing data have been deposited in the NCBI Sequence Read Archive under accession code PRJNA603010. Amino acids sequences of all base editors in this study are provided in the Supplementary Sequences 1–4.
No statistical methods were used to predetermine sample size. The experiments were not randomized and the investigators were not blinded to allocation during experiments and outcome assessment.
References
- 1.Rees HA & Liu DR Base editing: precision chemistry on the genome and transcriptome of living cells. Nat. Rev. Genet 19, 770–788 (2018). [DOI] [PMC free article] [PubMed] [Google Scholar]
- 2.Komor AC, Badran AH & Liu DR CRISPR-based technologies for the manipulation of eukaryotic genomes. Cell 169, 559 (2017). [DOI] [PubMed] [Google Scholar]
- 3.Salter JD & Smith HC Modeling the embrace of a mutator: APOBEC selection of nucleic acid ligands. Trends Biochem. Sci 43, 606–622 (2018). [DOI] [PMC free article] [PubMed] [Google Scholar]
- 4.Gammage PA, Moraes CT & Minczuk M Mitochondrial genome engineering: the revolution may not be CRISPR-ized. Trends Genet. 34, 101–110 (2018). [DOI] [PMC free article] [PubMed] [Google Scholar]
- 5.Vafai SB & Mootha VK Mitochondrial disorders as windows into an ancient organelle. Nature 491, 374–383 (2012). [DOI] [PubMed] [Google Scholar]
- 6.Gopal RK et al. Early loss of mitochondrial complex I and rewiring of glutathione metabolism in renal oncocytoma. Proc. Natl Acad. Sci. USA 115, E6283–E6290 (2018). [DOI] [PMC free article] [PubMed] [Google Scholar]
- 7.Stewart JB & Chinnery PF The dynamics of mitochondrial DNA heteroplasmy: implications for human health and disease. Nat. Rev. Genet 16, 530–542 (2015). [DOI] [PubMed] [Google Scholar]
- 8.Bacman SR et al. MitoTALEN reduces mutant mtDNA load and restores tRNAAla levels in a mouse model of heteroplasmic mtDNA mutation. Nat. Med 24, 1696–1700 (2018). [DOI] [PMC free article] [PubMed] [Google Scholar]
- 9.Bacman SR, Williams SL, Pinto M, Peralta S & Moraes CT Specific elimination of mutant mitochondrial genomes in patient-derived cells by mitoTALENs. Nat. Med 19, 1111–1113 (2013). [DOI] [PMC free article] [PubMed] [Google Scholar]
- 10.Gammage PA, Rorbach J, Vincent AI, Rebar EJ & Minczuk M Mitochondrially targeted ZFNs for selective degradation of pathogenic mitochondrial genomes bearing large-scale deletions or point mutations. EMBO Mol Med. 6, 458–466 (2014). [DOI] [PMC free article] [PubMed] [Google Scholar]
- 11.Nissanka N, Bacman SR, Plastini MJ & Moraes CT The mitochondrial DNA polymerase gamma degrades linear DNA fragments precluding the formation of deletions. Nat. Commun 9, 2491 (2018). [DOI] [PMC free article] [PubMed] [Google Scholar]
- 12.Peeva V et al. Linear mitochondrial DNA is rapidly degraded by components of the replication machinery. Nat. Commun 9, 1727 (2018). [DOI] [PMC free article] [PubMed] [Google Scholar]
- 13.Gaudelli NM et al. Programmable base editing of A•T to G•C in genomic DNA without DNA cleavage. Nature 551, 464–471 (2017). [DOI] [PMC free article] [PubMed] [Google Scholar]
- 14.Komor AC, Kim YB, Packer MS, Zuris JA & Liu DR Programmable editing of a target base in genomic DNA without double-stranded DNA cleavage. Nature 533, 420–424 (2016). [DOI] [PMC free article] [PubMed] [Google Scholar]
- 15.Iyer LM, Zhang D, Rogozin IB & Aravind L Evolution of the deaminase fold and multiple origins of eukaryotic editing and mutagenic nucleic acid deaminases from bacterial toxin systems. Nucleic Acids Res. 39, 9473–9497 (2011). [DOI] [PMC free article] [PubMed] [Google Scholar]
- 16.Coulthurst S The type VI secretion system: a versatile bacterial weapon. Microbiology 165, 503–515 (2019). [DOI] [PubMed] [Google Scholar]
- 17.Hood RD et al. A type VI secretion system of Pseudomonas aeruginosa targets a toxin to bacteria. Cell Host Microbe 7, 25–37 (2010). [DOI] [PMC free article] [PubMed] [Google Scholar]
- 18.Richardson SR, Narvaiza I, Planegger RA, Weitzman MD & Moran JV APOBEC3A deaminates transiently exposed single-strand DNA during LINE-1 retrotransposition. eLife 3, e02008 (2014). [DOI] [PMC free article] [PubMed] [Google Scholar]
- 19.Krokan HE & Bjørås M Base excision repair. Cold Spring Harb. Perspect. Biol 5, a012583 (2013). [DOI] [PMC free article] [PubMed] [Google Scholar]
- 20.Urnov FD, Rebar EJ, Holmes MC, Zhang HS & Gregory PD Genome editing with engineered zinc finger nucleases. Nat. Rev. Genet 11, 636–646 (2010). [DOI] [PubMed] [Google Scholar]
- 21.Joung JK & Sander JD TALENs: a widely applicable technology for targeted genome editing. Nat. Rev. Mol. Cell Biol 14, 49–55 (2013). [DOI] [PMC free article] [PubMed] [Google Scholar]
- 22.Guilinger JP, Thompson DB & Liu DR Fusion of catalytically inactive Cas9 to FokI nuclease improves the specificity of genome modification. Nat. Biotechnol 32, 577–582 (2014). [DOI] [PMC free article] [PubMed] [Google Scholar]
- 23.Qi LS et al. Repurposing CRISPR as an RNA-guided platform for sequence-specific control of gene expression. Cell 152, 1173–1183 (2013). [DOI] [PMC free article] [PubMed] [Google Scholar]
- 24.Kleinstiver BP et al. Broadening the targeting range of Staphylococcus aureus CRISPR–Cas9 by modifying PAM recognition. Nat. Biotechnol 33, 1293–1298 (2015). [DOI] [PMC free article] [PubMed] [Google Scholar]
- 25.Nishimasu H et al. Crystal structure of Staphylococcus aureus Cas9. Cell 162, 1113–1126 (2015). [DOI] [PMC free article] [PubMed] [Google Scholar]
- 26.Anzalone AV et al. Search-and-replace genome editing without double-strand breaks or donor DNA. Nature 576, 149–157 (2019). [DOI] [PMC free article] [PubMed] [Google Scholar]
- 27.Nishida K et al. Targeted nucleotide editing using hybrid prokaryotic and vertebrate adaptive immune systems. Science 353, aaf8729 (2016). [DOI] [PubMed] [Google Scholar]
- 28.Komor AC et al. Improved base excision repair inhibition and bacteriophage Mu Gam protein yields C:G-to-T:A base editors with higher efficiency and product purity. Sci. Adv 3, eaao4774 (2017). [DOI] [PMC free article] [PubMed] [Google Scholar]
- 29.Nilsen H et al. Nuclear and mitochondrial uracil-DNA glycosylases are generated by alternative splicing and transcription from different positions in the UNG gene. Nucleic Acids Res. 25, 750–755 (1997). [DOI] [PMC free article] [PubMed] [Google Scholar]
- 30.Koblan LW et al. Improving cytidine and adenine base editors by expression optimization and ancestral reconstruction. Nat. Biotechnol 36, 843–846 (2018). [DOI] [PMC free article] [PubMed] [Google Scholar]
- 31.Bao XR et al. Mitochondrial dysfunction remodels one-carbon metabolism in human cells. eLife 5, e10575 (2016). [DOI] [PMC free article] [PubMed] [Google Scholar]
- 32.Magnusson J, Orth M, Lestienne P & Taanman J-W Replication of mitochondrial DNA occurs throughout the mitochondria of cultured human cells. Exp. Cell Res 289, 133–142 (2003). [DOI] [PubMed] [Google Scholar]
- 33.Gopal RK et al. Widespread chromosomal losses and mitochondrial DNA alterations as genetic drivers in Hürthle cell carcinoma. Cancer Cell 34, 242–255.e5 (2018). [DOI] [PMC free article] [PubMed] [Google Scholar]
- 34.Rinaldi FC, Doyle LA, Stoddard BL & Bogdanove AJ The effect of increasing numbers of repeats on TAL effector DNA binding specificity. Nucleic Acids Res. 45, 6960–6970 (2017). [DOI] [PMC free article] [PubMed] [Google Scholar]
- 35.Yang L et al. Engineering and optimising deaminase fusions for genome editing. Nat. Commun 7, 13330 (2016). [DOI] [PMC free article] [PubMed] [Google Scholar]
- 36.Finn RD, Clements J & Eddy SR HMMER web server: interactive sequence similarity searching. Nucleic Acids Res. 39, W29–W37 (2011). [DOI] [PMC free article] [PubMed] [Google Scholar]
- 37.Fazli M, Harrison JJ, Gambino M, Givskov M & Tolker-Nielsen T In-frame and unmarked gene deletions in Burkholderia cenocepacia via an allelic exchange system compatible with gateway technology. Appl. Environ. Microbiol 81, 3623–3630 (2015). [DOI] [PMC free article] [PubMed] [Google Scholar]
- 38.Spiewak HL et al. Burkholderia cenocepacia utilizes a type VI secretion system for bacterial competition. MicrobiologyOpen 8, e774 (2019). [DOI] [PMC free article] [PubMed] [Google Scholar]
- 39.Choi KH, DeShazer D & Schweizer HP mini-Tn7 insertion in bacteria with multiple glmS-linked attTn7 sites: example Burkholderia mallei ATCC 23344. Nat. Protoc 1, 162–169 (2006). [DOI] [PubMed] [Google Scholar]
- 40.Rees HA, Wilson C, Doman JL & Liu DR Analysis and minimization of cellular RNA editing by DNA adenine base editors. Sci. Adv 5, eaax5717 (2019). [DOI] [PMC free article] [PubMed] [Google Scholar]
- 41.Otwinowski Z & Minor W Processing of X-ray diffraction data collected in oscillation mode. Methods Enzymol. 276, 307–326 (1997). [DOI] [PubMed] [Google Scholar]
- 42.Adams PD et al. PHENIX: a comprehensive Python-based system for macromolecular structure solution. Acta Crystallogr. D 66, 213–221 (2010). [DOI] [PMC free article] [PubMed] [Google Scholar]
- 43.Emsley P & Cowtan K Coot: model-building tools for molecular graphics. Acta Crystallogr. D 60, 2126–2132 (2004). [DOI] [PubMed] [Google Scholar]
- 44.Painter J & Merritt EA Optimal description of a protein structure in terms of multiple groups undergoing TLS motion. Acta Crystallogr. D 62, 439–450 (2006). [DOI] [PubMed] [Google Scholar]
- 45.Chen VB et al. MolProbity: all-atom structure validation for macromolecular crystallography. Acta Crystallogr. D 66, 12–21 (2010). [DOI] [PMC free article] [PubMed] [Google Scholar]
- 46.Bhagwat AS et al. Strand-biased cytosine deamination at the replication fork causes cytosine to thymine mutations in Escherichia coli. Proc. Natl Acad. Sci. USA 113, 2176–2181 (2016). [DOI] [PMC free article] [PubMed] [Google Scholar]
- 47.Kotrys AV et al. Quantitative proteomics revealed C6orf203/MTRES1 as a factor preventing stress-induced transcription deficiency in human mitochondria. Nucleic Acids Res. 47, 7502–7517 (2019). [DOI] [PMC free article] [PubMed] [Google Scholar]
- 48.Schindelin J et al. Fiji: an open-source platform for biological-image analysis. Nat. Methods 9, 676–682 (2012). [DOI] [PMC free article] [PubMed] [Google Scholar]
- 49.Li H & Durbin R Fast and accurate short read alignment with Burrows–Wheeler transform. Bioinformatics 25, 1754–1760 (2009). [DOI] [PMC free article] [PubMed] [Google Scholar]
- 50.Koboldt DC et al. VarScan 2: somatic mutation and copy number alteration discovery in cancer by exome sequencing. Genome Res. 22, 568–576 (2012). [DOI] [PMC free article] [PubMed] [Google Scholar]
- 51.Miller SM et al. Continuous evolution of SpCas9 variants compatible with non-G PAMs. Nat. Biotechnol 38, 471–481 (2020). [DOI] [PMC free article] [PubMed] [Google Scholar]
- 52.Rees HA et al. Improving the DNA specificity and applicability of base editing through protein engineering and protein delivery. Nat. Commun 8, 15790 (2017). [DOI] [PMC free article] [PubMed] [Google Scholar]
- 53.Clement K et al. CRISPResso2 provides accurate and rapid genome editing sequence analysis. Nat. Biotechnol 37, 224–226 (2019). [DOI] [PMC free article] [PubMed] [Google Scholar]
- 54.Ludwig LS et al. Lineage tracing in humans enabled by mitochondrial mutations and single-cell genomics. Cell 176, 1325–1339.e22 (2019). [DOI] [PMC free article] [PubMed] [Google Scholar]
- 55.Diroma MA, Ciaccia L, Pesole G & Picardi E Elucidating the editome: bioinformatics approaches for RNA editing detection. Brief. Bioinform 20, 436–447 (2019). [DOI] [PubMed] [Google Scholar]
- 56.Doman JL, Raguram A, Newby GA & Liu DR Evaluation and minimization of Cas9-independent off-target DNA editing by cytosine base editors. Nat. Biotechnol 38, 620–628 (2020). [DOI] [PMC free article] [PubMed] [Google Scholar]
- 57.Vaser R, Adusumalli S, Leng SN, Sikic M & Ng PC SIFT missense predictions for genomes. Nat. Protoc 11, 1–9 (2016). [DOI] [PubMed] [Google Scholar]
Associated Data
This section collects any data citations, data availability statements, or supplementary materials included in this article.


