Abstract
The central nervous system (CNS) is classically viewed as immune-privileged; however, recent advances highlight interactions between the peripheral immune system and CNS in controlling infections and tissue homeostasis. Tissue-resident memory (Trm) CD8+ T cells in the CNS are generated after brain infections, but it is unknown whether CNS infection is required to generate brain Trm cells. We show that peripheral infections generate antigen-specific CD8+ memory T cells in the brain that adopt a unique Trm signature. Upon depletion of circulating and perivascular memory T cells, this brain signature was enriched and the surveilling properties of brain Trm cells revealed by intravital imaging. Importantly, peripherally induced brain Trm cells showed evidence of rapid activation, enhanced cytokine production and mediated protection after brain infections. These data reveal that peripheral immunizations can generate brain Trm cells and will guide potential use of T cells as therapeutic strategies against CNS infections and neurological diseases.
Introduction
The central nervous system (CNS) has been viewed as an immunologically privileged site and the presence of T cells in the CNS considered a pathogenic condition1, 2. These concepts stem from ideas that the CNS lacks classical lymphatics, the blood brain barrier (BBB) limits immune cell trafficking, and CNS-residing cells express little MHC3. However, recent discoveries of meningeal lymphatics and increasing roles of T cells in normal homeostatic functions of the CNS are changing our perception of this immune-privileged concept4, 5. A role for T cells in the CNS is now described in brain development, protection against CNS injury, neurodegeneration, and control of CNS infections1, 2, 3, 6.
Infections with intracellular pathogens induce memory CD8+ T cells, enabling effective secondary immune responses to the same pathogen7. Memory CD8+ T populations are comprised of central memory (Tcm), effector memory (Tem) and tissue-resident memory (Trm) cells. Trm cells are distinct from Tcm and Tem cells in that they do not recirculate but instead reside in tissues8. Trm cells populate sites of initial infection or vaccination and are characterized in barrier tissues (e.g. skin, intestine, female reproductive tract (FRT)9, and lungs10), lymphoid (e.g. spleen and lymph nodes) and peripheral tissues (e.g. kidneys, liver and brain). Although heterogeneity in Trm populations exists, several markers of tissue residence, including cellular adhesion molecules (integrins) CD49a, CD11a, and CD103, chemokine receptors CXCR3 and CXCR6, and the tissue retention marker CD6911 distinguish them from circulating memory subsets. Multiple studies suggest Trm cells protect from secondary infections by direct killing of infected target T cells, recruitment of additional immune cells to sites of infection and by creation of tissue antiviral states9, 12.
Memory CD8+ T cells can contribute to control of CNS infections13. However, it remains unknown if and how each subset contributes to CNS immunity. Early studies of intranasal (IN) infection with the neurotropic virus vesicular stomatitis virus (VSV) identified CD103+ Trm cells in the CNS14. Furthermore, characterization of VSV and Toxoplasma gondii-induced Trm cells in the brain identified a key transcriptional signature of CD103+ brain CD8+ T cells compared to CD103– splenic CD8+ T cells15, 16. Additionally, CNS Trm cells are induced after intracranial (IC) injections with recombinant lymphocytic choriomeningitis virus (rLCMV)17, polyomavirus (PyV)18, 19, 20, and murine cytomegalovirus (MCMV)21, 22. While most Ag-specific cells isolated from the brain after CNS infections expressed CD69, only some (~20–80%, depending on the model) were also CD103+ 14, 15, 17, 18, 22. A common theme these studies, which all rely on CNS infection, is the suggestion that Ag-expression in the CNS is required for generation of Trm CD8+ T cells in this tissue.
Trm cells are described in most human tissues, including the brains of autopsy patients23. The Ag-specificity of the Trm cells in human brains is unknown, but they are speculated to be specific for neurotropic pathogens. Naïve mice housed in specific pathogen-free conditions harbor detectible CD8+ T cells in the brain, which increase in numbers in aged mice24 and more recently, single-cell analysis revealed oligoclonal expansion of T cells in the brains of old mice in the absence of overt infection25. Another study identified oligoclonal CD8+ T cells patrolling the cerebrospinal fluid in human patients26. Together, these data suggest that T cell surveillance in the CNS may occur in the absence of direct brain infection24, 25. Here, we used mouse models to probe the characteristics of CNS CD8+ T cells in young mice after brain infection and compare them to CNS CD8+ T cells generated after peripheral infections with diverse pathogens or after immunization in the absence of infection.
Results
Brain CD8+ T cells induced after peripheral infection
Brain CD8+ Trm cells are generated after CNS infection in multiple mouse models27 but it is unknown if CNS infections are required to generate these cells. To test this, we compared CNS Trm cell generation in mice infected IN with the vesicular stomatitis virus expressing ovalbumin (VSV-OVA), which causes brain infection or a range of peripheral infections. Mice were seeded with eGFP expressing OT-I or P14 T cells from naïve donors and infected with the indicated pathogens expressing OVA257–264 or GP33–41. Prior to brain harvest at a memory time point (>25 days p.i.) mice were injected IV with anti-CD45 fluorophore-conjugated antibody (IV stain) for 3 minutes to discriminate cells within the vasculature (IV+) or within the tissue (IV–) and spleen (SP), blood (PBL) and brain lymphocytes were analyzed. IV+ and IV– OT-I cells were present in the brain of mice infected IN with VSV-OVA, with an increased representation of OT-I cells appearing in IV– brain tissue compared to the brain vasculature (IV+), the SP and PBL (Figure 1a,b and Extended Data Fig. 1a). Thus, Ag-specific memory CD8+ T cells were enriched in brain tissues after CNS infection14.
Figure 1: Enrichment of antigen specific CD8+ T cells in the CNS after peripheral immunizations.
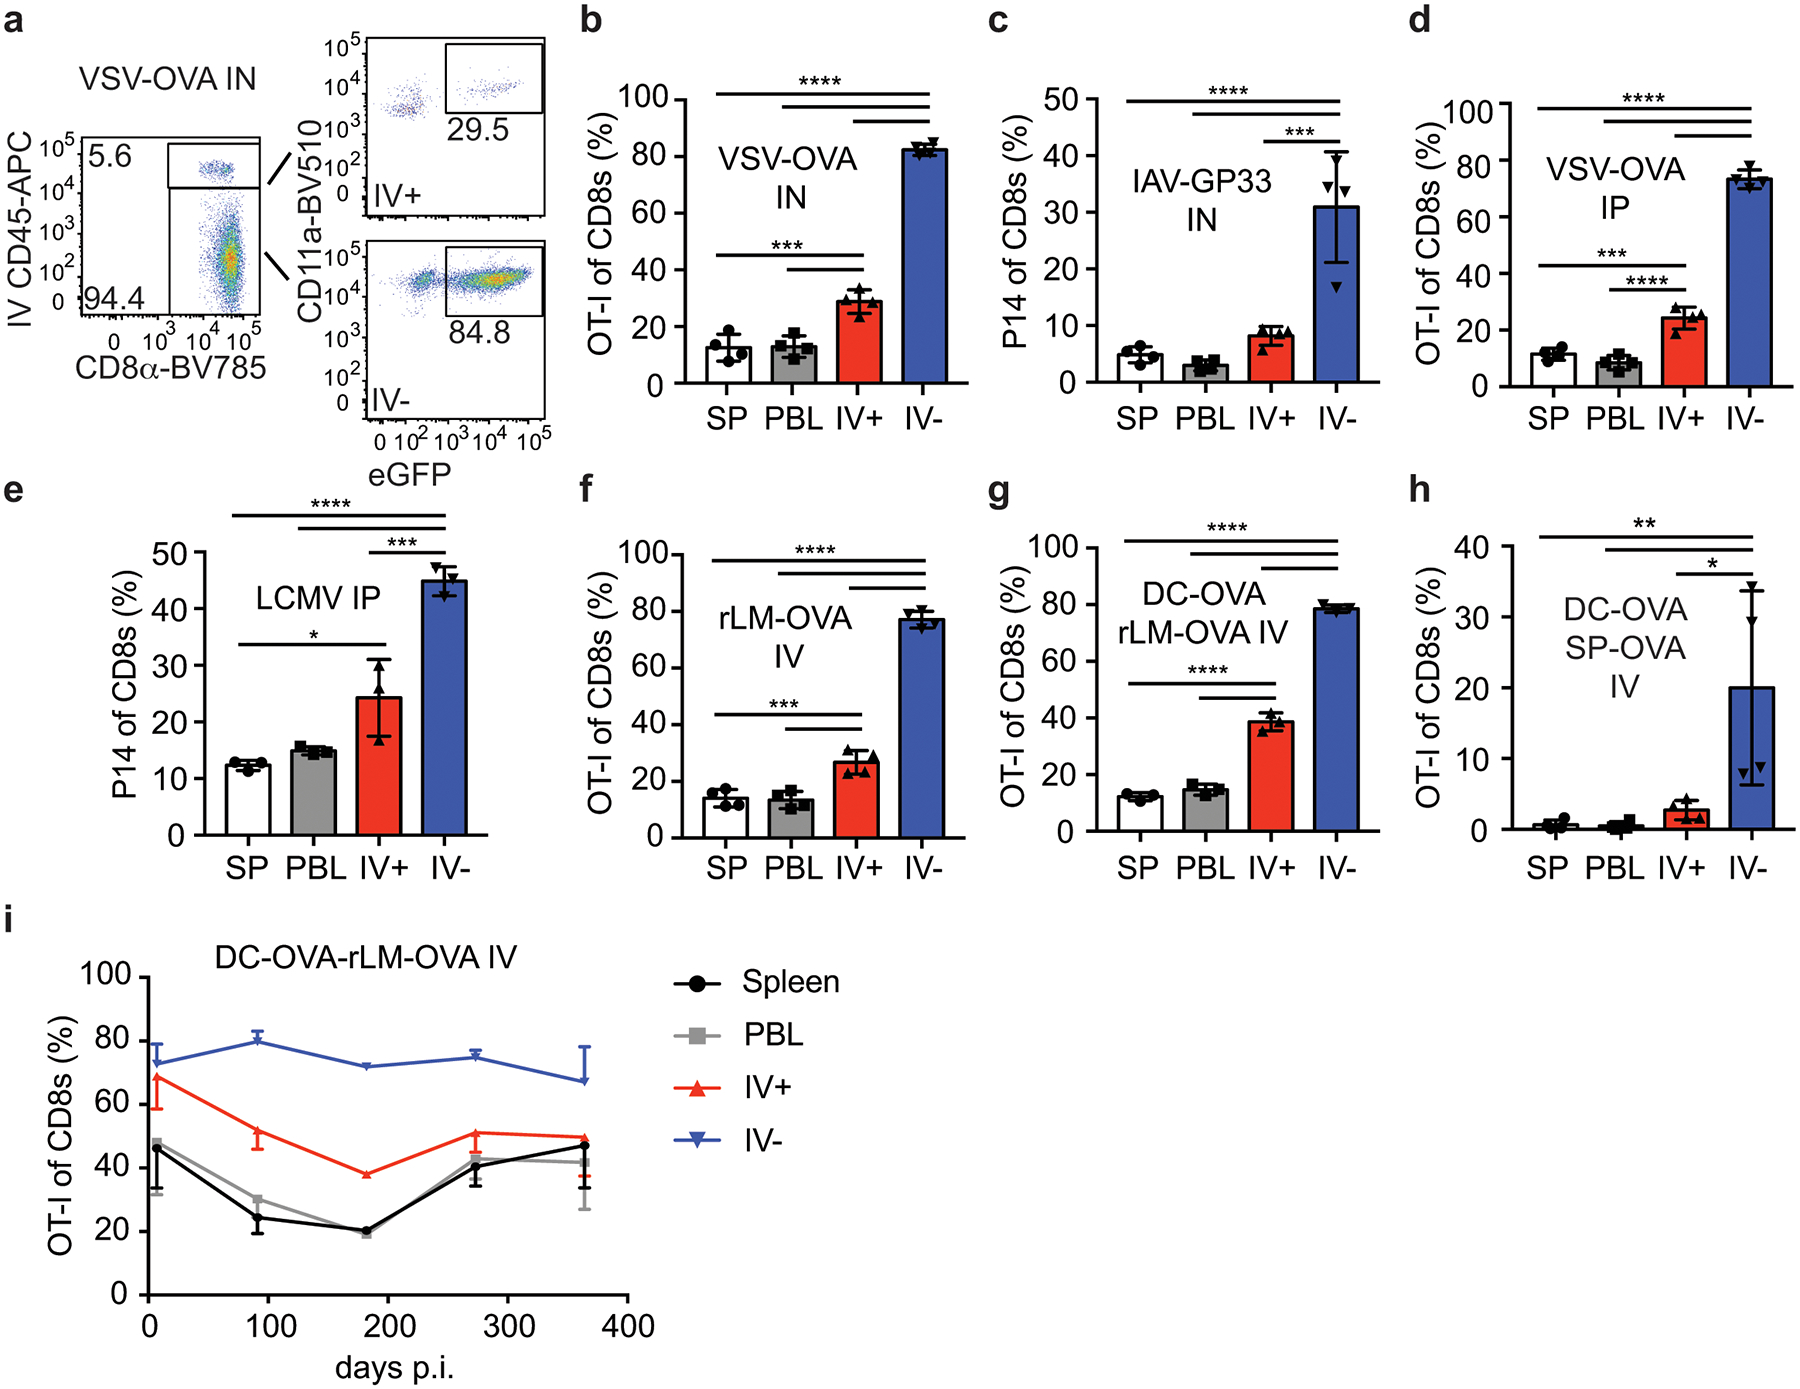
a) Representative flow cytometry plots of brain samples isolated from mice seeded with eGFP+ OT-I CD8+ T cells and infected with VSV-OVA IN. Representative of 3 independent experiments with 4 mice per group.
b-i) The proportion of donor OT-I or P14 cells of live CD8+ T cells isolated from the Spleen (SP) peripheral blood (PBL) IV+ brain (IV+) or IV– brain (IV–) are graphed from memory >30 days or the indicated days after infection with VSV-OVA IN, n=4, 3 independent experiments, p values (top to bottom) **** p<0.0001, **** p<0.0001, **** p<0.0001, *** p=0.0003, *** p=0.0004 (b), IAV-GP33 IN, n=4, 2 independent experiments, p values (top to bottom) **** p<0.0001, **** p<0.0001, *** p=0.0002 (c), VSV-OVA IP, n=4, 3 independent experiments p values (top to bottom) **** p<0.0001, **** p<0.0001, **** p<0.0001, *** p=0.0003, **** p<0.0001 (d) LCMVArm IP, n=3, 3 independent experiments, p values (top to bottom) **** p<0.0001, **** p<0.0001, *** p=0.0006, * p=0.0169 (e), rLM-OVA IV, n=4, 2 independent experiments, p values (top to bottom) **** p<0.0001, **** p<0.0001, **** p<0.0001, *** p=0.0009, *** p=0.0006 (f), DC-OVA-rLM-OVA prime boost IV, n=3, 4 independent experiments, p values (top to bottom) **** p<0.0001, **** p<0.0001, **** p<0.0001, **** p<0.0001, **** p<0.0001 (g), DC-OVA-SP-OVA prime boost IV, n=4, 2 independent experiments, p values (top to bottom) ** p=0.0087, ** p=0.0083, * p=0.0183 (h), or DC-OVA-rLM-OVA IV, n= 3, 4, 2, 3, 3 at each respective time points (left to right) (i).Graphs show the mean +/− standard deviation (b-h) or mean +/− SEM (i) with each dot representing an individual mouse. Statistical significance was determined by One-way ANOVA with Tukey’s multiple comparison post-test using graphpad prism with individual P values reported between groups.
In contrast to VSV, influenza A (IAV) replication is generally restricted to lung epithelial cells after IN infection but this does not mean that virus or antigen has no access to the CNS. To determine if IN IAV infection induced enrichment of memory CD8+ T cells in the CNS, mice were seeded with P14 CD8+ T cells and inoculated with a non-neurotropic influenza A/PR8/34 expressing GP33 (IAV-GP33). Memory P14 CD8+ T cells were found at an increased proportion in the IV– brain lymphocyte fraction (Figure 1c). Thus, it was possible that the IN route of infection enhanced T cell entry into brain tissues.
Replication of VSV in the CNS occurs after IN or IC inoculation, but does not occur during intravenous (IV) or intraperitoneal (IP) inoculations. Similarly, IV or IP infections with LCMV Armstrong (LCMVArm) do not result in extensive CNS infections28. Despite this, IP VSV-OVA and IP or IV LCMVArm infections resulted in increased proportions of memory OT-I and P14 cells, respectively, in the IV– brain populations (Figure 1d,e, and Extended Data Fig. 1b). Additionally, we observed enrichment of IV– CNS memory OT-I cells after bacterial infection with recombinant Listeria monocytogenes expressing ovalbumin (rLM-OVA) and after OVA peptide-coated dendritic cell prime-rLM-OVA boost-immunization (DC-OVA-rLM-OVA, both delivered IV) (Figure 1f and 1g). Similar results were obtained when targeting endogenous OVA-specific populations with DC-OVA-rLM-OVA immunization, P14 cells with DC-GP33-rLM-GP33 immunization or after DC-OVA prime-vaccinia virus (VV)-OVA boost (Extended Data Fig. 1c–e). Finally, we extended our analyses to rLM-OVA IV–infected outbred NIH Swiss Webster mice. The proportion of CNS CD8+ cells, IV– CD8+ cells and total number if IV– CD8+ T cells were all increased in mice infected with rLM-OVA compared to naïve controls (Extended Data Fig. 1f).
Our results showed that pathogen-specific memory CD8+ T cells were enriched in brains after peripheral infections that are not generally thought to cause CNS infections. However, it is impossible to rule out low CNS infections in all models tested. To address this, we immunized OT-I recipient mice by DC-OVA priming followed by boosting with naïve splenocytes (SP) coated with the OVA peptide, a scenario leading to robust CD8+ T cell peripheral responses without infection. Again, we found memory OT-I cells to be enriched in the IV– brain fraction (Figure 1h). These data definitively showed that enrichment of memory CD8+ T cells in brain tissue did not require CNS infection.
To determine how long peripherally induced memory cells in the CNS persisted, proportions of OT-I cells after DC-OVA-rLM-OVA prime boosting were evaluated over time in the SP, PBL and IV+ and IV– brain (Figure 1i). Increased proportions of OT-I cells in IV– brain tissues persisted up to one-year p.i. indicating population longevity in the CNS. In summary, these data demonstrated that peripheral infections with diverse pathogens or immunizations resulted in long-term maintenances of Ag-specific memory CD8+ T cells in the brain.
Brain CD8+ T cells adopt a Trm phenotype
Memory T cells may transiently enter tissues or persist long-term as Trm cells. To address the gene expression profile of peripherally induced brain CD8+ T cells, RNA-Seq was performed on memory OT-I cells isolated from the SP, IV+, and IV– brain of DC-OVA-rLM-OVA immunized mice. Approximately 1800 genes were differentially expressed between brain IV+ and IV– OT-I cells (Figure 2a). Of note, Trm cells from other tissues have characteristic core gene expression profiles15, 16, 29, 30, 31, 32, 33. We compiled a list of 239 such genes assessed their relative expression in SP, IV+ and IV– brain OT-I cells. Genes encoding several transcription factors (Klf2, Klf3, Zfp683, and Bhlhe40)30, 34, 35 and phenotypic markers (CX3CR1, Klrg1, S1PR1, CXCR3, and CD69)31, 36, all associated with tissue residence were differentially expressed in the IV– brain compared to either SP or IV+ brain (Figure 2b and Extended Data Fig. 2a–b). These data suggested that peripherally induced IV– brain CD8+ T cells may be transcriptionally similar to tissue infection-induced Trm cells.
Figure 2: Antigen specific T cells in CNS adopt a tissue resident memory phenotype after peripheral immunization.
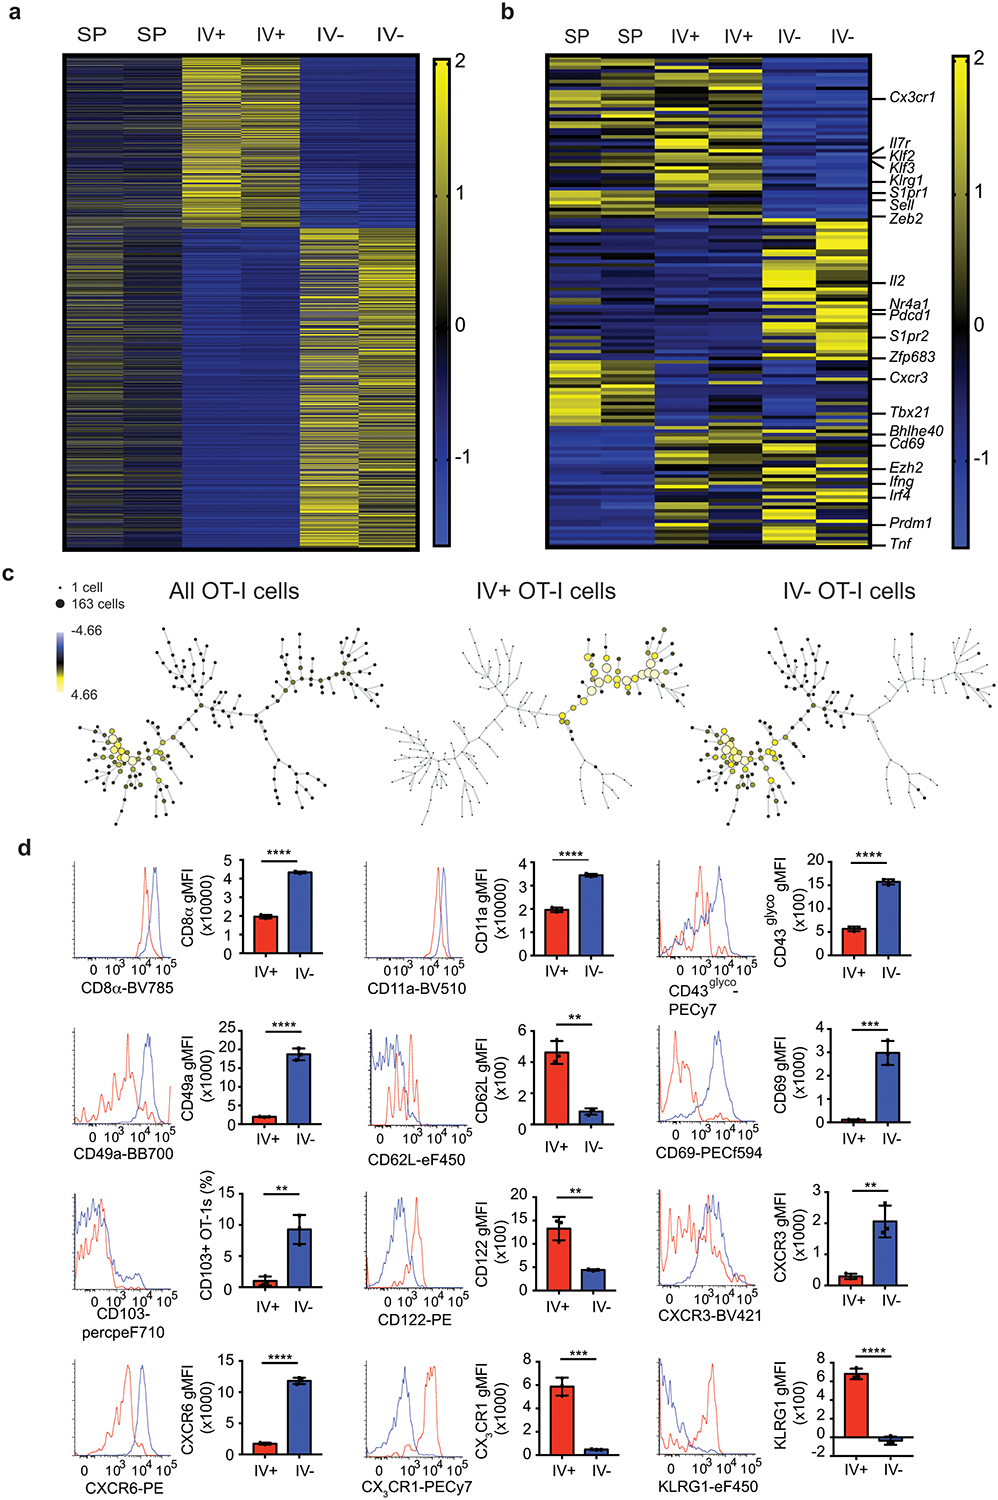
a,b) RNA-Seq analysis of memory OT-I cells isolated >30 days post immunization from SP, IV+, or IV– brains of DC-OVA-rLM-OVA-prime boosted mice. Relative expression of ~1800 genes identified by differential expression between IV+ and IV– OT-I cells using threshold of >1.5fold change with p value of <0.1 (a). Relative expression of differential expressed genes comparing SP to IV+, SP to IV–, and IV+ to IV– of ~239 a priori defined tissue resident memory associated genes are depicted with selected genes identified on the right side (b). RNA samples were isolated from 5 pooled mice per group in duplicate.
c) SPADE analysis plotting the percent total of all OT-I cells, IV+ OT-I cells and IV– OT-I cells from brains of mice immunized by DC-OVA-rLM-OVA prime-boosting are depicted. Surface markers used include CD8α, CD11a, CD44, CD49a, CD69, CD103, CXCR6, and CX3CR1.
d) Surface expression of CD8α, CD11a, CD43glyco, CD49a, CD62L, CD69, CD103, CD122, CXCR3, CXCR6, CX3CR1, and KLRG1 are shown as histograms and gMFI or proportion of IV+ (Red) or IV– (Blue) OT-I cells are shown from brains of DC-OVA-rLM-OVA immunized mice.
Data are representative of 3 independent experiments with 3 mice per group for CD8α, CD11a, CD49a, CD69, CD103, CXCR3, CXCR6, and CX3CR1, and 2 independent experiments with 3 mice per group for CD43glyco, CD62L, CD122, and KLRG1. All graphs show the mean +/− standard deviation with each dot representing an individual mouse. Two-sided unpaired students T-test were determined using graphpad prism. P values : **** p<0.0001 (CD8α), **** p<0.0001 (CD11a), **** p<0.0001 (CD43glyco), **** p<0.0001 (CD49a), ** p=0.001 (CD62L), *** p=0.0007 (CD69), ** p=0.0043 (CD103), ** p= 0.0036 (CD122), **p=0.0036 (CXCR3), **** p<0.0001 (CXCR6), *** p=0.0003 (CX3CR1), and **** p<0.0001 (KLRG1).
Several makers including CD69 and CD103 have been used to characterize the phenotype of brain Trm after CNS infections27. To address the phenotype of peripherally induced brain Trm cells we used Spanning-tree Progression Analysis of Density normalized Events (SPADE) analysis, a non-biased approach to analyze flow cytometric data and separate cells with similar characteristics into nodes of different sizes representing different number of cells. Surface expression of CD8α, CD11a, CD44, CD49a, CD69, CD103, CXCR6, and CX3CR1, were used for initial SPADE analysis to identify characteristics of memory OT-I cells from the DC-OVA-rLM-OVA immunized mouse brains. SPADE analysis was initially performed to generate a dendrogram of all OT-I cells in the brain without considering the IV+ or IV– status (Figure 2c, left). Next, IV+ or IV– OT-I cells were gated and SPADE analysis was performed with the indicated markers on each population to generate dendrograms (Figure 2c, center and right). SPADE analysis identified two distinct clusters of cells that clearly segregate the IV+ and IV– populations isolated from the CNS without using IV exclusion as an a priori marker (Figure 2c).
Additional phenotyping of peripherally induced brain CD8+ T cells identified a pattern resembling Trm cells rather than Tcm or Tem populations (Figure 2d). Peripherally induced brain CD8+ T cells had high CD69 expression and a small subset expressed CD103. Brain IV– OT-I cells also showed increased CD8α expression, similar to brain Trm CD8+ T cells induced after IC PyV infection18, 19. Expression of CD11a and CD49a was increased on IV– OT-I cells, consistent with Trm CD8+ T cells described in other tissues33, 37. Chemokine receptors CXCR3 and CXCR6 that are characteristic of Trm cell subsets in other organs38, 39 were also increased in IV– brain CD8+ T cells. Trm cells in other tissues express low amounts of CD62L, CD122 and KLRG1 and peripherally induced brain IV– CD8+ T cells also showed reduced expression of these molecules11. The glycosylated form of CD43 has been associated with T cell activation and trafficking and was increased in CD8+ T cells from the IV– brain compared to IV+ brain compartments. Brain IV– CD8+ T cells showed reduced expression of CX3CR1 compared to IV+ CD8+ T cells, suggestive of a tissue residing40, 8 but not a circulating population. Combined, these data indicated that upon peripheral infection, Ag-specific CD8+ T cells that enter the CNS display a substantially different phenotype from those in the brain vasculature and this phenotype is similar to canonical Trm cells rather than Tcm or Tem cells.
Prior studies identifying brain Trm population induced by CNS infections have described a wide range of CD103 expression20,14, 15, 17, 18, 22. Peripherally induced brain Trm cells showed some CD103 expression and therefore we questioned if CD103 was required for their generation, as has been shown in other Trm populations38. CD103KO mice generated similar numbers of IV– CD69+ OVA-tetramer positive cells in the CNS compared to WT mice after DC-OVA-rLM-OVA immunization (Extended Data Fig. 2c). Moreover, adoptively transferred CD103KO P14 cells generated increased proportions of donor cells in the IV– brain after LCMV IP infection, in a pattern similar to wild-type P14 cells (Extended Data Fig. 2d,e). Together, these data suggested CD103 expression is not absolutely required for generation of peripherally induced brain Trm cells.
In addition to phenotypic differences in Trm compared to Tcm or Tem cells, several transcription factors such as KLF2, BLIMP-1, Hobit, and Runx329, 30, 31, 32 have been associated with the development of Trm populations. Indeed, Klf2 mRNA was substantially reduced in IV– brain T cells compared to IV+ brain T cells whereas Prdm1 (encoding BLIMP-1) and Zfp683 (encoding Hobit) were modestly upregulated. In contrast, Runx3 was not differentially expressed between IV– and IV+ brain T cell populations. However, Runx3 clearly has a positive role in generation of Trm cells in other tissues32 and Runx3-deficient P14 cells, although exhibiting an overall reduction in the magnitude of response, were not enriched in the IV– brain when compared to the IV+ compartment (Extended Data Fig. 2f,g). These data suggested a critical role for Runx3 in the generation of peripherally induced brain Trm cells.
Brain Trm cells display unique signatures
Trm CD8+ T cells are generally described at the site of initial infection; therefore, it was unexpected to find Trm cells enriched in the CNS after peripheral infections or immunizations. To determine if peripheral infection-induced enrichment of Trm cells was unique to the CNS, naïve OT-I cell bearing mice were immunized IV with rLM-OVA and memory OT-I cells were analyzed from tissues including PBL, SP, liver (LIV), kidney (KID), lung (LNG), and brain (BR). Increased proportions of OT-I cells were only found in the IV– brain (Figure 3a). Furthermore, SPADE analysis, using the same makers described in Figure 2c on IV– OT-I cells from all of these tissues, identified a phenotypic cluster of cells that were enriched the brain compared to other organs tested.
Figure 3: Increased representation of antigen specific CD8+ T cells after peripheral immunizations is CNS specific.
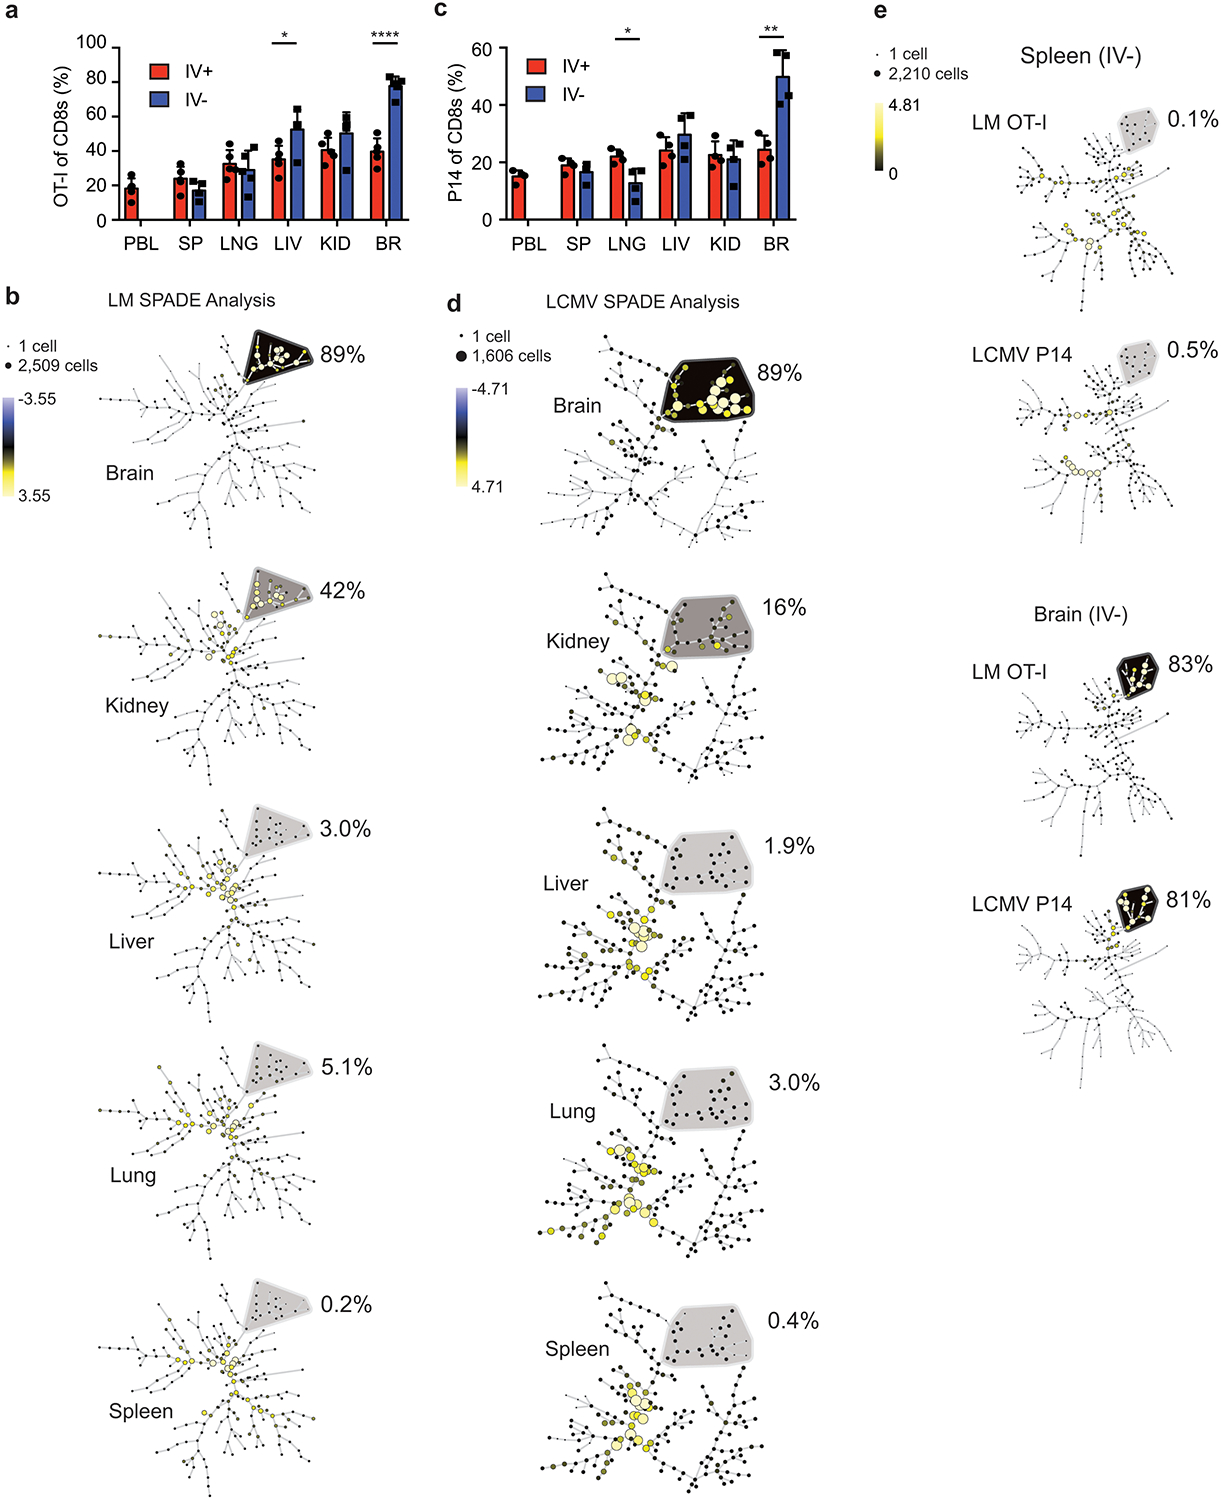
a,b) Thy1.1 eGFP+ OT-I T cells were transferred into naïve mice that were infected with rLM-OVA IV. Proportion of OT-I cells of memory CD8+ T cells (>30 days post immunization) in each organ are graphed (data are representative of 2 independent experiments with 5 mice per group). Graphs show the mean +/− standard deviation with each dot representing an individual mouse. Two-sided unpaired students T-test were used to determined significance using graphpad prism (p values: LIV * p=0.024, and BR, ****p<0.0001) (a). SPADE analysis of IV– OT-I cells from each organ are depicted (b).
c,d) Thy1.1+ P14 T cell were transferred into naïve mice that were infected with LCMV IP Proportion of P14 cells of memory CD8+ T cells (>30 days post immunization) in each organ are graphed (data are representative of 2 independent experiments with 4 mice per group). Graphs show the mean +/− standard deviation with each dot representing an individual mouse. Two-sided unpaired students T-test were used to determined significance using graphpad prism (p values: LNG * p=0.016, and BR, **p=0.0029 (c). SPADE analysis of IV– P14 cells from each organ are depicted (d).
e) SPADE analysis of cells from a and b (OT-I cells and rLM-OVA infection) compared to cells from c and d (P14 cells and LCMVArm infection). Markers used to distinguish populations include CD8α, CD11a, CD44, CD49a, CD69, CD103, CXCR6, and CX3CR1.
To determine if this brain Trm cell phenotypic cluster was unique to peripheral Listeria infection, memory P14 cells stimulated by IP LCMV infection were analyzed in multiple organs. Again, P14 CD8+ T cells were enriched in the IV– brain, and not in the other organs (Figure 3c). SPADE analysis, using the same makers described previously, also identified a brain specific phenotype of IV– P14 cells that was not found in IV– T cell populations in other organs despite known LCMV replication in peripheral organs including SP, LIV, and KID28 (Figure 3d). Similar to Listeria infection, SPADE analysis of LCMVArm infection identified 89% of cells in a phenotypic cluster from the brain but this population was not prevalent in other organs tested.
Memory CD8+ T cell populations with distinct phenotypes are generated in response to different infectious agents, routes of pathogen administration, and time after memory generation7, 41, 42,43. To address these issues, IV– OT-I cells in 1-month rLM-OVA infected mice (early) were compared to IV– P14 cells in 5-month LCMVArm infected mice (late). As expected, IV– Ag-specific cells from the spleen showed very distinct population dendrograms with nodes from each infection separating into different clusters (Figure 3e). However, the brain IV– Ag-specific donor cells clustered together in similar nodes in response to either pathogen suggesting that there was a signature of CD8+ T cells in the brain that was induced irrespective of the peripheral infection used. Combined, these data suggested that peripheral infections induced a population of Trm cells in the CNS that were phenotypically distinct from Trm cells from other peripheral organs.
To this point, our analyses focused on whole brains, which include brain parenchyma and meninges. To distinguish these compartments, we used a physical separation approach. DC-OVA-rLM-OVA immunizations increased OT-I frequencies in the IV– fraction from both brain and meninges compared to the PBL (Extended Data Fig. 3a,b). Moreover, the phenotype of OT-I memory cells isolated from meninges very closely resembled that expressed by OT-I isolated from the brain parenchyma (Extended Data Fig. 3c–g), illustrated by the clustering of >99% of the IV– OT-I populations from the brain and the meninges after SPADE analysis (Extended Data Fig 3h). Combined, these data suggested that after peripheral immunization, the Ag-specific CD8+ Trm population in the CNS was distinct from that of other peripheral organs.
Dynamics of CD8+ T cells in the CNS
Intravital microscopy can provide valuable information about the behavior and potential function(s) of cell populations in tissues. For example, CD8+ Trm cells in the skin being mostly arrested (<2um/min)44 compared to those in the female reproductive tract (FRT) that showed much faster average speeds of around 10 μm/min45. To address cellular dynamics of peripherally induced brain Trm cells, we immunized mice with DC-OVA-rLM-OVA and performed intravital imaging of brain memory eGFP+ OT-I cells to visualize cells in the meninges and superficial cortical layers (Supplemental Movies 1,2 and Fig. 4a). Brain OT-I cells exhibited varying dynamic properties, including moving large distances over short periods of time, crawling along the outside of the vessels, remaining mostly stationary with some toggling back and forth, and even interacting with other OT-I cells. The majority (62%) of peripherally induced memory OT-I cells in the brain were traveling between 2 and 5 μm/min, while 15% remained arrested (<2 μm/min) and 23% of cells were traveling with speeds greater than 5 μm/min. Together, these data suggest that peripheral immunization induces brain CD8+ T cell populations with variable dynamics.
Figure 4: CD8+ T cell dynamics in CNS after peripheral immunization.
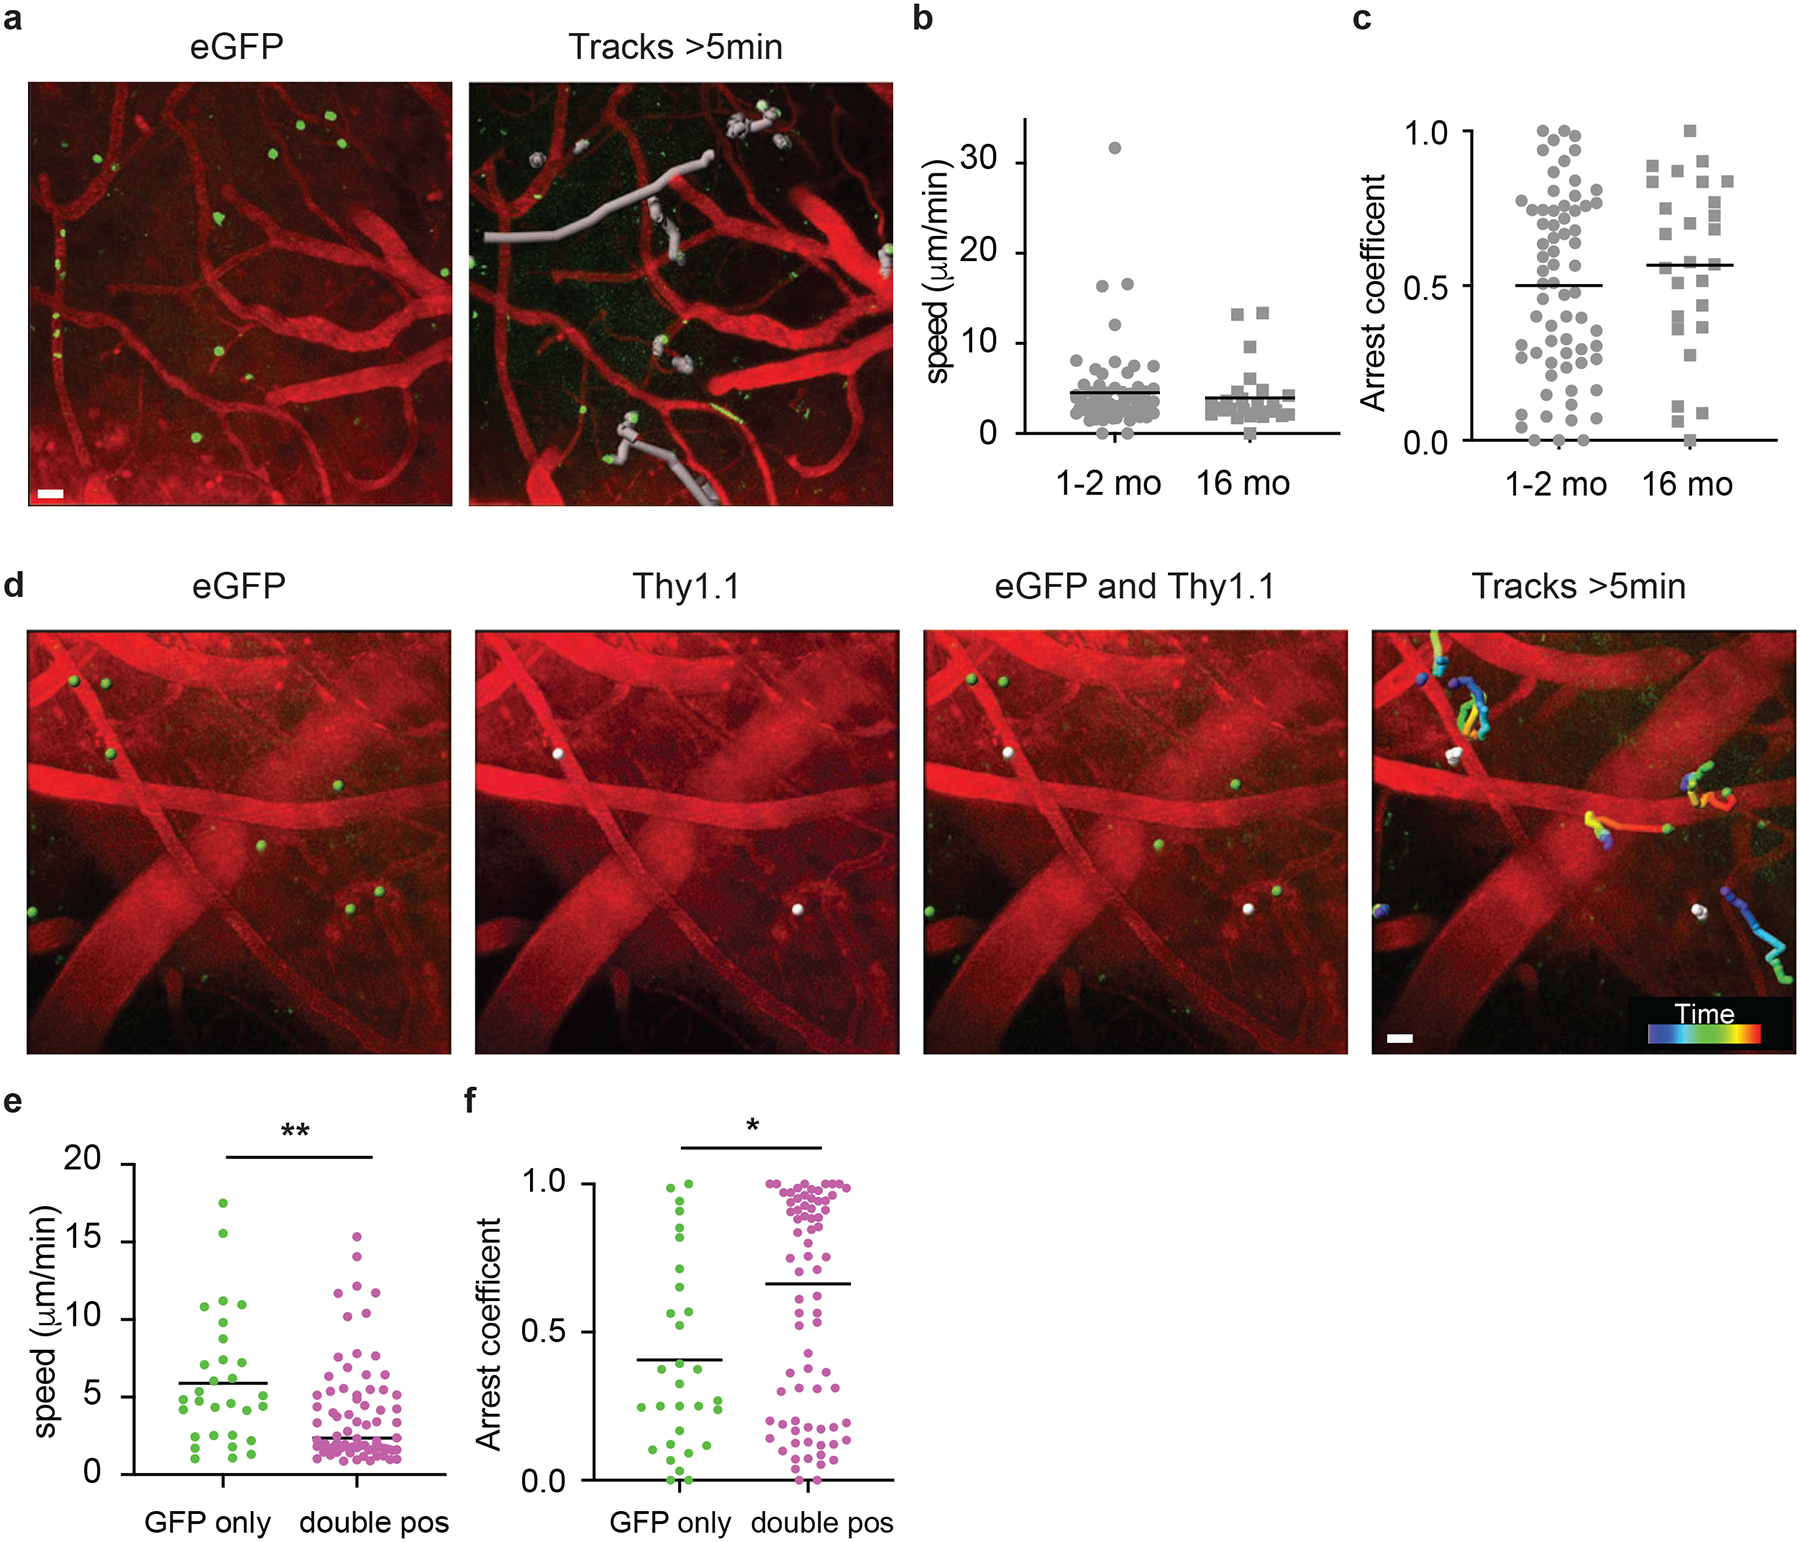
a-c) Two-photon imaging of eGFP+ OT-I cells in the CNS at memory time points (>30 days post immunization) after DC-OVA-rLM-OVA immunization. Snapshot showing the starting position of eGFP+ OT-I cells (green) and blood vessels (red) (left) and movement tracks (grey) of eGFP+ OT-I cells within the frame for greater than 5 min (right) (a). Scale bar, 20 μm. b,c) Calculated average speed (b) and arrest coefficients (c) of eGFP OT-I cell dynamics of tracks lasting at least 5 minutes from early memory (1–2months) or late memory (>16months) DC-OVA-rLM-OVA immunized animals. Graphs show mean with each dot representing an individual cell, analyzing 68 cells from 12 movies (1–2 mo), and 27 cells from 8 movies (16 mo).
d-f) Mice were seeded with Thy1.1 eGFP+ OT-I and immunized with DC-OVA-rLM-OVA. At a memory time point, mice were infused with anti-Thy1.1-PE antibody IV and 2-photon imaging of the CNS was performed. (d) Snapshot images illustrating the starting point of eGFP+ OT-I cells (green), Thy1.1+ OT-I cells (white), overlays illustrating single eGFP+ and double eGFP+ Thy1.1+ cells, and rainbow movement tracks of single and double positive OT-I cells in frame for greater than 5 min are shown from a representative movie lasting ~30 min. Scale bar, 20 μm. e,f) Calculated average speed (e) and arrest coefficients (f) of eGFP single positive or eGFP/Thy1.1 double positive OT-I cell dynamics of tracks for cells in the field for least 5 minutes. Graphs show mean with each dot representing an individual cell, analyzing 30 cells from GFP only, and 74 cells from double pos from 15 individual videos. Statistical significance was determined by two-sided Mann Whitney test using graphpad prism and ** p=0.0071 (e) and * p=0.0384 (f).
Peripherally induced T cell populations persisted long-term in the CNS; therefore, we determined if dynamics of memory CD8+ T cells change from early memory (1–2 months post inoculation) to late memory (~16 months post inoculation). No discernable differences were observed between these groups for average speed (Figure 4b) and arrest coefficients (Figure 4c). Given the observation that a wide range of cellular dynamic properties were seen both at early and late memory time points, we questioned if a particular type of behavior was associated with anatomical location (i.e. perivascular vs. parenchymal). To address this, memory Thy1.1+ eGFP OT-I cells were generated by DC-OVA-rLM-OVA immunization and intravital imaging of the brains was performed. T cells. 30 minutes prior to imaging, mice were injected IV with anti-Thy1.1-PE Ab to identify cells capable of being labeled intravenously, specifically those in perivascular spaces (Supplemental Mov3 and Mov4, Figure 4d). Consistent with perivascular localization, double positive (Thy1.1+ eGFP+) OT-I exhibited reduced average speeds and increased arrest coefficients compared to Thy1.1– eGFP+ single positive cells (Figure 4e,f). These data suggested that memory CD8+ T cells in the brain parenchyma display a vigorous patrolling movement pattern.
Brain CD8+ T cells resist systemic depletion
Bona fide Trm populations in the skin, FRT, and other organs are resistant to systemic antibody-mediated depletion, a characteristic of their tissue residence46. To address this, memory Thy1.1+ OT-I cells in the brain were induced by DC-OVA-rLM-OVA immunization and mice were injected with various doses of anti-Thy1.1 depleting antibody. One week post treatment, OT-I cells were depleted in the SP, PBL and in the IV+ brain; however, the IV– OT-I cells in the brain were protected from antibody depletion (Extended Data Fig. 4a, Figure 5a,b). To address whether peripherally induced brain Trm cells require a circulating population for maintenance, organs were harvest one-month post antibody depletion. IV– OT-I cells were similarly maintained both in the presence and absence of peripheral OT-I responses, (Figure 5c) indicating peripherally induced brain Trm cells persist in the absence of a circulating memory pool.
Figure 5: Peripherally induced CNS Trm cells are resistant to systemic depletion.
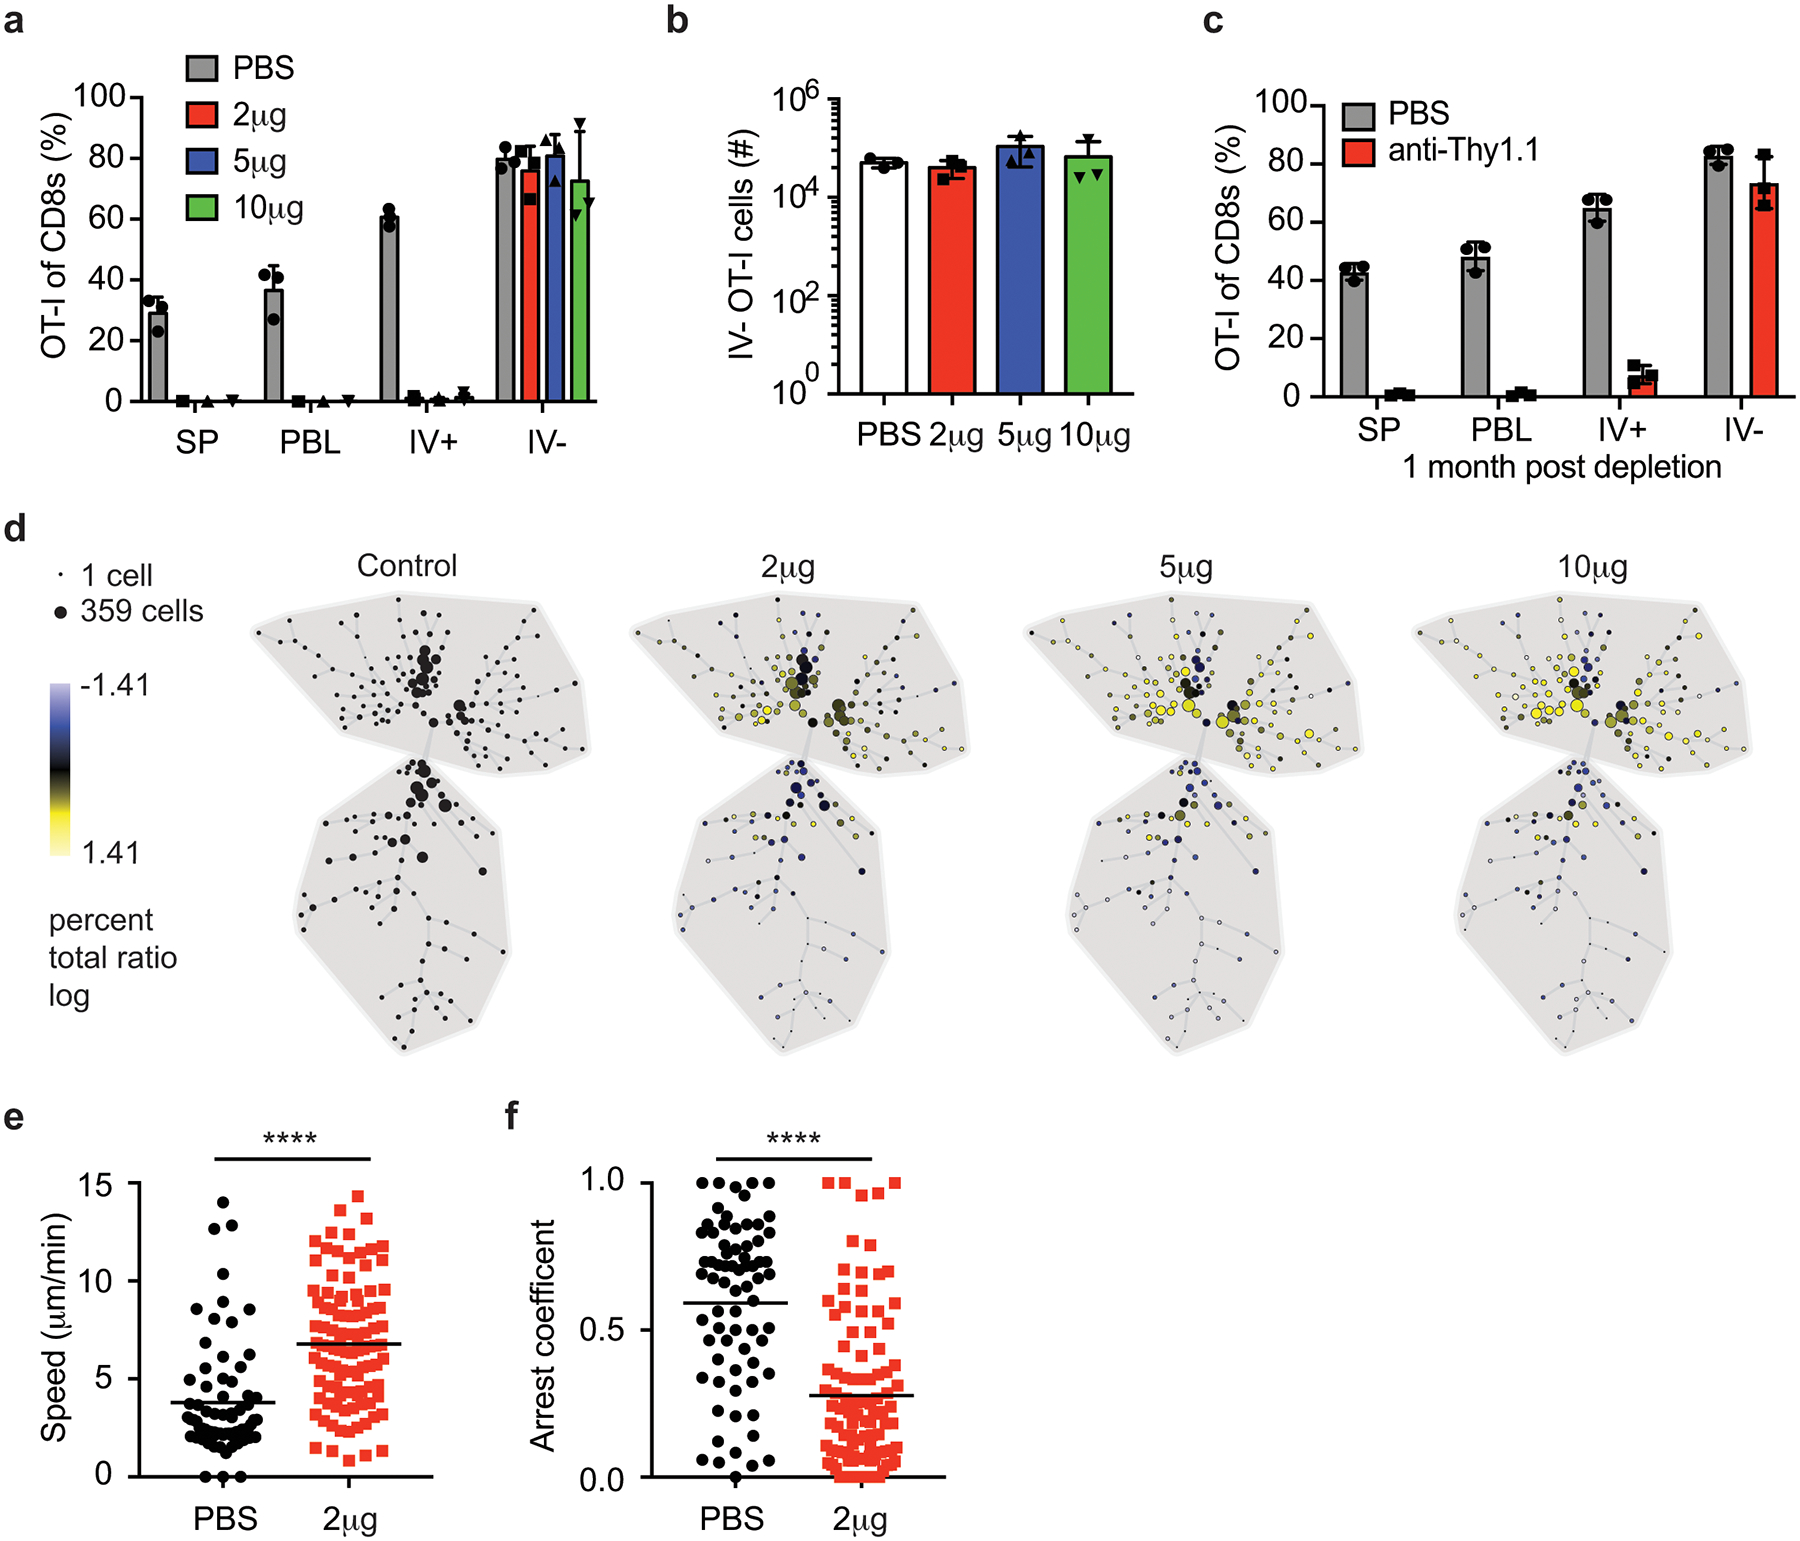
a-b) Thy1.1 eGFP+ OT-I T cells were transferred into naïve mice that were DC-OVA-rLM-OVA prime boosted. After memory formation, mice were control treated (PBS) or treated with 2, 5, or 10 μg of anti-Thy1.1 Ab IP and one week after depletion, phenotype and numbers of donor cells were determined. Proportion of OT-I cells in spleen (SP), PBL, IV+ brain and IV– brain of CD8+ T cells are graphed (a). Number of IV– OT-I cells in brain are graphed (b). Data are representative of 2 independent experiments with 3 mice per group. Graphs show the mean +/− standard deviation with each dot representing an individual mouse.
c) Thy1.1 eGFP+ OT-I T cells were transferred into naïve mice that were DC-OVA-rLM-OVA prime boosted. After memory formation, mice were control treated (PBS) or treated with 2 μg of anti-Thy1.1 Ab IP. One month after depletion, phenotype and numbers of donor cells were determined. Proportion of OT-I cells of CD8+ T cells are graphed (c). Data are representative of 2 independent experiments with 3 mice per group. Graphs show the mean +/− standard deviation with each dot representing an individual mouse.
d) Thy1.1 eGFP+ OT-I T cells were transferred into naïve mice that were DC-OVA-rLM-OVA prime boosted. After memory formation, mice were control treated (PBS) or treated with 2, 5, or 10 μg of anti-Thy1.1 Ab IP one week after depletion, SPADE analysis of IV– OT-I cells from each group are depicted.
e,f) Thy1.1 eGFP+ OT-I T cells were transferred into naïve mice that were DC-OVA-rLM-OVA prime boosted. After memory formation, mice were control treated (PBS) or treated with 2 μg of anti-Thy1.1 Ab IP One week after depletion, OT-I cells in the CNS were imaged and average cell speed (e) and arrest coefficients (f) were determined. Graphs show the mean +/− standard deviation with each dot representing an individual cell, analyzing 71 cells from 12 individual movies (PBS), and 103 cells from 16 individual movies (2 μg). Statistical significance was determined by two-sided Mann Whitney test using graphpad prism where **** p<0.0001 (e) and **** p<0.0001 (f).
To assess if the phenotype of the CD8+ T cell population in the brain changed upon systemic depletion with antibody, SPADE analysis, using the aforementioned markers, was performed using IV– OT-I cells from control treated mice as the comparator to each of the antibody depletion doses tested (Figure 5d). Two major clusters (upper and lower) were identified in control mice. The percentage of IV– Ag-specific of cells in the upper cluster was enriched after peripheral depletion in an antibody dose-dependent manner. Thus, although the proportion and number of OT-I cells in the IV– CNS did not appear to differ between groups (Figure 5a and b), there was enrichment in a specific phenotypic cluster upon systemic antibody depletion. Indeed, analysis of individual markers determined that CD69 (Extended Data Fig. 4b), CD103, CD49a, and CXCR6 (data not shown) expression were elevated in IV– OT-I cells remaining after systemic antibody depletion. This suggested that two distinct populations in the IV– CNS exist, a resident population that was resistant to systemic depletion and a population that was susceptible to systemic depletion.
Next, we sought to determine if T cell dynamics were also altered by systemic depletion. Indeed, the average (Figure 5e) and maximum speed (Extended Data Fig. 4c) were increased while the arrest coefficients decreased (Figure 5f) in brain OT-I cells from systemically depleted mice compared to control mice. These data suggested that the variable cellular dynamic properties shown in Figure 4 and in non-depleted mice in Figure 5 resulted from brain Ag-specific CD8+ T cells comprised of both perivascular or transient IV– cells (more susceptible to being depleted) and resident parenchymal populations whose movement dynamics may facilitate CNS surveillance.
Brain Trm cells protect against CNS infections
In prior studies, Trm cells in multiple organs exhibited increased effector cytokine production compared to vascular or non-Trm tissue derived CD8+ T cells12, 33. Increased expression of Il2, Ifng and Tnf genes was identified in our brain Trm cells compared to spleen T cells in our unbiased RNA-Seq analysis. Consistent with this, brain IV– memory OT-I T cells showed enhanced single and multiple cytokine producing capabilities compared to IV+ OT-I T cells (Figure 6a–e). Similarly, DC-GP33-rLM-GP33 induced brain memory IV– P14 cells showed increased capacity to produce multiple cytokines compared to IV+ P14 cells (data not shown). These data show that peripherally induced brain CD8+ Trm cells also exhibit enhanced cytokine producing capabilities.
Figure 6: Enhanced effector functions of peripherally induced Trm CD8+ T cells in the CNS.
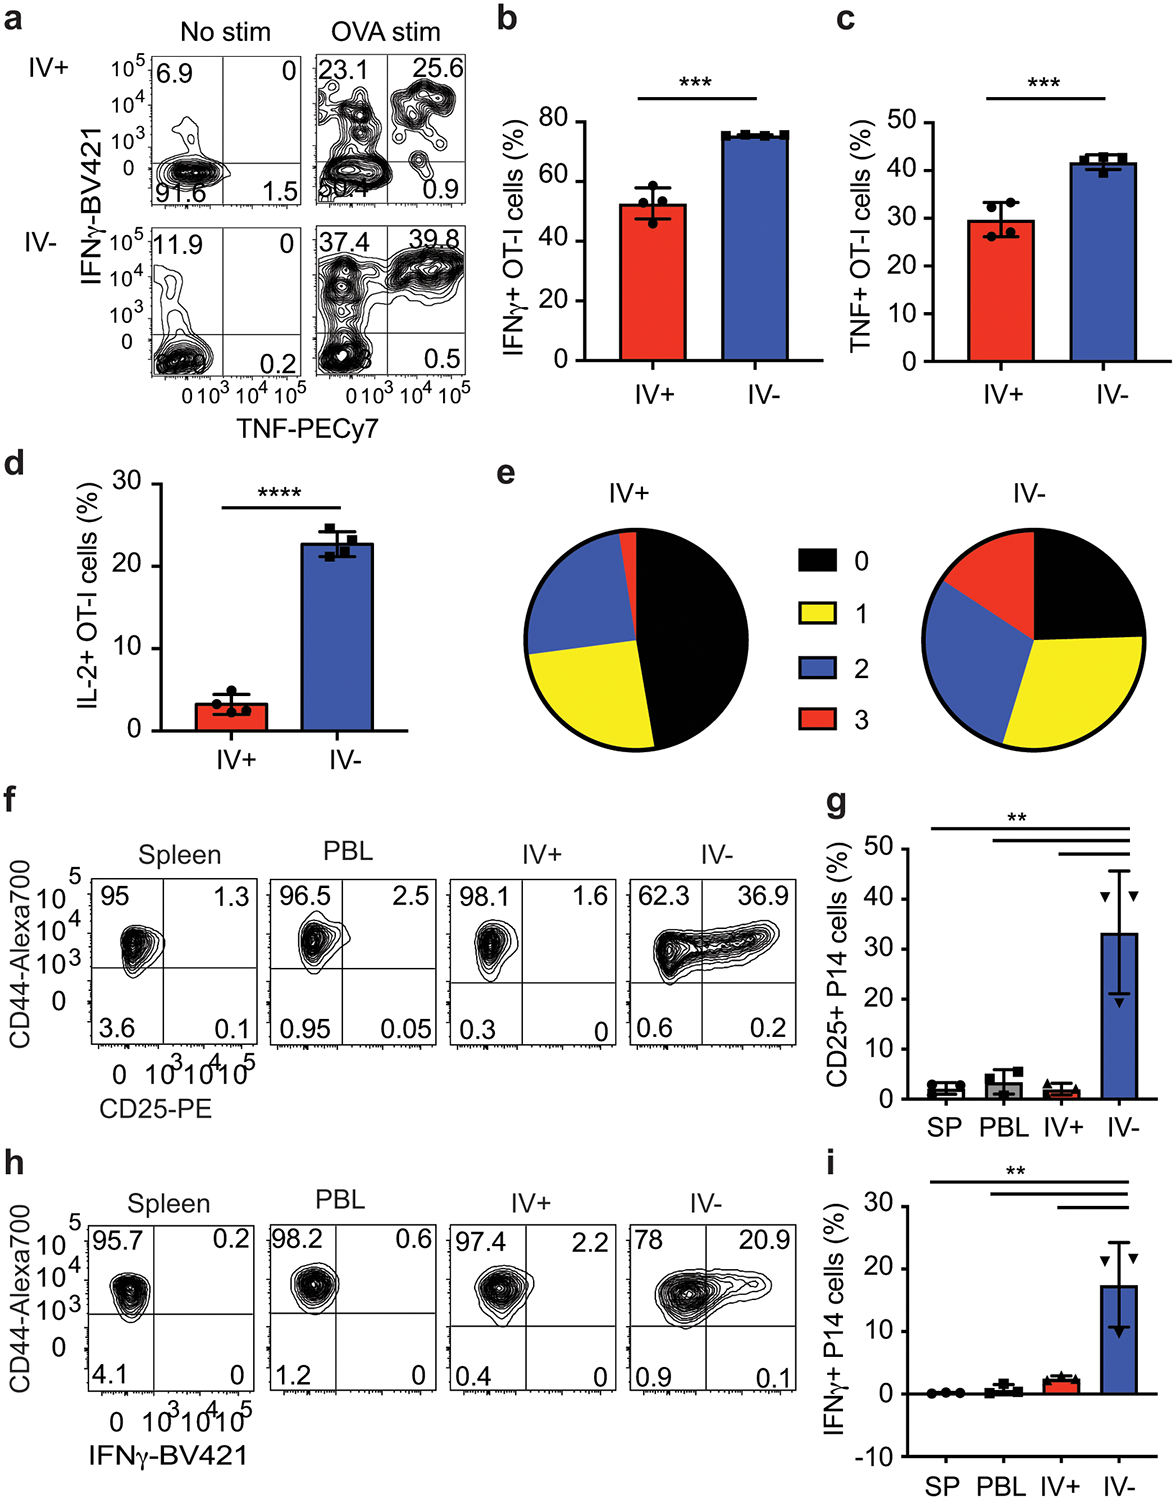
a-e) OT-I T cells were transferred into mice and DC-OVA-rLM-OVA prime boosted. Intracellular cytokine stimulation was performed at a memory time point and stained for production of IFN-γ, TNF and IL-2 without stimulation (No stim) or after peptide stimulation (OVA stim). Representative flow plots (a) showing IFN-γ and TNF production of OT-I cells from IV+ or IV– brain. Proportion of IFN-γ + (b), TNF+ (c), or IL-2+ (d) OT-I CD8+ T cells are graphed. Zero, single, double, or triple cytokine producing OT-I T cells from the CNS are graphed (e). Graphs show the mean +/− standard deviation with each dot representing an individual mouse. Data are representative of 2 independent experiments with 4 mice per group. Two-sided unpaired students T-test were determined using graphpad prism and p values determined *** p=0.0001 (b), *** p=0.0008, and **** p<0.0001.
f-i) P14 T cells were transferred into mice and immunized with LCMV IP. At a memory time point, mice were challenged with rLM-GP33 IC and organs were harvested 2 days later and stained for CD25 and intracellular IFN-γ directly ex vivo. Representative flow plots of P14 cells expressing CD25 (f) and IFN-γ (h) are shown. Proportion of CD25+ (g) and IFN-γ + (i) P14 cells are graphed. Graphs show the mean +/− standard deviation with each dot representing an individual mouse. Data are representative of 2 independent experiments with 3 mice per group. Statistical significance was determined by One-way ANOVA with Tukey’s multiple comparison post-test using graphpad prism with individual p values reported between groups. P values from top to bottom ** p=0.001, ** p=0.002, and ** p=0.001 (f), and ** p=0.0011, ** p=0.0014, ** p=0.003 (i).
Increased effector function during in vitro stimulation does not fully indicate enhanced responses against pathogens in vivo. Two different experimental approaches were utilized to address whether peripherally induced brain Trm cells were capable of rapid responses to infection. Memory OT-I brain Trm cells and circulating memory cells were generated via DC-OVA-VACV-OVA immunization and mice either were unchallenged or challenged with rLM-OVA IC. OT-I cells in the brain, but not other tissues, upregulated CD25 (Extended Data Fig. 5a) and produced IFN-γ (Extended Data Fig. 5b) when isolated two days post challenge. Similarly, brain IV– P14 cells induced by LCMV infection upregulated CD25 (Figure 6f,g) and produced IFN-γ (Figure 6h,i) after IC challenge with rLM-GP33 and this was not impacted by peripheral depletion (Extended Data Fig 5c,d) nor observed in circulating memory CD8+ T cells in non-depleted mice. Additionally, Trm cells have the potential to recruit circulating cells to the site of challenge9. Consistent with this property, total P14 cells were increased in LCMV immunized mice after IC challenge with rLM-GP33 compared to the numbers recovered after IC challenge of immunized mice that had been depleted of circulating P14 cells (Extended Data Fig 5e).
Trm cells control secondary infections by killing infected cells, inducing an antiviral state in the re-infected tissue and producing cytokines that facilitate the recruitment of other immune cells to the site through changes to the vascular endothelium and local chemokine milieu9, 46. Trm cells generated by direct CNS infection are thought to provide enhanced resistance to brain reinfection17, 27 but it is unknown whether peripherally induced brain Trm cells contribute to immunity or pathogenesis after reinfection. To address this, control and DC-OVA-rLM-OVA immunized mice with peripherally induced brain CD8+ Trm cells were challenged with VSV-OVA IN. Three days post infection, immune mice exhibited reduced viral titers compared to controls, albeit the range in titers was broad (Extended Data Fig 6a), likely due to the variability with the IN route of infection. To examine a more reproducible model, control and DC-OVA-rLM-OVA immune mice were generated, some mice were depleted of circulating OT-I and all mice were challenged with with VSV-OVA IC. Control mice had higher viral titers (Figure 7a) and died earlier (Extended Data Fig 6b) than immune mice containing brain Trm OT-I cells. Of note, protection did not require circulating memory OT-I cells, suggesting that the brain-resident Trm cells were capable of independent antiviral activities. Similarly, mice containing brain Thy1.1 P14 cells generated by IP LCMVArm infection exhibited reduced bacterial burden compared to control mice after rLM-GP33 IC challenge (Figure 7b) and protection did not require circulating memory P14. Additionally, DC-OVA-VACV-OVA immune mice treated with FTY720 to inhibit cellular ingress (and egress) from other organs controlled rLM-OVA infection similarly to vehicle-treated immune controls (Figure 7c). Combined, these data suggested that peripherally induced brain-resident memory cells can contribute to pathogen control with and without recruiting Ag-specific cells from the periphery.
Figure 7: Peripherally induced brain resident CD8+ T cells mediate protection against CNS infections.
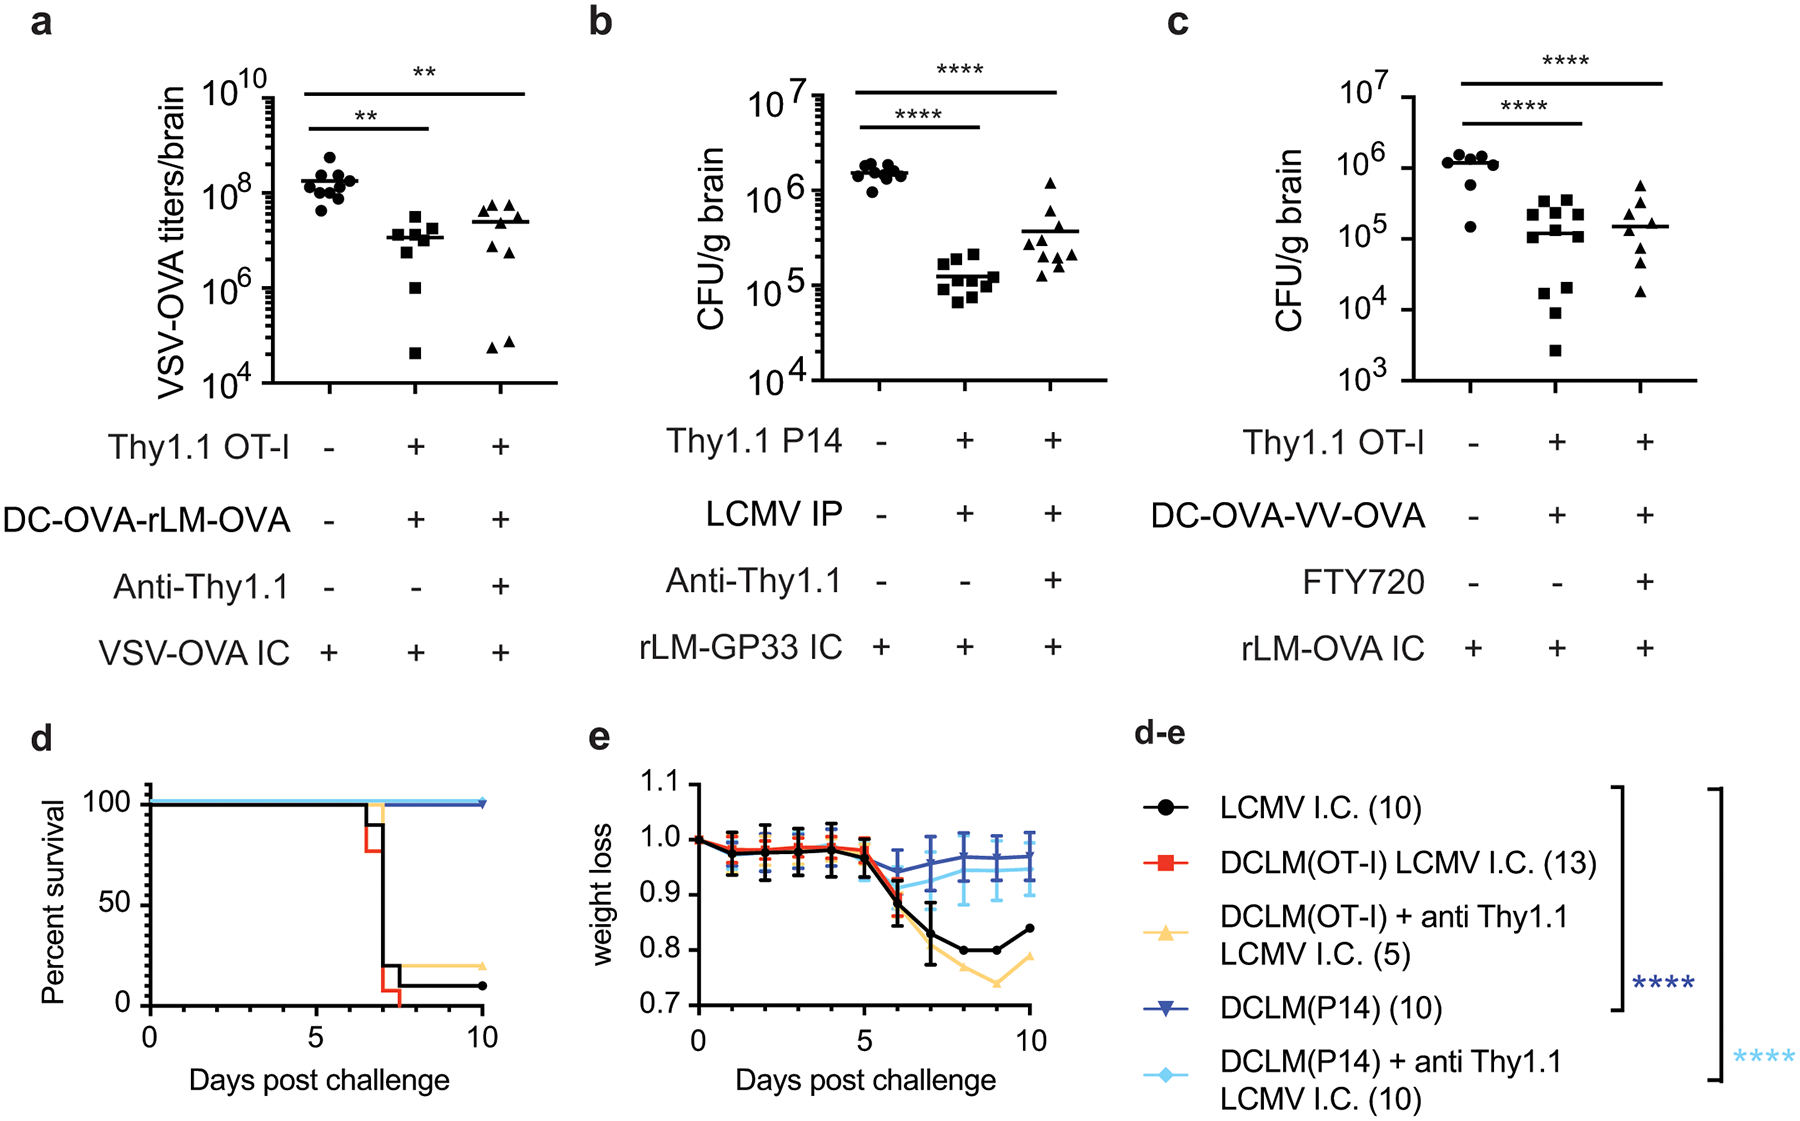
a) Thy1.1 OT-I cells were transferred into mice and recipients were DC-OVA-rLM-OVA prime boosted. After memory formation, these mice and naïve controls were control treated with PBS or treated with 2 μg anti-Thy1.1 Ab IP and challenged with VSV-OVA IC one week after depletion. VSV-OVA titers at day3 post challenge are graphed. Data are combined from 2 independent experiments for a total of 10, 8, and 9 mice per group (left to right). Graph shows the mean +/− standard deviation with each dot representing an individual mouse. Statistical significance was determined by One-way ANOVA with Tukey’s multiple comparisons test across all the groups using graphpad prism with p values (top to bottom) ** p=0.0035, and ** p=0.0022.
b) Thy1.1 P14 cells were transferred into mice and recipients were infected with LCMVArm IP. After memory formation, mice were control treated with PBS, or treated with 2 μg anti-Thy1.1 Ab IP and these mice and naïve controls were challenged with rLM-GP33 IC one week after depletion. Bacterial CFU/gram of brain are plotted at day 2 post challenge. Data are combined from 2 independent experiments for a total of 10 mice per group. Graph shows the mean with each dot representing an individual mouse. Statistical significance was determined by One-way ANOVA with Tukey’s multiple comparisons test across all the groups using graphpad prism with p values (top to bottom) **** p<0.0001, **** p<0.0001.
c) Thy1.1 OT-I cells were transferred into mice and recipients were DC-OVA-VACV-OVA prime boosted. After memory formation, mice were control treated with PBS, or treated FTY720 on days −4, 2, and 0 prior to challenge with rLM-OVA IC. Bacterial CFU/gram is plotted at day 2 post challenge. Data are combined from 2 independent experiments for a total of 7, 12, and 8 mice per group (left to right) mice per group. Graph shows the mean with each dot representing an individual mouse. Statistical significance was determined by One-way ANOVA with Tukey’s multiple comparisons test across all the groups using graphpad prism with p values (top to bottom) **** p<0.0001, **** p<0.0001.
d,e) Thy1.1 OT-I or P14 cells were transferred into mice and DC-OVA-rLM-OVA or DC-GP33-rLM-GP33 prime boosted, respectively. After memory formation, mice were control treated with PBS or treated with 2 μg anti-Thy1.1 Ab IP and challenged with LCMV IC one week after depletion. Kaplan meier survival curves (d) and weight loss curves showing mean +/− standard deviation (e) are depicted for LCMV IC only controls (black n=10), DC-OVA-rLM-OVA no depletion (red n =13), DC-OVA-rLM-OVA with anti-Thy1.1 (yellow n=5), DC-GP33-rLM-GP33 no depletion (navy n=10) or DC-GP33-rLM-GP33 with anti-Thy1.1 (blue n=10). Data are combined from 2 independent experiments for a total of 5–13 mice per group. Graphpad prism used to determine significance using Mantel-Cox test for each group comparing to the LCMV IC only challenge group (d) where p values are **** p<0.0001 (navy) and ****p<0.0001 (blue)
Potent CD8+ T responses in some models of viral encephalitis are pathogenic rather than protective, as in the case of meningitis induced in adult mice by IC infection with LCMVArm47. To address a role for brain Trm cells in LCMV-induced meningitis, mice were seeded with Thy1.1 TCR-tg T cells and were primed against OVA (containing OT-I cells) or GP33 (containing P14 cells) and some mice were depleted of peripheral memory cells (Extended Data Fig 6c–d). Regardless of depletion, mice containing non-specific brain Trm cells succumbed to IC LCMV infection with similar kinetics as naive controls (Figure 7d–e). However, mice containing GP33-specific brain Trm cells, regardless of whether peripheral P14 cells were depleted, were protected from LCMV-induced morbidity and mortality compared controls. Combined, these data suggested that peripherally induced Trm cells in the brain can provided protection in several models of brain infection by limiting pathogen replication and reducing morbidity and mortality.
Discussion
Historically, it has been thought that the only time T cells entered the CNS was to control infections (often with adverse consequences) or contribute to CNS autoimmune diseases. However, our present understanding of T cells in the brain indicates that they contribute to brain development, protect against CNS injury and neurodegeneration and aid in controlling infections2. As shown here, peripheral immunizations uniformly increase Ag-specific CD8+ Trm cells in the CNS and these cells can limit brain infections. These results support emerging concepts that the CNS may be a more welcoming environment for T cells than previously appreciated.
Ag-specific CD8+ T cells seed the brain after peripheral immunizations; however, the route these cells utilize to enter the CNS remains unknown. The CNS has multiple barrier structures to limit inflammation and cellular infiltration into the parenchyma, but these barriers can also serve as entry points for pathogens and leukocytes and may be altered by systemic inflammation3. Alternatively, although most of the CNS is protected from peripheral infiltration by the BBB, some locations, such as the choroid plexus, have less restrictive barriers3 where T cells have been shown to accumulate in response to superantigen stimulation48. A recent study determined that neurogenic niches contained oligoclonal T cells with Trm gene expression profiles and also found T cells throughout the brain in aged mice25. Our results provide an explanation for increased oligoclonal T cell responses in the CNS that may, in part, derive from peripheral immune responses.
We show that peripherally induced Trm cells in the CNS exhibit dynamic movement behavior, resulting in an average speed of approximately 4 μm/min. For comparison Trm in the skin, which are largely CD69+ CD103+, are relatively slower (<2 μm/min average speed44) while Trm in the FRT, which are largely CD69+CD103–49, are relatively faster, averaging ~10 μm/min45. Three main types of CD8+ T cell dynamic behaviors were observed in brains of peripherally infected mice; static/stationary, patrolling along vessels, and seemingly random movement. A substantial portion of CD8+ T cells were adjacent to blood vessels and these were primarily arrested. Of note, when administering Thy1.1-PE Ab IV prior to brain imaging of eGFP+ OT-I T cells, double positive, likely perivascular cells were identified, which displayed reduced average speeds and increased arrest coefficients compared to eGFP single positive (parenchymal) cells. Upon peripheral depletion, arrest coefficients in brain CD8+ T cells were reduced and average speeds increased, suggesting loss of cells that were mainly arrested (likely perivascular cells that were accessible to IV labeling). Since peripheral depletion did not compromise protection, it seems that the perivascular T cells were not major contributors to the early control of pathogens after IC infection.
Other brain CD8+ T cells showed patrolling movement along the vessel walls. Movement was not uniform in direction and these cells were often found reversing direction along the same vessel wall. Given the important role that LFA-1 plays in similar liver Trm cell patrolling patterns37 and the particularly high expression of CD11a on IV– CD8+ Trm cells in the brain, it will be of interest to determine the role of adhesion molecules in brain Trm cell patrolling behavior. The last major dynamic behavior seen in peripherally induced Trm cells involved seemingly random movements. Brain Trm populations have high expression of CXCR6 and glial cells express CXCL16, the ligand for CXCR650, but their role in T cell dynamics in the brain remains to be determined. Learning more about what drives the dynamic properties of T cells in the brain will provide valuable information that can be used to potentially alter behavior under pathogenic conditions such as neurodegeneration or after CNS infections.
Understanding how immune cells contribute to clearance of brain infections is critical to combat emerging pathogens including West Nile virus (WNV) and Japanese encephalitis virus that can induce encephalitis and meningitis. Based on the notion that CNS infection may not be necessary for development of protective Trm cells in the brain, peripherally administered vaccines could potentially be used to elicit Ag-specific T cell response in the CNS in addition to the periphery to protect against some of these diseases. The ability to induce both peripheral and CNS resident memory cells could be beneficial to limit pathogen replication should peripheral immunity fail to completely inhibit pathogen entry into the CNS. Further studies will continue to shed light on the precise role of peripherally induced brain Trm cells.
The specificity of brain-residing T cells in humans remains largely unknown. A recent study identified oligoclonal CD8+ T cells patrolling the CSF of Alzheimer’s patients26 and at least some cells were specific for Epstein Barr Virus, an infection that originates in the periphery. Although more studies are needed, our results provide new perspectives on how CNS Trm cells may be generated and their potential contributions to controlling CNS infections and other neurological disorders.
METHODS
Mice
6–10 week old C57BL/6 and B6-Ly5.1/Cr mice were purchased from National Cancer Institute and NIH Swiss Webster mice were purchased from Envigo. Thy1.1 eGFP OT-I T cell receptor (TCR) transgenic (Tg), Thy1.1 P14 TCR Tg, CD45.2 CD103KO P14 TCR Tg, and CD103KO mice were bred in house at the University of Iowa Animal Care Facility. hCD2-Cre+Runx3fl/fl 51 were crossed to P14 TCR Tg and were bred in house at the University of Iowa Animal Care Facility. All animals were handled in accordance with guidelines established by the Institutional Animal Care and Use Committee.
Adoptive transfer
Thy1.1 eGFP OT-I or Thy1.1 P14 TCR Tg CD8+ T cells were isolated from female donor blood and CD45.2 CD103KO P14 TCR Tg, hCD2-Cre+Runx3fl/fl P14 TCR Tg and hCD2Cre–Runx3fl/fl P14 TCR Tg CD8+ T cells were isolated from male donor blood. RBCs were lysed using 1x Vitalyse (CytoMedical Design Group), frequencies of TCR Tg cells were determined by flow cytometry and approximately 0.5–2.5 × 10⁴ TCR Tg cells were adoptively transferred via tail vein injection into recipient mice one day prior to infection or immunization.
Infections and Immunizations
DC prime-boosting
DC priming and various boosting strategies were adapted from52. Briefly, LPS-matured FMS-like tyrosine kinase-3 ligand (Flt-3L)-induced splenic DCs digested with collagenase/DNase were incubated for 2 h at 37 °C with 2 μM OVA(257–264) or GP33(33–41) peptide. CD11c+ cells were enriched using anti-CD11c Microbeads (Miltenyi Biotec) and ~5 × 10⁵ peptide-coated DCs were intravenously (IV) injected into mice. Seven days later, mice were boosted IV with 1 × 10⁷ CFU of recombinant attenuated (ActA−/−) Listeria monocytogenes expressing OVA (rLM-OVA) or GP33 (rLM-GP33), 2 × 10⁶ PFU vaccinia virus expressing OVA (VACV-OVA), or 30 × 106 OVA(257–264) coated splenocytes. For boosting with peptide-coated splenocytes, single-cell suspensions of spleen cells from C57BL/6 mice were incubated with OVA(257–264) for 1 h at 37 °C in medium with fetal calf serum followed by several washes prior to determining cell number for cell transfer.
Single immunizations
Mice were infected with 2 × 10⁵ PFU of lymphocytic choriomeningitis virus Armstrong strain (LCMVArm) interperitoneally (IP) or IV. Mice received 2 × 10⁴ TCID50 of influenza A/PR/08/34 expressing GP33 (IAV-GP33) in a total volume of 25 μl intranasally (IN). Mice were infected with 5 × 10⁷ PFU of vesicular stomatitis virus expressing OVA (VSV-OVA) IP or IN and 1 × 10⁷ CFU of rLM-OVA IV. 100 pfu VSV-OVA, 1000 PFU LCMVArm, 100 CFU rLM-GP33 or 100 CFU rLM-OVA was administered in 30 μl IC for challenge experiments.
Antibody depletion
Mice received either 2, 5, or 10 μg of anti-Thy1.1 antibody (clone 19E12, BioCell,) IP to deplete peripheral TCR-Tg memory CD8+ T cells.
Viral and bacterial titers
Tissues were collected in 1 mL of PBS and homogenized using glass tissue grinders. Samples were spun for 3 min at 12,000rpm, supernatants were collected, aliquoted, and viral titers determined immediately or stored at −80 °C. To determine VSV titers, TCID50 was calculated using Vero cells. Briefly, approximately 15,000 cells/well (DMEM 2% FCS with 1% Penicillin/Streptomycin) were plated in 96-well plates one day prior to titration. Samples were diluted 1:10 in PBS followed by serial 10-fold dilutions. 10 μl of each dilution was added per well with 8 replicates at each concentration, plates were read 5 days later. Percentage of positive wells from each dilution were determined and used to calculate total TCID50.
For enumeration of L. monocytogenes, brains were harvested in 5 mL of 0.2% Igepal (Sigma-Aldrich) and homogenized. CFU per gram of tissue was determined by plating 10-fold serial dilutions on Tryptic Soy broth/Streptomycin plates and calculating colony count averages after overnight incubation at 37 °C.
Tissue harvesting and cellular isolation
Unless noted, mice received 2 μg anti-CD45 Ab (clone 30-F11, BioLegend) conjugated to a fluorophore IV 3 min prior to harvesting tissues. Blood was collected 2 min after IV injection just prior to harvesting organs including spleen, liver, kidneys, lungs, meninges and brain53. Single cell suspensions of splenocytes were obtained by dissociating cells using frosted glass slides spleen followed by RBC lysis via ACK or Vitalyse. Liver, kidney, and lungs were digested for 1 h with collagenase and DNase followed by dissociating tissue through 70 μm filter. Cells were resuspended in 35% percoll (GE Healthcare) and spun (1,500 RPM) at 25 °C for 5 min prior to RBC lysis via Vitalyse. Brain mononuclear cells were isolated by digesting tissue in CollagenaseD/DNase for 45 min at 37 °C, dissociating through 70-μm filter and isolating the interface between a 70% and 37% percoll gradient after a 20 min 25 °C spin at 2,000 RPM. Cells were enumerated and used for flow cytometry.
Flow cytometry
Single-cell suspensions were plated and stained for 20 min at 4 °C with a combination of fluorescently labeled antibodies specific for surface markers including CD8α (53–6.7), CD25 (PC61.5), CD11a (M17/4), CD43glyco (1B11), CD44 (IM7) CD49a (Ha31/8), CD62L (MEL-14), CD69 (H1.2F3), CD103 (2E7), CD122 (5H4), CXCR3 (CXCR3–173), CXCR6 (SA051D1), CX3CR1 (SA011F11), KLRG1 (2F1), Thy1.1 (OX-7 or HIS51) and fixable viability stain (BD Horizon). Antibodies were purchased from BD Bioscience, BioLegend, eBioscience/Thermo Fischer Scientific, or Tonbo biosciences. Cells were fixed with BD Cytofix (BD Biosciences).
To asses cytokine production, single cells suspensions were plated in the absence (no stim) or in the presence 1 μM OVA(257–264) peptide in the presence of GolgiPlug (BD Bioscience) for 5 h at 37 °C or detected directly ex vivo in the absence of GolgiPlug. Cells were stained for surface molecules including fixable viability stain (BD Horizon), fixed and permeabilized using the transcription factor staining buffer kit (Thermo Fisher Scientific) and stained for cytokines including IFN-γ (XMG1.2), TNF (MP6-XT22), and IL-2 (JES6–5H4).
All samples were acquired using LSRFortessa (BD Bioscience) and analyzed using FlowJo software, version 9.9.4 (FlowJo LLC).
Spanning-tree Progression Analysis of Density normalized Events (SPADE) Analysis
TCR Tg T cell populations were gated using FlowJo software to identify live, CD8+, eGFP+ or Thy1.1+, IV+ and IV–. These populations were then exported as compensated files and samples were concatenated to achieve cell numbers necessary for analysis. Concatenated files were uploaded to Cytobank, a cloud-based computational platform (https://premium.cytobank.org/) and input into the SPADE algorithm54. Clustering channels included CD49a, CD44, CD8α, eGFP or Thy1.1, CD103, CD11a, CXCR6, CD69, and CX3CR1. FSC, SSC, Time, IV labeling, and fixable viability stain were not used for clustering. IV labeling and fixable viability stain were excluded because populations were gated based on lack of expression by these markers. Additionally, Thy1.1 and eGFP were excluded from analysis when comparing Tg populations from different infectious conditions. SPADE analysis was run with a 200-node target and 10 percent down-sampling.
RNA sequencing and analysis
Total RNA was extracted from OT-I cells isolated and sorted at a memory timepoint from the spleen, IV+ and IV– brains of DC-OVA-rLM-OVA immunized mice, and two biological replicates, pooled from 5 mice each for brain samples were obtained for each group. RNA integrity was assessed using RNA 6000 Pico Kit for Bioanalyzer (Agilent Technologies #5067–1513) and RNA-seq libraries were constructed using NEBNext Single Cell/Low Input RNA Library Prep Kit for Illumina (NEB #E6420) following manufacturer’s instructions. Briefly, between 1 and 10 ng of total RNA were converted to cDNA utilizing RT primer and template switching oligo (TSO) containing annealing sites for cDNA amplification primers. cDNA was amplified with 14 cycles of PCR, enzymatically fragmented to an average size of ~250 bp, end-repaired, dA tailed and ligated to NEBNext hairpin adaptors (NEB #E7335). After ligation, adaptors were converted to the ‘Y’ shape by treating with USER enzyme and DNA fragments were purified with 0.8X volume of Agencourt AMPure XP beads (Beckman Coulter #A63880). Adaptor-ligated DNA was PCR amplified for 8 cycles followed by AMPure XP bead clean up. Libraries were quantified with Qubit dsDNA HS Kit (ThermoFisher Scientific #Q32854) and the size distribution was confirmed with High Sensitivity DNA Kit for Bioanalyzer (Agilent Technologies #5067–4626). Library quality and quantity were assessed with Qubit 2.0 DNA HS Assay (ThermoFisher), Tapestation High Sensitivity D1000 Assay (Agilent Technologies), and QuantStudio ® 5 System (Applied Biosystems). Equimolar pooling of libraries was performed based on qPCR values and loaded onto Illumina Hiseq 2×150bp format. Sequencing quality of RNA-Seq libraries (assessed by FastQCv0.11.3), sequence alignment (determined using STAR version 2.7.1a), gene expression (calculated with feature Counts version 1.6.0), and differential gene expression analysis using DEseq2 (version 1.22.2) initial analysis was performed by Admera Health. Upregulated or downregulated genes in CD8+ T cells comparing SP vs IV+, SP vs IV–, or IV+ vs IV– were identified by requiring ≥1.5-fold expression changes and P value of <0.1. Visualization of differentially expressed genes represented as heat maps were generated using standardize function of normalized counts in excel from DEseq2 analysis and graphed using graphpad prism.
Intravital two-photon microscopy
Intravital imaging of the CNS was performed using an adapted protocol55, 56. In brief, mice were injected with intravascular dye (200 μl of 0.1% Evans blue) and 10 μg anti-Thy1.1 PE where noted prior to being anesthetized IP with avertin (400 μl/20 g). Mice were monitored for movement pedal reflex (toe pinch) to ensure unresponsiveness and were monitored throughout the surgery and imaging process and given additional anesthetic as needed. Ophthalmic ointment (artificial tears, Akorn Animal Health) are applied to both eyes to prevent corneal desiccation. The anesthetized mouse was positioned on a stage (SG-4N, head holder for mice, Narishige) where the ear bars and nose clamp are tightened to prevent movement of the head. Mouse temperature was maintained by use of heating pad during surgery. Hair was removed from the top of skull and the area was cleaned with 70% ethanol prior to incisions. Residual hair was removed from the skull via sterile q-tips. An outline of the window area (approximately 5 mm in diameter) lateral to the midline was performed and using light pressure the skull was slowly thinned to ~ 20–30 microns using a low speed drill and burr bit (Fine Science Tools, 19008–09). A micro surgical blade (Surgistar, 6961) was used to smooth out areas as needed.
Mice were positioned in a temperature controlled environmental chamber at 37 °C and were imaged using Leica SP8 Laser Scanning Microscope with Non-linear Optics equipped with an 8,000-Hz resonant scanner, a 25× motor collar-corrected dipping objective (1.0NA), an InSight DeepSee tunable laser (Spectra-Physics) tuned to 940nm (for eGFP, Evans blue, PE, and secondary harmonic generation (SHG)), a quad HyD external detector array equipped with SP565 beam splitter detecting SHG (435–485nm), eGFP (500–550nm), Evans blue (665–705nm), and PE (565–605nm). Time-lapsed three-dimensional images were collected using a 2 μm z-step size with 20–40 sec/stack for z-stack sizes of approximately 60–100 μm.
Two-photon image analysis
Three-dimensional time-lapsed z-stacks were imported into Imaris (version 9.1) software for analysis. eGFP+ OT-I and Thy1.1+ OT-I cellular dynamics were determined using the spots function. For experiments with both eGFP and Thy1.1PE, a colocalization channel was made for the double positive cells. Cells were followed individually to ensure correct tracking and drift correction was used as needed. A surface object was created to form the blood vessels. Cellular dynamics were determined to be inside or outside the blood vessels based on whether they were masked by the vessel surface object. Average speed was calculated based on total track length. Arrest coefficient was calculated based on the proportion of time the cell was moving at less than 2 μm/min, with 1 being completely arrested and 0 indicating cell is always moving faster than 2 μm/min.
Statistical analysis
All statistical analyses were performed using graphpad prism (version 8.0). Where appropriate, two-tailed unpaired student t-tests or Mann-Whitney tests were performed comparing two groups, and One-way ANOVA used to compare more than two groups with Tukey’s multiple comparisons test identify significance between each group. Individual P values are provided in figure legends.
Reporting Summary
Additional information regarding research design is available in the Life Science Reporting Summary linked to this article.
Data Availability
The raw flow cytometric data that support the findings in SPADE analyses in Figures 2, 3 and 5, are available from corresponding author upon request. Source data for figures are provided with the paper. The RNA-Sequencing data are deposited at the GEO with accessing number GSE146077.
Extended Data
Extended Data Fig. 1.
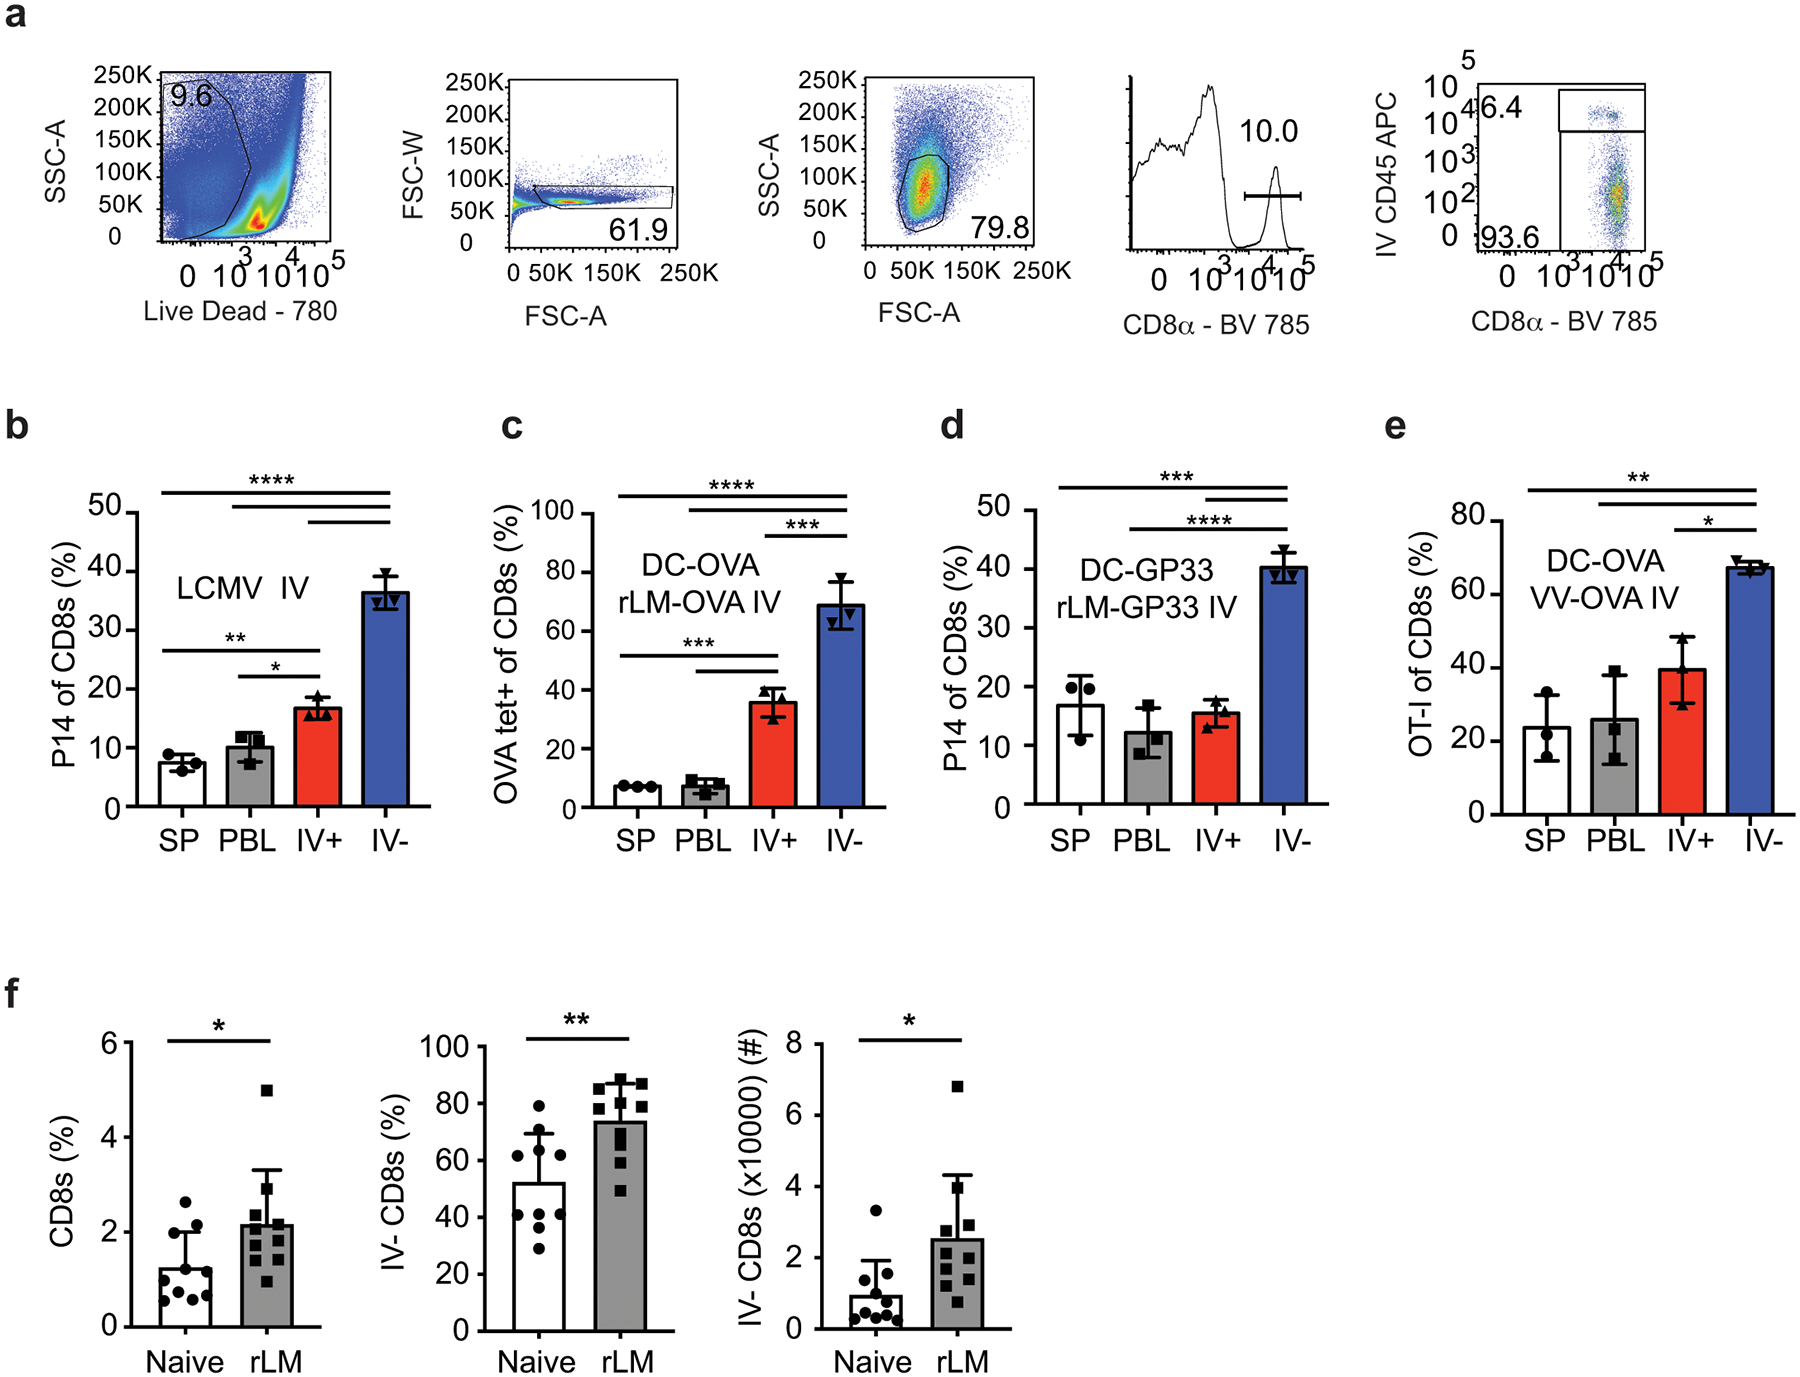
Enrichment of antigen specific CD8+ T-cells in the CNS after peripheral immunizations
Extended Data Fig. 2.
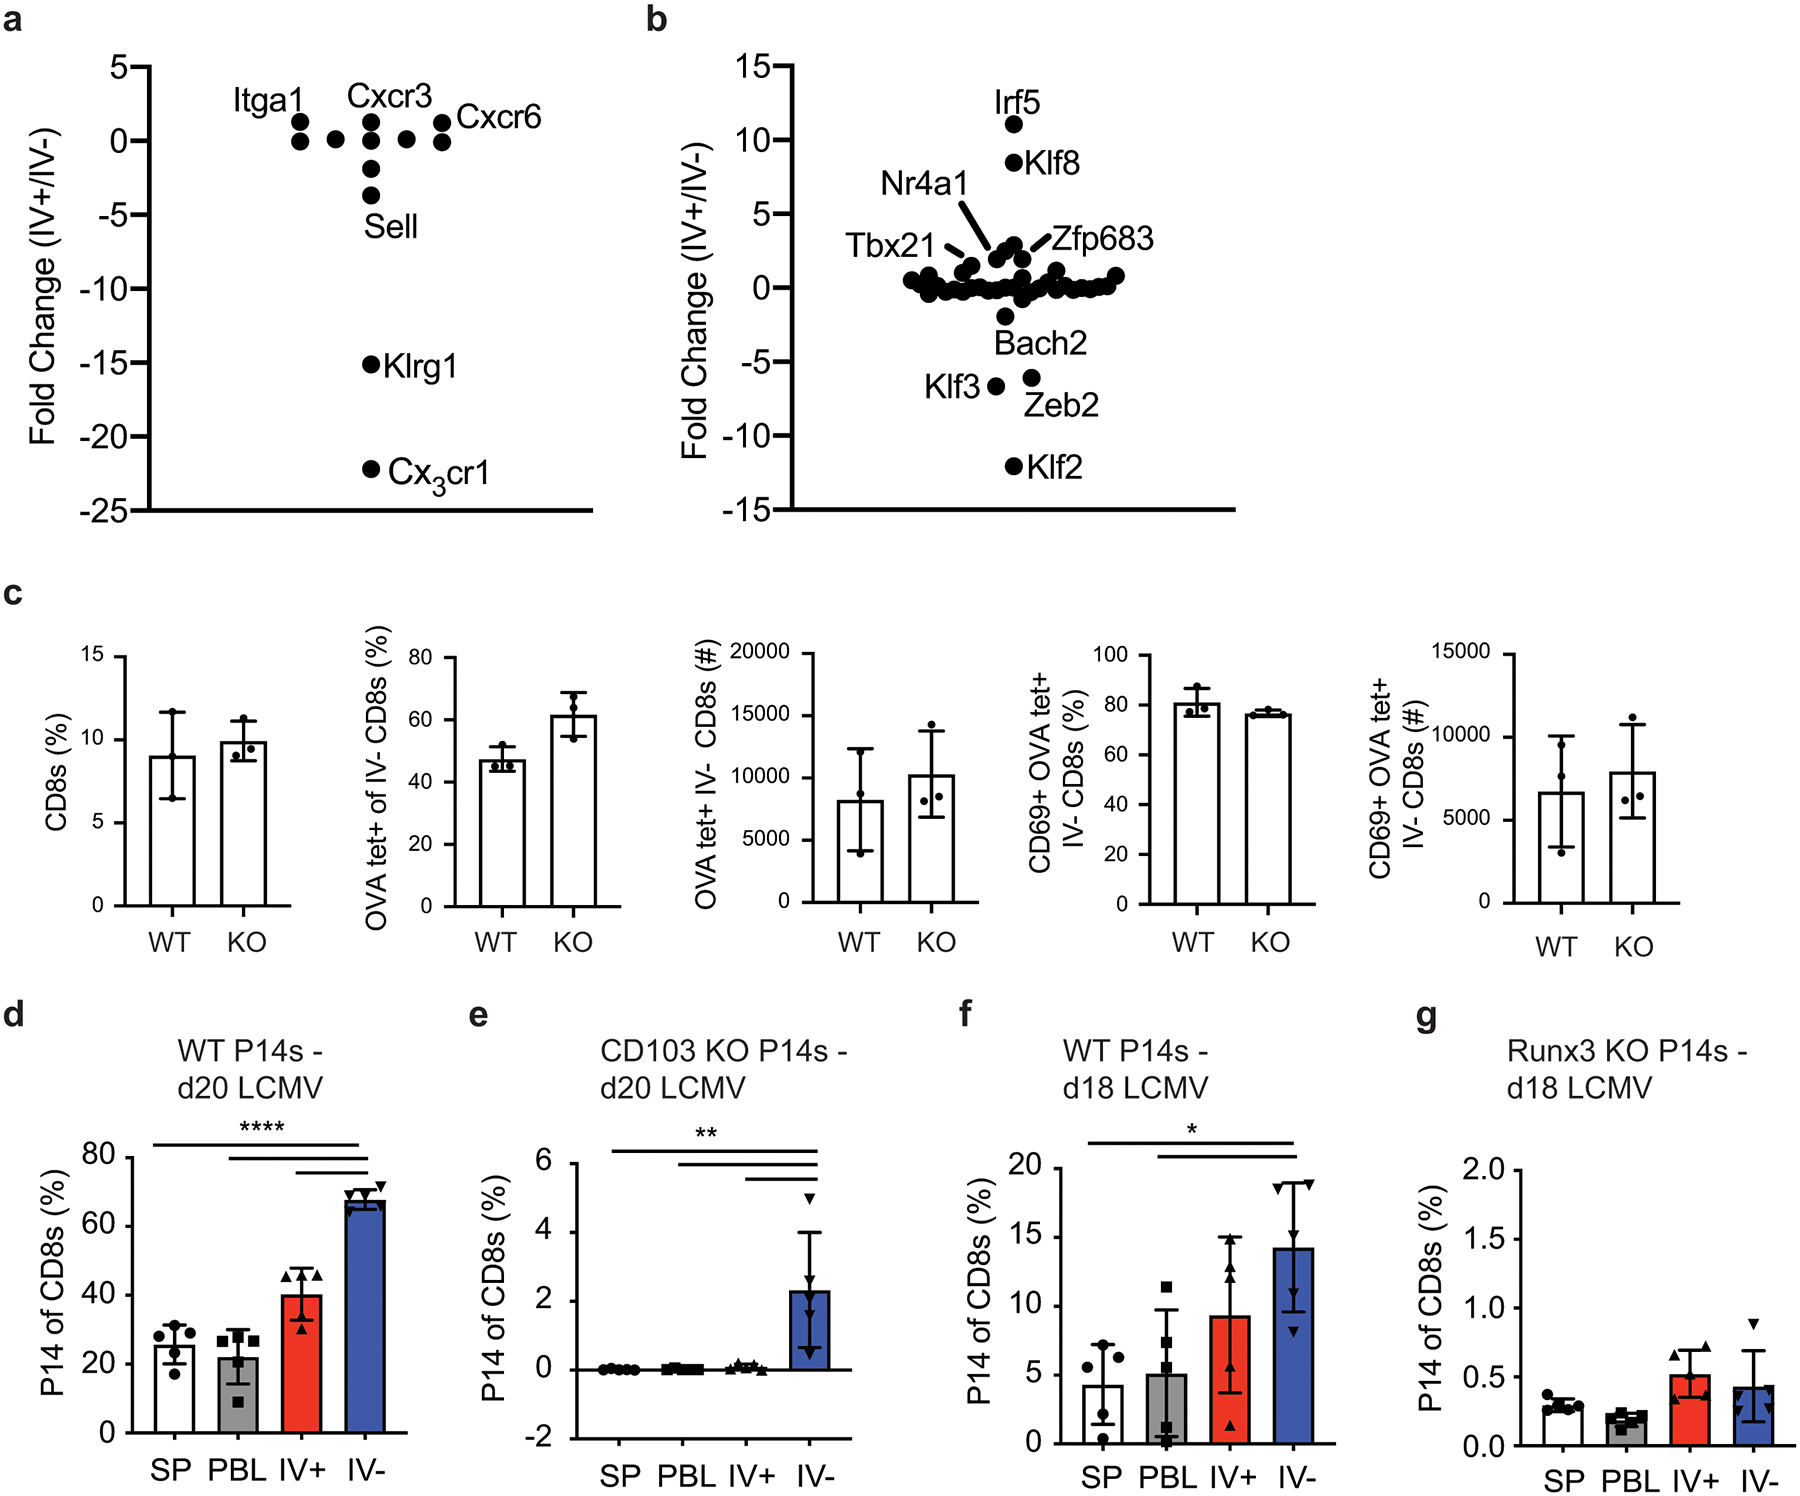
Runx3 but not CD103 are required for generation of peripherally induced CNS Trm cells
Extended Data Fig. 3.
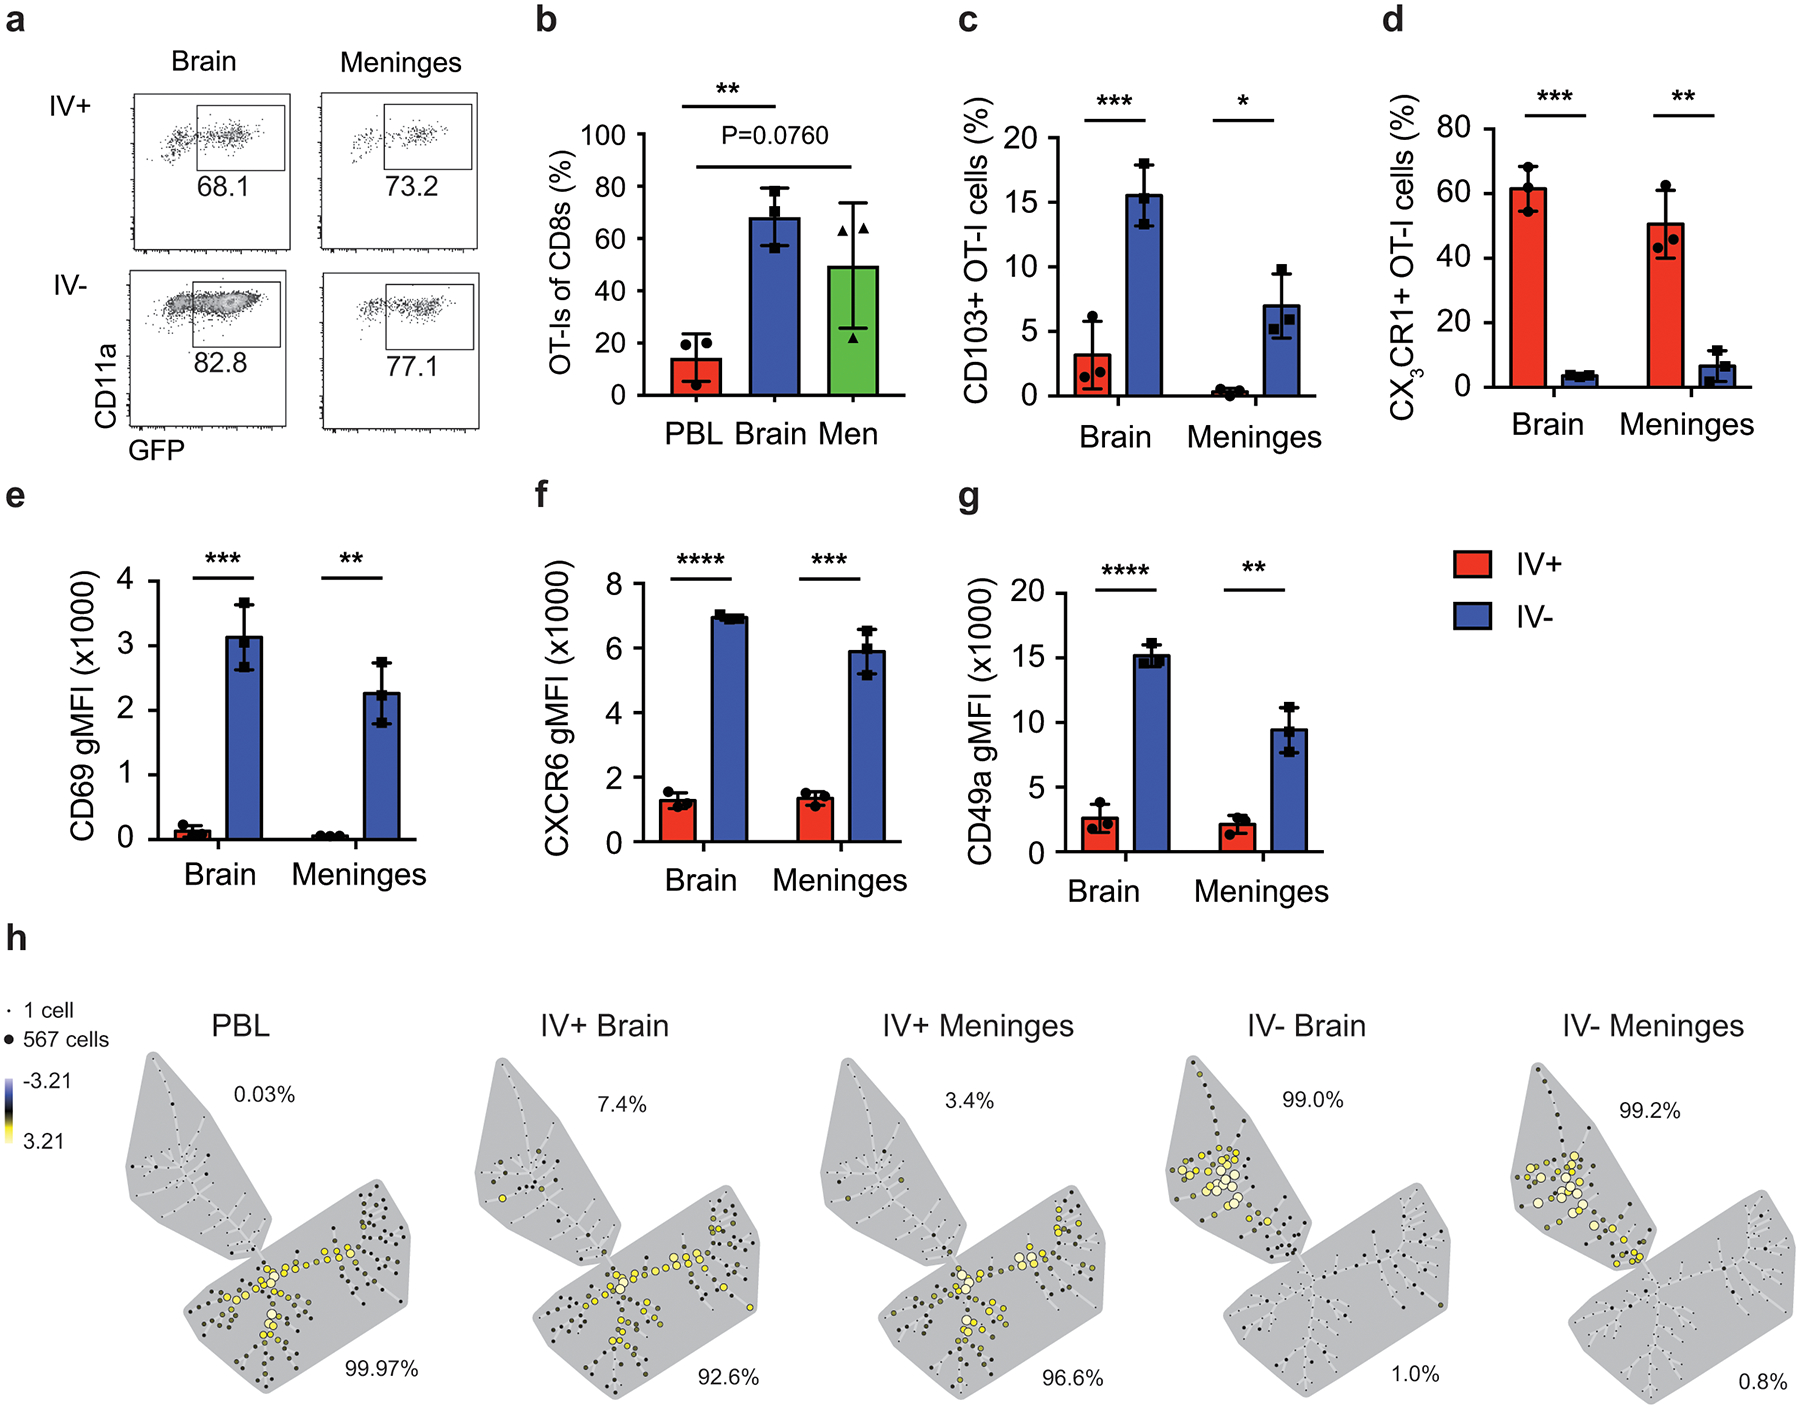
Increased representation of antigen specific CD8+ T-cells after peripheral immunizations is CNS specific
Extended Data Fig. 4.
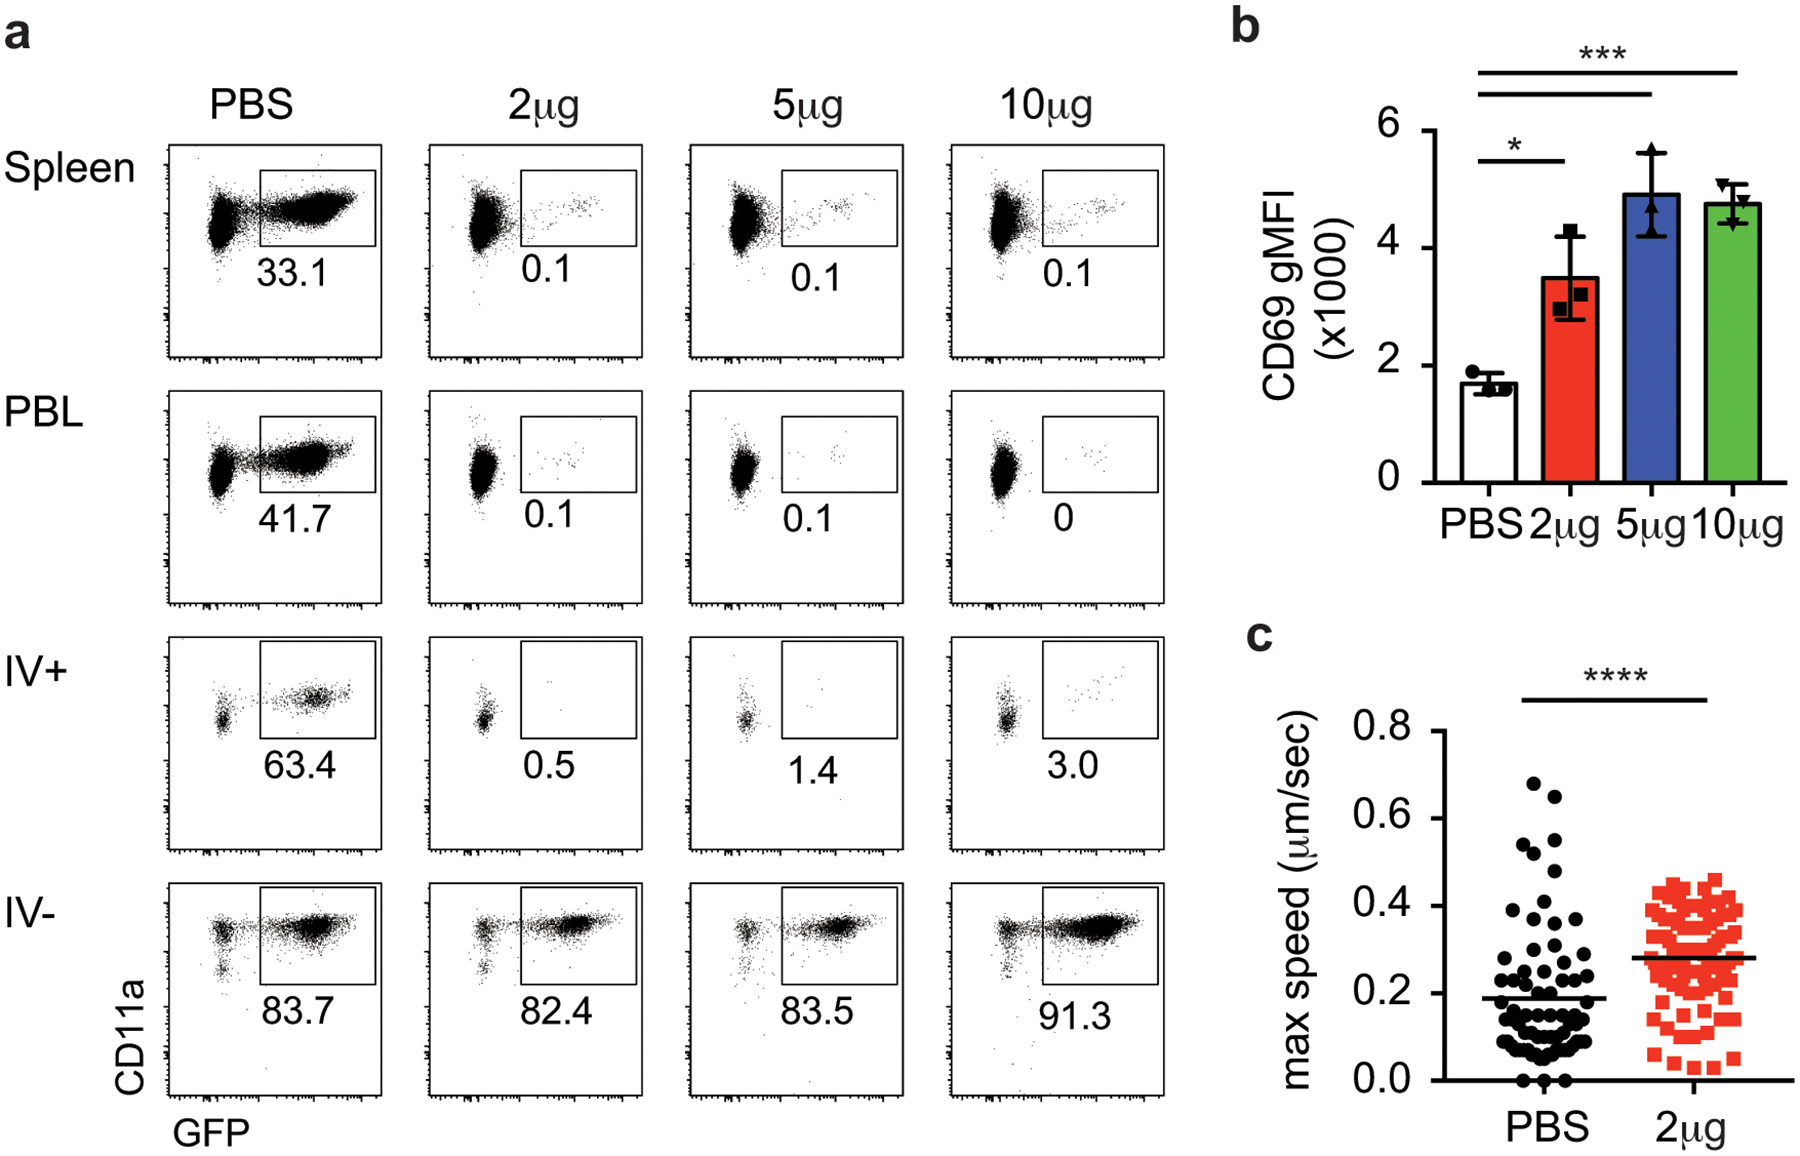
Peripherally induced CNS Trm cells are resistant to systemic depletion
Extended Data Fig. 5.
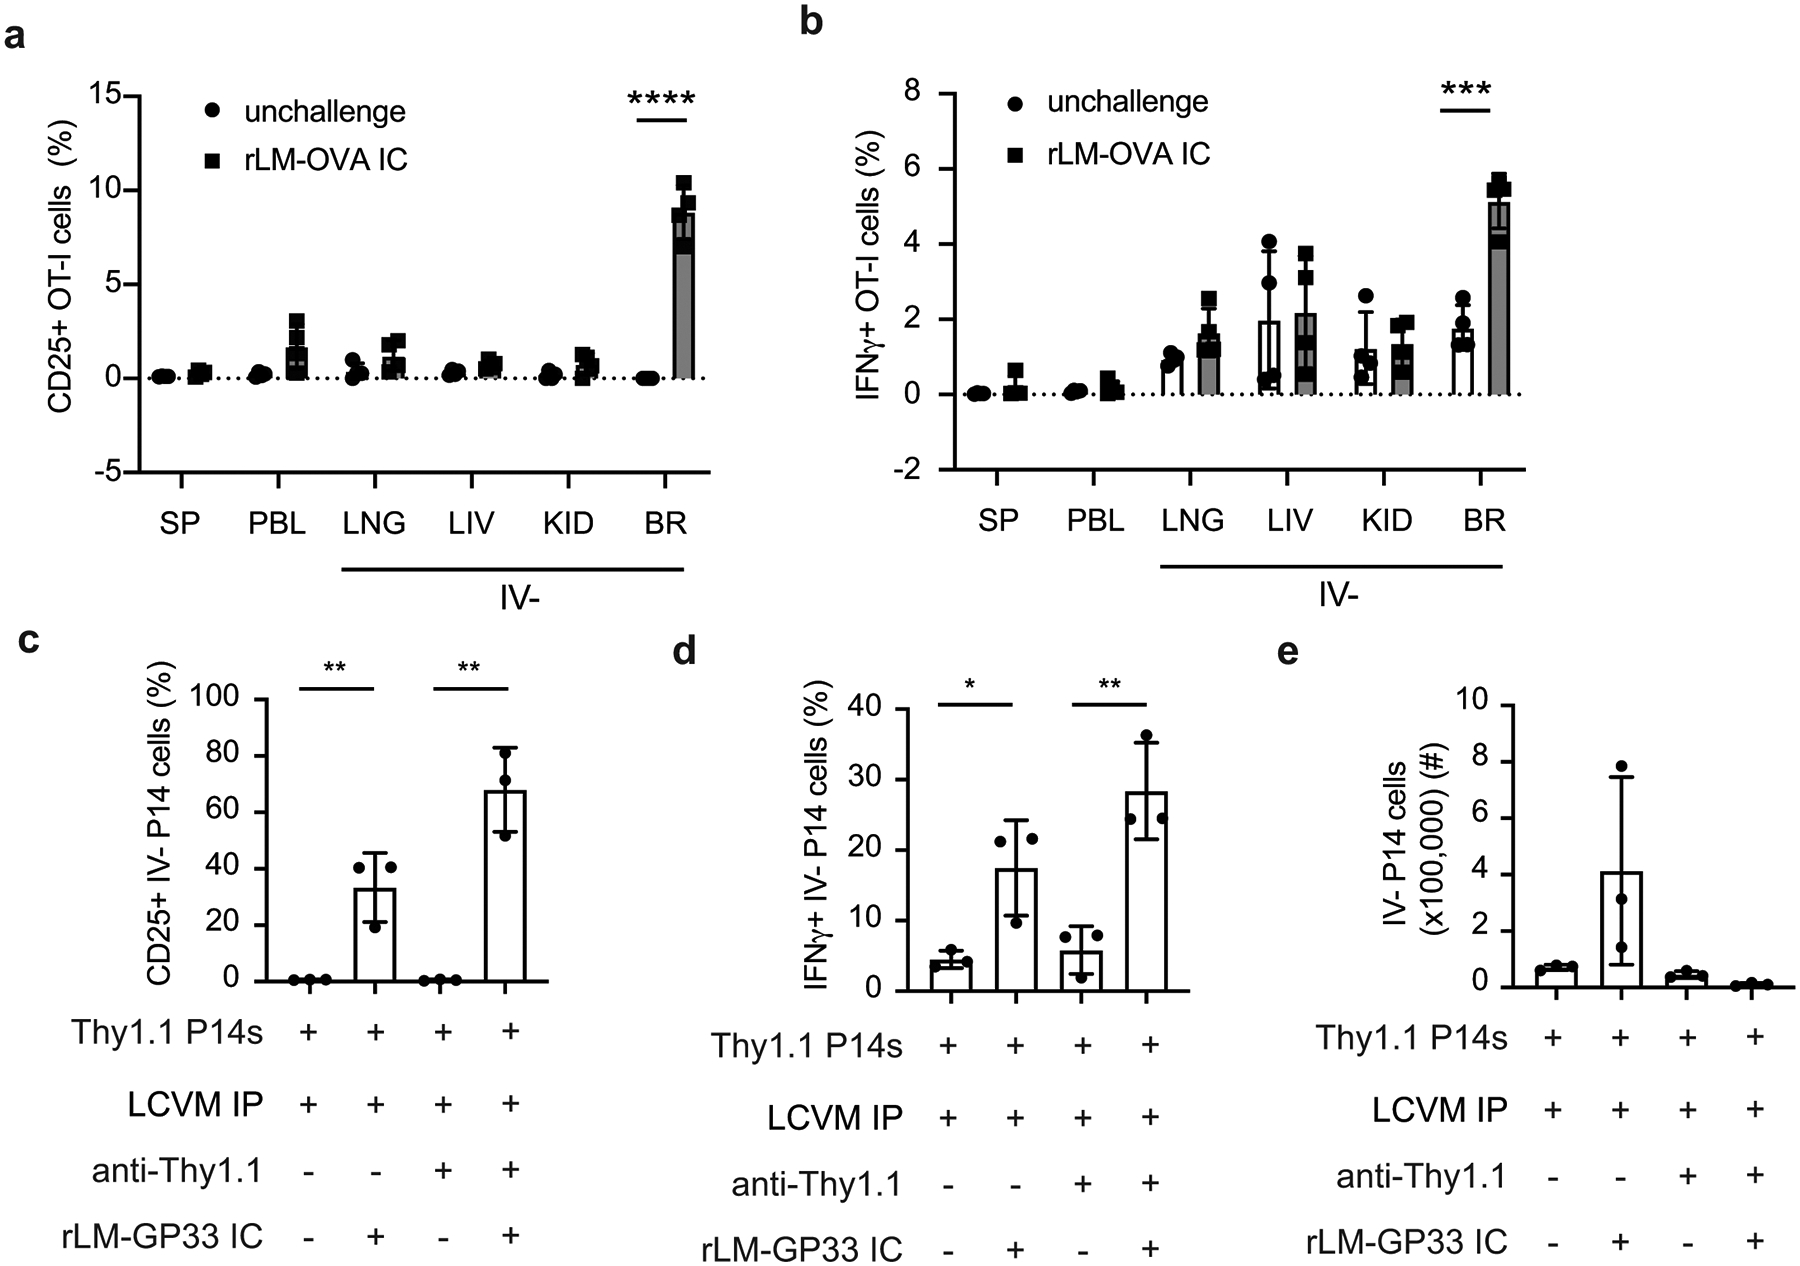
Enhanced recall response of peripherally induced brain Trm cells is specific to CNS
Extended Data Fig. 6.
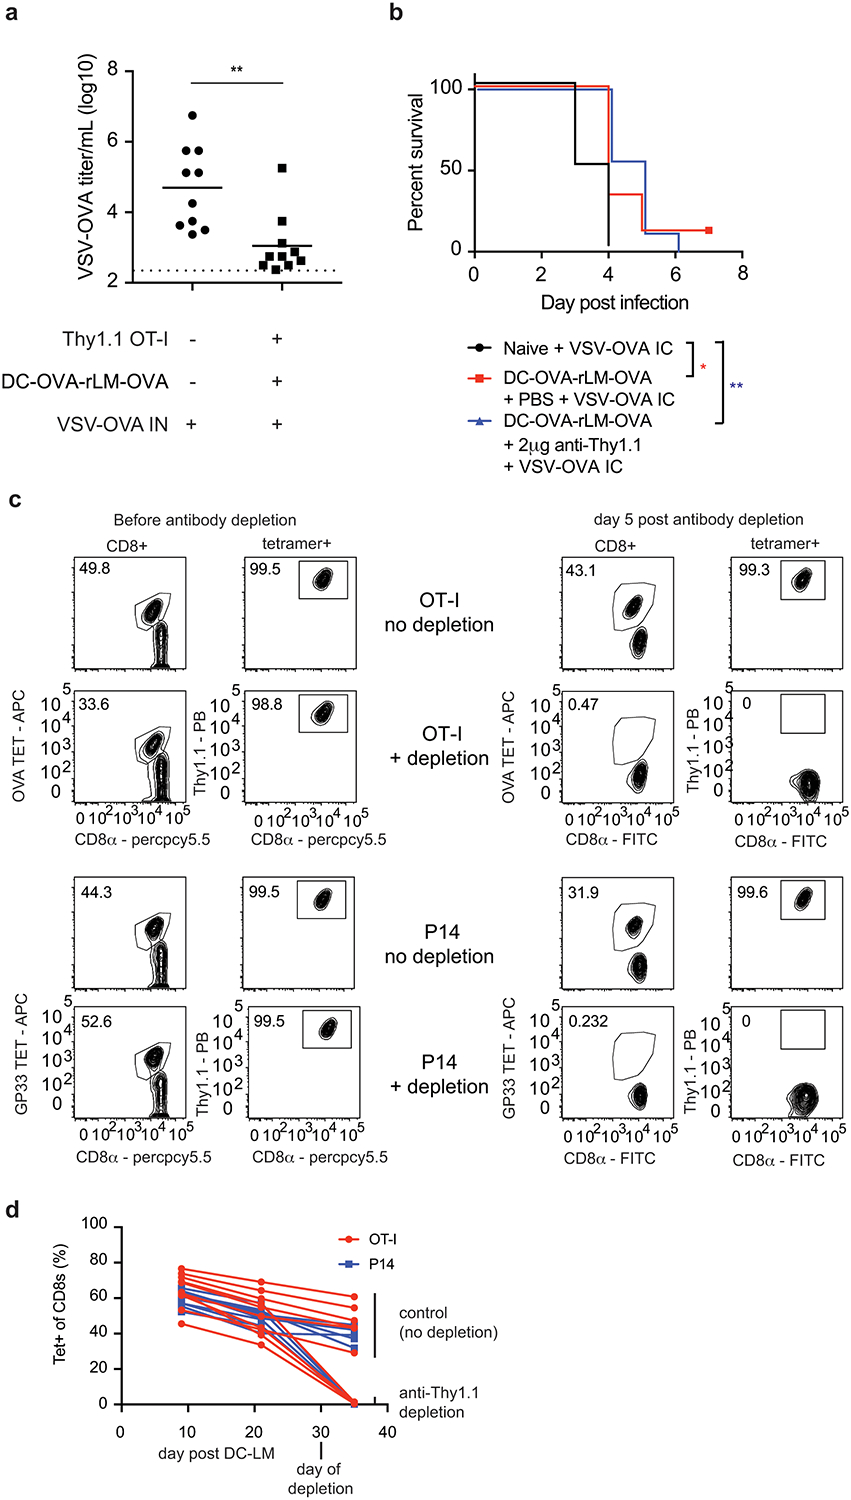
Peripherally induced brain resident CD8+ T-cells mediate protection against CNS infections
Supplementary Material
Acknowledgements
We thank S. Perlman for critical review and comments on the manuscript and S. Anthony for helpful discussion. We thank J. Fishbaugh, H. Vignes and M. Shey (University of Iowa Flow Cytometry Core Facility) for cell sorting, I. Antoshechkin (California Institute of Technology) and Admera health for RNA-Seq. Data herein were obtained from the Flow Cytometry Facility, which is a Carver College of Medicine Core Research Facilities/Holden Comprehensive Cancer Center Core Laboratory at the University of Iowa. This work was supported by grants from the National Institutes of Health (NIH) (AI42767 to J.T.H., AI114543 to J.T.H and V.P.B., GM134880 to V.P.B., AI121080 and AI139874 to H.-H.X., T32 AI007343 to S.L.U., and T32 AI007511 to I.J.J.) and the Veteran Affairs BLR&D Merit Review Program (BX002903) to H.-H.X.
Footnotes
Competing Interests
Authors declare no competing interests.
References
- 1.Louveau A, Harris TH & Kipnis J Revisiting the Mechanisms of CNS Immune Privilege. Trends in Immunol. 36, 569–577 (2015). [DOI] [PMC free article] [PubMed] [Google Scholar]
- 2.Korn T & Kallies A T cell responses in the central nervous system. Nat. Rev. Immunol 17, 179–194 (2017). [DOI] [PubMed] [Google Scholar]
- 3.Manglani M & McGavern DB New advances in CNS immunity against viral infection. Curr. Opin. in Virol 28, 116–126 (2018). [DOI] [PMC free article] [PubMed] [Google Scholar]
- 4.Aspelund A et al. A dural lymphatic vascular system that drains brain interstitial fluid and macromolecules. J. Exp. Med 212, 991–999 (2015). [DOI] [PMC free article] [PubMed] [Google Scholar]
- 5.Louveau A et al. Structural and functional features of central nervous system lymphatic vessels. Nature 523, 337–341 (2015). [DOI] [PMC free article] [PubMed] [Google Scholar]
- 6.Kipnis J Multifaceted interactions between adaptive immunity and the central nervous system. Science 353, 766–771 (2016). [DOI] [PMC free article] [PubMed] [Google Scholar]
- 7.Harty JT & Badovinac VP Shaping and reshaping CD8+ T-cell memory. Nat. Rev. Immunol 8, 107–119 (2008). [DOI] [PubMed] [Google Scholar]
- 8.Martin MD & Badovinac VP Defining Memory CD8 T Cell. Front. Immunol 9, 2692 (2018). [DOI] [PMC free article] [PubMed] [Google Scholar]
- 9.Schenkel JM, Fraser KA, Vezys V & Masopust D Sensing and alarm function of resident memory CD8+ T cells. Nat. Immunol 14, 509–513 (2013). [DOI] [PMC free article] [PubMed] [Google Scholar]
- 10.Slütter B et al. Dynamics of influenza-induced lung-resident memory T cells underlie waning heterosubtypic immunity. Sci. Immunol 2, 7 (2017). [DOI] [PMC free article] [PubMed] [Google Scholar]
- 11.Steinbach K, Vincenti I & Merkler D Resident-Memory T Cells in Tissue-Restricted Immune Responses: For Better or Worse? Front. Immunol 9, 2827 (2018). [DOI] [PMC free article] [PubMed] [Google Scholar]
- 12.Welten SPM, Sandu I, Baumann NS & Oxenius A Memory CD8 T cell inflation vs tissue-resident memory T cells: Same patrollers, same controllers? Immunol. Rev 283, 161–175 (2018). [DOI] [PubMed] [Google Scholar]
- 13.Griffin DE & Metcalf T Clearance of virus infection from the CNS. Curr. Opin. Virol 1, 216–221 (2011). [DOI] [PMC free article] [PubMed] [Google Scholar]
- 14.Wakim LM, Woodward-Davis A & Bevan MJ Memory T cells persisting within the brain after local infection show functional adaptations to their tissue of residence. Proc. Nat. Acad. Sci 107, 17872–17879 (2010). [DOI] [PMC free article] [PubMed] [Google Scholar]
- 15.Landrith TA et al. CD103+ CD8 T Cells in the Toxoplasma-Infected Brain Exhibit a Tissue-Resident Memory Transcriptional Profile. Front. Immunol 8, 335 (2017). [DOI] [PMC free article] [PubMed] [Google Scholar]
- 16.Wakim LM et al. The Molecular Signature of Tissue Resident Memory CD8 T Cells Isolated from the Brain. J. Immunol 189, 3462–3471 (2012). [DOI] [PMC free article] [PubMed] [Google Scholar]
- 17.Steinbach K et al. Brain-resident memory T cells represent an autonomous cytotoxic barrier to viral infection. J. Exp. Med 213, 1571–1587 (2016). [DOI] [PMC free article] [PubMed] [Google Scholar]
- 18.Frost EL, Kersh AE, Evavold BD & Lukacher AE Cutting Edge: Resident Memory CD8 T Cells Express High-Affinity TCRs. J. Immunol 195, 3520–3524 (2015). [DOI] [PMC free article] [PubMed] [Google Scholar]
- 19.Maru S, Jin G, Schell TD & Lukacher AE TCR stimulation strength is inversely associated with establishment of functional brain-resident memory CD8 T cells during persistent viral infection. PLOS Pathog. 13, e1006318 (2017). [DOI] [PMC free article] [PubMed] [Google Scholar]
- 20.Mockus TE et al. CD4 T cells control development and maintenance of brain-resident CD8 T cells during polyomavirus infection. PLOS Pathog. 14, e1007365 (2018). [DOI] [PMC free article] [PubMed] [Google Scholar]
- 21.Prasad S, Hu S, Sheng WS, Chauhan P & Lokensgard JR Reactive glia promote development of CD103(+) CD69(+) CD8(+) T-cells through programmed cell death-ligand 1 (PD-L1). Immunity, inflamm. Dis 6, 332–344 (2018). [DOI] [PMC free article] [PubMed] [Google Scholar]
- 22.Prasad S et al. The PD-1: PD-L1 pathway promotes development of brain-resident memory T cells following acute viral encephalitis. J. Neuroinflam 14, 82 (2017). [DOI] [PMC free article] [PubMed] [Google Scholar]
- 23.Smolders J et al. Tissue-resident memory T cells populate the human brain. Nat. Comm 9, 4593 (2018). [DOI] [PMC free article] [PubMed] [Google Scholar]
- 24.Ritzel RM et al. Age-Associated Resident Memory CD8 T Cells in the Central Nervous System Are Primed To Potentiate Inflammation after Ischemic Brain Injury. J. Immunol 196, 3318–3330 (2016). [DOI] [PMC free article] [PubMed] [Google Scholar]
- 25.Dulken BW et al. Single-cell analysis reveals T cell infiltration in old neurogenic niches. Nature 571, 205–210 (2019). [DOI] [PMC free article] [PubMed] [Google Scholar]
- 26.Gate D et al. Clonally expanded CD8 T cells patrol the cerebrospinal fluid in Alzheimer’s disease. Nature 577, 399–404 (2020). [DOI] [PMC free article] [PubMed] [Google Scholar]
- 27.Prasad S & Lokensgard JR Brain-Resident T Cells Following Viral Infection. Viral Immunol. 32, 48–54 (2019). [DOI] [PMC free article] [PubMed] [Google Scholar]
- 28.Wherry EJ, Blattman JN, Murali-Krishna K, van der Most R & Ahmed R Viral persistence alters CD8 T-cell immunodominance and tissue distribution and results in distinct stages of functional impairment. J. Virol 77, 4911–4927 (2003). [DOI] [PMC free article] [PubMed] [Google Scholar]
- 29.Mackay LK et al. Hobit and Blimp1 instruct a universal transcriptional program of tissue residency in lymphocytes. Science 352, 459–463 (2016). [DOI] [PubMed] [Google Scholar]
- 30.Milner JJ & Goldrath AW Transcriptional programming of tissue-resident memory CD8+ T cells. Curr. Opin. Immunol 51, 162–169 (2018). [DOI] [PMC free article] [PubMed] [Google Scholar]
- 31.Topham DJ & Reilly EC Tissue-Resident Memory CD8+ T Cells: From Phenotype to Function. Front. Immunol 9, 515 (2018). [DOI] [PMC free article] [PubMed] [Google Scholar]
- 32.Milner JJ et al. Runx3 programs CD8+ T cell residency in non-lymphoid tissues and tumours. Nature 552, 253–257 (2017). [DOI] [PMC free article] [PubMed] [Google Scholar]
- 33.Cheuk S et al. CD49a Expression Defines Tissue-Resident CD8+ T Cells Poised for Cytotoxic Function in Human Skin. Immunity 46, 287–300 (2017). [DOI] [PMC free article] [PubMed] [Google Scholar]
- 34.Behr FM, Chuwonpad A, Stark R & van Gisbergen KPJM Armed and Ready: Transcriptional Regulation of Tissue-Resident Memory CD8 T Cells. Front. Immunol 9, 1770 (2018). [DOI] [PMC free article] [PubMed] [Google Scholar]
- 35.Mackay LK & Kallies A Transcriptional Regulation of Tissue-Resident Lymphocytes. Trends in Immunol. 38, 94–103 (2017). [DOI] [PubMed] [Google Scholar]
- 36.Masopust D & Soerens AG Tissue-Resident T Cells and Other Resident Leukocytes. Ann. Rev. Immunol 37, 521–546 (2019). [DOI] [PMC free article] [PubMed] [Google Scholar]
- 37.McNamara HA et al. Up-regulation of LFA-1 allows liver-resident memory T cells to patrol and remain in the hepatic sinusoids. Sci. Immunol 2, 9 (2017). [DOI] [PMC free article] [PubMed] [Google Scholar]
- 38.Mackay LK et al. The developmental pathway for CD103+CD8+ tissue-resident memory T cells of skin. Nat. Immunol 14, 1294–1301 (2013). [DOI] [PubMed] [Google Scholar]
- 39.Tse S-W, Radtke AJ, Espinosa DA, Cockburn IA & Zavala F The Chemokine Receptor CXCR6 Is Required for the Maintenance of Liver Memory CD8+ T Cells Specific for Infectious Pathogens. J. Infect. Dis 210, 1508–1516 (2014). [DOI] [PMC free article] [PubMed] [Google Scholar]
- 40.Gerlach C et al. The Chemokine Receptor CX3CR1 Defines Three Antigen-Experienced CD8 T Cell Subsets with Distinct Roles in Immune Surveillance and Homeostasis. Immunity 45, 1270–1284 (2016). [DOI] [PMC free article] [PubMed] [Google Scholar]
- 41.Obar JJ et al. Pathogen-Induced Inflammatory Environment Controls Effector and Memory CD8+ T Cell Differentiation. J. Immunol 187, 4967–4978 (2011). [DOI] [PMC free article] [PubMed] [Google Scholar]
- 42.Mueller SN et al. Qualitatively Different Memory CD8+ T Cells Are Generated after Lymphocytic Choriomeningitis Virus and Influenza Virus Infections. J. Immunol 185, 2182–2190 (2010). [DOI] [PubMed] [Google Scholar]
- 43.Martin M et al. Phenotypic and Functional Alterations in Circulating Memory CD8 T Cells with Time after Primary Infection. PLOS pathog. 11, e1005219 (2015). [DOI] [PMC free article] [PubMed] [Google Scholar]
- 44.Gebhardt T et al. Different patterns of peripheral migration by memory CD4+ and CD8+ T cells. Nature 477, 216–219 (2011). [DOI] [PubMed] [Google Scholar]
- 45.Beura LK et al. Intravital mucosal imaging of CD8+ resident memory T cells shows tissue-autonomous recall responses that amplify secondary memory. Nat. Immunol 19, 173–182 (2018). [DOI] [PMC free article] [PubMed] [Google Scholar]
- 46.Schenkel JM et al. Resident memory CD8 T cells trigger protective innate and adaptive immune responses. Science 346, 98–101 (2014). [DOI] [PMC free article] [PubMed] [Google Scholar]
- 47.Baenziger J, Hengartner H, Zinkernagel RM & Cole GA Induction or prevention of immunopathological disease by cloned cytotoxic T cell lines specific for lymphocytic choriomeningitis virus. Eur. J. Immunol 16, 387–393 (1986). [DOI] [PubMed] [Google Scholar]
- 48.Petito CK & Adkins B Choroid plexus selectively accumulates T-lymphocytes in normal controls and after peripheral immune activation. J. Neuroimmunol 162, 19–27 (2005). [DOI] [PubMed] [Google Scholar]
- 49.Mueller SN & Mackay LK Tissue-resident memory T cells: local specialists in immune defence. Nat. Rev. Immunol 16, 79–89 (2015). [DOI] [PubMed] [Google Scholar]
- 50.Ludwig A & Mentlein R Glial cross-talk by transmembrane chemokines CX3CL1 and CXCL16. J. Neuroimmunol 198, 92–97 (2008). [DOI] [PubMed] [Google Scholar]
- 51.Shan Q et al. The transcription factor Runx3 guards cytotoxic CD8+ effector T cells against deviation towards follicular helper T cell lineage. Nat. Immunol 18, 931–939 (2017). [DOI] [PMC free article] [PubMed] [Google Scholar]
- 52.Badovinac VP, Messingham KAN, Jabbari A, Haring JS & Harty JT Accelerated CD8+ T-cell memory and prime-boost response after dendritic-cell vaccination. Nat. Med 11, 748–756 (2005). [DOI] [PubMed] [Google Scholar]
- 53.Manglani M, Gossa S & McGavern DB Leukocyte Isolation from Brain, Spinal Cord, and Meninges for Flow Cytometric Analysis. Curr. Prot. Immunol 121, e44–e44 (2018). [DOI] [PMC free article] [PubMed] [Google Scholar]
- 54.Bendall SC et al. Single-Cell Mass Cytometry of Differential Immune and Drug Responses Across a Human Hematopoietic Continuum. Science 332, 687–696 (2011).21551058 [Google Scholar]
- 55.Manglani M & McGavern DB Intravital Imaging of Neuroimmune Interactions Through a Thinned Skull. Curr. Prot. Immunol 120, 24.22.21–24.22.12 (2018). [DOI] [PMC free article] [PubMed] [Google Scholar]
- 56.Hickman HD Imaging CD8+ T cells during diverse viral infections IntraVital 4, e1055425 (2015). [DOI] [PMC free article] [PubMed] [Google Scholar]
Associated Data
This section collects any data citations, data availability statements, or supplementary materials included in this article.
Supplementary Materials
Data Availability Statement
The raw flow cytometric data that support the findings in SPADE analyses in Figures 2, 3 and 5, are available from corresponding author upon request. Source data for figures are provided with the paper. The RNA-Sequencing data are deposited at the GEO with accessing number GSE146077.


