Abstract
Bacterial lipopolysaccharide triggers human caspase-4 (murine caspase-11) to cleave gasdermin-D and induce pyroptotic cell death. How lipopolysaccharide sequestered in membranes of cytosol-invading bacteria activates caspases remains unknown. Here we show that in interferon-γ stimulated cells guanylate binding proteins (GBPs) assemble on the surface of Gram-negative bacteria into polyvalent signaling platforms required for activation of caspase-4. Caspase-4 activation is hierarchically controlled by GBPs; GBP1 initiates platform assembly, GBP2 and GBP4 control caspase-4 recruitment, whereas GBP3 governs caspase-4 activation. In response to cytosol-invading bacteria, activation of caspase-4 through the GBP platform is essential to induce gasdermin-D dependent pyroptosis and processing of interleukin-18, thereby destroying the replicative niche for intracellular bacteria and alerting neighboring cells, respectively. Caspase-11 and GBPs epistatically protect mice against lethal bacterial challenge. Multiple antagonists of the pathway encoded by Shigella flexneri, a cytosol-adapted bacterium, provide compelling evolutionary evidence for the importance of the GBP-Caspase-4 pathway in anti-bacterial defense.
Lipopolysaccharide (LPS), a major constituent of the outer membrane of Gram-negative bacteria, triggers strong protective immune responses. In addition, systemic LPS exposure can cause septic shock, one of the most common causes of death in developed countries, whose mortality remains high, despite recent advances in critical care medicine. Two separate pathways contribute to the detection of LPS in mammals. In the extracellular environment LPS is sensed by MD2 in complex with Toll-like receptor 4 (TLR4)1–3, whereas in the cytosol LPS is detected by a non-canonical inflammasome comprised of Caspase-4 (CASP4) or CASP5 in humans and CASP11 in mice4–6. LPS-induced activation of non-canonical inflammasomes triggers pyroptotic cell death and cytokine release through cleavage of GasderminD (GSDMD), a latent pore forming protein, in a process critical for protection against cytosol-invading bacteria as well as the induction of endotoxin shock 7–10.
Canonical inflammasome activation requires the assembly of dedicated protein arrays comprised of pro-caspase-1, the adaptor protein Asc (apoptosis-associated speck-like protein containing a caspase recruitment domain) and one of several cytosolic pattern recognition receptors11. In contrast, as demonstrated in reconstitution experiments in vitro, CASP4 and CASP11 can be activated directly through binding of the hydrophobic lipid A portion of LPS to their N-terminal CARD domains, i.e. without the need for adaptor proteins or receptors12. However, in vivo additional machinery may be required for CASP4 activation in response to cytosol-invading bacteria, where the lipid A moiety as an integral component of the bacterial membrane may not be readily accessible as a ligand for CASP4.
Interferons promote CASP4 (Casp11) responses through upregulation of gene expression, including GTPases of the GBP and IRGB families13–15, which protect in a cell-autonomous manner against infection with bacteria, parasites and viruses and promote the activation of CASP4 (Casp11) upon transfection of LPS16,17. GBPs were also reported to foster the rupture of Salmonella- (but not Shigella-) containing vacuoles18, to recruit CASP4 to Salmonella-containing vacuoles19, and to impair the structural integrity of bacteria in murine cells through the downstream action of Irgb1020. However, neither pathogen-specific vacuolar rupture nor Irgb10-dependent bacterial attack sufficiently explain the role of GBPs in pyroptosis, particularly in human cells, which lack genes for most IRGB family members21. Here we report that in cells stimulated with IFN-γ, GBPs assembly on the surface of S. Typhimurium and S. flexneri into polyvalent signaling platforms required for the activation of CASP4. Platform assembly, CASP4 recruitment and CASP4 activation are controlled hierarchically by specific GBPs. The GBP-dependent transformation of the bacterial surface into a polyvalent caspase activation platform induces pyroptosis and processing of IL-18, thereby destroying the bacterial niche and alerting neighbouring cells.
IFN-γ prevents proliferation of cytosol-invading Salmonella enterica Typhimurium
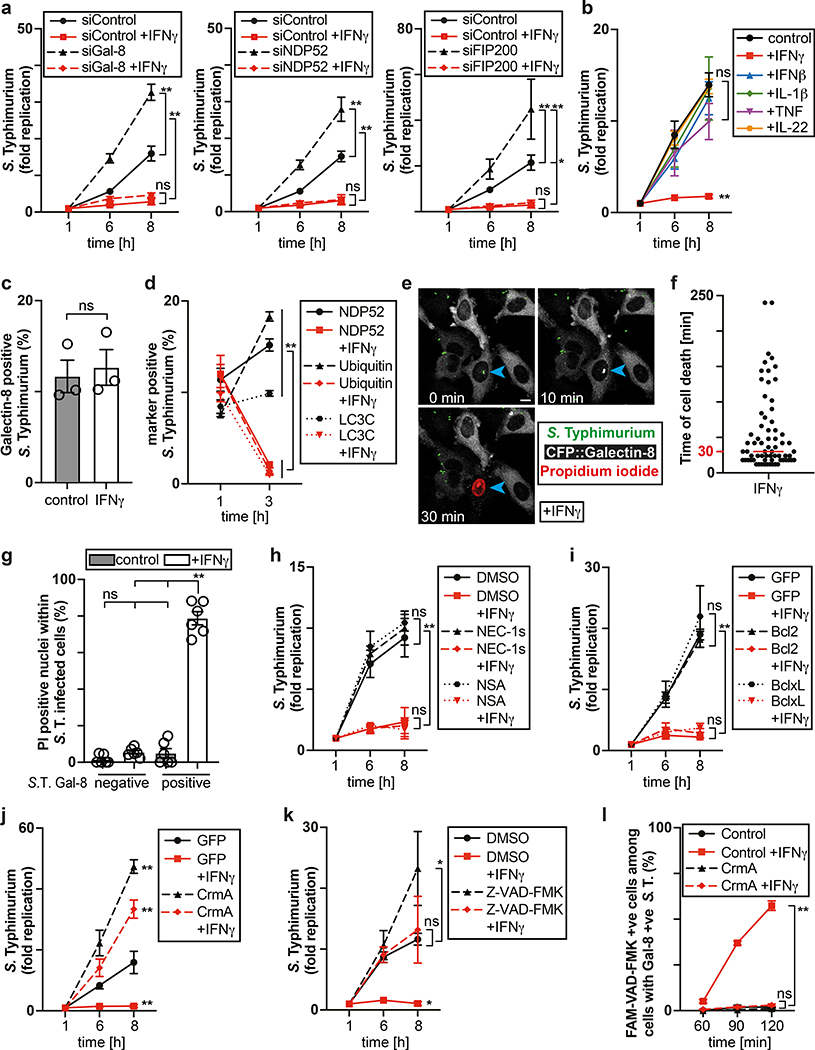
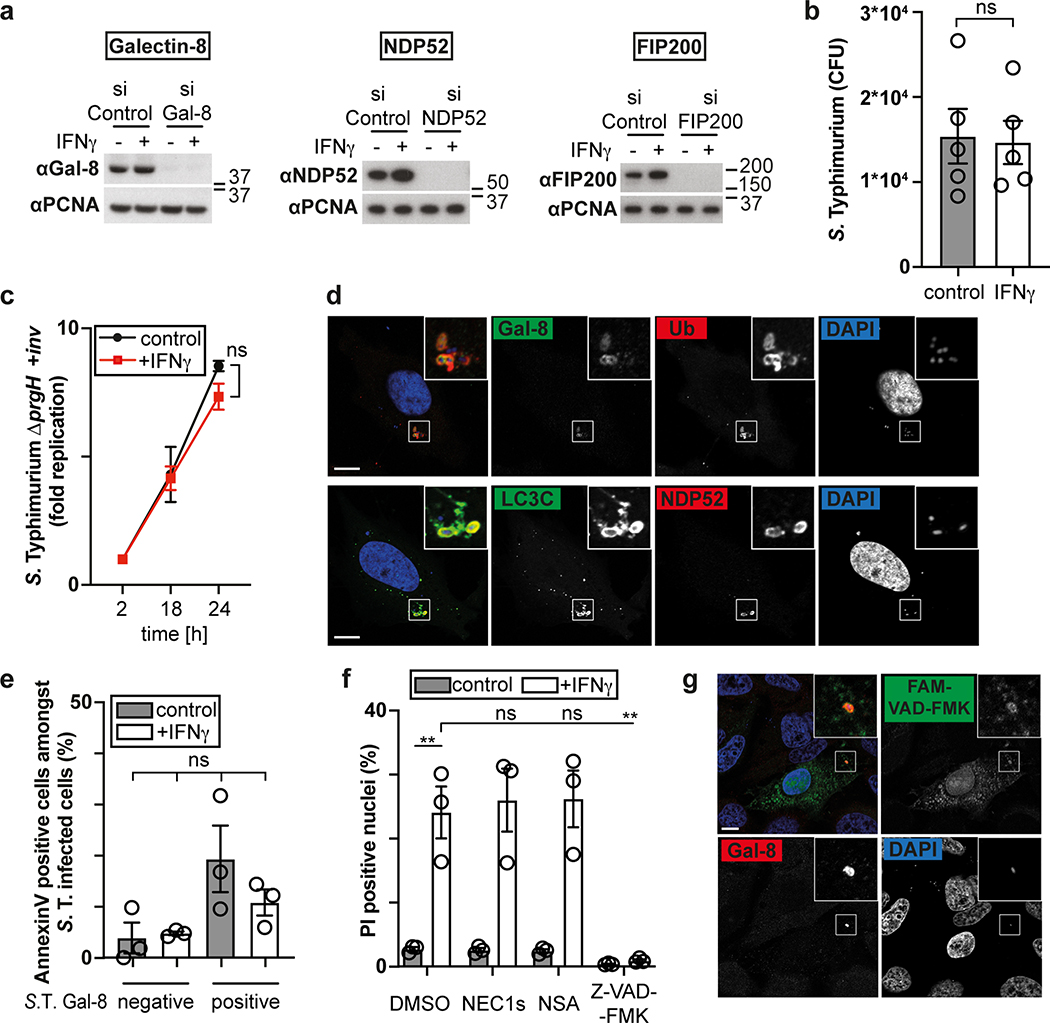
The cytosol of mammalian cells is protected against bacterial invasion by anti-bacterial autophagy22,23, resulting in heightened proliferation of S. Typhimurium in cells lacking essential components of the pathway, such as the danger receptor Galectin-824, the autophagy cargo receptor NDP5225,26 or FIP20027, a subunit of the autophagy inducing ULK complex (Fig. 1a, Extended Data Fig. 1a). However, anti-bacterial autophagy provides only partial protection against bacterial proliferation (Fig. 1a, Supplementary video1). To investigate whether activated cells mount a stronger response against S. Typhimurium, we treated epithelial cells with interferons and pro-inflammatory cytokines. IFN-γ abrogated replication of S. Typhimurium, even in cells deficient in anti-bacterial autophagy (Fig. 1a). IFN-β, TNF, IL-1β and IL-22 had no such effect (Fig. 1b). We conclude that IFN-γ, in an autophagy-independent manner, renders cells non-permissive for S. Typhimurium proliferation.
Figure 1. IFN-γ prevents proliferation of cytosol-invading S. Typhimurium.
a,b Fold replication of S. Typhimurium in HeLa cells. Cells were treated with siRNAs (a) or cytokines (b) as indicated.
c,d, Percentage of S. Typhimurium positive for YFP::Galectin-8 at 1 h p.i. (c) and endogenous NDP52, ubiquitin (FK2 staining) or GFP::LC3C at 1 and 3 h p.i. in HeLa cells (d). n > 100 (for 1 h p.i.), n > 200 (for 3 h p.i.) bacteria per coverslip, in triplicate.
e-g, Live microscopy of HeLa cells expressing CFP::Galectin-8 and infected with S. Typhimurium in medium containing PI. Frames from Supplementary Video 2 (e), time between recruitment of Galectin-8 to bacteria and nuclei of host cell becoming PI positive (f), percentage of PI positive nuclei among infected cells (g). Imaged every 6 min for 6 h, 12 fields per condition. Blue arrowhead – point of interest. Time p.i. as indicated; scale bar, 10 μm (e). Median in red (f).
h,k, Fold replication of S. Typhimurium in HeLa cells treated with DMSO, 50 μM NEC-1s, 10 μM NSA or 50 μM Z-VAD-FMK as indicated.
i,j, Fold replication of S. Typhimurium in HeLa cells expressing the indicated FLAG-fusion proteins.
l, Percentage of FAM-VAD-FMK positive cells among HeLa cells harbouring S. Typhimurium positive for endogenous Galectin-8 at 90 min p.i.; cells expressing FLAG::CrmA as indicated. n > 100 cells with Galectin-8 +ve bacteria per coverslip, in triplicate.
Statistical significance was assessed by two-tailed unpaired Student’s t-test (c), one-way (g,l) or two-way (a,b,d,h-k) analysis of variance (ANOVA) with Tukey’s multiple comparisons test; ns, not significant, *P < 0.05, **P < 0.01 (exact p values are provided in Supplementary Table 1). Data are expressed as the Mean ± SEM of three (a-d,h-l) or six (g) independent experiments, representative of six (e) independent experiments, or pooled from three independent experiments (f).
HeLa cells were treated with IFN-γ (e,f) or treated with IFN-γ as indicated (a,c,d,g-l). Bacteria were counted based on their ability to grow on agar plates (a,b,h-k). PI - propidium iodide, p.i. - post-infection, +ve – positive, S. T - S. Typhimurium.
Next, we investigated which step of the S. Typhimurium life cycle is antagonized by IFN-γ. IFN-γ-stimulated and unstimulated cells carried similar bacterial loads shortly after infection, suggesting bacterial invasion of host cells proceeds unimpaired (Extended Data Fig. 1b). Vacuolar bacteria proliferated normally in IFN-γ-treated cells, as revealed by mutant S. Typhimurium (ΔprgH, +inv), which colonize epithelial cells using the inv gene of Yersinia pseudotuberculosis but do not invade the cytosol due to a non-functional Spi1 needle apparatus28–30 (Extended Data Fig.1c). Vacuolar escape is not controlled by IFN-γ either, as indicated by the unimpaired association of bacteria with proteins that detect bacterial entry into the cytosol (galectin-8, NDP52, ubiquitin, LC3C) 24,25,31,32 (Fig 1.c,d, Extended Data Fig. 1d). However, at 3h p.i. the fraction of bacteria associated with NDP52, ubiquitin or LC3C was reduced in IFN-γ-stimulated cells. Taken together, our data reveal that the inhibitory effect of IFN-γ affects bacteria that have reached the host cytosol.
Cytosol-invading bacteria recruit caspase-4 for GSDMD dependent pyroptosis
To investigate the mode of IFN-γ action, we infected cells expressing CFP::Galectin-8 a marker of endomembrane damage, in medium containing the membrane-impermeable DNA stain propidium iodide. Indicative of cell death, propidium iodide entered cells shortly after the bacterial vacuole was permeabilized, as indicated by the accumulation of galectin-8, (Supplementary video 2, Fig. 1e,f). Only IFN-γ-treated cells containing Galectin-8+ve bacteria accumulated propidium iodide (Fig. 1g). Under similar conditions plasma membranes did not stain with Annexin V (Extended Data Fig. 1e). We conclude that IFN-γ primes cells to execute cell death if S. Typhimurium enters their cytosol. Such heightened alertness towards cytosol-invading bacteria is reminiscent of the interferon-induced anti-viral state.
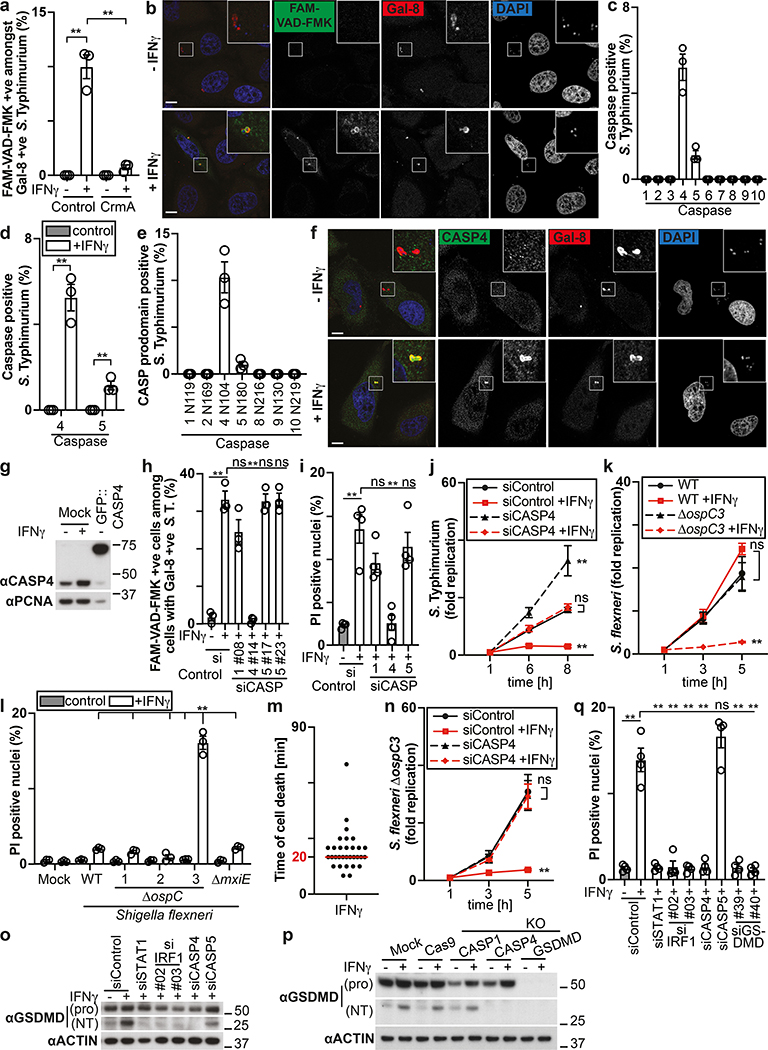
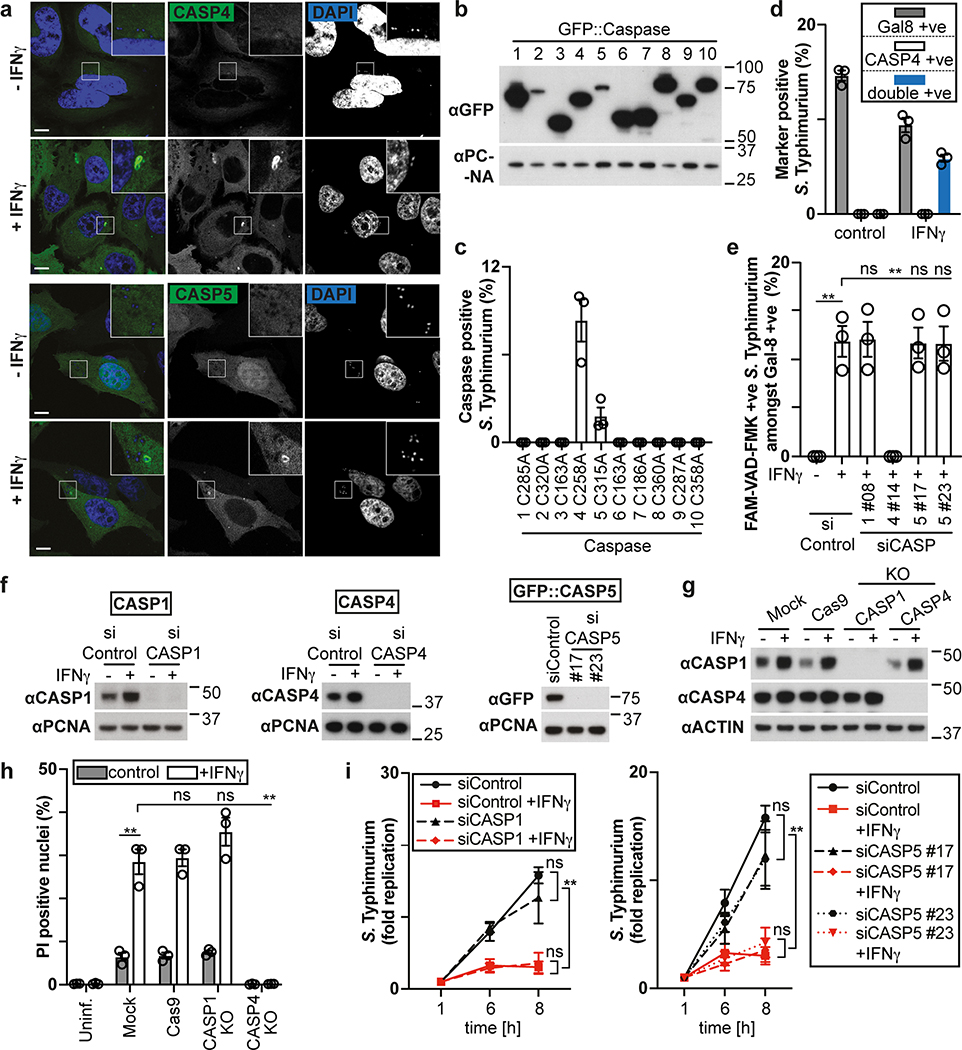
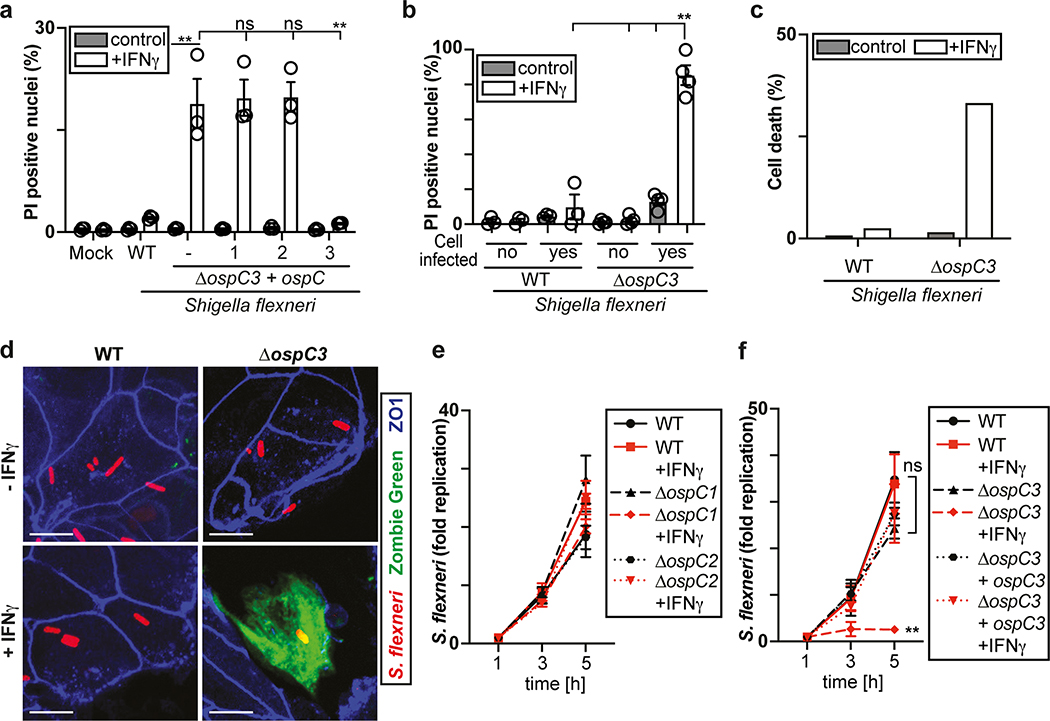
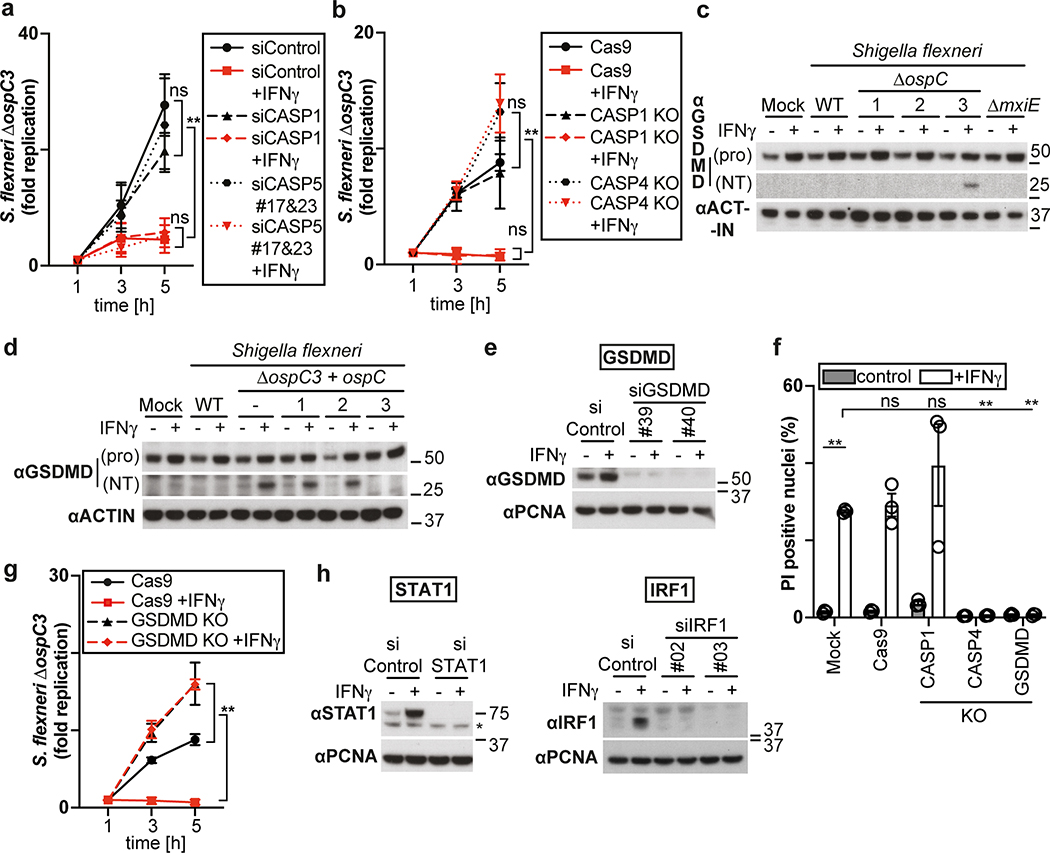
The proliferation of S. Typhimurium in IFN-γ-treated cells was not rescued by treatment with the RIPK1 inhibitor NEC-1s, the MLKL inhibitor NSA nor by overexpression of Bcl2 or Bcl-xL, arguing against necroptosis and mitochondria-dependent apoptosis as cause for cell death (Fig. 1h,i, Extended Data Fig. 1f). In contrast, overexpression of the poxvirus caspase inhibitor CrmA or treatment with the pan-caspase inhibitor Z-VAD-FMK enabled bacterial proliferation in IFN-γ-stimulated cells (Fig. 1j,k). Moreover, FAM-VAD-FMK, a fluorescent reporter of caspase activity, accumulated post-infection in IFN-γ-stimulated cells containing Galectin-8+ve bacteria in a CrmA-inhibitable manner (Fig. 1l, Extended Data Fig. 1g). Importantly, caspase activity peaked in the proximity of Galectin-8+ve bacteria, suggesting bacteria attract active caspase or initiate caspase activation (Fig. 2a,b). When investigating which caspase accumulates around S. Typhimurium, we found that GFP-tagged CASP4 and less frequently CASP5 were recruited in a strictly IFN-γ-dependent manner (Fig. 2c,d, Extended Data Fig. 2a,b). The N-terminal CARD domains of CASP4 and to a lesser extent CASP5 were sufficient for recruitment to S. Typhimurium (Fig. 2e), while caspase activity was dispensable (Extended Data Fig. 2c). Endogenous CASP4 accumulated around Galectin-8+ve S. Typhimurium in a strictly IFN-γ-dependent fashion (Fig. 2f, Extended Data Fig. 2d). IFN-γ mediated upregulation of Caspase-4 is insufficient to cause Caspase-4 recruitment since even GFP::CASP4, overexpressed beyond levels of IFN-γ-induced endogenous CASP4, was only recruited in IFN-γ treated cells (Fig. 2d,g), suggesting an unknown IFN-γ-inducible factor is required for Caspase-4 recruitment. Depletion of CASP4 but not CASP1 or CASP5 diminished caspase activity in the cytosol of cells containing Galectin-8+ve S. Typhimurium and on the bacterial surface (Fig. 2h, Extended Data Fig. 2e,f). CASP4 recruitment preceded cell death (Supplementary video 3) and depletion or knockout of CASP4 but not other caspases prevented cell death (Fig. 2i, Extended Data Fig. 2g,h) and rescued the proliferation of S. Typhimurium in IFN-γ-treated cells (Fig. 2j, Extended Data Fig. 2i). In contrast, Shigella flexneri, an enterobacterium highly adapted to a cytosolic lifestyle, proliferated unimpaired in cells stimulated with IFN-γ (Fig. 2k). We therefore tested the importance of OspC3, a Shigella-encoded inhibitor of CASP433, and found that within minutes after cytosolic entry bacteria lacking OspC3 but not OspC1, OspC2 or MxiE, a transcriptional regulator of host-induced gene expression, caused host cell death (Fig. 2l,m, Extended Data Fig. 3a,b). S. flexneri ΔOspC3 also triggered cell death in primary human enterocytes stimulated with IFN-γ (Extended Data Fig. 3c,d).The proliferation of S. flexneri ΔOspC3 was restricted by IFN-γ (Fig. 2k, Extended Data Fig. 3e,f) in a manner dependent on CASP4 but not CASP1 or CASP5 (Fig. 2n, Extended Data Fig. 4a,b). Since transfected LPS triggers CASP4-mediated pyroptosis through processing of GSDMD8,10,12, we tested whether intact bacteria entering the host cytosol trigger the same pathway. S. flexneri ΔospC3 but not control strains caused cleavage of GSDMD (Extended Data Fig. 4c,d) in a CASP4-dependent fashion (Fig. 2o,p) and induced GSDMD-dependent cell death (Fig. 2q, Extended Data Fig. 4e,f), which resulted in GSDMD-dependent restriction of bacterial proliferation (Extended Data Fig. 4g). GSDMD processing and cell death required the transcription factors STAT1 and IRF134, two IFN-γ-induced transcription factors (Fig. 2o,q, Extended Data Fig. 4h). We conclude that upon entry of S. Typhimurium or S. flexneri ΔospC3 into the cytosol of IFN-γ-treated cells CASP4 is recruited to the bacterial surface via an unknown factor, where it becomes activated and triggers GSDMD-dependent cell death, thereby destroying the bacterial niche for proliferation. Avoiding the CASP4 pathway via OspC3 is therefore essential for the cytosolic life style of S. flexneri in cells exposed to IFN-γ.
Figure 2. Cytosol-invading bacteria recruit caspase-4 for gasdermin-D dependent pyroptosis.
a, Percentage of FAM-VAD-FMK positive S. Typhimurium among bacteria positive for endogenous Galectin-8 at 90 min p.i. in HeLa cells expressing FLAG::CrmA as indicated. n > 100 Galectin-8 +ve bacteria per coverslip, in triplicate.
b, Confocal micrographs of HeLa cells, taken at 90 min p.i. with S. Typhimurium in the presence of FAM-VAD-FMK and stained with DAPI and antibody against Galectin-8.
c-e, Percentage of S. Typhimurium positive for the indicated GFP::Caspase constructs at 1 h p.i. in HeLa cells. n > 100 bacteria per coverslip, in triplicate.
f, Confocal micrographs of HeLa cells, taken at 90 min p.i. with S. Typhimurium and stained with DAPI and antibodies against Caspase-4 and Galectin-8.
g, Lysates of HeLa cells expressing GFP::Caspase-4 as indicated. Blots were probed with indicated antibodies, PCNA – loading control.
h, Percentage of FAM-VAD-FMK positive cells among HeLa cells containing S. Typhimurium positive for endogenous Galectin-8 at 90 min p.i.; cells treated with siRNAs against caspases as indicated. n > 100 cells with Galectin-8 +ve bacteria per coverslip, in triplicate.
i,l,q, Percentage of PI positive nuclei among HeLa cells infected with S. Typhimurium (i), the indicated S. flexneri strains (l) or S. flexneri ΔospC3 (q) at 2h p.i. Cells were treated with siRNAs as indicated (i,q).
j,k,n, Fold replication of S. Typhimurium (j), the indicated S. flexneri strains (k) or S. flexneri ΔospC3 (n) in HeLa cells. Cells were treated with siRNAs against Caspase-4 (j,n). m, Time between recruitment of Galectin-8 to S. flexneri ΔospC3 and nuclei of infected cell becoming PI positive in CFP::Galectin-8 expressing HeLa cells. Median in red. Live imaged every 5 min for 5 h.
o,p Lysates of HeLa cells treated with the indicated siRNAs (o) or of control and knock-out HeLa cells (p) and infected with S. flexneri ΔospC3 for 1h. Blots were probed with the indicated antibodies, Actin – loading control. Pro - full length pro-form of GSDMD (shorter exposure), NT - N-terminal domain of GSDMD (longer exposure). Samples in Fig. 2p, Fig. 8c and Extended Data Fig. 2g were obtained from the same experiment.
Statistical significance was assessed by two-tailed unpaired Student’s t-test (d), one-way (a,h,i,l,q) or two-way (j,k,n) analysis of variance (ANOVA) with Tukey’s multiple comparisons test; ns, not significant, *P < 0.05, **P < 0.01 (exact p values are provided in Supplementary Table 1). Data are expressed as the Mean ± SEM of three (a,c-e,h,k,l,n) or four (i,j,q) independent experiments, representative of two (p), three (b,f,g,o) independent experiments, or pooled from four independent experiments (m).
HeLa cells were treated with IFN-γ (c,e,m) or treated with IFN-γ as indicated (a,b,d,f-l,n-q). Bacteria were counted based on their ability to grow on agar plates (j,k,n). Uncropped blots (g,o,p) are shown in the Source Data. Scale bar, 10 μm (b,f). PI - propidium iodide, p.i. - post-infection, +ve – positive, S. T - S. Typhimurium.
Cytosol-invading bacteria recruit and activate CASP4 through GBPs
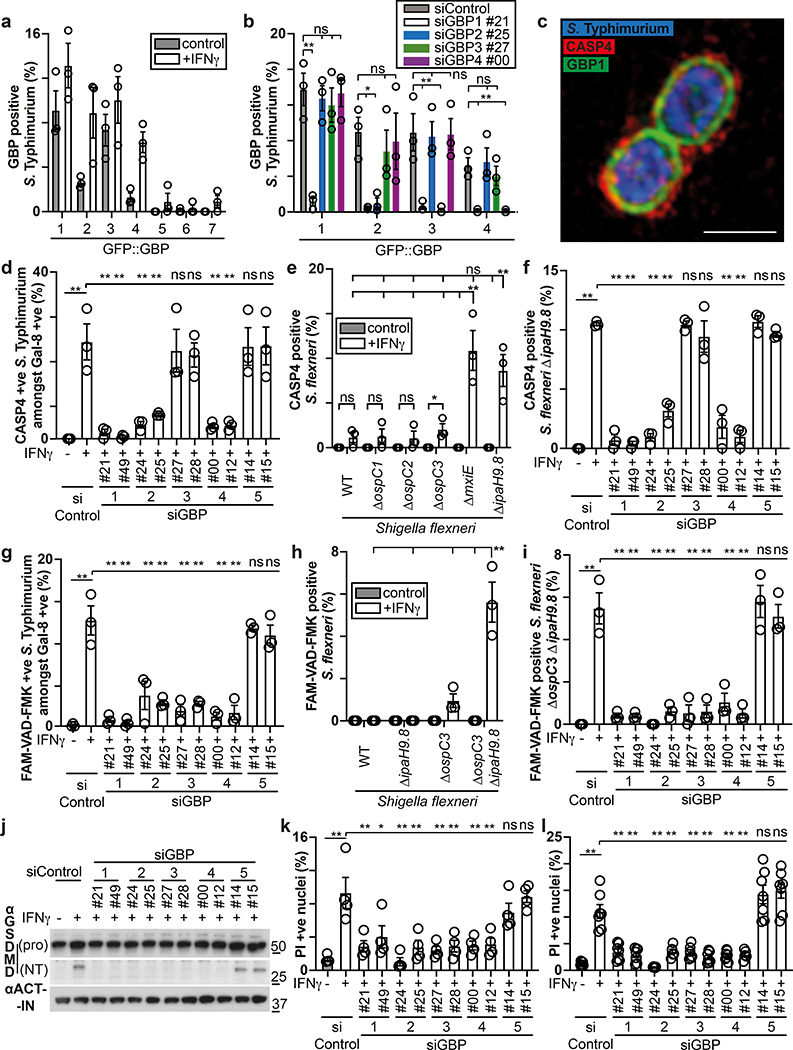
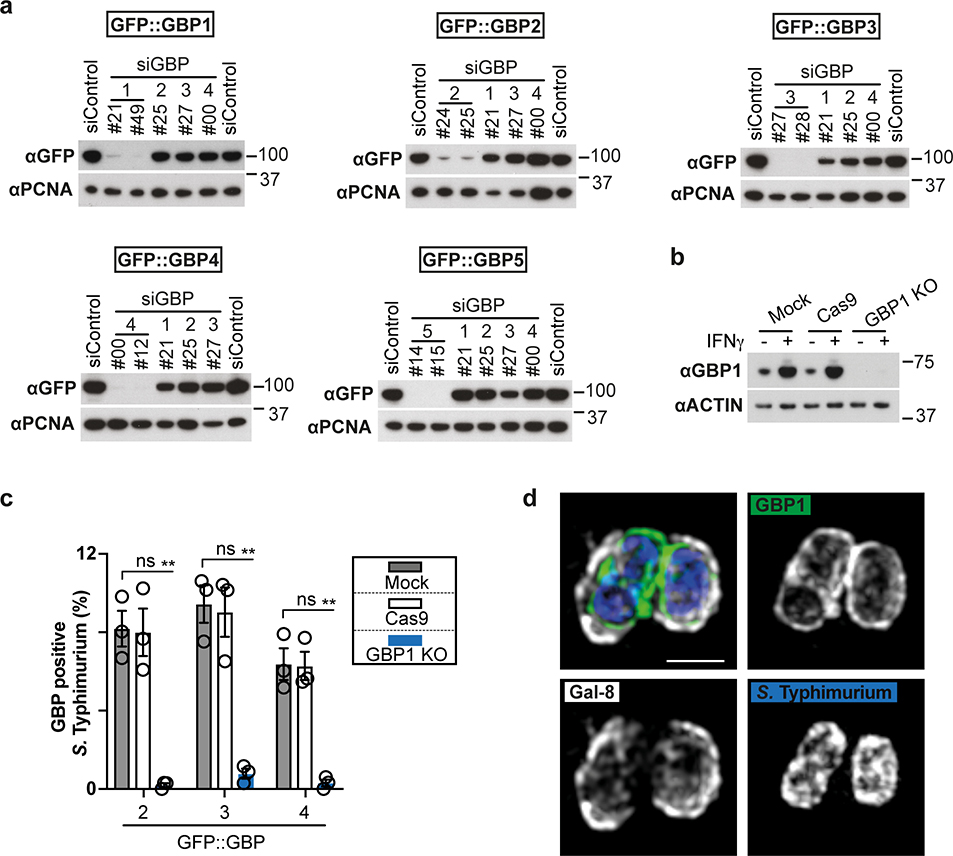
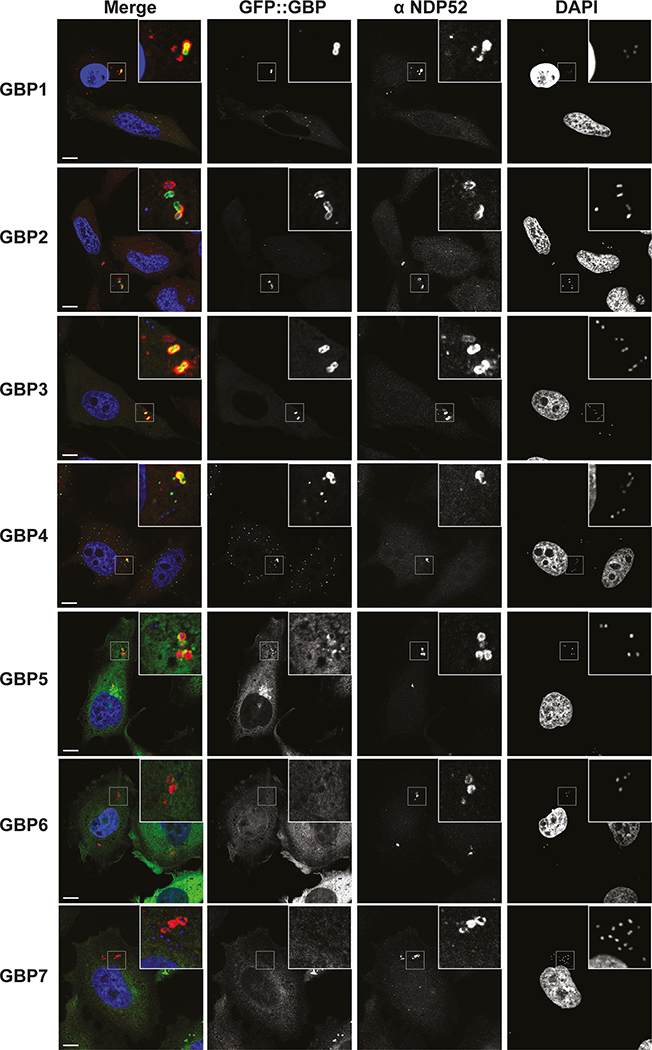
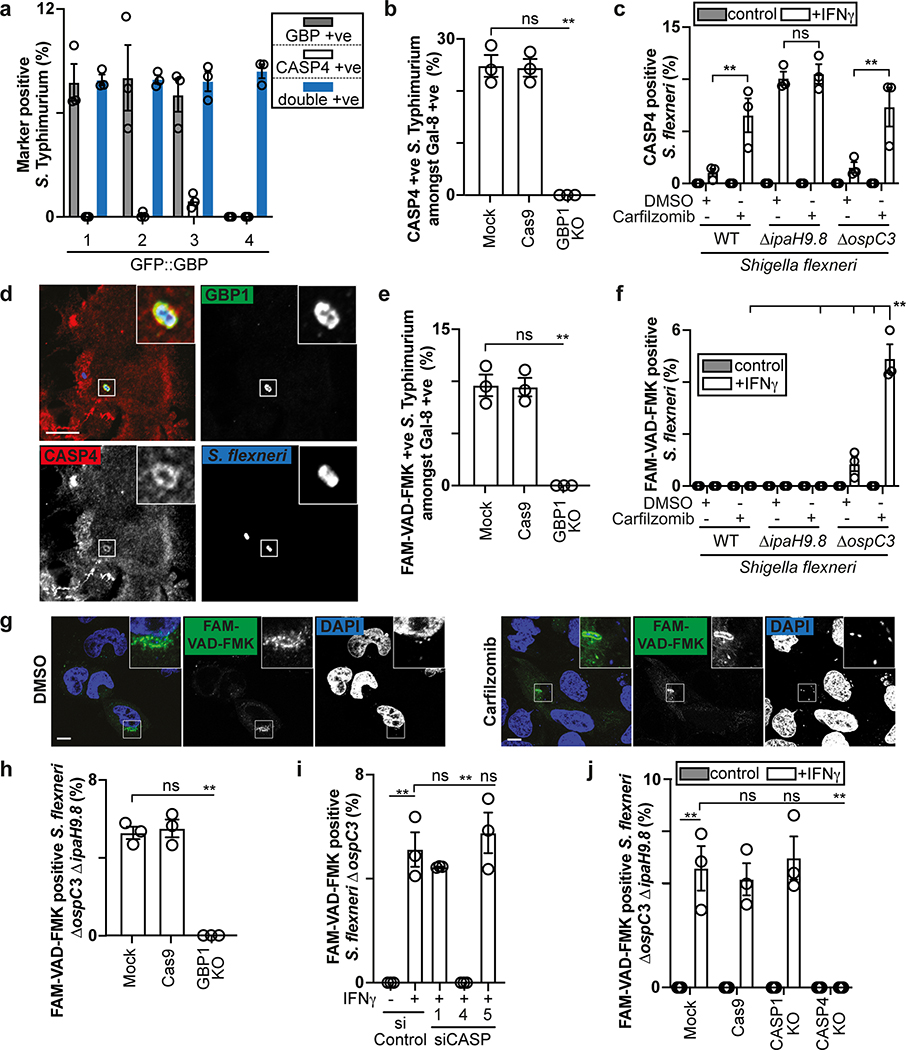
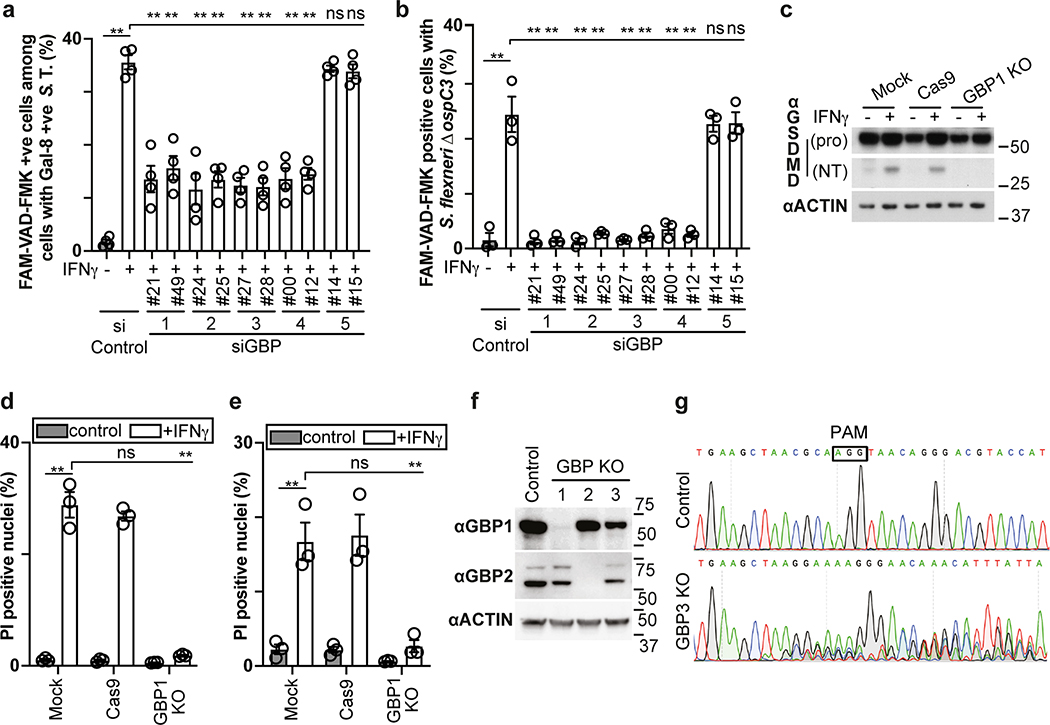
To identify the genes selectively induced by IFN-γ and required for functionality of the CASP4-GSDMD pathway in response to cytosol-invading bacteria (Fig. 1b), we tested the involvement of GBPs, a family of IFN-γ-induced GTPases13–15. GBPs are known to coat cytosolic S. flexneri to inhibit actin-dependent motility and cell-to-cell spread and have been implicated in cell death16,19,35–37. We confirmed that similar to S. flexneri36, S. Typhimurium also interacted with GBP1, GBP2, GBP3 and GBP4 in a hierarchical manner with GBP1 essential for recruitment of all GBPs (Fig. 3a,b, Extended Data Fig. 5a–c). GBPs were recruited to cytosol-exposed bacteria, as indicated by staining for NDP52 (Extended Data Fig. 6), where GBP1 accumulated on the bacterial surface and not on damaged vacuoles positive for galectin-8 (Extended Data Fig. 5d). CASP4 was recruited only to bacteria that were also positive for GBPs (Extended Data Fig. 7a), where it formed discontinuous structures on the cytosolic face of the GBP layer surrounding the bacterium (Fig. 3c), consistent with a role for GBPs in attracting CASP4 to bacteria. Indeed, by infecting cells lacking specific GBPs, we discovered that GBP1, GBP2 and GBP4, but not GBP3 or GBP5, were essential for the recruitment of CASP4 to S. Typhimurium (Fig. 3d, Extended Data Fig. 5a,b,7b). In contrast, S. flexneri actively avoided CASP4 recruitment to its surface as it was only targeted by CASP4 when lacking either IpaH9.836, a GBP-specific E3 ubiquitin ligase, or MxiE38, a transcriptional regulator of IpaH9.8 expression, or if cells were treated with the proteasome inhibitor Carfilzomib to block IpaH9.8-dependent degradation of GBPs (Fig 3e, Extended Data Fig. 7c). Recruitment of endogenous GBP1 and endogenous CASP4 to S. flexneri ΔipaH9.8 was confirmed in primary human enterocytes (Extended Data Fig. 7d). CASP4 recruitment required GBP1, GBP2 and GBP4 but not GBP3 or GBP5 (Fig. 3f), thus mirroring to the situation in S. Typhimurium and suggesting S. flexneri antagonizes CASP4 recruitment by degrading GBPs. To test whether GBPs also affect caspase activation, we infected cells deficient in specific GBPs and used FAM-VAD-FMK to monitor caspase activity. GBP3 was specifically required to induce caspase activity in the vicinity of S. Typhimurium, in addition to more ‘upstream’ GBPs, i.e. GBP1 as well as GBP2 and GBP4, which, as shown above, are required for the recruitment of other GBPs and CASP4, respectively (Fig. 3g, Extended Data Fig. 7e). In contrast, S. flexneri rarely stained with FAM-VAD-FMK (Fig. 3h), indicating lack of caspase activity in its vicinity.
Figure 3. GBPs recruit and activate caspase-4 at the surface of cytosol-invading bacteria.
a,b, Percentage of S. Typhimurium positive at 1 h p.i. for the indicated GFP::GBP constructs expressed in HeLa cells. Cells were treated with the indicated siRNAs (b). n > 100 bacteria per coverslip, in triplicate.
c, Structured illumination micrograph of HeLa cells expressing GFP::GBP1 at 1 h p.i. with S. Typhimurium and antibody-stained for Caspase-4. Scale bar, 1 μm.
d-f, Percentage of endogenous Caspase-4 positive bacteria among S. Typhimurium positive for endogenous Galectin-8 (d), indicated S. flexneri strains (e) or S. flexneri ΔipaH9.8 (f) at 1 h p.i. in HeLa cells. Cells were treated with the indicated siRNAs against GBPs (d,f). n > 100 Galectin-8 positive bacteria (d) or n > 100 bacteria (e,f) per coverslip, in triplicate.
g-i, Percentage of FAM-VAD-FMK positive S. Typhimurium among bacteria positive for endogenous Galectin-8 at 90 min p.i. (g) FAM-VAD-FMK positive S. flexneri of the indicated strains (h) or S. flexneri ΔospC3 ΔipaH9.8 (i) at 1 h p.i. in HeLa cells. Cells were treated with the indicated siRNAs against GBPs (g,i). n > 100 Galectin-8 positive bacteria (g) or n > 100 bacteria (h, i) per coverslip, in triplicate.
j, Lysates of HeLa cells treated with the indicated siRNAs and infected with S. flexneri ΔospC3 for 1h. Blots were probed with the indicated antibodies, Actin – loading control. Pro - full length pro-form of GSDMD (shorter exposure), NT - N-terminal domain of GSDMD (longer exposure).
k,l, Percentage of PI positive nuclei in HeLa cells treated with the indicated siRNAs at 2h p.i. with S. Typhimurium (k) or S. flexneri ΔospC3 (l).
Statistical significance was assessed by two-tailed unpaired Student’s t-test (e), one-way analysis of variance (ANOVA) with Dunnett’s multiple comparisons test versus siControl (b) or Tukey’s multiple comparisons test (d-i,k,l); ns, not significant, *P < 0.05, **P < 0.01 (exact p values are provided in Supplementary Table 1). Data are expressed as the Mean ± SEM of three (a,b,d-i), four (k) or five (l) independent experiments, or representative of three (c,j) independent experiments.
HeLa cells were treated with IFN-γ (b,c) or treated with IFN-γ as indicated (a,d-l). Uncropped blots (j) are shown in the Source Data. PI - propidium iodide, p.i. - post-infection, +ve – positive.
While deficiency in IpaH9.8 was sufficient to cause CASP4 recruitment to S. flexneri (Extended Data Fig. 7c), only bacteria lacking both IpaH9.8 and OspC3 triggered caspase activity (Fig. 3h, Extended Data Fig. 7f,g). We conclude that S. flexneri antagonizes CASP4 at multiple levels. Infection with S. flexneri ΔipaH9.8 ΔospC3 revealed that GBP3 was specifically required to induce CASP4 activity in the bacterial vicinity, in addition to GBP1, GBP2 and GBP4 with established upstream functions (Fig. 3i, Extended Data Fig. 7h–j), again faithfully mirroring the situation in S. Typhimurium. Consistent with the induction of caspase activity in the bacterial vicinity depending on GBP1, GBP2, GBP3 and GBP4, the same set of GBPs was required to induce caspase activity throughout the cell body (Extended Data Fig. 8a,b), to induce processing of GSDMD (Fig. 3j, Extended Data Fig. 8c) and to trigger cell death upon infection with S. Typhimurium or S. flexneri ΔospC3 (Fig. 3k,l, Extended Data Fig. 8d,e), thereby extinguishing the bacterial replicative niche. Taken together, we conclude that in cells stimulated with IFN-γ, GBPs associate with Gram-negative bacteria to transform the bacterial surface into a signaling platform required for the recruitment and activation of CASP4, which causes pyroptotic cell death and destroys the bacterial replicative niche. Shigella’s multipronged attempt to prevent formation of the GBP-dependent signaling platform and activation of CASP4 provides compelling evidence for the importance of the pathway in anti-bacterial defense.
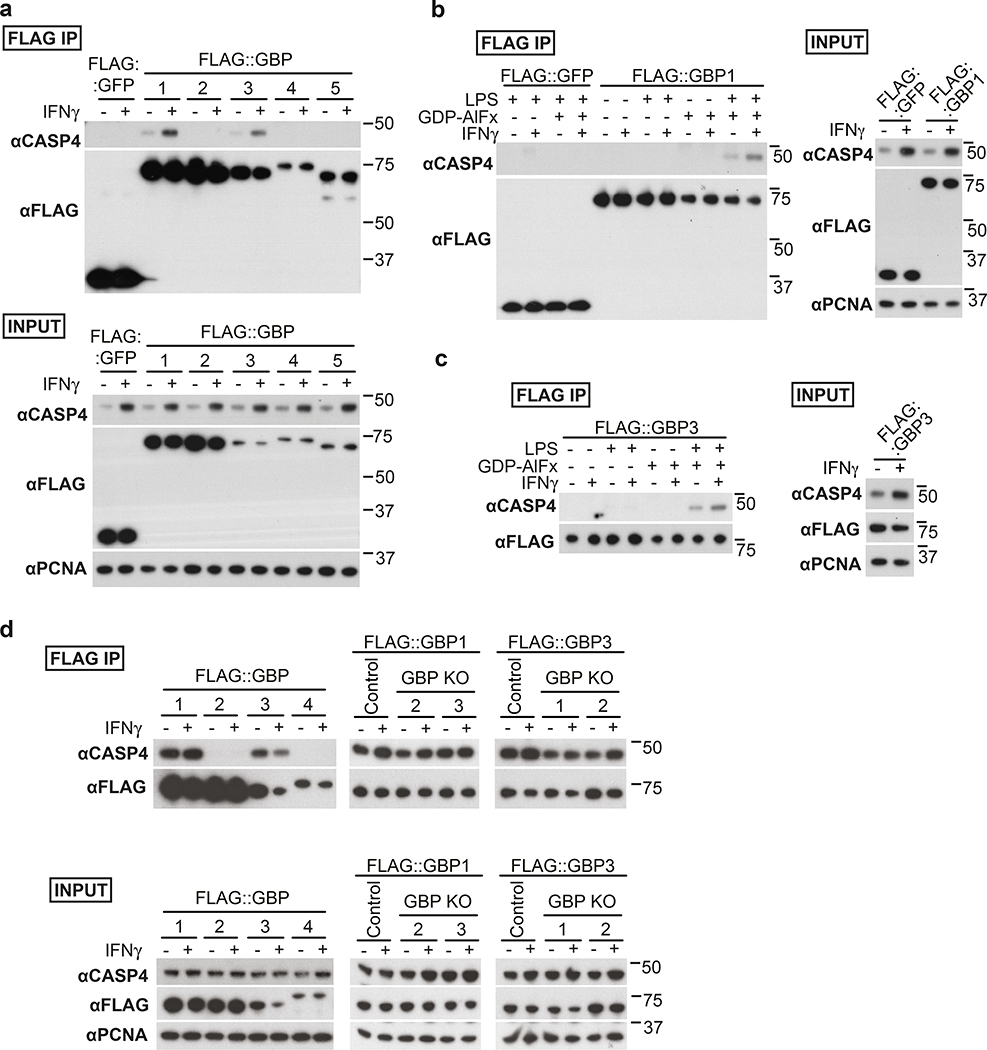
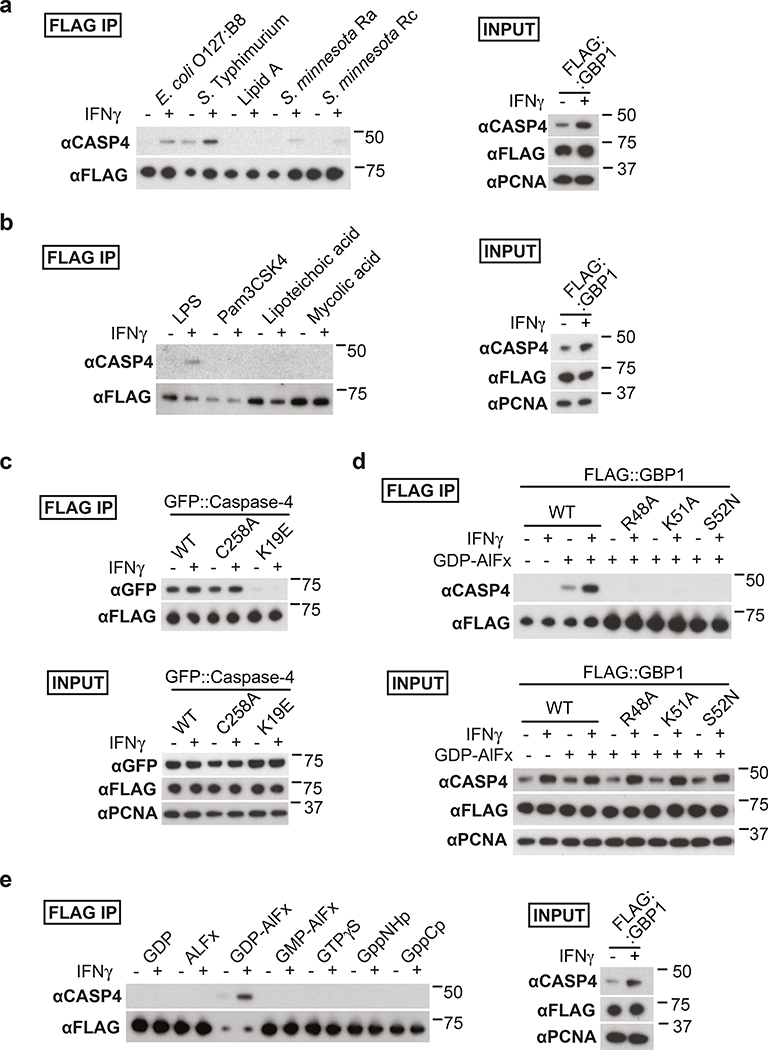
To investigate how coating of the bacterial surface with GBPs causes CASP4 recruitment, we tested whether GBPs bind CASP4. We discovered that in lysates of epithelial or myeloid cells GBP1 and GBP3, but not GBP2 or GBP4, associate with CASP4 in a LPS-dependent manner (Fig. 4a–d). CASP4 retrieval was enhanced in lysates of IFN-γ-stimulated cells (Fig. 4a–c) and was promoted by LPS from different species, including LPS lacking the O-antigen (Ra LPS) and rough LPS (Rc LPS), but not by lipid A and unrelated bacterial products such as lipoteichoic acid, mycolic acid or Pam3CSK, indicating specificity for LPS and an essential contribution of the LPS core for the association of GBPs with CASP4 (Fig. 5a,b). As predicted, CASP4K19E, an allele deficient in LPS binding12, was inactive (Fig. 5c). Complexes of CASP4 with GBP1 and GBP3 still formed in the absence of GBP3 and GBP1, respectively, indicating that either GBP is sufficient for complex formation (Fig. 4d, Extended Data Fig. 8f,g). CASP4 retrieval required an intact GTPase domain in GBP1 (Fig. 5d) and occurred specifically in the presence of GDP-AlFx (Fig. 4b, 5e), i.e. under conditions mimicking the transition state of GTP hydrolysis in oligomeric GBPs39. The LPS-dependent complex formation of caspase-4 specifically with oligomeric GBPs suggests that the assembly of GBPs on the bacterial surface into a polyvalent protein array is important for CASP4 activation in response to Gram-negative bacteria.
Figure 4. Formation of LPS-dependent GBP-CASP4 complexes.
a-c, Pulldown of endogenous Caspase-4 by FLAG-tagged GBPs from HeLa cell lysates complemented with 10 μg ml−1 S. Typhimurium LPS and GDP-AlFx (a) or as indicated (b,c).
d, Pulldown of endogenous Caspase-4 by FLAG-tagged GBPs from lysates of control or the indicated GBP knock-out U937 cells. Lysates were complemented with 10 μg ml−1 S. Typhimurium LPS and GDP-AlFx.
Data are representative of two independent experiments (a-d).
HeLa cells were treated with IFN-γ as indicated (a-d). Flag-tagged proteins were pulled down using magnetic beads and eluted with FLAG peptide. Blots were probed with the indicated antibodies, PCNA – loading control. Uncropped blots (a-d) are shown in the Source Data.
Figure 5. Analysis of LPS-dependent GBP-CASP4 complexes.
a,b,e, Pulldown of endogenous Caspase-4 by FLAG-tagged GBP1 from HeLa cell lysates complemented with GDP-AlFx and 10 μg ml−1 of LPS from the indicated bacterial species or LipidA (a), with GDP-AlFx and 10 μg ml−1 of the indicated agonist (b) or with 10 μg ml−1 S. Typhimurium LPS and the indicated reagents i.e. 200 μM GDP, 300 μM AlCl3, 10 mM NaF, 200 μM GMP, 0.5 mM GTP-γ-S, 0.5 mM GppNHp or 0.5 mM GppCp (e).
c,d, Pulldown of GFP-tagged alleles of Caspase-4 (c) or endogenous Caspase-4 (d) by FLAG-tagged WT GBP1 (c) or the indicated GBP1 alleles (d) from HeLa cell lysates. Lysates were complemented with 10 μg ml−1 of S. Typhimurium LPS (c,d) and with GDP-AlFx (c) or with GDP-AlFx as indicated (d).
Data are representative of two independent experiments (a-e).
HeLa cells were treated with IFN-γ as indicated (a-e). Flag-tagged proteins were pulled down using magnetic beads and eluted with FLAG peptide. Blots were probed with the indicated antibodies, PCNA – loading control. Uncropped blots (a-e) are shown in the Source Data.
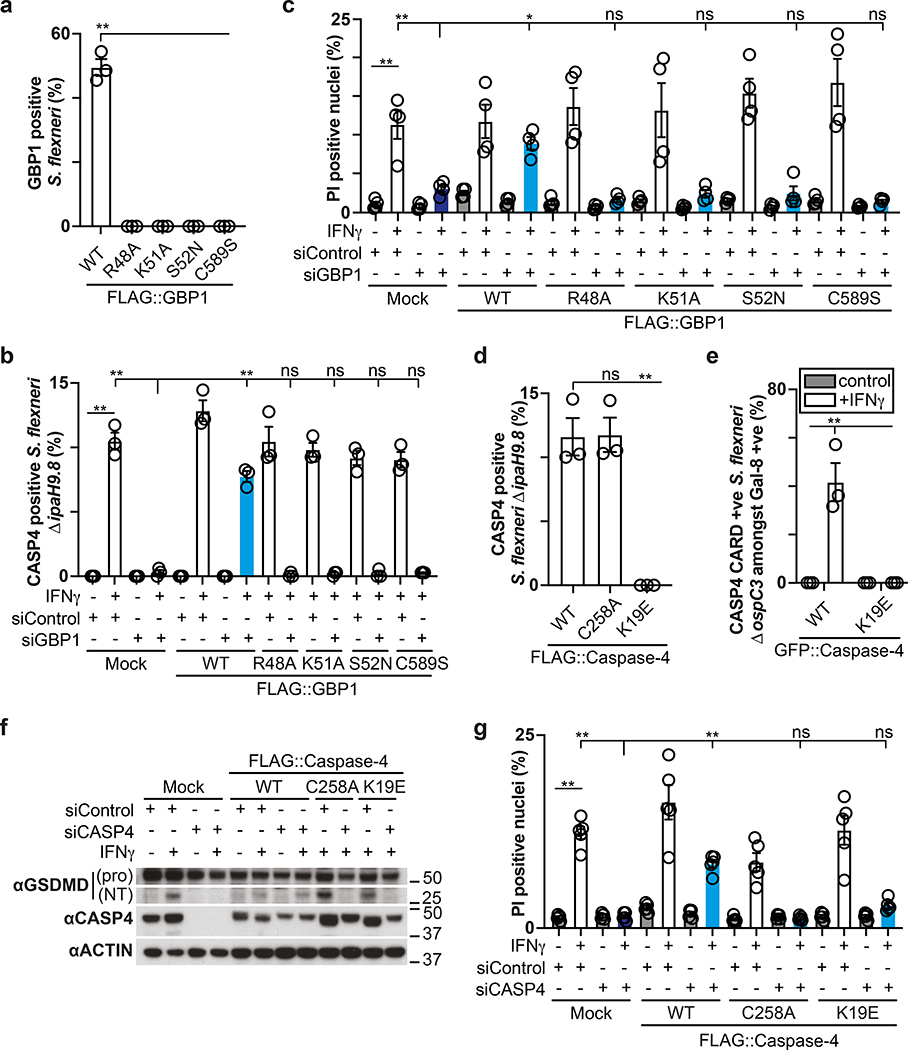
To further our understanding of how coating of the bacterial surface with GBPs results in CASP4 activation, we deployed mutant GBP1 and CASP4 alleles in complementation experiments 12,40. In cells stimulated with IFN-γ and infected with S. flexneri, GBP1 alleles deficient in prenylation (GBP1C589S) or catalytically inactive due to lack of Mg2+-binding (GBP1S52N), GTP-binding (GBP1K51A), or GTP-hydrolysis (GBP1R48A) did not coat the bacterial surface (Fig. 6a), nor did they recruit CASP4 (Fig. 6b) or trigger cell death (Fig. 6c). Since binding of LPS to the CARD domain of CASP4 has been suggested to activate CASP4, we next tested the phenotype of CASP4K19E, a mutant deficient in LPS binding12, in a complementation experiment. In cells stimulated with IFN-γ and infected with S. flexneri, wild type CASP4 and catalytically inactive CASPC258A but not CASP4K19E or its isolated CARD domain (CARDK19E) accumulated on bacteria (Fig. 6d,e). Lack of recruitment in CASP4K19E and lack of catalytic activity in CASPC258A prevented GSDMD cleavage and cell death in cells stimulated with IFN-γ and infected with S. flexneri (Fig. 6f,g). We conclude that GBP1 and CASP4 do not cause pyroptosis if unable to coat the bacterial surface or fail to associate with each other. Lack of CASP4K19E recruitment, considering its reported defect in LPS binding12, is consistent with a direct contribution of LPS to the recruitment of CASP4. However, in the context of an intact bacterial membrane CASP4 evidently does not bind LPS in the absence of GBPs. The requirement for GBPs in recruiting CASP4 and the accumulation of CASP4 on the cytosolic face of the GBP coat therefore suggest a role for GBPs, possibly assisted by their GTPase activity, in making LPS available for CASP4, possibly by disturbing the integrity of the outer bacterial membrane.
Figure 6. Structure function analysis of the GBP-dependent caspase-4 signalling platform.
a,d, Percentage of S. flexneri positive for the indicated FLAG::GBP1 (a) or FLAG::Caspase-4 (d) alleles at 1 h p.i. HeLa cells were treated with the GBP1 #49 (a) or CASP4 #14 (d) siRNA and GBP1 (a) or Caspase-4 (d) expression was complemented with siRNA-resistant FLAG::GBP1 or FLAG::Caspase-4 alleles as indicated. n > 100 bacteria per coverslip, in triplicate.
b, Percentage of endogenous Caspase-4 positive S. flexneri ΔipaH9.8 at 1 h p.i.. HeLa cells were treated with GBP1 #49 siRNA and GBP1 expression was complemented with siRNA-resistant FLAG::GBP1 alleles as indicated. n > 100 bacteria per coverslip, in triplicate.
c,g, Percentage of PI positive nuclei in cells infected with S. flexneri ΔospC3 at 2h p.i. HeLa cells were treated with the indicated siRNAs and GBP1 (c) or Caspase-4 (g) expression was complemented with siRNA-resistant FLAG::GBP1 or FLAG::Caspase-4 alleles as indicated.
e, Percentage of GFP::Caspase-4 CARD domain (aa1–104) positive S. flexneri ΔospC3 amongst Galectin-8 positive bacteria in HeLa cells expressing CFP::Galectin-8 and the indicated GFP::Caspase-4 CARD domain alleles. Live imaged every 4 min for 2 h, 5 fields per condition.
f, Lysates of cells infected with S. flexneri ΔospC3 for 1h. HeLa cells were treated with the indicated siRNAs and Caspase-4 expression was complemented with siRNA-resistant FLAG::Caspase-4 alleles as indicated. Blots were probed with the indicated antibodies, Actin – loading control. Pro - full length pro-form of GSDMD (shorter exposure), NT - N-terminal domain of GSDMD (longer exposure). Samples in Fig. 6f and Fig. 8e were obtained from the same experiment.
Statistical significance was assessed by one-way analysis of variance (ANOVA) with Dunnett’s (c) or Tukey’s (a,b,d,e,g) multiple comparisons test; ns, not significant, *P < 0.05, **P < 0.01 (exact p values are provided in Supplementary Table 1). Data are expressed as the Mean ± SEM of three (a,b,d,e), four (c) or five (g) independent experiments, or representative of two (f) independent experiments.
HeLa cells were treated with IFN-γ (a,d) or treated with IFN-γ as indicated (b,c,e-g). Uncropped blots (f) are shown in the Source Data. PI - propidium iodide, p.i. - post-infection, +ve – positive.
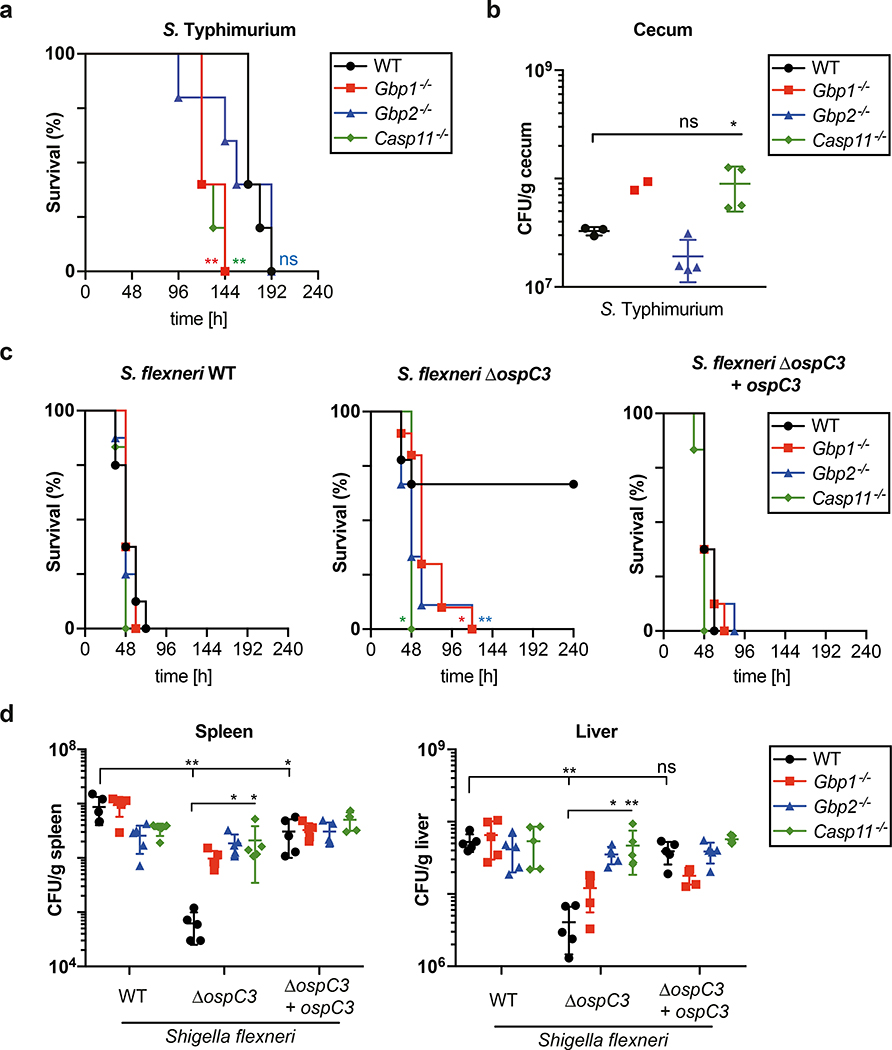
We next tested the in vivo importance of the GBP-caspase-4 pathway against Salmonella and Shigella infections. Upon infection with S. Typhimurium, Gbp1−/− mice and Casp11−/− mice suffered a higher bacterial burden in their ceaca and succumbed to infection earlier, whereas GBP2 protected mice only during the early stage of infection (Fig. 7a,b). Mice infected with wild type S. flexneri had significantly higher bacterial loads in livers and spleens than their littermates exposed to S. flexneri ΔospC3, resulting in significantly better survival of the latter (Fig. 7c,d). Importantly, S. flexneri ΔospC3 was not attenuated in mice lacking Gbp1, Gbp2 or Casp11, the orthologue of human CASP4. Such lack of attenuation for S. flexneri ΔospC3 is best explained by an epistatic interaction of Gbp1 and Gbp2 with Casp11, which provides strong in vivo support for the proposed role of GBPs in converting the surface of cytosol-invading bacteria into a caspase-activation platform.
Figure 7. Gbps and Caspase-11 protect mice epistatically against bacterial infection.
a, Kaplan-Meier survival plots of wild-type (WT) or the indicated knock-out mice infected orogastrically with Streptomycin-resistant S. Typhimurium at a MOI of 7 ×10³. Sample sizes – 5 animals per group.
b, Bacterial burden during S. Typhimurium infection in mice. Wild-type (WT) or the indicated knock-out mice were infected orogastrically with Streptomycin-resistant S. Typhimurium at a MOI of 7 ×10³. CFUs of S. Typhimurium in cecum assessed at 96 h p.i.. Sample sizes (n = number of animals); n = 3 for WT, n = 2 for Gbp1−/−, n = 4 for Gbp2−/− and Casp11−/−.
c, Kaplan-Meier survival plots of wild-type (WT) or the indicated knock-out mice infected intraperitoneally with the indicated S. flexneri strains at a MOI of 7.6 ×10⁷. Sample sizes (n = number of animals) and genotypes Shigella/mice); n = 8 for WT/WT, WT/Gbp1−/− and WT/Gbp2−/−, n = 6 for WT/Casp11−/−, n = 9 for ΔospC3/WT and ΔospC3/Gbp2−/−, n=10 ΔospC3/Gbp1−/−, n = 9 for ΔospC3/Casp11−/−, n = 8 for ΔospC3+ospC3/WT, ΔospC3+ospC3/Gbp1−/− and ΔospC3+ospC3/Gbp2−/−, n = 6 for ΔospC3+ospC3/Casp11−/−.
d, Bacterial burden during S. flexneri infection in mice. Wild-type (WT) or the indicated knock-out mice were infected intraperitoneally with the indicated S. flexneri strains at a MOI of 7.6 ×10⁷. CFUs of S. flexneri in spleen (left) or liver (right) were determined at 24 h p.i.. Sample sizes – 5 animals per group.
Statistical significance was assessed by two-tailed Log-rank (Mantel-Cox) test compared to WT group (a,c) or one-way ANOVA with Dunnett’s multiple comparison test versus WT mice group (b,d); ns, not significant, *P < 0.05, **P < 0.01 (exact p values are provided in Supplementary Table 1). Data are shown as the Mean ± SD (b,d). Data are representative of two independent experiments (a-d). p.i. - post-infection, MOI - multiplicity of infection.
Processing and secretion of IL-18 requires GBP-dependent caspase-4 activity
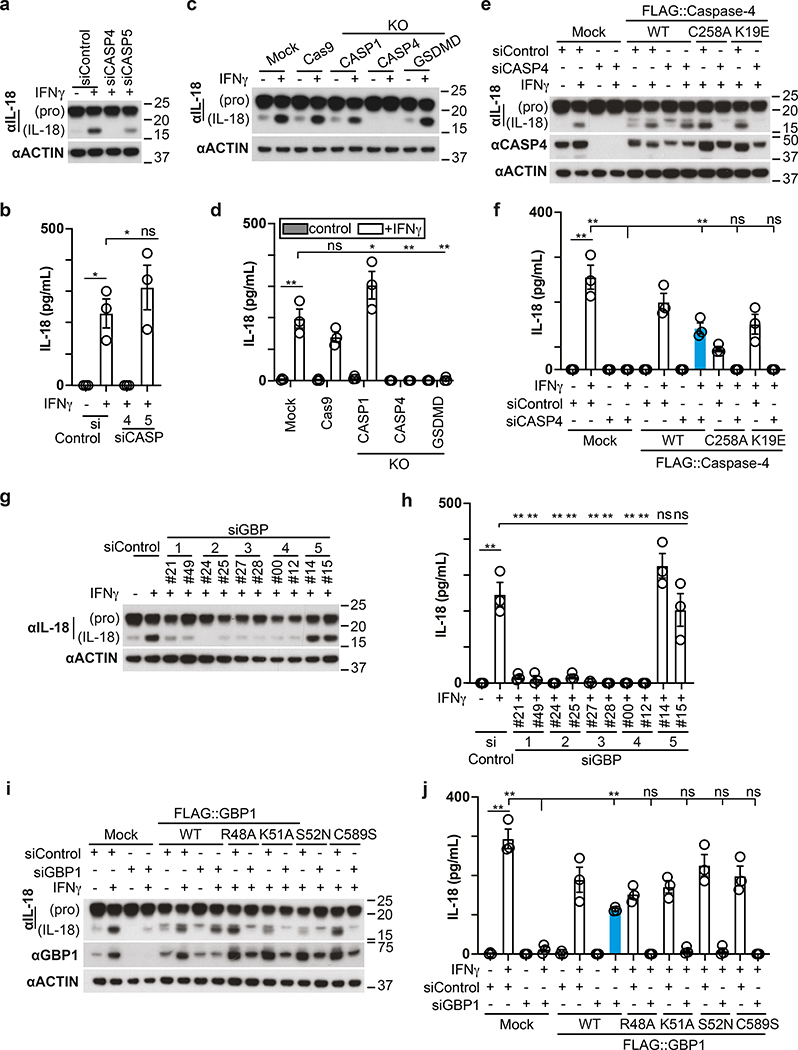
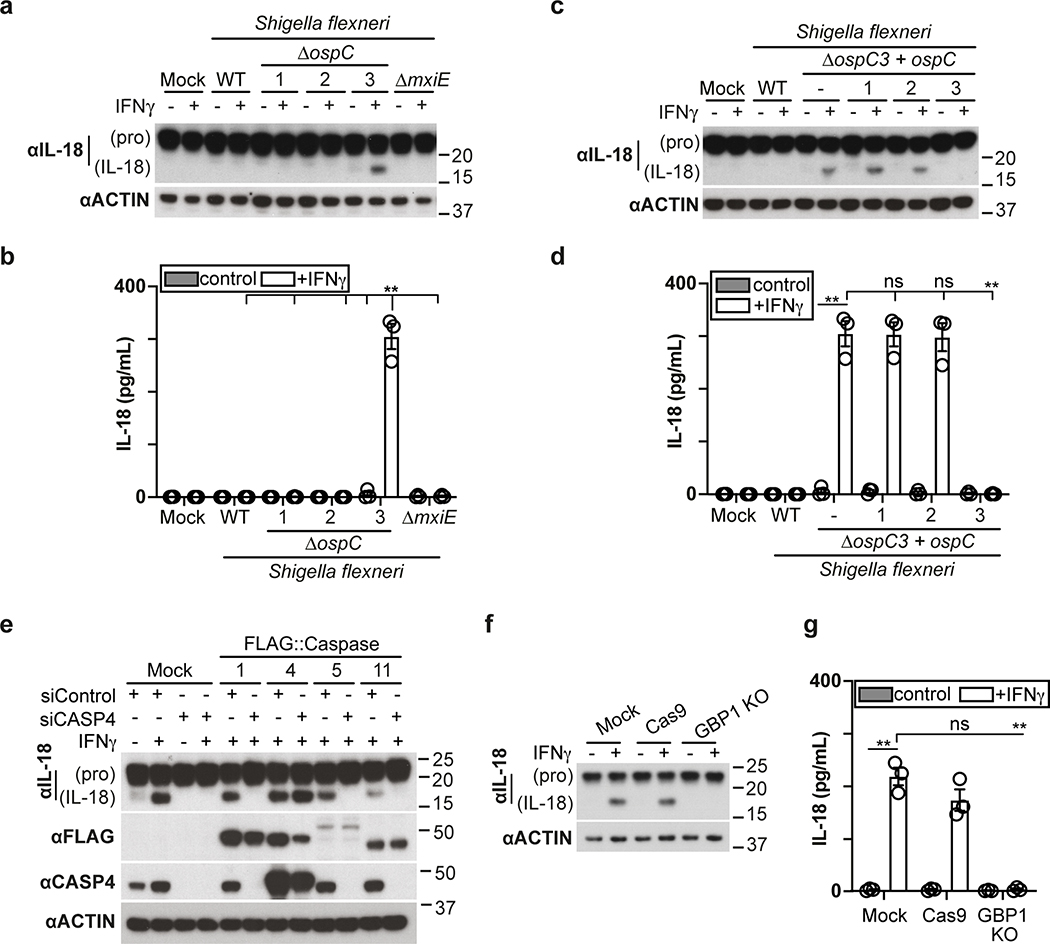
In addition to cleaving GSDMD, human CASP4 has been reported to process IL-1841, a pro-inflammatory cytokine, while murine Casp11 appears to be inactive against the latter42. We therefore investigated whether the GBP-dependent conversion of the Shigella surface into a polyvalent caspase signaling platform also controls IL-18 maturation through CASP4. Processing of IL-18, as well as its release from cells infected with S. flexneri was suppressed by OspC3 and required CASP4 but not CASP1 or CASP5 (Fig. 8a–d, Extended Data Fig. 9a–d). Consistent with species-specific differences murine Casp11, known not to process IL-1842, failed to complement human cells in which CASP4 had been knocked down (Extended Data Fig. 9e). As expected, GSDMD was required for the release and not the processing of IL-18 (Fig. 8c–d). Complementation of CASP4-depleted cells with catalytically inactive CASPC258A or recruitment-deficient CASP4K19E failed to rescue the defect in processing and release of IL-18 (Fig. 8e,f). Cells lacking GBP1, GBP2, GBP3 or GBP4 but not GBP5, also failed to process and release IL-18 (Fig. 8g,h, Extended Data Fig. 9f,g). Complementation of GBP1-depleted cells with alleles deficient in prenylation or catalytically inactive GBP1 did not rescue the defect in IL-18 processing or release (Fig. 8i,j). We therefore conclude that the conversion of the bacterial surface by GBPs into a polyvalent signaling platform is required for the CASP4-mediated processing and release of IL-18, suggesting that in addition to inducing pyroptosis and destroying the bacterial replicative niche, human CASP4 also fulfills a pro-inflammatory role by alarming surrounding cells to the presence of cytosol-invading bacteria.
Figure 8. Processing and secretion of IL-18 requires GBP-dependent caspase-4 activity.
a,c,g, Lysates of HeLa cells treated with the indicated siRNAs (a,g) or of the indicated control or knock-out HeLa cells (c) harvested at 1h p.i. with S. flexneri ΔospC3. Samples in Fig. 8c, Fig. 2p and Extended Data Fig. 2g were obtained from the same experiment.
b,d,h, Release of IL-18 from HeLa cells treated with the indicated siRNAs (b,h) or from the indicated control or knock-out HeLa cells (d) at 1h p.i. with S. flexneri ΔospC3.
e, i, Lysates of cells at 1h p.i. with S. flexneri ΔospC3. HeLa cells were treated with the indicated siRNAs and GBP1 (i) or Caspase-4 (e) expression was complemented with FLAG::GBP1 or FLAG::Caspase-4 alleles as indicated. Samples in Fig. 8e and Fig. 6f were obtained from the same experiment.
f,j, Release of IL-18 from cells treated with the indicated siRNAs at 1h p.i. with S. flexneri ΔospC3. HeLa cells were treated with the indicated siRNAs and GBP1 (j) or Caspase-4 (f) expression was complemented with FLAG::GBP1 or FLAG::Caspase-4 alleles as indicated.
Statistical significance was assessed by one-way analysis of variance (ANOVA) with Tukey’s multiple comparisons test (b,d,f,h,j); ns, not significant, *P < 0.05, **P < 0.01 (exact p values are provided in Supplementary Table 1). Data are expressed as the Mean ± SEM of three (b,d,f,h,j) independent experiments, or representative of two (c,e,i) or three (a,g) independent experiments. HeLa cells were treated with IFN-γ as indicated (a-j). Blots were probed with the indicated antibodies, Actin – loading control (a,c,e,g,i). Uncropped blots (a,c,e,g,i) are shown in the Source Data. p.i. - post-infection.
Discussion
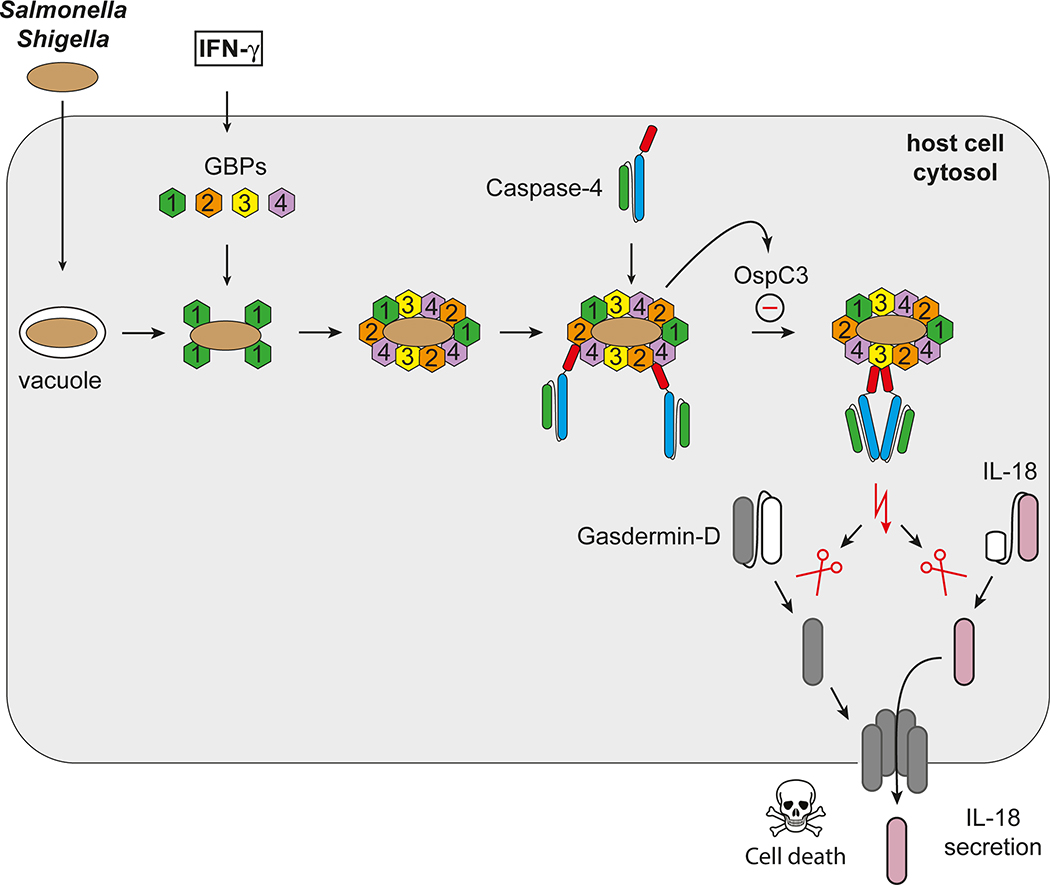
Signalling pathways often rely on endomembranes to provide anchoring points and to achieve high local concentrations of signaling components. The outer membrane of Gram-negative bacteria, as shown here, serves a similar purpose through GBP recruitment and the subsequent activation of CASP4 (Extended Data Fig. 10). The establishment of the GBP-derived signaling platform on the bacterial surface, as well as the recruitment and activation of CASP4, are controlled in a hierarchical manner, with upstream GBPs required for all subsequent steps. GBP1, the most upstream family member, is specifically needed to recruit GBP2, GBP3 and GBP4, i.e. to initiate platform formation. GBP2 and GBP4 are specifically required to recruit CASP4, whereas GBP3 controls its activity.
In contrast to purified LPS12, LPS as a constituent of the bacterial outer bacterial membrane does not activate CASP4, most likely because the membrane-embedded acyl chains of lipid A remain inaccessible to its ligand-binding CARD domain. GBPs, besides concentrating CASP4 in a highly relevant location, might also disturb the integrity of the bacterial outer membrane in order to provide CASP4 with access to otherwise hidden ligands. Further biochemical and structural work will be required to understand the process in more detail including the possible role of GTP hydrolysis for lipid extraction from the bacterial membrane.
Converting the bacterial surface into a polyvalent signaling platform for caspase activation results in pyroptosis and production of the pro-inflammatory cytokine IL-18, thereby destroying the replicative niche for intracellular bacteria and alerting neighboring cells to their presence. Bacteria inside pyroptotic cells remain contained in pore-induced intracellular traps until expelled from the tissue with their deceased host cell or phagocytosed and killed43,44. The dire consequences of pyroptosis for the cell may explain the need for the sequential and regulated nature of the GBP-CASP4 pathway, as it would allow multiple checkpoints before caspase activity is induced.
Methods
Plasmids, antibodies and reagents
M5P or closely related plasmids were used to produce recombinant MLV for the stable expression of proteins in mammalian cells45. Open reading frames encoding full-length caspases, Bcl2, BclxL, CrmA and GBP1–7 were amplified by PCR. Mutations and protein truncations were generated by PCR and verified by sequencing. For complementation of S. flexneri ΔospC3 ospC1–3 genes were amplified by PCR and cloned into pFPV25.1.
Antibodies were from Abcam (for western blots: β-actin ab8227, Galectin-8 ab183637, NDP52 ab68588), Cell Signaling Technology (Gasdermin-D 96458), Clontech (GFP JL8 632381), Enzo Life Science (Ubiquitin FK2 BML-PW8810), MBL (Caspase-4 4B9 M029–3, IL-18 PM014), Proteintech (FIP200 10043–2-AP, GBP1 15303–1-AP), R&D Systems (for IF: Galectin-8 AF1305), Santa Cruz Biotechnology (Caspase-1 C-20 sc-515, IRF-1 H-8 sc-74530, PCNA PC10 sc-56, STAT1 C-111 sc-417), Sigma (for IF: FLAG-tag M2 F1804, for western blots: FLAG-tag F7425), Thermo Fisher Scientific (Alexa-conjugated anti-mouse, anti-gout and anti-rabbit antisera) and Dabco (HRP-conjugated reagents). The antiserum against NDP52 used for immunofluorescence was a gift from J. Kendrick-Jones.
Cytokines (all from R&D Systems, apart from IFN-β1a from PBL) were added for 10–16 h before experiments at the following concentrations: IFN-γ 1ng/ml, IFN-β 100U/ml, TNFα 10ng/ml, IL1-β 10ng/ml and IL-22 10ng/ml.
Inhibitors were from Abcam (Nec-1s #ab221984), R&D Systems (Necrosulfonamide #5025, Z-VAD-FMK #FMK001), Selleck Chemicals (Carfilzomib S2853). FAM-VAD-FMK (#92) was from ImmunoChemistry Technologies, agonists from Innaxon (LPS from S. minnesota R60 (Ra) TLRpure Sterile Solution IAX-100–016, LPS from S. minnesota R5 (Rc) TLRpure Sterile Solution IAX-100–017, Lipid A from S. minnesota R595 (Re) TLRpure Sterile Solution IAX-100–001), InvivoGen (Pam3CSK4 tlrl-pms), Sigma (LPS Salmonella enterica serotype Typhimurium L6511, LPS Escherichia coli O127:B8 L2755, Lipoteichoic acid from Bacillus subtilis L3265, Mycolic acid from Mycobacterium tuberculosis M4537) and non-hydrolyzable GTP analogs from Abcam (GTP-γ-S ab146662, GppNHp ab146659, GppCp ab146660).
Cell culture
HeLa cells were obtained from the European Collection of Cell Culture ECACC No: 93021013. HeLa and 293ET cells, as well as all stable cell lines, were grown in IMDM supplemented with 10% FCS at 37 °C in 5% CO2. U937 cells were obtained from the Biological Resource Centre “Cellulonet” and grown in RPMI supplemented with 10% FCS. All cell lines tested negative for mycoplasma. Stable cell lines were generated by retroviral or lentiviral transduction and selected for by drug resistance.
Mice
Congenically-matched C57BL/6N wild-type and Caspase-11−/− mice were from The Jackson laboratory (Bar Harbor, MN). Gbp1−/− were generated as reported13 and backcrossed onto C57BL/6N for at least 12 generations (N12). Gbp2−/− mice were generated directly on a C57BL/6N background via CRISPR-Cas9 technology as described46 using the following Gbp2 loci sgRNAs: 5’ end, AGAGATGTGAGGATAAAGCA; 3’ end, TGGTGCTCATATCAAACCCG. Chromosomal disruption was validated by genomic sequencing. Complete loss of Gbp2 mRNA and protein expression was confirmed by qPCR and immunoblot using siRNA validated monospecific antibody13 (GBP2 M-15, sc-10588, Santa Cruz Biotechnology), respectively. All Shigella flexneri and Salmonella enterica serovar Typhimurium challenge experiments enlisted age- and sex-matched mice housed in the same specific-pathogen free (SPF) facility at Yale West Campus.
Human intestinal epithelial organoids
Ethical approval for this project was obtained from the local ethics committee (REC-17/EE/0265) and patients were recruited following informed consent. Intestinal biopsy samples were taken from the distal small bowel (i.e. terminal ileum (TI)) from patients undergoing routine endoscopy. All patients included had macroscopically and histologically normal mucosa. Biopsy samples were processed immediately and intestinal epithelial organoids generated from isolated crypts following an established protocol as described previously47. Organoids were typically grown for 7–9 days prior to passaging and once sufficiently expanded, were seeded for growth as a monolayer as described previously47. Briefly, 6.5 mm polycarbonate transwell inserts with 8 um pore size (Corning) were coated with collagen 2 h prior to cell seeding. Established intestinal organoids were washed with PBS containing 0.5 mM EDTA and dissociated in 0.5% Trypsin-EDTA. Trypsinization was inactivated by FBS and clumps of cells removed using a 40 μm cell strainer. Cells were seeded at 8 × 10⁴ per transwell and grown in proliferation medium. After 24 h, cells were maintained in differentiation medium48 and differentiation allowed to occur for 5 days prior to infection.
Bacterial infections and enumeration of intracellular bacteria
S. Typhimurium (strain 12023) was grown overnight in Luria broth (LB) and sub-cultured (1:33) in fresh LB for 3.5 h before infection. HeLa cells in 24-well plates were infected with 10–20 μl of such cultures for 15 min at 37 °C (MOI of 1:50 – 1:100). Following two washes with warm PBS and an incubation with 100 μg ml−1 gentamycin for 2 h cells were cultured in 20 μg ml−1 gentamycin.
S. flexneri (strain M90T 5a) was grown in tryptic soy broth (TSB) or on tryptic soy agar containing 0.003% Congo red. For infection S. flexneri was grown overnight in TSB and sub-cultured (1:100) in fresh TSB for 2.5 h. Such cultures were consecutively washed in PBS and re-suspended in antibiotic-free IMDM plus 10% FCS immediately before 100μl was used to infect HeLa cells in 24-well plates (MOI of 1:50). Samples were centrifuged for 10 min at 670g followed by incubation at 37 °C for 20 or 30 min. Following two washes with warm PBS, cells were cultured in 100 μg ml−1 gentamycin for 2 h and 20 μg ml−1 gentamycin thereafter.
To enumerate intracellular bacteria, cells from triplicate wells were lysed in 1 ml cold PBS containing 0.1% Triton-X-100. Serial dilutions were plated in duplicate on LB agar.
In vivo Shigella infection
For in vivo bacterial challenge, Shigella flexneri wild-type 5a strain M90T, ΔospC3 mutant, and ΔospC3+ospC3 complementation lines were grown in TSB broth at 37°C overnight and sub-cultured (1:100) in fresh TSB for 2.5 h before in vivo injection. Age- (6–12 weeks old) and gender-matched C57BL/6N wild-type, Gbp1−/−, Gbp2−/− and Caspase-11−/− mice were intraperitoneally injected with 8 × 10⁷ CFU of S. flexneri wild-type or mutant bacterial strains, respectively. Survival rate was monitored every 24 h up to 240 h. To measure bacterial burdens in organs, mice were peritoneally injected with 7.6 × 10⁷ CFU of bacteria, and spleen and liver tissue were isolated after 24 h post-infection. Isolated tissues were washed two times with 1 × cold PBS and homogenized. Tissue extracts were diluted with PBS and spread onto TSB agar plates. Bacteria colonies were counted and analyzed by automated colony counting (Scan 300, Interscience).
In vivo Salmonella infection
For in vivo bacterial challenge, Streptomycin-resistant Salmonella enterica serovar Typhimurium (strain 1344), were grown in LB broth at 37°C overnight and sub-cultured (1:30) in fresh LB for 2.5 h before in vivo injection. Age- (6–12 weeks old) and gender-matched C57BL/6N wild-type, Gbp1–/–, Gbp2–/– and Caspase-11–/– mice were intraperitoneally injected with 20mg/mouse of streptomycin for 24 h before a 7h fasting period, 10% sodium bicarbonate for 30 min and orogastric challenge with 7 × 10³ CFU of S. Typhimurium. Survival rate was monitored every 24 h up to 216 hr. To measure bacterial burdens in organs, mice were infected orogastrically with 7 × 10³ CFU of bacteria, and cecum tissue were isolated after 96 h post-infection according to Knodler et al.41 Isolated tissues were washed two times with 1 × cold PBS and homogenized. Tissue extracts were diluted with PBS and spread onto LB agar plates with stretomycin. Bacteria colonies were counted and analyzed by automated colony counting (Scan 300, Interscience).
Infection of human intestinal epithelial organoids
Monolayers of differentiated epithelial organoids were infected with Shigella flexneri from the basolateral side as described49. Briefly, medium in transwell-containing wells was changed to antibiotic-free differentiation medium the day before infection. Transwells were inverted on absorbent paper to remove excess medium and placed upside-down in 6-well plates. 15ul of washed Shigella flexneri culture was added to the upward-facing side of the transwell and incubated at 37 C for 1 h. The transwell was turned right was up and both exterior and interior chambers washed three times with warm PBS. Differentiation medium containing 100 ug/ml gentamicin was added and incubated further as required.
Cells infected with S. flexneri for 2 h were washed with PBS and either fixed in paraformaldehyde or incubated with Zombie Green (Biolegend; 1:500 in PBS), to label dead cells, at room temperature for 15 min. Cells were washed twice with PBS and fixed in 4% paraformaldehyde for 15 min followed by washing with PBS and processing for immunofluorescence with anti-ZO-1 antibody to visualize cell body (Catalog 40–2200, Thermo Fisher).
RNA interference
5 × 10⁴ cells per well were seeded in 24-well plates. The following day, cells were transfected with 40 pmol of Stealth RNAi™ siRNA or 6 pmol of Silencer™ Select siRNA (both Thermo Fisher Scientific) using Lipofectamine RNAiMAX (Thermo Fisher Scientific). Experiments were performed after 3 days. The non-targeting Stealth RNAi™ siRNA Negative Control Medium GC or Silencer™ Select Negative Control No. 1 siRNA were used as controls (both Thermo Fisher Scientific).
Stealth RNAi™ siRNA: siNDP52 (5’-UUCAGUUGAAGCAGCUCUGUCUCCC, custom design), siGAL8 #38 (#HSS106038), siFIP200 #03 (#HSS190643), siSTAT1 #73 (#HSS110273), siGBP1 #21 (#HSS104021), siGBP1 #49 (#HSS178149), siGBP2 #24 (#HSS104024), siGBP2 #25 (#HSS104025), siGBP3 #27 (#HSS104027), siGBP3 #28 (#HSS104028), siGBP4 #00 (#HSS133000), siGBP4 #12 (#HSS174412), siGBP5 #14 (#HSS174414), siGBP5 #15 (#HSS174414);
Silencer™ Select siRNA: siCASP1 #08 (#s2408), siCASP4 #14 (#s2414), siCASP5 #17 (#s2417), siCASP5 #23 (#s229323), siGSDMD #39 (#s36339), siGSDMD #40 (#s36340), siIRF1 #02 (#s7502), siIRF1 #03 (#s7503).
To render Caspase-4 resistant to siCASP4 #14 and GBP1 resistant to siGBP1 #49, silent mutations (underlined) CTGCGCTTGTGCAAGGAGCGC and GAAGCTATCGAGGTGTTTATTCGCTC, respectively, were introduced by PCR and confirmed by sequencing.
CRISPR Cas9-mediated gene knockout
For HeLa knockouts, oligonucleotides (Sigma) for the sgRNA were phosphorylated with T4 PNK (NEB), annealed by heating to 95 °C and subsequently cooled down slowly to room temperature. Hybridized oligonucleotides were cloned into the lentiviral sgRNA expression vector pKLV-U6gRNA(BbsI)-PGKpuro2ABFP (Addgene 50946). HeLa cells were constructed to stably express Cas9 through lentiviral transduction of vector pHRSIN-Psffv-Cas9-Ppgk-Hygro and hygromycin selection. Subsequently, sgRNA containing vector was introduced by transduction and puromycin selection. The resulting mixed knockout populations were used to generate single-cell clones by limiting dilution. Gene disruption was validated by immunoblotting using corresponding antibodies.
sgRNA: CASP1 (GTTCATGTCTCATGGTATTC), CASP4 (GAGAAACAACCGCACACGCC), GSDMD (GCATGGGGTCGGCCTTTGAG), GBP1 (GAACACTAATGGGCGACTGA).
For U937, knock-out cell lines were generated in a Cas9-expressing U937 clone obtained by transduction with the plasmid LentiCas9-Blast (from Feng Zhang; Addgene plasmid # 52962). A clone strongly expressing Cas9 was selected based on Western blot analysis using anti-Cas9 antibody (Millipore; # MAC133; 1:1000 dilution). sgRNAs for all the genes targeted were cloned into the pKLV-U6gRNA(BbsI)-PGKpuro2ABFP vector (from Kosuke Yusa; Addgene plasmid # 50946). Lentiviral particles were produced in 293T cells using pMD2.G and psPAX2 (from Didier Trono, Addgene plasmids #12259 and #12260), and pKLV-U6gRNA(BbsI)-PGKpuro2ABFP. U937 Cas9+ cells were transduced by spinoculation. A polyclonal population was selected using puromycin treatment. Gene invalidation was verified by Western blot analysis (GBP1 Abcam EPR8285 ab131255, GBP2 Novus OTI5C8 NBP1–47768, Actin Sigma AC-40 A3853) or using TIDE software following GBP3 locus sequencing50.
sgRNA: GBP1_S1 (TCCTATGCTATTGTACACGA)
GBP1_S2 (TTTAGTGTGAGACTGCACCG)
GBP2_S1 (GGGCCCGGCAAGTTGATCTC)
GBP2_S2 (TCCCATGCTATTGTACACGA)
GBP3_S1 (ACTCTCGTGTACAATAGCAT)
GBP3_S2 (TATTCCCTGAAGCTAACGCA).
Microscopy
HeLa cells were grown on glass cover slips before infection. After infection, cells were washed twice with warm PBS and fixed in 4% paraformaldehyde for 20 min. Cells were washed twice in PBS and then simultaneously permeabilised and blocked in PBSB (PBS, 0.1% saponin, 2% BSA). Coverslips were incubated with primary followed by secondary antibodies for 1 h in PBSB. Samples were mounted either in mounting medium with DAPI (4’,6-diamidino-2-phenylindole) or Prolong Antifade mounting medium for confocal imaging and super resolution microscopy, respectively. Marker positive bacteria were scored by eye amongst at least 100 bacteria per coverslip.
Confocal images were taken with a 63x/1.4 numerical aperture (NA) oil immersion lens on a Zeiss 780 microscope.
Live imaging was performed on a Nikon Eclipse Ti equipped with an Andor Revolution XD system and a Yokogawa CSU-X1 spinning disk unit using a 63x/1.4 NA water immersion lens.
Super resolution images were acquired using an Elyra S1 structured illumination microscope (Carl Zeiss Microscopy Ltd, Cambridge, UK). The system has four laser excitation sources (405nm, 488nm, 561nm and 640nm) with fluorescence emission filter sets matched to these wavelengths. SIM Images were obtained using a 63x/1.4 NA oil immersion lens with grating projections at 5 rotations and 5 phases in accordance with the manufacturer’s instructions. The number of Z planes varied with sample thickness. Super resolution images were calculated from the raw data using Zeiss ZEN software.
High Content Analysis microscopy was performed on a Nikon Eclipse Ti equipped with Andor Neo sCMOS camera. HCA wide field images were taken with a 20x/0.75 NA air lens on an inverted microscope using μ-Plate 24-well ibiTreat (Ibidi). PI positive nuclei were identified using General Analysis module in Nikon NIS-Elements HC Software.
In vitro pulldown
1.5 × 10⁷ HeLa cells expressing FLAG-tagged proteins were scraped, washed with PBS and lysed at 4 °C in the lysis buffer (50mM Tris-HCl pH=7.4, 150mM NaCl, 5 mM MgCl2, 100 μg ml−1 Digitonin (Sigma, D141), complete Mini EDTA free protease inhibitor (Roche). 1× 10⁷ U937 cells expressing FLAG-tagged proteins were pelleted, washed twice with PBS and lysed at 4 °C in the lysis buffer. Post-nuclear supernatants were obtained by centrifugation at 6000 g for 10 min at 4 °C. Cell lysate was incubated with 10 μg ml−1 of LPS or other agonist, 200 μM GDP (Sigma, G7127), 300 μM AlCl3 and 10 mM NaF for 2h at room temperature with rotation. Flag-tagged proteins were pulled down using Anti-DYKDDDDK Magnetic Agarose (Pierce, A36797) for 1 h at 4 °C. Following four washes with wash buffer (50mM Tris-HCl pH=7.4, 150mM NaCl, 5 mM MgCl2, 100 μg ml−1 Digitonin, 200 μM GDP, 300 μM AlCl3, 10 mM NaF) Flag-tagged proteins were eluted with 3x DYKDDDDK Peptide (Pierce, A36805). After addition of SDS loading buffer samples were separated on 4–12% denaturing Bis-Tris gels (Thermo Fisher Scientific).
Western blot
Post-nuclear supernatants from HeLa cells were obtained following lysis (150 mM NaCl, 0.1% Triton-X-100, 10 mM Tris-HCl pH 7.4, protease inhibitors). After addition of SDS loading buffer samples were separated on 4–12% denaturing Bis-Tris gels (Thermo Fisher Scientific). Visualization following immunoblotting was performed using ECL detection reagents (Amersham Bioscience).
ELISA
To measure secreted IL-18 from S. flexneri infected cells, supernatant from duplicate wells (1 ml/24 well) was harvested 1 h post-infection, cleared by centrifugation and stored in −80 °C. Measurement of IL-18 in the supernatant was performed using MBL Human IL-18 ELISA Kit (#7620) according to the manufacturer’s instructions.
Transformation of S. flexneri
A Tryptic Soy Broth (TSB) overnight culture was diluted 1:100 in 10 ml of TSB and grown at 37 °C to an OD600 of 0.6 to 0.8. Bacteria were cooled on ice for 10 min, centrifuged (4300 g × 4 min, 4 °C) and washed once in 10 ml then twice in 1 ml of ice cold electroporation buffer (1 mM MOPS, 20% glycerol, pH 7.2). Bacteria were pelleted a final time, resuspended in 100 μl of buffer and mixed with 150 ng of plasmid DNA. The mixture was electroporated in a chilled 2mm cuvette (Flowgen Bioscience) using 2,500V, 600 Ω and 10 μF. Electroporated bacteria were regenerated for 1 h at 37 °C in 1 ml of Super Optimal Broth (SOB) medium and plated on TSB agar supplemented with Ampicillin (100 μg ml−1) and Congo red (0.003%).
S. flexneri ospC1–3 mutants were constructed as described previously51.
Quantification and statistical analysis
All data were tested for statistical significance with Prism software (GraphPad Prism 7 and 8). The unpaired two-tailed Student’s t test was used to test whether two samples originate from the same population. Differences between more than two samples were tested using a one-way (for one variable) or a two-way (for two variables) analysis of variance (ANOVA). Either Dunnett’s multiple comparison test (to compare all samples against a control) or Tukey’s multiple comparison test (to compare all samples against each other) was applied. Mice survival fractions were estimated from Kaplan-Meier plots with uncertainty set at 95% confidence intervals computed by the log-log transform (or exponential Greenwood formula) with a two-sided Log-rank P value using the Mantel-Cox test. Performed tests are indicated in Figure Legends. Unless otherwise stated, all experiments were performed at least three times and the data were combined for presentation as a mean ± SEM. All differences not specifically indicated as significant were not significant (ns, p > 0.05). Significant values are indicated as ∗, p < 0.05; ∗∗, p < 0.01. Statistical details, including sample size (n), are reported in the Figures and Figure Legends. Exact p values are provided in Supplementary Table 1.
Microscopy: For scoring marker positive bacteria at least three independent experiments with three replicates (i.e. triplicate coverslips) each were performed. Bacteria were scored by visual enumeration as n > 100 (for 1 h p.i.), n > 200 (for >= 2 h p.i.) bacteria per replicate. Graphs show mean ± SEM.
Cell death (propidium iodide nuclei stain): For scoring cell death at least three independent experiments were performed. PI positive nuclei were identified using General Analysis module in Nikon NIS-Elements HC Software and an average from 16 images per sample was calculated. Graphs show mean ± SEM.
Scoring Intracellular Bacteria: To score bacterial burdens, cells from triplicate wells were lysed and bacteria were plated in duplicate on LB agar. Each experiment was performed at least three times. Bacterial colonies were counted using the aCOLyte3 system (Synbiosis). Graphs show mean ± SEM. Significance shown for the latest time point.
Reporting summary
Further information on research design is available in the Nature Research Reporting Summary linked to this article.
Data Availability
All data generated or analysed during this study are included in this published article (and its supplementary information files). The source data that support the findings of this study are available from the corresponding author upon reasonable request.
Extended Data
Extended Data Fig. 1. IFN-γ prevents proliferation of cytosol-invading S. Typhimurium.
a, Lysates of HeLa cells treated with the indicated siRNAs. Blots were probed with the indicated antibodies, PCNA – loading control.
b, Colony-forming units (CFU) of S. Typhimurium in HeLa cells at 1h p.i..
c, Fold replication of S. Typhimurium ΔprgH +inv in HeLa cells.
d, Confocal micrographs of HeLa cells infected with S. Typhimurium taken at 1 h p.i. stained with DAPI and antibodies against Galectin-8 and ubiquitin (FK2 antibody) (top panel) or over-expressing GFP::LC3C and stained with DAPI and antibody against NDP52 (bottom panel).
e, Percentage of Annexin V positive Hela cells expressing CFP::Galectin-8 amongst cells harbouring intracellular S. Typhimurium. Negative or positive – none or at least one bacterium per cell positive for CFP::Galectin-8. Live imaged every 6 min for 6 h, 12 fields per condition.
f, Percentage of PI positive nuclei in HeLa cells infected with S. Typhimurium at 2h p.i.. Cells were treated with DMSO, 50 μM NEC-1s, 10 μM NSA or 50 μM Z-VAD-FMK as indicated.
g, Confocal micrograph of HeLa cells infected with S. Typhimurium in the presence of FAM-VAD-FMK and stained with DAPI and antibody against Galectin-8. Image taken at 90 min p.i..
Statistical significance was assessed by two-tailed unpaired Student’s t-test (b), one-way (e,f) or two-way (c) analysis of variance (ANOVA) with Tukey’s multiple comparisons test; ns, not significant, **P < 0.01 (exact p values are provided in Supplementary Table 1). Data are expressed as the Mean ± SEM of three (c,e,f) or five (b) independent experiments, or representative of two (a) or three (d,g) independent experiments.
HeLa cells were treated with IFN-γ (g) or treated with IFN-γ as indicated (a-c,e,f). Bacteria were counted based on their ability to grow on agar plates (b,c). Scale bar, 10 μm (d,g). Uncropped blots (a) are shown in the Source Data. PI - propidium iodide, p.i. - post-infection, S.T. - S. Typhimurium.
Extended Data Fig. 2. Cytosol-invading bacteria recruit caspase-4.
a, Confocal micrographs of HeLa cells over-expressing GFP::Caspase-4 or −5 at 1 h p.i. with S. Typhimurium and stained with DAPI. Scale bar, 10 μm.
b,f,g, Lysates of HeLa cells expressing the indicated GFP::Caspase constructs (b), of cells treated with the indicated siRNAs (f), or of the indicated control or knock-out cells (g). Blots were probed with indicated antibodies, PCNA (b,f), Actin (g) – loading control. Samples in Extended Data Fig. 2g, Fig. 2p and Fig. 8c were obtained from the same experiment.
c,d, Percentage of S. Typhimurium positive for the indicated GFP::Caspase constructs (c) or staining positive for endogenous Galectin-8 and/or Caspase-4 (d) in HeLa cells at 1 h p.i.. n > 100 bacteria per coverslip, in triplicate.
e, Percentage of FAM-VAD-FMK positive S. Typhimurium amongst bacteria staining positive for endogenous Galectin-8 at 90 min p.i. in HeLa cells treated with siRNAs against caspases as indicated. n > 100 Galectin-8 +ve bacteria per coverslip, in triplicate.
h, Percentage of PI positive nuclei in the indicated control or knock-out HeLa cells uninfected or infected with S. Typhimurium at 2h p.i..
i, Fold replication of S. Typhimurium in HeLa cells treated with the indicated siRNAs against caspases. Bacteria were counted based on their ability to grow on agar plates.
Statistical significance was assessed by one-way (e,h) or two-way (i) analysis of variance (ANOVA) with Tukey’s multiple comparisons test; ns, not significant, **P < 0.01 (exact p values are provided in Supplementary Table 1). Data are expressed as the Mean ± SEM of three (c,d,e,i) independent experiments, or representative of two (b,f,g) or three (a) independent experiments.
HeLa cells were treated with IFN-γ (c) or treated with IFN-γ as indicated (a,d-i). Uncropped blots (b,f,g) are shown in the Source Data. PI - propidium iodide, p.i. - post-infection, +ve – positive.
Extended Data Fig. 3. The S. flexneri effector OspC3 inhibits interferon-induced pyroptosis.
a, PI positive nuclei in HeLa cells infected with the indicated S. flexneri strains at 2h p.i..
b, Percentage of PI positive nuclei in CFP::Galectin-8 expressing HeLa cells infected with the indicated S. flexneri strains in the presence of PI. n = three (WT) and four (ΔospC3) independent repeats. Live imaged every 5 min for 5 h, 10 fields per condition.
c, Percentage of Zombie Green positive (i.e. dead) cells in monolayers of differentiated human epithelial organoids at 2 h p.i. with the indicated S. flexneri strains. n > 50 infected cells per coverslip.
d, Confocal micrograph of a monolayer of differentiated human epithelial organoids stained with Zombie Green and antibody against ZO-1 at 1 h p.i. with the indicated S. flexneri strains. Scale bar, 10 μm.
e,f, Fold replication of the indicated S. flexneri strains in HeLa cells. Bacteria were counted based on their ability to grow on agar plates.
Statistical significance was assessed by one-way (a,b) or two-way (e,f) analysis of variance (ANOVA) with Tukey’s multiple comparisons test; ns, not significant, **P < 0.01 (exact p values are provided in Supplementary Table 1). Data are expressed as the Mean ± SEM of three (a,b,e,f) or four (b) independent experiments, or representative of two (d) independent experiments.
HeLa cells were treated with IFN-γ as indicated (a-f). PI - propidium iodide, p.i. - post-infection.
Extended Data Fig. 4. Cytosol-invading bacteria trigger caspase-4 and gasdermin-D dependent pyroptosis.
a,b,g, Fold replication of S. flexneri ΔospC3 in HeLa cells treated with the indicated siRNAs against caspases (a) and in control or knock-out HeLa cells (b, g). Bacteria were counted based on their ability to grow on agar plates.
c, d, Lysates of HeLa cells at 1 h p.i. with the indicated S. flexneri strains. Pro - full length pro-form of GSDMD (shorter exposure), NT - N-terminal domain of GSDMD (longer exposure). Samples in Extended Data Fig. 4c,d and Extended Data Fig. 9a,c were obtained from the same experiment.
e,h, Lysates of HeLa cells treated with the indicated siRNAs. * unspecific band.
f, PI positive nuclei in the indicated control or knock-out HeLa cells at 2 h p.i. with S. flexneri ΔospC3.
Statistical significance was assessed by one-way (f) or two-way (a,b,g) analysis of variance (ANOVA) with Tukey’s multiple comparisons test; ns, not significant, **P < 0.01 (exact p values are provided in Supplementary Table 1). Data are expressed as the Mean ± SEM of three (b,g,f) or four (a) independent experiments, or representative of two (e,h) or three (c,d) independent experiments.
HeLa cells were treated with IFN-γ as indicated (a-h). Blots were probed with indicated antibodies, PCNA (e,h), Actin (c,d) – loading control. Uncropped blots (c-e,h) are shown in the Source Data. PI - propidium iodide, p.i. - post-infection.
Extended Data Fig. 5. GBP1 recruits GBP2–4 to S. Typhimurium.
a,b, Lysates of HeLa cells treated with the indicated siRNAs (a), or from the indicated control or knock-out cells (b). Blots were probed with indicated antibodies, PCNA (a), Actin (b) – loading control. Samples in Extended Data Fig. 5b, Extended Data Fig. 8c and Extended Data Fig. 9f were obtained from the same experiment.
c, Percentage of S. Typhimurium positive for the indicated GFP::GBP constructs at 1 h p.i. in the indicated control or knock-out HeLa cells. n > 100 bacteria per coverslip, in triplicate.
d, Structured illumination micrograph of HeLa cells expressing GFP::GBP1 and antibody-stained for Galectin-8 at 1 h p.i. with S. Typhimurium. Scale bar, 1 μm.
Statistical significance was assessed by one-way analysis of variance (ANOVA) with Tukey’s multiple comparisons test (c); ns, not significant, **P < 0.01 (exact p values are provided in Supplementary Table 1). Data are expressed as the Mean ± SEM of three (c) independent experiments, or representative of two (a,b) or three (d) independent experiments.
HeLa cells were treated with IFN-γ (c,d) or treated with IFN-γ as indicated (b). Uncropped blots (a,b) are shown in the Source Data. p.i. - post-infection.
Extended Data Fig. 6. GBPs target cytosol-invading S. Typhimurium.
Confocal micrographs of HeLa cells over-expressing GFP::GBP1–7 and stained with DAPI and antibody against NDP52 at 1 h p.i. with S. Typhimurium. Representative of three independent experiments. Scale bar, 10 μm.
Extended Data Fig. 7. GBPs recruit and activate caspase-4.
a, Percentage of S. Typhimurium positive for GFP::GBP1–4 and/or staining positive for endogenous Caspase-4 in HeLa cells at 1 h p.i.. n > 100 bacteria per coverslip, in triplicate.
b,e, Percentage of endogenous Caspase-4 (b) or FAM-VAD-FMK (e) positive S. Typhimurium amongst bacteria staining positive for endogenous Galectin-8 in the indicated control or knock-out HeLa cells at 1h (b) or 90 min (e) p.i.. n > 100 Galectin-8 +ve bacteria per coverslip, in triplicate.
c,f Percentage of endogenous Caspase-4 (c) or FAM-VAD-FMK (f) positive bacteria of the indicated S. flexneri strains in HeLa cells at 1 h p.i.. n > 100 bacteria per coverslip, in triplicate.
d, Confocal micrograph of a monolayer of differentiated human epithelial organoids antibody-stained for GBP1 and Caspase-4 at 1 h p.i. with S. flexneri ΔipaH9.8.
g, Confocal micrographs of HeLa cells treated with DMSO or Carfilzomib as indicated at 1h p.i. with S. flexneri ΔospC3 in the presence of FAM-VAD-FMK and stained with DAPI.
h-j, Percentage of FAM-VAD-FMK positive S. flexneri ΔospC3 ΔipaH9.8 (h, j) or S. flexneri ΔospC3 (i) at 1 h p.i. in the indicated control or knock-out HeLa cells (h,j) or in HeLa cells treated with the indicated siRNAs against caspases and 1 μM Carfilzomib (i). n > 100 bacteria per coverslip, in triplicate.
Statistical significance was assessed by one-way analysis of variance (ANOVA) with Tukey’s multiple comparisons test (b,c,e,f,h-j); ns, not significant, **P < 0.01 (exact p values are provided in Supplementary Table 1). Data are expressed as the Mean ± SEM of three (a-c,e,f,h-j) independent experiments, or representative of two (d,g) independent experiments.
HeLa cells were treated with IFN-γ (a,b,d,e,g,h) or treated with IFN-γ as indicated (c,f,i,j). Cells were treated with DMSO or 1 μM Carfilzomib as indicated (c,f,g). Scale bar, 10 μm (d,g). p.i. - post-infection, +ve – positive.
Extended Data Fig. 8. GBPs govern gasdermin-D dependent pyroptosis.
a,b, Percentage of FAM-VAD-FMK positive cells among HeLa cells containing S. Typhimurium positive for endogenous Galectin-8 at 90 min p.i. (a) or containing S. flexneri ΔospC3 at 1 h p.i. (b); cells treated with siRNAs against GBPs as indicated. n > 100 cells with Galectin-8 +ve bacteria (a) or n > 100 infected cells (b) per coverslip, in triplicate.
c, Lysates of the indicated control or knock-out HeLa cells infected with S. flexneri ΔospC3 for 1h. Pro - full length pro-form of GSDMD (shorter exposure), NT - N-terminal domain of GSDMD (longer exposure). Samples in Extended Data Fig. 8c, Extended Data Fig. 5b and Extended Data Fig. 9f were obtained from the same experiment.
d,e, Percentage of PI positive nuclei in the indicated control or knock-out HeLa cells at 2 h p.i. with S. Typhimurium (e) or S. flexneri ΔospC3 (d).
f, Lysates of the indicated control or knock-out U937 cells.
g, Sanger sequencing chromatogram of control and GBP3 knock-out U937 cells.
Statistical significance was assessed by one-way analysis of variance (ANOVA) with Tukey’s multiple comparisons test (a,b,d,e); ns, not significant, **P < 0.01 (exact p values are provided in Supplementary Table 1). Data are expressed as the Mean ± SEM of three (b,d,e) or four (a) independent experiments, or representative of two (c,f) independent experiments.
HeLa cells were treated with IFN-γ as indicated (a-f). Blots were probed with indicated antibodies, Actin – loading control (c,f). Uncropped blots (c,f) are shown in the Source Data. PI - propidium iodide, p.i. - post-infection, +ve – positive. S. T - S. Typhimurium.
Extended Data Fig. 9. Processing and secretion of IL-18 during S. flexneri infection.
a,c, Lysates of HeLa cells prepared at 1 h p.i. with the indicated S. flexneri strains. Samples in Extended Data Fig. 9a,c and Extended Data Fig. 4c,d were obtained from the same experiment.
b,d, Release of IL-18 from HeLa cells infected with the indicated S. flexneri strains for 1h.
e, Lysates of HeLa cells expressing the indicated FLAG-tagged caspase alleles and treated with the indicated siRNAs prepared at 1 h p.i. with S. flexneri ΔospC3.
f, Lysates of the indicated control or knock-out HeLa cells prepared at 1 h p.i. with S. flexneri ΔospC3. Samples in Extended Data Fig. 9f, Extended Data Fig. 5b and Extended Data Fig. 8c and were obtained from the same experiment.
g, Release of IL-18 from the indicated control or knock-out HeLa cells infected with S. flexneri ΔospC3 for 1h.
Statistical significance was assessed by one-way analysis of variance (ANOVA) with Tukey’s multiple comparisons test (b,d,g); ns, not significant, *P < 0.05, **P < 0.01 (exact p values are provided in Supplementary Table 1). Data are expressed as the Mean ± SEM of three (b,d,g) independent experiments, or representative of two (e,f) or three (a,c) independent experiments.
HeLa cells were treated with IFN-γ as indicated (a-g). Blots were probed with indicated antibodies, Actin – loading control (a,c,e,f). Uncropped blots (a,c,e,f) are shown in the Source Data.
Extended Data Fig. 10. Schematic illustration of the GBP-CASP4 pathway.
Interferon-induced guanylate-binding proteins (GBPs) transform Gram-negative bacteria into a caspase activation platform by coating their surface with a polyvalent protein array. The bacterial GBP coat may serve to foster contacts between CASP4 and its microbial ligand, the hydrophobic lipid A moiety of LPS, an integral and otherwise inaccessible component of the bacterial outer membrane. GBPs control CASP4 activation in a hierarchical manner; GBP1 initiates platform assembly, GBP2 and GBP4 control CASP4 recruitment, whereas GBP3 governs CASP4 activation. Once activated CASP4 cleaves GSDMD and IL-18 to cause pyroptotic cell death and cytokine release, thereby destroying the bacterial niche and alerting neighbouring cells of imminent danger. The cytosol-adapted bacterium Shigella flexneri antagonizes the pathway through secretion of the CASP4 inhibitor OspC3.
Supplementary Material
Acknowledgements
We thank J. Kendrick Jones (MRC Laboratory of Molecular Biology, Cambridge) for providing antiserum against NDP52. This work was supported by the MRC (U105170648) and the Wellcome Trust (WT104752MA) to F.R; NIH National Institutes of Allergy and Infectious Diseases (R01AI068041-13, R01AI108834-05) to J.D.M. J. D. M is an Investigator of the Howard Hughes Medical Institute.
Footnotes
Competing interests
The authors declare no competing interests
References
- 1.Poltorak A. et al. Defective LPS signaling in C3H/HeJ and C57BL/10ScCr mice: mutations in Tlr4 gene. Science 282, 2085–2088 (1998). [DOI] [PubMed] [Google Scholar]
- 2.Takeuchi O & Akira S Pattern recognition receptors and inflammation. Cell 140, 805–20 (2010). [DOI] [PubMed] [Google Scholar]
- 3.Park BS et al. The structural basis of lipopolysaccharide recognition by the TLR4-MD-2 complex. Nature 458, 1191–5 (2009). [DOI] [PubMed] [Google Scholar]
- 4.Hagar JA, Powell DA, Aachoui Y, Ernst RK & Miao EA Cytoplasmic LPS activates caspase-11: implications in TLR4-independent endotoxic shock. Science 341, 1250–1253 (2013). [DOI] [PMC free article] [PubMed] [Google Scholar]
- 5.Shi J et al. Inflammatory caspases are innate immune receptors for intracellular LPS. Nature 514, 187–192 (2014). [DOI] [PubMed] [Google Scholar]
- 6.Kayagaki N et al. Noncanonical inflammasome activation by intracellular LPS independent of TLR4. Science 341, 1246–1249 (2013). [DOI] [PubMed] [Google Scholar]
- 7.Aachoui Y et al. Caspase-11 protects against bacteria that escape the vacuole. Science 339, 975–978 (2013). [DOI] [PMC free article] [PubMed] [Google Scholar]
- 8.Kayagaki N et al. Caspase-11 cleaves gasdermin D for non-canonical inflammasome signalling. Nature 526, 666–671 (2015). [DOI] [PubMed] [Google Scholar]
- 9.Kayagaki N et al. Non-canonical inflammasome activation targets caspase-11. Nature 479, 117–121 (2011). [DOI] [PubMed] [Google Scholar]
- 10.Shi J et al. Cleavage of GSDMD by inflammatory caspases determines pyroptotic cell death. Nature 526, 660–665 (2015). [DOI] [PubMed] [Google Scholar]
- 11.Broz P & Dixit VM Inflammasomes: mechanism of assembly, regulation and signalling. Nat Rev Immunol 16, 407–420 (2016). [DOI] [PubMed] [Google Scholar]
- 12.Shi J et al. Inflammatory caspases are innate immune receptors for intracellular LPS. Nature 514, 187–192 (2014). [DOI] [PubMed] [Google Scholar]
- 13.Kim BH et al. A Family of IFN- -Inducible 65-kD GTPases Protects Against Bacterial Infection. Science 332, 717–721 (2011).21551061 [Google Scholar]
- 14.Martens S & Howard J The Interferon-Inducible GTPases. Annu Rev Cell Dev Bi 22, 559–589 (2006). [DOI] [PubMed] [Google Scholar]
- 15.Tretina K, Park E-S, Maminska A & MacMicking JD Interferon-induced guanylate-binding proteins: Guardians of host defense in health and disease. J Exp Medicine 216, 482–500 (2019). [DOI] [PMC free article] [PubMed] [Google Scholar]
- 16.Pilla DM et al. Guanylate binding proteins promote caspase-11-dependent pyroptosis in response to cytoplasmic LPS. Proceedings of the National Academy of Sciences of the United States of America 111, 6046–6051 (2014). [DOI] [PMC free article] [PubMed] [Google Scholar]
- 17.Santos JC et al. LPS targets host guanylate-binding proteins to the bacterial outer membrane for non-canonical inflammasome activation. The EMBO Journal 37, e98089 (2018). [DOI] [PMC free article] [PubMed] [Google Scholar]
- 18.Meunier E et al. Caspase-11 activation requires lysis of pathogen-containing vacuoles by IFN-induced GTPases. Nature 1–17 (2014) doi: 10.1038/nature13157. [DOI] [PubMed] [Google Scholar]
- 19.Fisch D et al. Human GBP1 is a microbe-specific gatekeeper of macrophage apoptosis and pyroptosis. The EMBO Journal 38, e100926–19 (2019). [DOI] [PMC free article] [PubMed] [Google Scholar]
- 20.Man SM et al. IRGB10 Liberates Bacterial Ligands for Sensing by the AIM2 and Caspase-11-NLRP3 Inflammasomes. Cell 167, 382–396.e17 (2016). [DOI] [PMC free article] [PubMed] [Google Scholar]
- 21.Bekpen C et al. The interferon-inducible p47 (IRG) GTPases in vertebrates: loss of the cell autonomous resistance mechanism in the human lineage. Genome Biology 6, R92 (2005). [DOI] [PMC free article] [PubMed] [Google Scholar]
- 22.Mitchell G & Isberg RR Innate Immunity to Intracellular Pathogens: Balancing Microbial Elimination and Inflammation. Cell Host and Microbe 22, 166–175 (2017). [DOI] [PMC free article] [PubMed] [Google Scholar]
- 23.Matsuzawa-Ishimoto Y, Hwang S & Cadwell K Autophagy and Inflammation. Annual Review of Immunology 36, 73–101 (2018). [DOI] [PubMed] [Google Scholar]
- 24.Thurston TLM, Wandel MP, Muhlinen von N, Foeglein A & Randow F Galectin 8 targets damaged vesicles for autophagy to defend cells against bacterial invasion. Nature 482, 414–418 (2012). [DOI] [PMC free article] [PubMed] [Google Scholar]
- 25.Thurston TLM, Ryzhakov G, Bloor S, Muhlinen von N & Randow F The TBK1 adaptor and autophagy receptor NDP52 restricts the proliferation of ubiquitin-coated bacteria. Nature Immunology 10, 1215–1221 (2009). [DOI] [PubMed] [Google Scholar]
- 26.Thurston TL et al. Recruitment of TBK1 to cytosol-invading Salmonellainduces WIPI2-dependent antibacterial autophagy. The EMBO Journal 35, e201694491 (2016). [DOI] [PMC free article] [PubMed] [Google Scholar]
- 27.Ravenhill BJ et al. The Cargo Receptor NDP52 Initiates Selective Autophagy by Recruiting the ULK Complex to Cytosol-Invading Bacteria. Mol Cell 74, 320–329.e6 (2019). [DOI] [PMC free article] [PubMed] [Google Scholar]
- 28.Radtke AL, Delbridge LM, Balachandran S, Barber GN & O’riordan MXD TBK1 Protects Vacuolar Integrity during Intracellular Bacterial Infection. PLoS Pathogens 3, e29 (2007). [DOI] [PMC free article] [PubMed] [Google Scholar]
- 29.Isberg RR & Falkow S A single genetic locus encoded by Yersinia pseudotuberculosis permits invasion of cultured animal cells by Escherichia coli K-12. Nature 317, 262–264 (1985). [DOI] [PubMed] [Google Scholar]
- 30.Isberg RR, Voorhis DL & Falkow S Identification of invasin: A protein that allows enteric bacteria to penetrate cultured mammalian cells. Cell 50, 769–778 (1987). [DOI] [PubMed] [Google Scholar]
- 31.Perrin A, Jiang X, Birmingham C, So N & Brumell J Recognition of Bacteria in the Cytosol of Mammalian Cells by the Ubiquitin System. Current Biology 14, 806–811 (2004). [DOI] [PubMed] [Google Scholar]
- 32.Muhlinen N. von et al. LC3C, Bound Selectively by a Noncanonical LIR Motif in NDP52, Is Required for Antibacterial Autophagy. Molecular Cell 48, 329–342 (2012). [DOI] [PMC free article] [PubMed] [Google Scholar]
- 33.Kobayashi T et al. The Shigella OspC3 Effector Inhibits Caspase-4, Antagonizes Inflammatory Cell Death, and Promotes Epithelial Infection. Cell Host and Microbe 13, 570–583 (2013). [DOI] [PubMed] [Google Scholar]
- 34.Briken V et al. Interferon regulatory factor 1 is required for mouse Gbp gene activation by gamma interferon. Molecular and cellular biology 15, 975–982 (1995). [DOI] [PMC free article] [PubMed] [Google Scholar]
- 35.Li P et al. Ubiquitination and degradation of GBPs by a Shigella effector to suppress host defence. Nature 551, 378–383 (2017). [DOI] [PubMed] [Google Scholar]
- 36.Wandel MP et al. GBPs Inhibit Motility of Shigella flexneri but Are Targeted for Degradation by the Bacterial Ubiquitin Ligase IpaH9.8. Cell Host and Microbe 22, 507–518.e5 (2017). [DOI] [PMC free article] [PubMed] [Google Scholar]
- 37.Piro AS et al. Detection of Cytosolic Shigella flexneri via a C-Terminal Triple-Arginine Motif of GBP1 Inhibits Actin-Based Motility. mBio 8, e01979–17 (2017). [DOI] [PMC free article] [PubMed] [Google Scholar]
- 38.Kane CD, Schuch R, Day WA & Maurelli AT MxiE Regulates Intracellular Expression of Factors Secreted by the Shigella flexneri 2a Type III Secretion System. Journal of bacteriology 184, 4409–4419 (2002). [DOI] [PMC free article] [PubMed] [Google Scholar]
- 39.Ghosh A, Praefcke GJK, Renault L, Wittinghofer A & Herrmann C How guanylate-binding proteins achieve assembly-stimulated processive cleavage of GTP to GMP. Nature 440, 101–104 (2006). [DOI] [PubMed] [Google Scholar]
- 40.Prakash B, Praefcke GJ, Renault L, Wittinghofer A & Herrmann C Structure of human guanylate-binding protein 1 representing a unique class of GTP-binding proteins. Nature 403, 567–571 (2000). [DOI] [PubMed] [Google Scholar]
- 41.Knodler LA et al. Noncanonical Inflammasome Activation of Caspase-4/Caspase-11 Mediates Epithelial Defenses against Enteric Bacterial Pathogens. Cell Host and Microbe 16, 249–256 (2014). [DOI] [PMC free article] [PubMed] [Google Scholar]
- 42.Ramirez MLG et al. Extensive peptide and natural protein substrate screens reveal that mouse caspase-11 has much narrower substrate specificity than caspase-1. J Biol Chem 293, 7058–7067 (2018). [DOI] [PMC free article] [PubMed] [Google Scholar]
- 43.Jorgensen I, Zhang Y, Krantz BA & Miao EA Pyroptosis triggers pore-induced intracellular traps (PITs) that capture bacteria and lead to their clearance by efferocytosis. J Exp Medicine 213, 2113–2128 (2016). [DOI] [PMC free article] [PubMed] [Google Scholar]
Methods-only References
- 44.Miao EA et al. Caspase-1-induced pyroptosis is an innate immune effector mechanism against intracellular bacteria. Nat Immunol 11, 1136–1142 (2010). [DOI] [PMC free article] [PubMed] [Google Scholar]
- 45.Randow F & Sale JE Retroviral transduction of DT40. Sub-cellular biochemistry 40, 383–386 (2006). [DOI] [PubMed] [Google Scholar]
- 46.Nowarski R et al. Epithelial IL-18 Equilibrium Controls Barrier Function in Colitis. Cell 163, 1444–1456 (2015). [DOI] [PMC free article] [PubMed] [Google Scholar]
- 47.Kraiczy J et al. DNA methylation defines regional identity of human intestinal epithelial organoids and undergoes dynamic changes during development. Gut 68, 49 (2019). [DOI] [PMC free article] [PubMed] [Google Scholar]
- 48.Ettayebi K et al. Replication of human noroviruses in stem cell-derived human enteroids. Sci New York N Y 353, 1387–1393 (2016). [DOI] [PMC free article] [PubMed] [Google Scholar]
- 49.Koestler BJ, Ward CM & Payne SM Shigella Pathogenesis Modeling with Tissue Culture Assays. Curr Protoc Microbiol 50, e57 (2018). [DOI] [PMC free article] [PubMed] [Google Scholar]
- 50.Brinkman EK, Chen T, Amendola M & Steensel B van. Easy quantitative assessment of genome editing by sequence trace decomposition. Nucleic Acids Res 42, e168 (2014). [DOI] [PMC free article] [PubMed] [Google Scholar]
- 51.Sidik S et al. A Shigella flexneri virulence plasmid encoded factor controls production of outer membrane vesicles. G3 (Bethesda, Md.) 4, 2493–2503 (2014). [DOI] [PMC free article] [PubMed] [Google Scholar]
Associated Data
This section collects any data citations, data availability statements, or supplementary materials included in this article.
Supplementary Materials
Data Availability Statement
All data generated or analysed during this study are included in this published article (and its supplementary information files). The source data that support the findings of this study are available from the corresponding author upon reasonable request.


