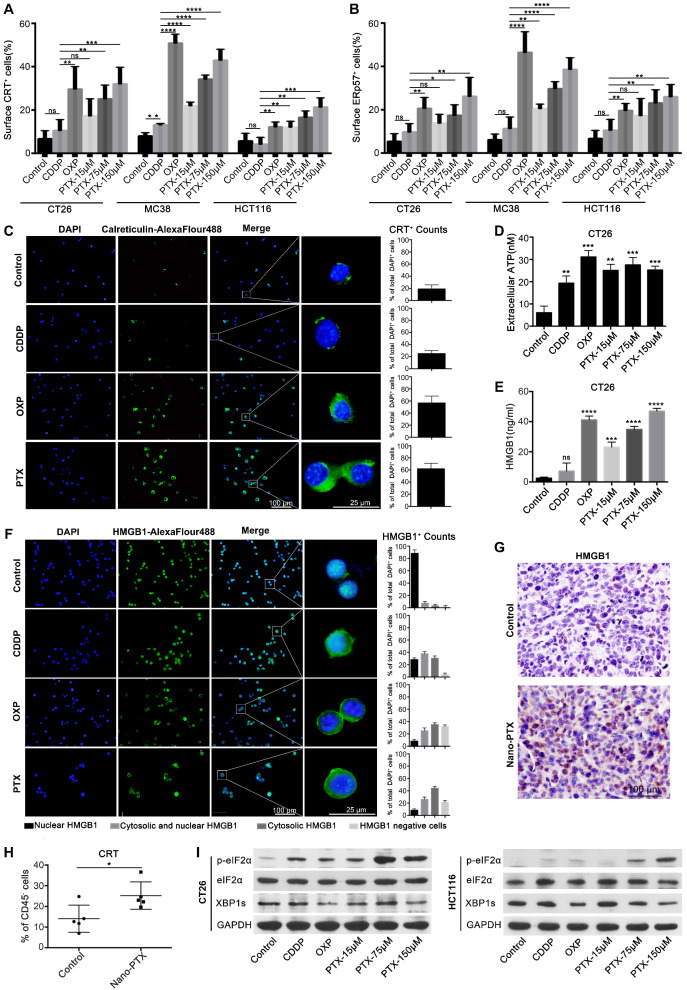
Figure 3.
PTX induces immunogenic cell death. A-B Flow-cytometry analysis of CRT (A) and ERp57 (B) on CT26, MC38 and HCT116 cells treated with CDDP (150 µM), OXP (300 µM), and PTX, n= 3 replicates. C CRT exposure on the surface of CT26 cells was assessed after short-term stimulation (4 h) with CDDP (150 µM), OXP (300 µM), and PTX (75 µM) treatments by immunofluorescence staining (left panel), statistics was shown in right panel. D-E CT26 cells were treated for 24 h in vitro and supernatant was collected for detecting the release of ATP (D) and HMGB1 (E) , n = 3 replicates. F Immunofluorescence staining of HMGB1 secretion in CT26 cell after treatment (24 h), statistics was shown in right panel. G Immunohistochemistry staining of HMGB1 within CT26 tumor after PTX injection (scale bar, 100 µm). H Flow-cytometry detection of CRT on CD45- cells within CT26 tumor after nano-PTX injection, n = 5 mice per group. I Western blot showed the expression of protein related to ER stress signaling pathway in CT26 and HCT116 cells after treatment for 4 h. Mean ±SEM was shown. * P < 0.05, ** P < 0.01, *** P < 0.001, **** P < 0.0001, ns (no statistical significance).

