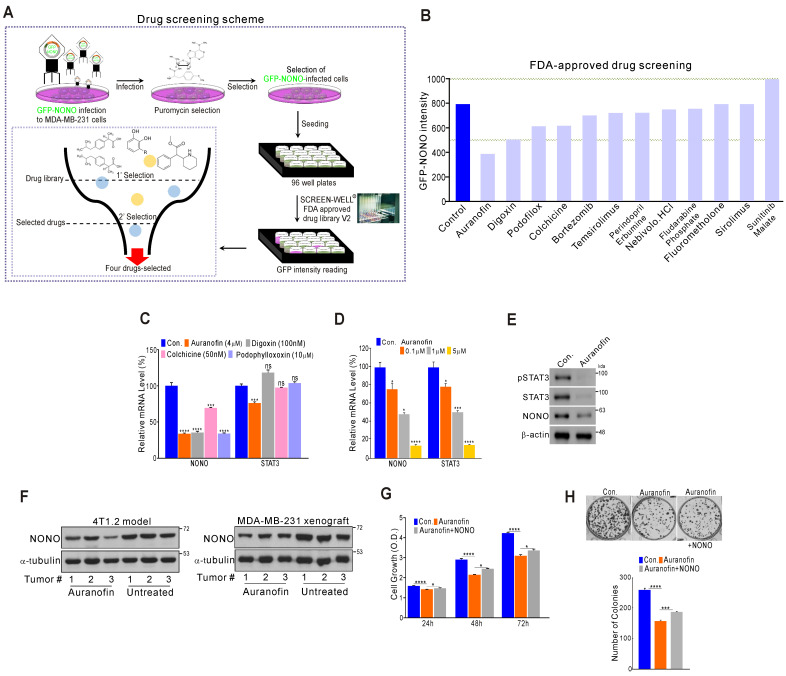
Figure 7.
High-throughput drug screening for NONO inhibitors in TNBC (A) Overall drug screening scheme. (B) Results of drug screening. GFP-NONO fluorescence intensity is indicated relative to control samples. (C-E) MDA-MB-231 cells were treated with indicated drugs, and the cells were then analyzed by qRT-PCR with the indicated primers (C-D) and WB (E). (F) Western blot analysis of the indicated tumor tissues 41. (G and H) MDA-MB-231 cells were treated with auranofin, transfected with NONO cDNA, and then analyzed in a CCK8 (G) and colony formation assay (H). All results are means plus standard deviations from three independent replicates (*p < 0.05, **p < 0.01, ***p < 0.005, and ****p < 0.001).

