

Abstract
Lactobacillus plantarum TWK10 (LP10) is a probiotic known to improve endurance exercise performance. Here, we analyze the proteomics and metagenomic changes in a LP10 supplemented mouse model. Male ICR mice were divided into two groups (n = 8) to receive by oral gavage either vehicle or of LP10 for 6 weeks. Proteins changes by LP10 treatment were subjected to the Ingenuity Pathway Analysis (IPA) to provide corroborative evidence for differential regulation of molecular and cellular functions affecting metabolic processes. Fecal samples were obtained from each mouse, and the microbial community profile analyzed by pyrosequencing of the 16S rRNA genes. Of the 880 identified proteins, 25 proteins were significantly downregulated and 44 proteins were significantly upregulated in the LP10 treated compared to vehicle group. LP10 supplementation shift in the gut microbiota to butyrate‐producing members and provided from lipid oxidation since peroxisomal fatty acid oxidation in liver.
Keywords: butyrate‐produce bacteria, Lactobacillus plantarum TWK10, lipid oxidation, proteome
LP10 treatment suppress energy production in mouse liver via lipid oxidation.
1. INTRODUCTION
The species Lactobacillus plantarum is a gram‐positive bacteria. Previously, we demonstrated that Lactobacillus plantarum TWK10 (LP10) could improve exercise performance, decrease white adipose tissue, increase muscle mass, and enhance gastrocnemius muscle type I fiber numbers without body weight gain (Chen et al.., 2016). These results suggest that gut microbiota contribute to the host metabolic phenotype to affect physical activity in terms of energy balance and body composition (Rosenbaum. , Knight, & Leibel, 2015). In this study, we investigate the mechanism by which probiotics consumption lead to changes in exercise performance and LP10’s influence on the gut microbiota to increase the efficiency of energy harvest (Murphy et al.., 2010).
Proteomics is a large‐scale comprehensive study of proteins and includes information on protein modification, along with their interacting networks (Anderson & Anderson, 1998). It is a powerful tool for studying changes in protein expression and identifying biomarkers state of a protein that correlates for pathogenic processes (Meneses‐Lorente et al.., 2006; Morand. , Macri, & Adeli, 2005; Santamaria. , Munoz, Fernandez‐Irigoyen, Prieto, & Corrales, 2007). To our knowledge, no precise mechanism has been identified to explain the increase in exercise performance with LP10 supplementation. The host metabolism, energy utilization, and storage have been revealed a tight and coordinated connection between gut microbes (Nicholson et al.., 2012). The gut microbiota was new technologies, and we are interested in how the gut microbiota regulates host expression that control metabolic processes and the energy gauge in the liver and muscle (Backhed. , Manchester, Semenkovich, & Gordon, 2007). Clinical evidence regarding the efficacy of fecal microbiota transplantation for therapy in areas including neurodevelopmental disorders, metabolic syndrome, and allergic diseases has recently emerged (Borody & Khoruts, 2011).
This current study aims to explore the effects of L. plantarum TWK10 (LP10) supplementation in a mouse model by shotgun proteomic analysis and fecal metagenomics analysis. We hope to identify a set of differentially expressed proteins as molecular markers for LP10 treatment and to determine how probiotic bacteria improves energy metabolism pathway (Conterno. , Fava, Viola, & Tuohy, 2011), influence efficiency of energy utilization and change microbial communities. In this study, we focus on the differential expressed proteins and uncovering the molecular mechanisms involved in LP10‐treated mice.
2. MATERIALS AND METHODS
2.1. Animals and experiment design
Male ICR mice (four weeks old) were purchased from BioLASCO (A Charles River Licensee Corp.). All mice were accommodated under maintained conditions as follows: a 12 hr light/dark cycle, room temperature kept at 24 ± 2°C, given rodent chow 5,001 and distilled water ad libitum, humidity‐controlled at 65 ± 5% conditions. Our studies were conducted in accordance with the protocols which given consent by the Institutional Ethical Committee of National Taiwan Sport University, Taoyuan City, Taiwan approved by the Institutional Animal Care and Use Committee (IACUC) (IACUC‐10405). After a two‐week acclimation period, the ICR mice (age, 6 weeks) were divided into 2 groups based on body weight (n = 8 per group) and received by oral gavage either vehicle or LP10 at 1.03 × 10⁹ CFU kg‐1 day‐1 for 6 weeks. The volume of vehicle or supplement administered to the vehicle group was the same, and the dose was determined according to the body weight of each mouse.
2.2. Determination of blood biochemical variables
At the end of the experimental period, all mice were sacrificed by 95% CO2 asphyxiation. Blood was immediately collected and serum separated by centrifugation. Levels of the clinical biochemical variables including aspartate aminotransferase (AST), alanine transaminase (ALT), and lactic dehydrogenase (LDH) were measured by using an autoanalyzer (Hitachi 7060).
2.3. Tissue glycogen determination
At the end of the experimental period, glycogen content of liver and muscles were analyzed. The method of glycogen analysis was according to a previously described method (Chen et al.., 2019).
2.4. Protein sample preparation for proteomic study
Liver tissue was isolated from the vehicle‐ and LP10‐treated mice. Using a Homogenizer Bullet blender (Next Advance), liver tissue was homogenized in lysis buffer containing 50 mmol/L Tris pH 6.8, 0.01% SDS, 0.01% protease inhibitor cocktail (Roche), and 0.01% phosphatase inhibitor cocktail (Sigma‐Aldrich). After 2‐min homogenization, tissue lysate was centrifuged at 4200 g for 10 min and supernatant was isolated by another round of centrifugation at 400 g, 10 min. Following centrifugation, the supernatant was aliquoted and stored at −80°C until further use.
2.5. SDS‐PAGE and In‐Gel Digestion
The method was modified as previous (Liao et al.., 2015), protein (50 µg) from each sample was resolved by SDS‐PAGE and the gel stained with Coomassie Brilliant Blue G‐250 (Bio‐Rad). After staining, the gel was cut into 10 slices equally and destained with 25 mmol/L NH4HCO3 ‐ 50% (v/v) acetonitrile. Slices were dried in a speed vac (Thermo Fisher Scientific), and 1% β‐mercaptoethanol and 5% 4‐vinylpyridine added for reduction of disulfide bridge and alkylation of cysteine residues. Subsequently, gel pieces were washed with 25 mmol/L NH4HCO3 and 25 mmol/L NH4HCO3 – 50% (v/v) for several times to remove the reducing and alkylating agent. The gel pieces were dried in a speed vac before incubation with a modified trypsin. The tryptic digestion was performed at 37°C. After an overnight incubation, the digest was collected and dried by speed vac. These dried peptides were kept at −20°C until further analysis. Before LC‐MS/MS analysis, the peptides were resuspended in 0.1% formic acid.
2.6. Nanoflow ultra high‐performance liquid chromatography − tandem mass spectrometry (nUPLC − MS/MS)
The tryptic peptides were analyzed by a nanoflow high‐performance liquid chromatography system (Agilent Technologies 1200 series) coupled to an LTQ‐Orbitrap Discovery hybrid mass spectrometer with a nanospray ionization source (Thermo Fisher Scientific). The HPLC system is equipped with LC packing C18 PepMap100 (length: 5 mm, internal diameter: 300 μm, bead size: 5 μm) as the trap column and Agilent ZORBAX XDB‐C18 (length, 50 mm; internal diameter, 75 μm; bead size 3.5 μm) as the analytical column. The mobile phase consisted of (A) 0.1% formic acid in water and (B) 0.1% formic acid in acetonitrile. For gradient elution, LC system was programmed as a 30‐min linear gradient of 5%–35% solvent followed by 95% solvent B for a duration of 10 min. For the settings of LTQ‐Orbitrap, full scans with Orbitrap analyses were collected in the range of 200–2,000 m/z. The dynamic exclusion function in the data dependent settings was activated, with the repeat count as 1, exclusion duration as 180 s, and exclusion list size as 50. Charge state rejection was activated and only charge 2 and charge 3 ions were not rejected. The top five ions in the survey scan fulfilling the above criteria were examined for their MS/MS that was generated by collision induced dissociation (CID) with the LTQ mass analyzer.
2.7. Database search of proteomic study
File Converter in Xcalibur 2.0.7 (Thermo Fisher Scientific) was used to extract the MS/MS information. Tandem mass spectra were interpreted using TurboSequest and UniProt mice database with the following parameters: fixed modifications of cysteine by vinylpyridine and variable modifications of methionine oxidation, peptide mass tolerance as 3.5 Da and fragment ion tolerance as 1.0 Da. Xcorr was used for a match with 2.5 doubly and triply charged ions. Peptides whose mass difference of parent ions were less than 10 ppm and whose Xcorr fulfilled the above requirement were considered a matched peptides. The proteins were identified when more than two peptides that met the criteria were detected from a single protein.
2.8. Bacterial DNA extraction and 16S rRNA sequencing
The method was modified as previous (Hsu et al., 2018). Fecal samples were collected on at the end of experiments. The collected samples were immediately stored at −80°C for DNA extraction. DNA was extracted from stool specimens using the QIAamp DNA Stool Mini Kit (Qiagen). Universal primers for the 16S variable regions V3‐5 were used for PCR amplification. The V5‐926 reverse primer included a unique sequence tag to barcode each sample. The primers used are as follows: V3‐357:5’‐CCTATCCCCTGTGTGCCTTGGCAGTCTCAGCCTACGGGAGGCAGCAG‐3’; V5‐926R: 5’‐CCATCTCATCCCTGCGTGTCTCCGACTCAGNNNNNNCCGTCAATTCMTTTRAGT‐3’. The underlined sequences denote the 454 FLX sequencing primers and the bold letters denote the universal 16S rRNA primers. The regions of 16S rRNA gene were amplified using FastStart HiFi Polymerase (Roche). Reactions were carried out on a 9700 thermal cycler (Applied Biosystems) using the following cycling parameters: 3 min at 94°C, 40 cycles of 15 s at 94°C, 45 s at 50°C, 1 min at 72°C, 72°C for 8 min and a final hold at 4°C. The presence of amplicons was confirmed by gel electrophoresis on a 1.5% agarose gel. The PCR amplicons were purified using the Agencourt AMPure XP Reagent (Beckman Coulter) and quantified on the Agilent Bioanalyzer. Equimolar amounts of the PCR amplicons were mixed in a single tube. The purified amplicon mixtures were sequenced by 454 GS Junior System using protocols recommended by the manufacturer. The sequences were analyzed by RDP Naive Bayesian rRNA Classifier Version 2.5.
2.9. Statistical analysis
All data are expressed mean ± SEM and analyzed by t test. A p‐value < .05 is considered statistically significant.
3. RESULTS
3.1. Effect of LP10 on AST, ALT and LDH, hepatic and muscle glycogen levels
As compared with the vehicle group, the LP10 group shows no change in AST levels. Compared to the vehicle group, the serum ALT level of the LP10‐treated group was lower by 17.08% (p = .0338) and the serum LDH level lower by 18.09% (p = .0050). Serum concentrations of ALT, AST, and LDH are well‐recognized clinical markers of liver damage (Ferolla. , Armiliato, Couto, & Ferrari, 2015). In the present study, probiotics supplementation could have protected the activity of liver functions (data not shown). Figure 1a,b shows the glycogen content of the liver and muscle tissues in the vehicle and LP10‐treated mouse groups. The liver glycogen level in the vehicle and LP10 groups were 1,437 ± 63 and 563 ± 48 μg/g liver, respectively, with the liver glycogen content of LP10‐treated mice significantly lower by 60.80% (p < .0001) than the vehicle group (Figure 1a). The muscle glycogen level in vehicle and LP10‐treated groups were not significantly different at 68 ± 3 and 74 ± 3 μg/g muscle, respectively (Figure 1b).
Figure 1.
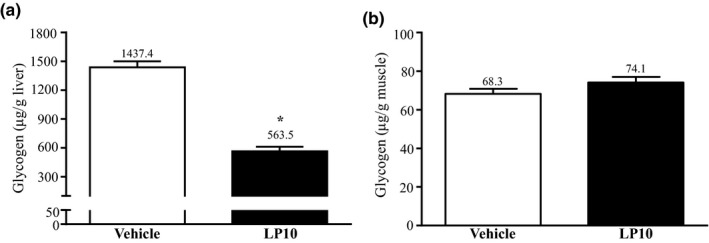
Effect of LP10 on (a) liver and (b) muscle glycogen levels at rest. Mice were pretreated with either vehicle or 1.03 × 10⁹ CFU kg‐1 day‐1 of LP10 for 6 weeks. All mice were sacrificed and examined for glycogen levels in muscle and liver tissues 1 hr after the final treatment. Data are expressed as mean ± SEM with n = 8 mice in each group. * p < .05
3.2. Proteomic analysis
In order to uncover the molecular changes due to probiotics supplementation, we applied a proteomic approach to analyze the liver tissue, a major metabolic organ in the body. Liver tissues collected from mice with or without LP10 treatment were lysed and separated by SDS‐PAGE. Proteins in the gel were digested by trypsin and analyzed by high‐resolution tandem mass spectrometry. The raw files were further interpreted by TurboSEQUEST. We identified a total of 880 proteins from the liver lysates in all the mouse groups. Using a label‐free quantification (LFQ) approach, we compared the liver proteins between the control and LP10 treated mice. After statistical analysis, 69 proteins were shown to have a significant change of greater than twofold (Figure 2a). For these proteins showing differential expression, 25 proteins showed a decrease and 44 proteins showed an increase in the LP10‐treated mice (Tables 1 and 2). Our results show that LP10 treatment is sufficient to alter liver proteome significantly. Details of peptide and other related information for each proteome analysis can be found in Table S1 (Supplementary data).
Figure 2.
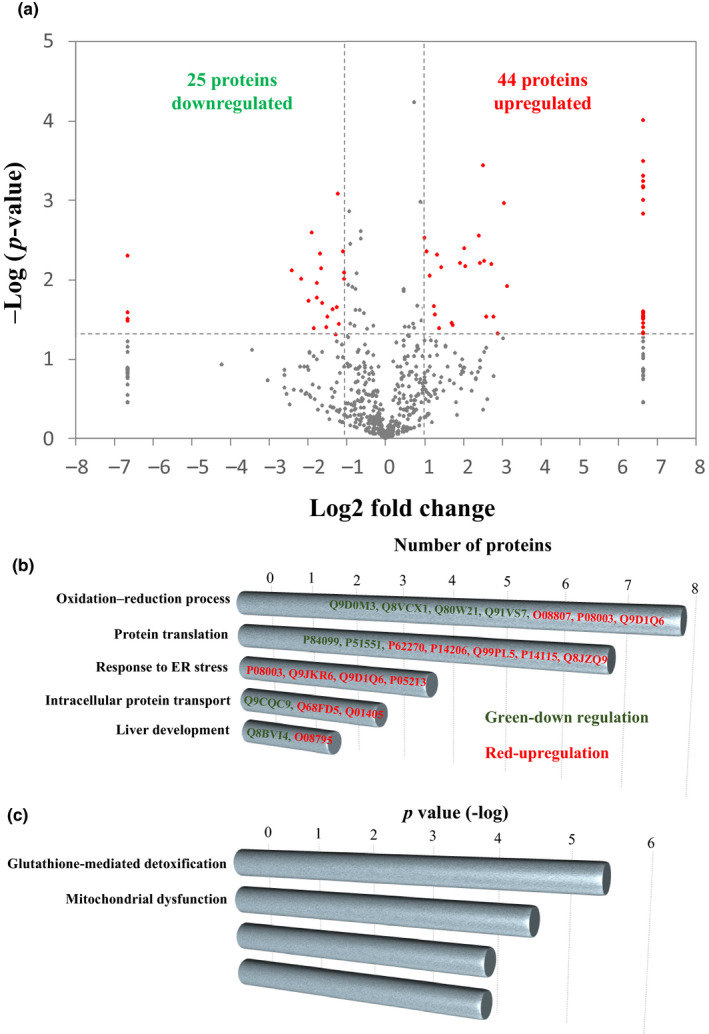
Quantitative analysis of liver proteome from mice treated with or without LP10. (a) Log ratios of label‐free quantification (LFQ) intensities in LP10‐treated mice versus control were plotted against negative log p‐values from Student's t test based on biological triplicates. Horizontal lines indicate fold changes of ±2, and vertical lines indicate Student's t test p‐values. Red dots denote proteins that meet both criteria for significant change between LP10‐treated and control mice. (i.e., fold change in abundance >2 and p < .05). Gray dots denote proteins that do not fulfill these criteria. Gene Ontology (GO) and Ingenuity Pathway Analysis (IPA) of differentially expressed proteins. (b) GO term enrichment in the category “biological process” is shown. Length of bar represents the number of proteins with respective GO term. (c) Canonical pathways analysis by IPA shown. Bars indicate p‐value of relative pathways
Table 1.
List of 25 proteins found to be downregulated from LP10‐treated mouse liver
| Description | Protein‐ID | Abbrev. | Vehicle | LP10 | p‐value | Fold |
|---|---|---|---|---|---|---|
| Coiled‐coil domain‐containing protein 38 | Q8CDN8 | CCD38 | 6.435 ± 2.994 | 0 ± 0 | .005 | Vehicle only |
| E3 ubiquitin‐protein ligase TTC3 | O88196 | TTC3 | 0.964 ± 0.658 | 0 ± 0 | .026 | Vehicle only |
| Peroxisomal 2,4‐dienoyl‐CoA reductase | Q9WV68 | DECR2 | 2.879 ± 2.064 | 0 ± 0 | .032 | Vehicle only |
| Dehydrogenase/reductase SDR family member 1 | Q99L04 | DHRS1 | 1.529 ± 1.097 | 0 ± 0 | .032 | Vehicle only |
| Cytochrome P450 1A2 | P00186 | CP1A2 | 1.065 ± 0.776 | 0 ± 0 | .034 | Vehicle only |
| Indolethylamine N‐methyltransferase | P40936 | INMT | 12.416 ± 3.221 | 2.306 ± 4.029 | .008 | −5.4 |
| ATP synthase subunit g, mitochondrial | Q9CPQ8 | ATP5L | 2.351 ± 0.772 | 0.518 ± 0.615 | .010 | −4.5 |
| GTP‐binding protein SAR1b | Q9CQC9 | SAR1B | 2.951 ± 1.078 | 0.745 ± 0.862 | .019 | −4.0 |
| Cytochrome c oxidase subunit 2 | P00405 | COX2 | 4.737 ± 1.362 | 1.259 ± 0.351 | .003 | −3.8 |
| 60S ribosomal protein L19 | P84099 | RL19 | 1.647 ± 0.165 | 0.454 ± 0.908 | .041 | −3.6 |
| Dihydropteridine reductase | Q8BVI4 | DHPR | 4.558 ± 1.663 | 1.32 ± 1.085 | .017 | −3.5 |
| Cytochrome c1, heme protein, mitochondrial | Q9D0M3 | CY1 | 4.088 ± 0.637 | 1.187 ± 1.47 | .011 | −3.4 |
| S‐methylmethionine‐‐homocysteine S‐methyltransferase BHMT2 | Q91WS4 | BHMT2 | 9.694 ± 2.575 | 2.985 ± 1.682 | .005 | −3.2 |
| Delta‐aminolevulinic acid dehydratase | P10518 | HEM2 | 6.822 ± 0.816 | 2.151 ± 2.207 | .007 | −3.2 |
| Glutathione S‐transferase Mu 2 | P15626 | GSTM2 | 15.768 ± 3.492 | 5.094 ± 5.792 | .020 | −3.1 |
| Glutathione S‐transferase Mu 3 | P19639 | GSTM4 | 15.313 ± 5.83 | 5.269 ± 4.997 | .040 | −2.9 |
| Glutathione S‐transferase Mu 7 | Q80W21 | GSTM7 | 16.539 ± 6.671 | 5.833 ± 3.462 | .029 | −2.8 |
| UPF0585 protein C16orf13 homolog | Q9DCS2 | CP013 | 3.656 ± 1.047 | 1.417 ± 1.061 | .024 | −2.6 |
| Ester hydrolase C11orf54 homolog | Q91V76 | CK054 | 3.66 ± 1.392 | 1.487 ± 1.087 | .049 | −2.5 |
| ADP/ATP translocase 2 | P51881 | ADT2 | 9.375 ± 3.086 | 3.887 ± 1.831 | .022 | −2.4 |
| Regucalcin | Q64374 | RGN | 43.571 ± 6.309 | 18.642 ± 5.031 | .001 | −2.3 |
| Cytochrome c oxidase subunit 4 isoform 1, mitochondrial | P19783 | COX41 | 3.741 ± 0.904 | 1.631 ± 1.287 | .036 | −2.3 |
| Estradiol 17 beta‐dehydrogenase 5 | P70694 | DHB5 | 29.88 ± 5.223 | 13.88 ± 5.04 | .005 | −2.2 |
| 3‐oxo−5‐beta‐steroid 4‐dehydrogenase | Q8VCX1 | AK1D1 | 4.735 ± 1.083 | 2.232 ± 0.799 | .010 | −2.1 |
| Microsomal glutathione S‐transferase 1 | Q91VS7 | MGST1 | 23.9 ± 4.576 | 11.302 ± 4.589 | .008 | −2.1 |
Table 2.
List of 44 proteins found to be upregulated in LP10‐treated mouse liver
| Description | Protein‐ID | Abbrev. | Vehicle | LP10 | p‐value | Fold |
|---|---|---|---|---|---|---|
| Tubulin alpha−3 chain | P05214 | TBA3 | 0 ± 0 | 1.106 ± 0.245 | .000 | LP10 only |
| Tubulin alpha−8 chain | Q9JJZ2 | TBA8 | 0 ± 0 | 1.792 ± 0.488 | .000 | LP10 only |
| Tubulin alpha−1A chain | P68369 | TBA1A | 0 ± 0 | 2.748 ± 0.809 | .001 | LP10 only |
| Tubulin alpha−1B chain | P05213 | TBA1B | 0 ± 0 | 4.621 ± 1.399 | .001 | LP10 only |
| Tubulin alpha−1C chain | P68373 | TBA1C | 0 ± 0 | 4.187 ± 1.304 | .001 | LP10 only |
| Fatty acid amide hydrolase 1 | O08914 | FAAH1 | 0 ± 0 | 1.492 ± 0.467 | .001 | LP10 only |
| Endoplasmic reticulum resident protein 44 | Q9D1Q6 | ERP44 | 0 ± 0 | 1.77 ± 0.594 | .001 | LP10 only |
| Neutral alpha‐glucosidase AB | Q8BHN3 | GANAB | 0 ± 0 | 2.834 ± 1.024 | .001 | LP10 only |
| Ribosome‐binding protein 1 | Q99PL5 | RRBP1 | 0 ± 0 | 5.17 ± 3.488 | .025 | LP10 only |
| Transcriptional activator Myb | P06876 | MYB | 0 ± 0 | 0.951 ± 0.647 | .026 | LP10 only |
| 60S ribosomal protein L27a | P14115 | RL27A | 0 ± 0 | 1.461 ± 1.005 | .027 | LP10 only |
| Dipeptidyl peptidase 3 | Q99KK7 | DPP3 | 0 ± 0 | 0.813 ± 0.566 | .028 | LP10 only |
| Annexin A5 | P48036 | ANXA5 | 0 ± 0 | 0.75 ± 0.522 | .028 | LP10 only |
| Phosphomannomutase 2 | Q9Z2M7 | PMM2 | 0 ± 0 | 1.042 ± 0.733 | .029 | LP10 only |
| ES1 protein homolog, mitochondrial | Q9D172 | ES1 | 0 ± 0 | 0.895 ± 0.635 | .030 | LP10 only |
| Peroxisomal acyl‐coenzyme A oxidase 2 | Q9QXD1 | ACOX2 | 0 ± 0 | 1.174 ± 0.838 | .031 | LP10 only |
| Eukaryotic translation initiation factor 3 subunit B | Q8JZQ9 | EIF3B | 0 ± 0 | 0.947 ± 0.679 | .032 | LP10 only |
| Major vault protein | Q9EQK5 | MVP | 0 ± 0 | 1.617 ± 1.198 | .036 | LP10 only |
| Valine‐‐tRNA ligase | Q9Z1Q9 | SYVC | 0 ± 0 | 1.855 ± 1.42 | .040 | LP10 only |
| 2‐oxoglutarate dehydrogenase, mitochondrial | Q60597 | ODO1 | 0 ± 0 | 1.586 ± 1.264 | .046 | LP10 only |
| Glucosidase 2 subunit beta | O08795 | GLU2B | 0 ± 0 | 1.188 ± 0.958 | .048 | LP10 only |
| Corticosteroid 11‐beta‐dehydrogenase isozyme 1 | P50172 | DHI1 | 0.244 ± 0.488 | 2.143 ± 0.955 | .012 | 8.8 |
| Calnexin | P35564 | CALX | 1.264 ± 1.705 | 10.396 ± 2.605 | .001 | 8.2 |
| Fibrinogen gamma chain | Q8VCM7 | FIBG | 0.277 ± 0.555 | 2.059 ± 1.333 | .049 | 7.4 |
| Protein transport protein Sec23A | Q01405 | SC23A | 0.208 ± 0.416 | 1.421 ± 0.748 | .030 | 6.8 |
| Very‐long‐chain acyl‐CoA synthetase | O35488 | S27A2 | 1.387 ± 2.775 | 9.229 ± 2.655 | .006 | 6.7 |
| Talin−1 | P26039 | TLN1 | 0.416 ± 0.832 | 2.504 ± 1.212 | .030 | 6.0 |
| Zinc finger protein 76 | Q8BMU0 | ZNF76 | 1.747 ± 1.508 | 10.194 ± 3.745 | .006 | 5.8 |
| Hypoxia upregulated protein 1 | Q9JKR6 | HYOU1 | 3.264 ± 3.626 | 18.64 ± 2.278 | .000 | 5.7 |
| Peroxiredoxin−4 | O08807 | PRDX4 | 0.208 ± 0.416 | 1.112 ± 0.142 | .006 | 5.3 |
| UDP‐glucuronosyltransferase 2A3 | Q8BWQ1 | UD2A3 | 1.23 ± 1.038 | 6.532 ± 1.917 | .003 | 5.3 |
| Treslin | Q8BQ33 | TICRR | 1.203 ± 1.397 | 4.999 ± 1.251 | .007 | 4.2 |
| Interleukin−17B | Q9QXT6 | IL17B | 3.509 ± 2.556 | 14.342 ± 4.062 | .004 | 4.1 |
| 40S ribosomal protein SA | P14206 | RSSA | 0.95 ± 1.2 | 3.56 ± 0.4 | .006 | 3.7 |
| Heat shock 70 kDa protein 1‐like | P16627 | HS71L | 2.269 ± 1.581 | 7.511 ± 3.602 | .037 | 3.3 |
| Radixin | P26043 | RADI | 0.809 ± 0.954 | 2.646 ± 0.968 | .035 | 3.3 |
| Protein disulfide‐isomerase A4 | P08003 | PDIA4 | 8.174 ± 3.08 | 21.947 ± 6.137 | .007 | 2.7 |
| Proteasome subunit beta type−3 | Q9R1P1 | PSB3 | 0.684 ± 0.818 | 1.776 ± 0.191 | .041 | 2.6 |
| Aconitate hydratase, mitochondrial | Q99KI0 | ACON | 8.644 ± 4.446 | 21.438 ± 3.868 | .005 | 2.5 |
| Acyl‐CoA synthetase family member 2, mitochondrial | Q8VCW8 | ACSF2 | 5.628 ± 4.992 | 13.464 ± 2.112 | .028 | 2.4 |
| 40S ribosomal protein S18 | P62270 | RS18 | 1.305 ± 1.035 | 3.105 ± 0.536 | .021 | 2.4 |
| Clathrin heavy chain 1 | Q68FD5 | CLH1 | 5.679 ± 2.545 | 12.41 ± 2.468 | .009 | 2.2 |
| Dimethylglycine dehydrogenase, mitochondrial | Q9DBT9 | M2GD | 19.149 ± 6.913 | 39.658 ± 6.145 | .004 | 2.1 |
| Microsomal triglyceride transfer protein large subunit | O08601 | MTP | 8.217 ± 2.892 | 16.567 ± 1.936 | .003 | 2.0 |
3.3. Gene ontology and ingenuity pathways analysis
The hepatic proteins whose expressions are changed by LP10 treatment were analyzed by their Gene Ontology (GO) and canonical signaling pathways (Figure 2b,c). In Figure 2b, proteins downregulated by LP10‐treatment are highlighted in green while those that are upregulated are highlighted in red. Eight proteins were shown to be involved in the oxidation–reduction pathway, with five proteins being downregulated and three proteins upregulated. Seven proteins were involved in protein analysis (two proteins downregulated and five proteins upregulated), four proteins upregulated that are involved in ER stress response, three proteins involved in intracellular protein transport (1 downregulated and 2 upregulated), and two proteins involved in liver development (1 downregulated and 2 upregulated). Figure 2c shows the major pathways generated by IPA between the vehicle and LP10‐treated groups using a threshold p‐value < .05. The length of the bar indicates only that the differentially expressed proteins are related to this pathway but does not indicate direction of regulation. The proteins regulated by LP10 are involved in glutathione‐mediated detoxification, mitochondrial dysfunction, remodeling of epithelial adherens junctions, and LPS/IL‐1‐mediated inhibition of RXR function. Both the GO and IPA analyses show that the differentially expressed proteins are involved in the oxidation–reduction process. The glutathione‐mediated detoxification pathway gave a p‐value of −log 5.6, indicating that this pathway was significantly changed by LP10 treatment.
3.4. Taxonomic shifts due to LP10 supplementation
Gene classifier assigned the usable raw reads to 7 phyla, 11 classes, 18 families, and 42 genus. The most abundant phyla include the Bacteroidetes and Firmicutes, classes include Bacteroidia and Clostridia, families include Lachnospiraceae, Porphyromonadaceae, Rikenellaceae, and Ruminococcaceae, and genus include Alistipes, Barnesiella, and Odoribacter (Table 3). Our data demonstrate that LP10 supplementation may dramatically impact microbial taxonomy when compared with the vehicle group. The relative abundance of the Bacteroidetes phyla was significantly decreased by 17.28% (p = .011) and Firmicutes phyla significantly increased by 2.55‐fold (p = .0093) with LP10 treatment (Table 3). At the class level, the relative abundance of Bacteroidia in LP10 treatment was significantly decreased by 21.24% (p = .0024) and Clostridia significantly increased by 3.63‐fold (p = .0016) compared with the vehicle group. At the families level, the relative abundance of Rikenellaceae with LP10 treatment was significantly decreased by 78.37% (p = .0028) and Porphyromonadaceae significantly increased by 2.42‐fold (p = .0035) compared with the vehicle group. At the genera level, Alistipes was significantly decrease by 23.96% (p = .0258) and Barnesiella significantly increased by 9.43‐fold (p = .0415) with LP10 treatment.
Table 3.
Predominant fecal bacteria phyla, order, family, and genus present in vehicle or LP10‐supplemented mice
| Phylum | Class | Family | Genes | Vehicle | LP10 | p‐values |
|---|---|---|---|---|---|---|
| Relative abundance % | ||||||
| Bacteroidetes | 86.90 ± 2.95 | 71.88 ± 1.57 | .0110 | |||
| Bacteroidales | 89.98 ± 2.55 | 70.87 ± 1.11 | .0024 | |||
| Porphyromonadaceae | 23.18 ± 2.10 | 56.14 ± 4.90 | .0035 | |||
| Barnesiella | 2.73 ± 0.62 | 25.73 ± 7.73 | .0415 | |||
| Rikenellaceae | 65.76 ± 1.88 | 14.22 ± 3.91 | .0028 | |||
| no detect | Alistipes | 90.64 ± 1.97 | 68.93 ± 5.94 | .0258 | ||
| no detect | Odoribacter | 6.63 ± 2.15 | 5.34 ± 2.84 | .7391 | ||
| Firmicutes | 15.01 ± 3.99 | 38.32 ± 2.92 | .0093 | |||
| Clostridiales | 11.05 ± 3.13 | 40.16 ± 2.18 | .0016 | |||
| Ruminococcaceae | 1.62 ± 0.45 | 1.10 ± 0.38 | .4210 | |||
| Lachnospraceae | 9.44 ± 3.64 | 23.40 ± 5.59 | .0748 | |||
4. DISCUSSION
LP10 appears to enhance the reducing power of liver cells as observed by our list of differentially expressed proteins. For instance, peroxiredoxin, an enzyme that promotes reduction of reactive oxygen species, showed increased levels in the liver after LP10 treatment. On the other hand, we observed downregulation of glutathione S‐transferase, an enzyme that facilitates glutathione oxidation. These results suggest that the liver cells undergo some oxidative reaction upon LP10 treatment, altering the proteins with reducing power to maintain redox equilibrium. In support of this, we found the upregulation of several proteins required for fatty acid oxidation. Peroxisomal acyl‐coenzyme A oxidase 2 (ACOX2) and very‐long‐chain acyl‐CoA synthetase (S27A2) were significantly increased in LP10‐treated mice. These proteins are required for processing/metabolism/catabolism of very‐long‐chain fatty acids (VLCFAs), for example, lignocerate. VLCFAs must be shortened by peroxisomal beta‐oxidation before they can be catabolized in the mitochondria.
The first step of VLCFAs breakdown to convert VLCFAs to very‐long‐chain acyl CoA requires the very‐long‐chain acyl‐CoA synthetase (Wanders, 2014). We observed a 6.7‐fold increase in the expression of very‐long‐chain acyl‐CoA synthetase in LP10‐treated mice. For peroxisomal acyl‐coenzyme A oxidase 2, the second enzyme that oxidizes VLCFAs in peroxisome, it was detected only in the LP10‐treated mice, and not the vehicle‐treated mice. These results are consistent with the notion that the rate‐determining steps for a biochemical reaction are usually within the first few steps. Fatty acid oxidation is likely the main cause of changing redox balance in the livers of LP10‐treated mice. Normally, after VLCFAs are shortened by peroxisomal beta‐oxidation, the shorter fatty acids may be transported into mitochondria for further catabolism. One of the final products of beta‐oxidation is acetyl CoA, which is used to generate ATP through the TCA cycle and oxidative phosphorylation. We did not observe any changes in the mitochondria‐derived fatty acid oxidation enzymes. However, we found that level of ATP synthase subunit g (ATP5L) and cytochrome c oxidase subunit 2 (COX2) were downregulated by 4.5‐ and 3.8‐fold, respectively, in LP10‐treated mice. These proteins are reported to be essential for maximal levels of respiration, ATP synthesis and cytochrome c oxidase activity in yeast (Wanders, 2014). Our data support the idea that LP10 treatment may suppress energy production in mouse liver.
In our previous (Chen et al.., 2016) and present study, we did not see any obvious liver steatosis or liver weight gain in LP10‐treated mice, although we observed a reduction in liver glycogen levels and muscle hypertrophy. These observations taken together with the proteomic data suggest that the catabolized fatty acids in liver may be transported to other organs such as the muscles. In our list or upregulated proteins, two proteins were identified that are involved in fatty acid transportation–microsomal triglyceride transfer protein large subunit (MTP) and protein disulfide‐isomerase A4 (PDIA4). MTP forms a heterodimer with PDI to play a necessary role of biosynthesis of apolipoprotein B (apoB)‐containing triglyceride‐rich lipoproteins. MTP and PDIA4 increased 2‐ and 2.7‐fold, respectively, in LP10‐treated mice. Similar stoichiometric changes of these proteins support the model that the activity of fatty acid transportation is controlled by the complex formation of MTP and PDIA4 (Wetterau. , Aggerbeck, Laplaud, & McLean, 1991). The proteome data suggest that the peroxisomal fatty acid oxidation in liver provides energy source to other organs, rather than to the liver itself.
Although the Lactobacillus population did not appear as one of the classified genus listing, indicating that LP10 did not colonize in mice cecum, the intestinal microbiota did dramatically shift a result of LP10 supplementation. The effect of endurance exercise performance and physiological adaptations of is through nitrosative stress and modulation of oxidative and as a way to avoid bacterial translocation, tissue damage, and intestinal permeability (Bessa et al.., 2016; Lamprecht & Frauwallner, 2012). The shifting of colonic microbiota to increase the abundance of Firmicutes phylum could activate electrogenic Cl− channels in the intestinal mucosa secretion, which functions as a primitive innate defense mechanism (Musch. , Wang, Claud, & Chang, 2013). This defense mechanism plays important role in protecting intestinal infection by inducing pro‐inflammatory and pro‐oxidant responses that control pathogen load, helping to prevent fatal dehydration (Ghosh et al.., 2011). Thus, the Firmicutes phyla that is increased with LP10 supplementation could improve endurance exercise performance by benefitting the gut microbiota. Other studies have documented beneficial effects of probiotic and prebiotics interventions through alterations of Clostridia (Lin. , Chen, Tsai, & Pan, 2017; Onrust et al.., 2015).
These results observations are both intriguing and slightly contrary to previous research. In general, lower Bacteroidetes and greater Firmicutes are sometimes observed in detrimental metabolic states such as obesity and diabetes (Geurts et al.., 2011; Ley. , Turnbaugh, Klein, & Gordon, 2006; Zhang et al.., 2013). Clostridia is recognized as a species responsible for several human and animal diseases (Burke & Lamont, 2014). Clarke et al. compared the fecal bacterial profile of male elite rugby players to healthy subjects and found that athletes had lowered Bacteroidetes and increased Firmicutes, similar to our observations in LP10 supplementation mice (Clarke et al.., 2014). The Firmicutes phyla has butyrate as its primary metabolic end product (Macfarlane & Macfarlane, 2003) and recent studies in rats have demonstrated that exercise is associated with greater butyrate levels (Matsumoto et al.., 2008), exerting multiple beneficial effects on mammalian energy metabolism (den Besten et al.., 2013). In addition, Clostridia also has butyrate‐producing capacity to reduce lipogenesis (Van den Abbeele et al.., 2013; Zhao. , Guo, Liu, Gao, & Nie, 2014). Therefore, elevations in butyrate‐producing members of the Firmicutes and Clostridia phyla may actually be advantageous to endurance exercise performance.
In conclusion, the liver is an important metabolic organ. Liver receives the hormonal signals and existing energy stores and program the multiple processes of energy storage such as gluconeogenesis, glycogenesis, lipogenesis, and mobilization of energy supplies for body and the rest of the processes as β‐oxidation and ketogenesis glycolysis and glycogenolysis (Youngson. , Morris, & Ballard, 2017).
The liver–gut axis is interesting, they have close functional and bidirectional communication between of liver and gut, and the changes of specific intestinal microbiota are characteristic of general obesogenic and dysmetabolic hepatic lipogenesis, and typical of the first stage of non‐alcoholic fatty liver disease (NAFLD) (Backhed et al.., 2004). This is evidenced from obesity studies showing that specific gut microbiota (e.g., Bacteroides thetaiotaomicron) become the dominant bacteria for more efficient intestinal absorption of increased of lipid deposition, absorbing more calories and poorly digestible plant polysaccharides (Backhed et al.., 2004). VLCFAs are the first lipid to activated in the cytosol to long‐chain acyl‐CoAs (coenzyme A) via long‐chain acyl‐CoA synthetases (Lee et al.., 2017). LP10 supplementation promotes the peroxisomal fatty acid oxidation in liver to provide energy to muscles. The gut microbiota transfers to the butyrate‐producing members to increase host fatty acid utilization.
It is known that energy utilization is correlated with the type of exercise. Long‐distance runners preferentially use fat as energy source and positively correlated with fat utilization compared with short‐distance runners (Brooks. & Mercier 1994 ). In previous study, we observed that LP10‐treated mice increased their muscular endurance in several behavioral tests (Chen et al.., 2016). In conclusion, our proteomic and metagenomic analyses provide evidence for alteration of energy utilization in liver. LP10 supplementation causes the host fatty acid transported via bloodstream to be taken up by organs, including the muscle, where they are further metabolized in the mitochondria to generate energy.
CONFLICT OF INTEREST
The authors declare no conflict of interest.
AUTHOR CONTRIBUTIONS
Yi‐Ming Chen, Chen‐Chung Liao, Chi‐Chang Huang and Yen‐Shuo, Chiu designed the experiments; Yi‐Ming Chen, Chen‐Chung Liao, Yen‐Chun Huang, and Ming‐Yi Chen carried out the laboratory experiments; Yi‐Ming Chen, Yen‐Chun Huang, Wen‐Chyuan Chen, Chi‐Chang Huang and Yen‐Shuo, Chiu analyzed the data, interpreted the results, prepared figures, and wrote the manuscript; Chen‐Chung Liao, Wen‐Chyuan Chen, and Yen‐Shuo, Chiu contributed reagents, materials, and analysis platforms and revised manuscript.
Supporting information
Table S1
ACKNOWLEDGMENTS
This study was supported by the Ministry of Science and Technology of Taiwan (grant no. MOST102‐2628‐B179‐001‐MY3 & MOST 106‐2410‐H‐227‐007 to Dr. Chi‐Chang Huang). The authors are grateful to Dr. Chien‐Chao Chiu for his technical assistance in the animal experiments.
Chen Y‐M, Liao C‐C, Huang Y‐C, et al. Proteome and microbiota analysis highlight Lactobacillus plantarum TWK10 supplementation improves energy metabolism and exercise performance in mice. Food Sci Nutr. 2020;8:3525–3534. 10.1002/fsn3.1635
Yi‐Ming Chen and Chen‐Chung Liao are contributed equally to this work
[Correction added on 18 June 2020, after first online publication: the first name of the last author has been corrected so it reads 'Yen‐Shuo Chiu'.]
REFERENCES
- Anderson, N. L. , & Anderson, N. G. (1998). Proteome and proteomics: New technologies, new concepts, and new words. Electrophoresis, 19, 1853–1861. 10.1002/elps.1150191103 [DOI] [PubMed] [Google Scholar]
- Backhed, F. , Ding, H. , Wang, T. , Hooper, L. V. , Koh, G. Y. , Nagy, A. , … Gordon, J. I. (2004). The gut microbiota as an environmental factor that regulates fat storage. Proceedings of the National Academy of Sciences of the United States of America, 101, 15718–15723. 10.1073/pnas.0407076101 [DOI] [PMC free article] [PubMed] [Google Scholar]
- Backhed, F. , Manchester, J. K. , Semenkovich, C. F. , & Gordon, J. I. (2007). Mechanisms underlying the resistance to diet‐induced obesity in germ‐free mice. Proceedings of the National Academy of Sciences of the United States of America, 104, 979–984. 10.1073/pnas.0605374104 [DOI] [PMC free article] [PubMed] [Google Scholar]
- Bessa, A. L. , Oliveira, V. N. , Agostini, G. G. , Oliveira, R. J. , Oliveira, A. C. , White, G. E. , … Espindola, F. S. (2016). Exercise intensity and recovery: Biomarkers of injury, inflammation, and oxidative stress. Journal of Strength and Conditioning ResearchJournal of Strength and Conditioning Research, 30, 311–319. 10.1519/JSC.0b013e31828f1ee9 [DOI] [PubMed] [Google Scholar]
- Borody, T. J. , & Khoruts, A. (2011). Fecal microbiota transplantation and emerging applications. Nature Reviews Gastroenterology & Hepatology, 9, 88–96. 10.1038/nrgastro.2011.244 [DOI] [PubMed] [Google Scholar]
- Brooks, G. A. , & Mercier, J. (1994 ). Balance of carbohydrate and lipid utilization during exercise: The "crossover" concept. Journal of Applied Physiology. 76(6), 2253–2261. https://journals.physiology.org/doi/abs/10.1152/jappl.1994.76.6.2253 [DOI] [PubMed] [Google Scholar]
- Burke, K. E. , & Lamont, J. T. (2014). Clostridium difficile infection: A worldwide disease. Gut Liver, 8, 1–6. [DOI] [PMC free article] [PubMed] [Google Scholar]
- Chen, Y. M. , Sung, H. C. , Kuo, Y. H. , Hsu, Y. J. , Huang, C. C. , & Liang, H. L. (2019). The effects of ergosta‐7,9(11),22‐trien‐3beta‐ol from Antrodia camphorata on the biochemical profile and exercise performance of mice. Molecules, 24, 1225. [DOI] [PMC free article] [PubMed] [Google Scholar]
- Chen, Y. M. , Wei, L. , Chiu, Y. S. , Hsu, Y. J. , Tsai, T. Y. , Wang, M. F. , & Huang, C. C. (2016). Lactobacillus plantarum TWK10 supplementation improves exercise performance and increases muscle mass in mice. Nutrients, 8, 205 10.3390/nu8040205 [DOI] [PMC free article] [PubMed] [Google Scholar]
- Clarke, S. F. , Murphy, E. F. , O'Sullivan, O. , Lucey, A. J. , Humphreys, M. , Hogan, A. , … Cotter, P. D. (2014). Exercise and associated dietary extremes impact on gut microbial diversity. Gut, 63, 1913–1920. 10.1136/gutjnl-2013-306541 [DOI] [PubMed] [Google Scholar]
- Conterno, L. , Fava, F. , Viola, R. , & Tuohy, K. M. (2011). Obesity and the gut microbiota: Does up‐regulating colonic fermentation protect against obesity and metabolic disease? Genes Nutr, 6, 241–260. 10.1007/s12263-011-0230-1 [DOI] [PMC free article] [PubMed] [Google Scholar]
- den Besten, G. , van Eunen, K. , Groen, A. K. , Venema, K. , Reijngoud, D. J. , & Bakker, B. M. (2013). The role of short‐chain fatty acids in the interplay between diet, gut microbiota, and host energy metabolism. Journal of Lipid Research, 54, 2325–2340. 10.1194/jlr.R036012 [DOI] [PMC free article] [PubMed] [Google Scholar]
- Ferolla, S. M. , Armiliato, G. N. , Couto, C. A. , & Ferrari, T. C. (2015). Probiotics as a complementary therapeutic approach in nonalcoholic fatty liver disease. World J Hepatol, 7, 559–565. 10.4254/wjh.v7.i3.559 [DOI] [PMC free article] [PubMed] [Google Scholar]
- Geurts, L. , Lazarevic, V. , Derrien, M. , Everard, A. , Van Roye, M. , Knauf, C. , … Cani, P. D. (2011). Altered gut microbiota and endocannabinoid system tone in obese and diabetic leptin‐resistant mice: Impact on apelin regulation in adipose tissue. Frontiers in Microbiology, 2, 149 10.3389/fmicb.2011.00149 [DOI] [PMC free article] [PubMed] [Google Scholar]
- Ghosh, S. , Dai, C. , Brown, K. , Rajendiran, E. , Makarenko, S. , Baker, J. , … Gibson, D. L. (2011). Colonic microbiota alters host susceptibility to infectious colitis by modulating inflammation, redox status, and ion transporter gene expression. American Journal of Physiology. Gastrointestinal and Liver Physiology, 301, G39–G49. 10.1152/ajpgi.00509.2010 [DOI] [PubMed] [Google Scholar]
- Hsu, Y. J. , Huang, W. C. , Lin, J. S. , Chen, Y. M. , Ho, S. T. , Huang, C. C. , & Tung, Y. T. (2018). Kefir Supplementation modifies gut microbiota composition, reduces physical fatigue, and improves exercise performance in mice. Nutrients, 10, 862 10.3390/nu10070862 [DOI] [PMC free article] [PubMed] [Google Scholar]
- Lamprecht, M. , & Frauwallner, A. (2012). Exercise, intestinal barrier dysfunction and probiotic supplementation. Medicine and Sport Science, 59, 47–56. [DOI] [PubMed] [Google Scholar]
- Lee, J. , Choi, J. , Selen Alpergin, E. S. , Zhao, L. , Hartung, T. , Scafidi, S. , … Wolfgang, M. J. (2017). Loss of hepatic mitochondrial long‐chain fatty acid oxidation confers resistance to diet‐induced obesity and glucose intolerance. Cell Reports, 20, 655–667. 10.1016/j.celrep.2017.06.080 [DOI] [PMC free article] [PubMed] [Google Scholar]
- Ley, R. E. , Turnbaugh, P. J. , Klein, S. , & Gordon, J. I. (2006). Microbial ecology: Human gut microbes associated with obesity. Nature, 444, 1022–1023. 10.1038/4441022a [DOI] [PubMed] [Google Scholar]
- Liao, C. C. , Chiu, Y. S. , Chiu, W. C. , Tung, Y. T. , Chuang, H. L. , Wu, J. H. , & Huang, C. C. (2015). Proteomics analysis to identify and characterize the molecular signatures of hepatic steatosis in ovariectomized rats as a model of postmenopausal status. Nutrients, 7, 8752–8766. 10.3390/nu7105434 [DOI] [PMC free article] [PubMed] [Google Scholar]
- Lin, C. H. , Chen, Y. H. , Tsai, T. Y. , & Pan, T. M. (2017). Effects of deep sea water and Lactobacillus paracasei subsp. paracasei NTU 101 on hypercholesterolemia hamsters gut microbiota. Applied Microbiology and Biotechnology, 101, 321–329. 10.1007/s00253-016-7868-y [DOI] [PubMed] [Google Scholar]
- Macfarlane, S. , & Macfarlane, G. T. (2003). Regulation of short‐chain fatty acid production. The Proceedings of the Nutrition Society, 62, 67–72. 10.1079/PNS2002207 [DOI] [PubMed] [Google Scholar]
- Matsumoto, M. , Inoue, R. , Tsukahara, T. , Ushida, K. , Chiji, H. , Matsubara, N. , & Hara, H. (2008). Voluntary running exercise alters microbiota composition and increases n‐butyrate concentration in the rat cecum. Bioscience, Biotechnology, and Biochemistry, 72, 572–576. 10.1271/bbb.70474 [DOI] [PubMed] [Google Scholar]
- Meneses‐Lorente, G. , Watt, A. , Salim, K. , Gaskell, S. J. , Muniappa, N. , Lawrence, J. , & Guest, P. C. (2006). Identification of early proteomic markers for hepatic steatosis. Chemical Research in Toxicology, 19, 986–998. 10.1021/tx060007f [DOI] [PubMed] [Google Scholar]
- Morand, J. P. , Macri, J. , & Adeli, K. (2005). Proteomic profiling of hepatic endoplasmic reticulum‐associated proteins in an animal model of insulin resistance and metabolic dyslipidemia. Journal of Biological Chemistry, 280, 17626–17633. 10.1074/jbc.M413343200 [DOI] [PubMed] [Google Scholar]
- Murphy, E. F. , Cotter, P. D. , Healy, S. , Marques, T. M. , O'Sullivan, O. , Fouhy, F. , … Shanahan, F. (2010). Composition and energy harvesting capacity of the gut microbiota: Relationship to diet, obesity and time in mouse models. Gut, 59, 1635–1642. 10.1136/gut.2010.215665 [DOI] [PubMed] [Google Scholar]
- Musch, M. W. , Wang, Y. , Claud, E. C. , & Chang, E. B. (2013). Lubiprostone decreases mouse colonic inner mucus layer thickness and alters intestinal microbiota. Digestive Diseases and Sciences, 58, 668–677. 10.1007/s10620-012-2509-5 [DOI] [PMC free article] [PubMed] [Google Scholar]
- Nicholson, J. K. , Holmes, E. , Kinross, J. , Burcelin, R. , Gibson, G. , Jia, W. , & Pettersson, S. (2012). Host‐gut microbiota metabolic interactions. Science, 336, 1262–1267. 10.1126/science.1223813 [DOI] [PubMed] [Google Scholar]
- Onrust, L. , Ducatelle, R. , Van Driessche, K. , De Maesschalck, C. , Vermeulen, K. , Haesebrouck, F. , … Van Immerseel, F. (2015). Steering endogenous butyrate production in the intestinal tract of broilers as a tool to improve gut health. Front Vet Sci, 2, 75 10.3389/fvets.2015.00075 [DOI] [PMC free article] [PubMed] [Google Scholar]
- Rosenbaum, M. , Knight, R. , & Leibel, R. L. (2015). The gut microbiota in human energy homeostasis and obesity. Trends in Endocrinology and Metabolism, 26, 493–501. 10.1016/j.tem.2015.07.002 [DOI] [PMC free article] [PubMed] [Google Scholar]
- Santamaria, E. , Munoz, J. , Fernandez‐Irigoyen, J. , Prieto, J. , & Corrales, F. J. (2007). Toward the discovery of new biomarkers of hepatocellular carcinoma by proteomics. Liver International: Official Journal of the International Association for the Study of the Liver, 27, 163–173. 10.1111/j.1478-3231.2007.01447.x [DOI] [PubMed] [Google Scholar]
- Van den Abbeele, P. , Belzer, C. , Goossens, M. , Kleerebezem, M. , De Vos, W. M. , Thas, O. , … Van de Wiele, T. (2013). Butyrate‐producing Clostridium cluster XIVa species specifically colonize mucins in an in vitro gut model. ISME Journal, 7, 949–961. 10.1038/ismej.2012.158 [DOI] [PMC free article] [PubMed] [Google Scholar]
- Wanders, R. J. (2014). Metabolic functions of peroxisomes in health and disease. Biochimie, 98, 36–44. 10.1016/j.biochi.2013.08.022 [DOI] [PubMed] [Google Scholar]
- Wetterau, J. R. , Aggerbeck, L. P. , Laplaud, P. M. , & McLean, L. R. (1991). Structural properties of the microsomal triglyceride‐transfer protein complex. Biochemistry, 30, 4406–4412. 10.1021/bi00232a006 [DOI] [PubMed] [Google Scholar]
- Youngson, N. A. , Morris, M. J. , & Ballard, J. W. O. (2017). The mechanisms mediating the antiepileptic effects of the ketogenic diet, and potential opportunities for improvement with metabolism‐altering drugs. Seizure, 52, 15–19. 10.1016/j.seizure.2017.09.005 [DOI] [PubMed] [Google Scholar]
- Zhang, X. , Shen, D. , Fang, Z. , Jie, Z. , Qiu, X. , Zhang, C. , … Ji, L. (2013). Human gut microbiota changes reveal the progression of glucose intolerance. PLoS ONE, 8, e71108 10.1371/journal.pone.0071108 [DOI] [PMC free article] [PubMed] [Google Scholar]
- Zhao, X. , Guo, Y. , Liu, H. , Gao, J. , & Nie, W. (2014). Clostridium butyricum reduce lipogenesis through bacterial wall components and butyrate. Applied Microbiology and Biotechnology, 98, 7549–7557. 10.1007/s00253-014-5829-x [DOI] [PubMed] [Google Scholar]
Associated Data
This section collects any data citations, data availability statements, or supplementary materials included in this article.
Supplementary Materials
Table S1