

Abstract
The subiculum has been suggested to be involved in the initiation of pathological discharges in human patients and animal models of temporal lobe epilepsy. Although converging evidence has revealed the existence of functional diversity within its principal neurons, much less attention has been devoted to its intrinsic connectivity and whether its local excitatory circuits are sufficient to generate epileptiform activity. Here, we have directly addressed these two key points in mouse subicular slices. First, using multivariate techniques, we have distinguished two groups of principal cells, which we have termed type 1 and type 2. These subgroups roughly overlap with what were classically indicated as regular and bursting cells, and showed differences in the extension and complexity of their apical dendrites. Functional connectivity was found both between similar (homotypic) and different (heterotypic) types of cells, with a marked asymmetry within heterotypic pairs. Unitary excitatory postsynaptic potentials (uEPSPs) revealed a high degree of variability both in amplitude, failure rate, rise time and half-width. Post hoc analysis of functionally connected pairs suggested that the observed uEPSPs were mediated by few contact sites, predominantly located on the basal dendrites. When surgically isolated from extrasubicular excitatory afferents, pharmacologically disinhibited subicular slices generated hyper-synchronous discharges. Thus, we conclude that local subicular excitatory circuits, connected according to cell type-specific rules, are sufficient to promote epileptiform activity. This conclusion fits well with a previous suggestion that local subicular events, purely mediated by excitatory connections, may underlie the pre-ictal discharges that govern interictal–ictal transitions.
Keywords: burst, EPSP, synapse
Introduction
Neuronal diversity is a key determinant of the functional specificity of brain regions and networks (Kandel et al. 2012). In particular, the spatiotemporal integration of the activity of different subclasses of cortical neurons (Pelkey et al. 2017; Cembrowski and Spruston, 2019) expressing cell type-specific intrinsic conductances (Hille, 2001) and synaptically connected according to precise architectural rules (Somogyi et al. 1998; Klausberger & Somogyi, 2008) produces the complex computations that are required by sensory, motor and cognitive physiological processes (Kandel et al. 2012). In addition, in the epileptic brain, the specificity of neuronal circuits is an important determinant of the regional vulnerability to ictal and interictal events.
Neurophysiological studies at the microscopic level have underlined three main factors that appear to be mechanistically related to the overall susceptibility of a particular network to epileptiform activity.
The first factor is the presence of a substantial proportion of intrinsically bursting cells in the circuit (Traub & Miles, 1991) as found, for example, in the CA3 subfield (Wong & Prince, 1978; Masukawa et al. 1982; Bilkey and Schwartzkroin, 1990) and in the subiculum (Mason, 1993; Mattia et al. 1993; Taube, 1993; Behr et al. 1996; Greene & Totterdell, 1997; Staff et al. 2000; Menendez de la Prida, 2003; Menendez de la Prida et al. 2003; Jarsky et al. 2008; Kim & Spruston, 2012; Panuccio et al. 2012; Böhm et al. 2015; Cembrowski et al. 2018) of the hippocampal formation. Both networks are commonly involved in sustaining pathological discharges in human patients (Cohen et al. 2002; Wozny et al. 2005; Huberfeld et al. 2007, 2011; Alvarado-Rojas et al. 2015; Wang et al. 2017) and animal models (Fujita et al. 2014; Toyoda et al. 2015) of temporal lobe epilepsy (TLE). Although burst firing is necessary for a variety of physiological signalling states (Cooper et al. 2005; Simonnet & Brecht, 2019), trains of spikes at high frequency increase the reliability of excitatory synaptic connections (Lisman, 1997) and may trigger plasticity in positive feedback loops (Bains et al. 1999). Thus, the interplay of burst firing with synaptic facilitation may potentially lower the threshold for runaway excitation and generate pathological firing.
The second factor involves the degree of local connectivity and anatomical synaptic divergence/convergence of excitatory neurons. For example, in the hippocampus, epileptiform bursts originated by the branches of the CA3 pyramidal cell local axons may become sufficient to recruit the entire population of the subfield and then project interictal spikes to downstream regions (Traub & Miles, 1991).
Lastly, the efficacy of GABAergic inhibition has long been recognized to play a fundamental role in preventing epileptiform population activity. In fact, blockade of GABA receptors is an efficient and reliable pharmacological manipulation that induces epileptiform activity in susceptible networks both in vitro (Schwartzkroin & Prince, 1978; Miles & Wong, 1983; Wong & Traub, 1983) and in vivo (reviewed by Fisher, 1989).
The critical importance of the interaction among these three factors was elegantly shown by Miles & Wong (1983) with a direct experiment performed in pharmacologically disinhibited CA3 hippocampal slices. Under these conditions, a current-evoked burst of action potentials produced in an individual neuron generated fully synchronized population discharges.
Surprisingly, despite its involvement in the generation of epileptiform activity and in contrast to the wealth of information available on the synaptic architecture of the CA3 subfield (Traub & Miles, 1991, Guzman et al. 2016), to our knowledge, only a single study has directly examined the local functional connectivity of subicular cells (Böhm et al, 2015).
Here, we have taken advantage of simultaneous double and triple patch-clamp recordings and anatomical reconstructions to examine the connectivity between subicular pyramidal cells classified by objective multivariate methods. Additionally, we have tested whether these connections are sufficient to lead to the emergence of synchronized population activity in pharmacologically disinhibited slices.
Material and methods
Ethical approval
All animal procedures conducted in this study complied with the guidelines set out by the Institutional Animal Care and Use Committee of Northwestern University, the National Institutes of Health, and conform to the principles and regulations as described in the Editorial by Grundy (2015). The investigators understand the ethical principles under which the Journal of Physiology operates and that their work complies with this animal ethics checklist.
Animals
Male and female wild-type C57BL/6J animals (stock number: 000664; RRID: IMSR JAX:000664, Jackson Laboratory, Bar Harbor, ME, USA) between the age of P14 and P21 were used for experiments. Animals were housed on a 14/10 h light/dark schedule with ad libitum access to food and water.
Acute slice preparation
Mice were deeply anaesthetized with isoflurane in an induction chamber with a separating platform to avoid direct contact between the animals and the anaesthetic. After decapitation, the brain was carefully removed and glued to a specimen block in a chamber filled with cooled ACSF with the following composition (in mm): 130 NaCl, 24 NaHCO3, 3.5 KCl, 1.25 NaH2PO4, 1 CaCl2, 2 MgSO4, 10 glucose, saturated with 95% O2, 5% CO2 at pH 7.4. Transverse sections (400 μm) of an entire brain hemisphere containing the hippocampal formation were cut using a vibrating microtome (Leica VT 1200 S, Leica Biosystems, Wetzlar, Germany). Slices were recovered at 30–32°C for at least 30 min and were then stored at room temperature until use. Subicular mini slices were prepared from regular slices by severing the connections between the subiculum and CA1 hippocampal subfield/entorhinal cortex. Cuts were performed at locations with clear scatter of pyramidal cell bodies and with unambiguous widening of the pyramidal cell layer.
Electrophysiological recording and analysis
Slices/mini slices were transferred to a recording chamber positioned under a direct microscope (Scientifica, Uckfield, UK) equipped with oblique illumination optics (Olympus) and an infrared camera system (VX-45, TILL Photonics, Gräfelfing, Germany). Cells were visualized using a 60× infrared water-immersion objective. Slices/mini slices were superfused with preheated ACSF (31–33°C, TC-324B, Warner Instruments, Hamden, CT, USA) with the following composition (in mm): 130 NaCl, 24 NaHCO3, 3.5 KCl, 1.25 NaH2PO4, 2 CaCl2, 1 MgCl2, 10 glucose, saturated with 95% O2, 5% CO2 at pH 7.4.
Pipettes were pulled from thin borosilicate capillaries (Prism FLG15, Dagan Corp., Minneapolis, MN, USA) with a resistance of 3–5 MΩ when filled with an internal solution containing the following (in mm): 115 sodium methylsulfate, 10 KCl, 5 creatine phosphate, 5000 units creatine kinase, 4 ATP-Mg, 0.3 GTP-Na3, 16 KHCO3, 0.25% biocytin equilibrated with 95% O2–5% CO2 at pH 7.3. Recordings were performed using a Multiclamp 700 amplifier (Molecular Devices, Sunnyvale, CA, USA). Series resistances were balanced via a bridge circuit. Signals were filtered at 3 kHz and digitized at a minimum of 20 kHz using a Digidata 1550A and the Clampex 9 program suite (Molecular Devices).
Paired recordings and connectivity
Simultaneous double and triple whole-cell current clamp recordings from pyramidal neurons in the subiculum were taken to assess functional connectivity or epileptiform activity. Holding current was injected to maintain the cells close to their resting potential at ~−65 mV. Each recorded neuron was stimulated in an alternating fashion to trigger single action potentials at low frequency (0.1 Hz) using a 1 ms supra-threshold current injection. A functional connection was identified based on the presence of a short latency post-synaptic unitary excitatory post-synaptic potential (uEPSP) in the other cell(s) of the pair/triple recording, following the action potential in the stimulated neuron. For each connection identified as described (n = 63), several traces (n = 30) were collected, averaged, and the resulting uEPSPs were measured and analysed. Amplitude, half-width and 20–80% rise time, were estimated using the Clampfit 9 program (Molecular Devices). Putative failures were identified visually. When single spikes at low frequency in the putative presynaptic neuron did not reveal uEPSPs, we performed spike-triggered averaging of the action potentials generated by the long current pulses (1 s) used to define their firing patterns and other electrophysiological properties of the recorded cells. In a minority of cases (32 out of 1787), this analysis revealed uEPSPs that were not unequivocally apparent by single spikes at low frequency. These results were considered for the study of connectivity, but the underlying uEPSPs were neither quantified nor included in the analysis of uEPSP properties. In a few cases, as indicated in the text, voltage-clamp recordings were made in cell-attached configuration to evaluate epileptiform activity, and the command voltage was − 60 mV.
Anatomical recovery of biocytin-filled pairs
Slices with filled neuron pairs were fixed for 24 h in 4% paraformaldehyde solution in 0.1 m PB at 4°C. Endogenous peroxidase activity was quenched using 3% H2O2 solution for 20 min. Slices were then incubated overnight at 4°C in an avidin-biotinylated-HRP complex (VECTASTAIN ABC Elite Kit, Vector Laboratories, Burlington, ON, Canada), permeabilized with 0.1% Triton X-100 in 0.1 m PB, and visualized by a peroxidase reaction using 3,3′-diaminobenzidine tetrahydrochloride as a chromogen. The labelling was intensified with 0.0012% NiNH4SO4 and 0.0016% CoCl2. Slices were then post-fixed with 0.1% OsO4 in 0.1 m PB for 1–2 min, mounted on slides and coverslipped with Mowiol.
Filled connected neurons were reconstructed in 3D using a Neurolucida-based station and software (MBF Bioscience, Williston, VT, USA). Putative synapses were identified by light microscopy as locations at which a pre-synaptic axon and a post-synaptic dendrite were in close apposition in the same focal plane with an enlargement (bouton) of the pre-synaptic side. The synaptic distance from the soma was calculated as the average of all the identified putative contact sites. Only neurites with no obvious truncation were used for subsequent analysis.
Drugs
Gabazine (SR 95531 hydrobromide) was purchased from Tocris (Minneapolis, MN, USA), prepared as a stock solution in water, and used in experiments at 12.5 μm. CGP55845 was purchased from Tocris, prepared as a stock solution in DMSO, and used at 5 μm. DMSO (0.005%) was also included in control solutions when experiments involved the use of CGP55845.
Experimental design and statistical treatment of the data
Separation of neurons in subpopulations (type 1 and type 2) based on their electrophysiological properties.
For classification purposes, neurons were studied by injecting long (1 s) current pulses in the hyperpolarizing and depolarizing direction from a membrane potential held close to rest (~−65 mV). Both the peak and the steady-state voltage responses to hyperpolarizing current steps (−200 to −25, 25 pA steps) were measured and linearly fitted to estimate values of membrane input resistance at these two time points. Additional electrophysiological parameters were also quantified in the responses to a current injection level equal to the first intensity able to trigger firing, increased by 50 pA. We counted the total number of spikes produced, and studied several parameters for the first two spikes of the response. In particular, we measured: spike threshold (reached when membrane potential dV/dt exceeds 10 V/s, Fricker et al. 1999), amplitude (difference between threshold and action potential peak), half-width, time of peak (from the beginning of the current pulse), amplitude of peak after depolarization/afterhyperpolarization (difference between threshold and the maximal positive/negative voltage following the spike), and afterdepolarization/afterhyperpolarization latency from the preceding spike. These 15 parameters were subjected to principal component analysis (PCA, Joliffe, 1986) using OriginPro 2019b (Origin Lab, Northampton, MA, USA). We further considered only the first three extracted principal components, which accounted for 32% (PC1), 25% (PC2) and 12% (PC3) of the total data variance. Euclidian distances (Ed) between individual data points were calculated as Ed = √ [(ΔPC1)2 + (ΔPC2)2 + (ΔPC3)2]. OriginPro 2019b was also used to fit Gaussian mixture models (GMMs; Hartigan, 1975) to the three principal components, and separate the recorded neurons in subpopulations based on Bayesian Information Criterion (BIC) analysis (Schwartz, 1978).
Sholl analysis.
Radial segments of 50 μm intervals were centred to the soma of the analysed cell. The total length of every neuronal branch (axon, basal dendrite and apical dendrite) within each segment was calculated for every measured neuron using a custom script in VisualBasic.
Anatomical density plots of pairs.
Reconstructed pairs were merged and aligned to the apical dendrite of the individual post-synaptic neuron. For the subsequent analysis only the post-synaptic dendrites and the pre-synaptic axons were used. The combined reconstructed pairs were placed in a Cartesian grid and the average length of each neuronal segment within grid-boxes of 25 × 25 μm was calculated, yielding a raw density matrix. To obtain the axo-dendritic overlap, the axonal/pre-synaptic matrix was multiplied by the dendritic/post-synaptic matrix and then normalized by the sum of all values. The matrices were then transferred to OriginPro 2019b (Origin Lab, Northampton, MA, USA) to create a contour plot.
Network activity of subicular mini slices.
Baseline activity was recorded in simultaneous double and triple recordings for 3 min in control solutions (DMSO, 0.005%) before the application of gabazine and CGP55845 for at least 15 min. Synchronous discharges were quantified by measuring their area (from beginning to return to initial resting potential), frequency of firing, number of spikes and overall duration (time between first and last spike of the discharge) using Clampfit.
For homotypic pairs, Δ latency values were calculated by randomly assigning one cell of the pair as the reference neuron. For heterotypic pairs, type 1 pyramidal cells were always considered as the reference neuron (i.e. positive Δ latency values indicate initial spikes occurring earlier in a type 2 cell compared to a type 1 neuron).
Modelling the impact of misclassification on connection probabilities.
We estimated 95% confidence intervals of the estimated connection probabilities for each pairing, taking misclassification into consideration, using the approach described below. We denote the misclassification probability as α. Our computations assume that misclassification is independent of the presence of a functional connection in the tested pairs.
To begin, we define the following quantities:
N11 = number of observed type 1 to type 1 pairs
p11 = proportion of functional connections in observed type 1 to type 1 pairs
N12 = number of observed type 1 to type 2 pairs
p12 = proportion of functional connections in observed type 1 to type 2 pairs
N21 = number of observed type 2 to type 1 pairs
p21 = proportion of functional connections in observed type 2 to type 1 pairs
N22 = number of observed type 2 to type 2 pairs
p22 = proportion of functional connections in observed type 2 to type 2 pairs
The observed pair subtypes are defined by our original multivariate analysis applied to whole-cell recording data and therefore may include experimental misclassifications (run-down, see Results).
We can treat a binomial proportion that is approximately normally distributed, namely . Using this normal approximation to the binomial requires that p11N11 ≥ 5 and (1 − p11)N11 ≥ 5, which is the case for our observed data. We treat , and similarly. (Of note, the data for the type 1 to type 1, type 1 to type 2 and type 2 to type 2 conditions also satisfy the more stringent condition that these quantities be greater than or equal to 9 for the normal approximation to hold).
For notational convenience, we define σ11 … σ22 as the corresponding standard deviations:
Now we let M11 = number of actual type 1 to type 1 pairs (without misclassification), and define M12, M21 and M22 analogously. Similarly, we let q11 = proportion of functional connections in actual type 1to type 1 pairs, and we define q12, q21, and q22 analogously.
Then using E to denote the expected value, we have
It follows that each of the q’s can be expressed as a weighted sum of the p values:
Because the q values are sums of independent normal random variables, they are also normally distributed as follows:
where the w’s are:
and
with
The 95% confidence intervals for were generated from these normal distributions.
Data presentation and statistical tests.
Unless otherwise indicated, data are presented as mean (SD). Box charts indicate the median as a middle line, lower and upper quartiles as upper and lower box borders, and minimum and maximum as whiskers. Statistical tests were used to estimate the probability of the null hypothesis, and Pvalues (rounded to two decimal places) are directly indicated. Tests used are abbreviated as follows: Mann–Whitney test: M-W, two-way ranked ANOVA: 2-r-ANOVA, and chi square test: χ2.
Results
As mentioned above, several studies have provided strong and converging evidence for functional diversity in subicular pyramidal cells by revealing the existence of neurons responding to current injections with either regular-or bursting trains of action potentials (Mason, 1993; Mattia et al. 1993; Taube, 1993; Behr et al. 1996; Greene & Totterdell, 1997; Staff et al. 2000; Menendez de la Prida, 2003; Menendez de la Prida et al. 2003; Jarsky & Spruston, 2008; Kim & Spruston, 2012; Panuccio et al. 2012; Böhm et al. 2015; Cembrowski et al. 2018). However, the separation of subicular cells into these two functional classes based on the examination of their firing pattern in response to current pulses does present technical ambiguities, as the definition of a burst itself has not been univocal in the literature.
For example, the number of spikes required in the recorded response to be defined as a burst has ranged from 2–4 (Mason, 1993), 3–5 (Taube, 1993), 2–3 (Behr et al. 1996; Menendez de la Prida, 2003; Menendez de la Prida et al. 2003; Kim & Spruston, 2012), 2 or more (Staff et al. 2000), to 3 or more (Greene & Totterdell, 1997; Panuccio et al. 2012; Böhm et al. 2015). Similarly, the minimal spike frequency necessary to define a burst has been subjected to variable requirements (> 200 Hz: Staff et al. 2000; > 100 Hz: Kim & Spruston, 2012; Graves et al. 2012; and > 125 Hz: Böhm et al. 2015). Lastly, the intensity and duration of the current step injected into cells has also been quite variable across studies, with the use of different parameters potentially affecting the resulting classification (as shown by Cooper et al. 2003).
Furthermore, the existence of subpopulations within the two main groups of regular firing and bursting neurons has also been proposed. For example, regular firing cells displaying different accommodation properties have been described (Menendez de la Prida et al. 2003), as well as the presence of ‘weak’ and ‘strong’ bursting neurons (depending on the number of bursts generated during a 1 s current pulse: Staff et al. 2000).
Thus, biological diversity, coupled to the use of non-uniform and potentially subjective criteria for cell classification, may make the comparison of results obtained in different studies inherently problematic.
More recently, the use of multivariate methods that take into consideration multiple electrophysiological membrane properties have reinforced the idea that two separate groups of subicular pyramidal cells with regular and bursting firing patterns can be objectively separated and identified (Graves et al. 2012).
To our knowledge, only a single study has examined the detailed cell type-specific connectivity between functionally distinct types of subicular neurons (Böhm et al. 2015). Therefore, we decided to re-examine this issue both functionally and anatomically in subicular pyramidal cells classified by the combined use of PCA and GMM-BIC. Figure 1A and B shows the results from the PCA of 15 electrophysiological parameters measured in n = 70 double and n = 285 triple simultaneous recordings (total n = 995 cells, for details see the Methods section and the figure legend). Application of GMM-BIC analysis suggested the presence of two groups of functionally diverse cells, which we termed ‘type 1’ and ‘type 2’ (Fig. 1B–D). This result matches well with the firing pattern of the cells. As shown in Fig. 1C, the overall distribution of the initial firing frequency of the studied cells was clearly multimodal, with type 1 and type 2 cells associated with the lower and higher initial frequency peak, respectively [type 1: 16 (SD 22) Hz, n = 486 vs. type 2: 169 (SD 34) Hz, n = 509). Figure 1D directly shows the similarity among cells belonging to the same group and the differences between the two classes. These responses are also very similar to what has been previously described for regular firing (type 1) and intrinsically bursting (type 2) subicular pyramidal neurons.
Figure 1. Principal component and Gaussian mixture models analysis of functional diversity in subicular pyramidal cells.
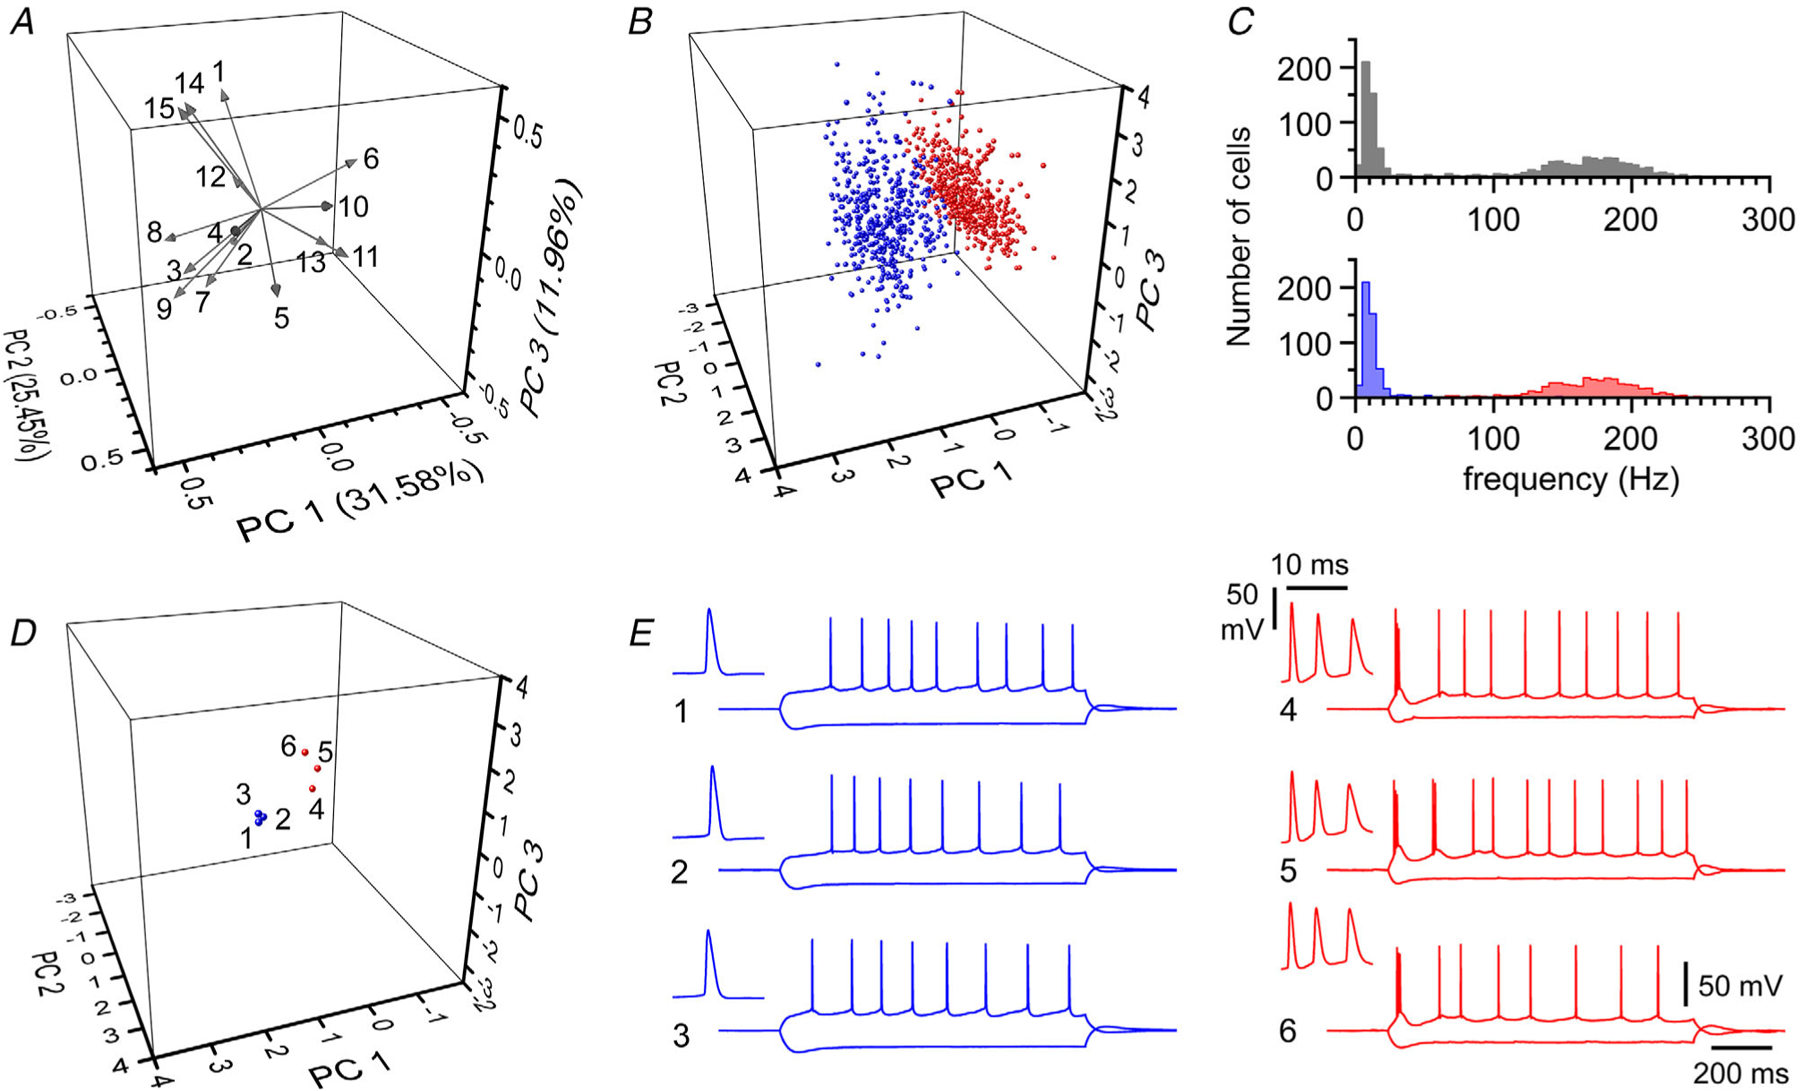
A, 3D loading plot for the different variables measured in response to a depolarizing and hyperpolarizing response (see Methods for details). Number of spikes (1), amplitude of first (2) and second spike (3), time of the first (4) and second (5) spike, half-width of the first (6) and second spike (7), threshold voltage of the first (8) and second (9) spike, amplitude of the afterpotential following the first (10) and second (11) spike, latency from spike peak of the afterpotential following the first (12) and second (13) spike, membrane input resistance at peak (14) and steady-state of the hyperpolarizing (15) response. B, summary scatterplot of the sample of 995 recorded cells represented in the 3D principal component space. Colours distinguish type 1 from type 2 cells (blue and red, respectively), as determined by BIC. C, summary plot of the frequency of the first two action potentials measured in depolarizing responses. Top and bottom graphs show the overall distribution before (grey) and after the distinction in type 1 (blue) and type 2 (red) neurons. Note the bimodal shape of the plot and that type 1 cells are associated with the lower frequency peak compared to type 2 cells. D, left: selected examples of type 1 (blue) and type 2 (red) neurons in the 3D space given by the PCA. Right: actual recordings showing the responses to depolarizing and hyperpolarizing responses. Note the regular firing and bursting phenotype of type 1 (blue) and type 2 (red) cells, respectively. Insets show the initial spikes at higher temporal resolution.
In addition to recording their firing pattern and membrane properties, the neurons described in Fig. 1 were tested for functional synaptic connectivity, as shown in Fig. 2. Both homotypic (type 1 to type 1 or type 2 to type 2, Fig. 1A and B) and heterotypic pairs (type 1 to type 2, Fig. 2C and D; type 2 to type 1, Fig. 2E and F) of neurons were tested. uEPSPs were observed in ~5% of the cases (95/1850), which compares well to the estimate of ~4% reported by Böhm et al. (2015). This value appears higher than what has been reported for the local excitatory connectivity of other regions of the hippocampal formation (CA1: ~1%, Deuchars & Thomson, 1996, CA3 ~2%: Miles & Wong, 1986 and ~1%: Guzman et al. 2016) and may underlie the vulnerability of the subicular network to epileptiform activity.
Figure 2. Principal component analysis of the connectivity between homotypic and heterotypic pairs of cells.

A, 3D summary plot for type 1 (blue) and type 2 (red) homotypic pairs. Arrows indicate the direction of the connection tested from presynaptic to postsynaptic neurons. Left: unconnected neurons; right: connected pairs. B, boxplots comparing the Euclidean distances for unconnected (circles) and connected (circles and arrow) neurons in type 1 (blue) and type 2 (red) homotypic pairs. C–F, similar plots for heterotypic type 1 to type 2 (blue vectors and bicolour boxplots with blue at the top and red at the bottom) and type 2 to type 1 connections (red vectors and bicolour boxplots with red at the top and blue at the bottom).
Within each subgroup (homotypic or heterotypic) of connections tested, the similarity between the cells of the pair did not seem to differ in non-connected vs. connected pairs. The Euclidean distances between homotypic pairs of non-connected and connected type 1 cells were 1.55 (SD 0.83) a.u. (n = 597 pairs) and 1.37 (SD 0.74) a.u. (n = 29 pairs) respectively (P = 0.26, M-W). Similar values were also found between homotypic non-connected and connected type-2 cells [1.42 (SD 0.81) a.u., n = 618 pairs and 1.54 (SD 0.84) a.u., n = 34 pairs respectively, P = 0.44, M-W]. In the heterotypic pairs (type 1 to type 2), the distance was 2.40 (SD 0.82) a.u. in non-connected pairs (n = 261) and 2.18 (SD 0.76) a.u. in connected pairs (n = 25) (P = 0.20, M-W). Lastly, in type 2 to type 1 pairs, distance was 2.39 (SD 0.82) a.u. in non-connected (n = 279) vs. 2.00 (SD 0.57) a.u. in connected pairs (n = 7, P = 0.24, M-W). The most parsimonious explanation of these results is that subicular pyramidal neurons are not homogeneous, but belong to at least two distinct functional groups (as suggested by BIC, see Methods) or, alternatively, that subclasses within the two main groups do not play a major role in determining their synaptic connectivity.
To corroborate this interpretation and our suggestion that PCA and GMM can accurately distinguish the two different classes of pyramidal neurons, we decided to compare their anatomical properties in a sample of cells that were filled with biocytin during whole-cell recording and then digitally reconstructed (Fig. 3A and B). As shown in Fig. 3C and D, a remarkable similarity was found in most but not in all membrane domains. No differences were revealed by Sholl analysis for either basal dendrites (P = 0.61, n = 19 and 29 type 1 and type 2 neurons, respectively) or axons (P = 0.10, n = 18 and 24 type 1 and type 2 neurons, respectively). However, a significant difference was found when the apical dendrites were compared (P = 0.01, n = 21 and 29 type 1 and type 2 neurons, respectively, 2-r-ANOVA). Consistently, measurements of total length for basal dendrites and axons were not different in type 1 vs. type 2 cells [type 1 basal dendrites: 2590 (SD 904) μm, n = 19 and type 1 axons: 2415 (SD 1148) μm, n = 18, compared to type 2 basal dendrites: 2811 (SD 1516) μm, n = 29 and type 2 axons: 3022 (SD 1787) μm, n = 22, P = 0.35 and P = 0.39, respectively]. In contrast, the estimated values for the total length of apical dendrites were higher in type 1 neurons [5574 (SD 1059) μm, n = 21] compared to type 2 neurons [4579 (SD 1599) μm, n = 29, P = 0.01]. This result extends our previous interpretation that type 1 and type 2 cells revealed by PCA and GMM-BIC analysis represent, in fact, two distinct subpopulations of pyramidal cells both functionally and structurally.
Figure 3. Anatomical properties of type 1 and type 2 pyramidal neurons.
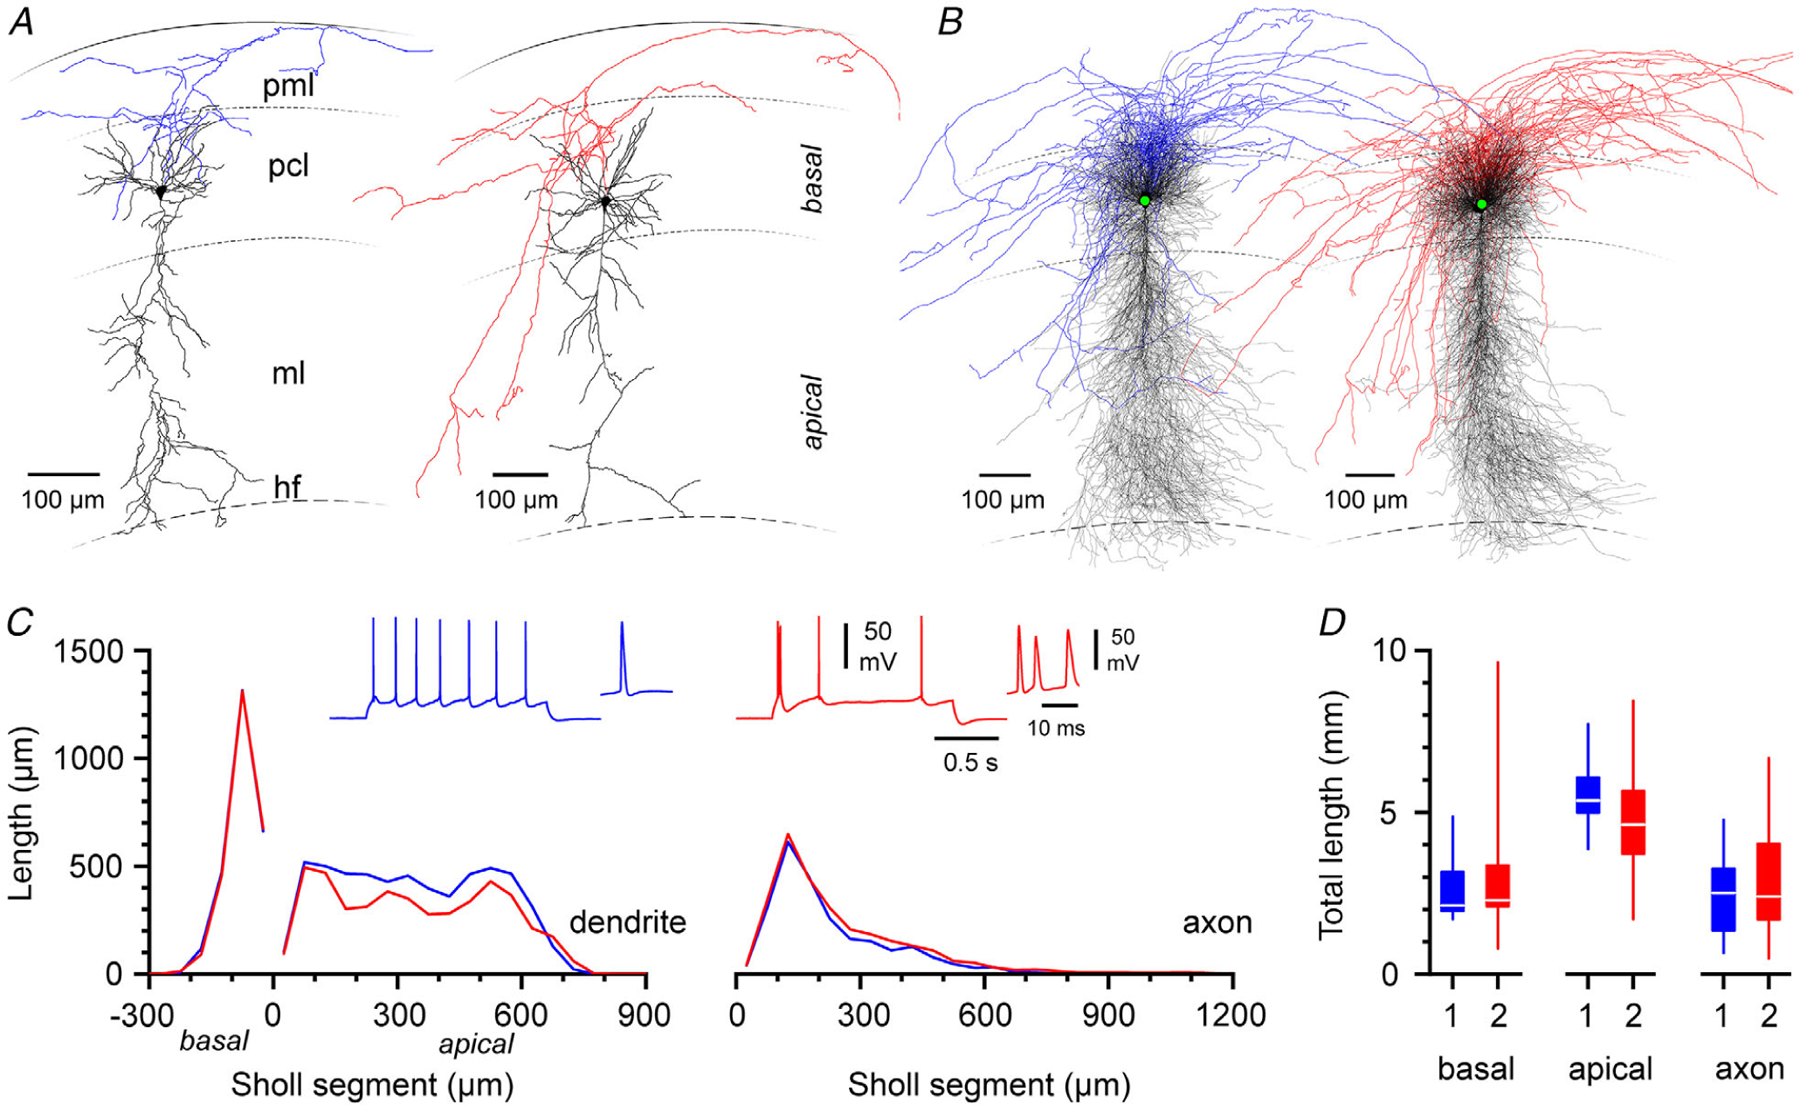
A, individual examples of reconstructions of a type 1 (left) and type 2 (right) subicular cell. Soma and dendrites are in black, the axon is either in blue (type 1 cell) or in red (type 2 cell). Pml: polymorphic layer, pcl: pyramidal cell layer, ml: molecular layer, hf: hippocampal fissure. B, superimposition of all the reconstructed neurons separated according to their subclass (type 1: left; type 2: right). C, left: Sholl analysis comparing the properties of basal (negative Sholl segment values) vs. apical (positive Sholl segment values) dendrites in type 1 (blue) and type 2 (red) neurons. Right: summary plot of the same type of analysis for the axon of the reconstructed cells. Note the selective difference in the apical dendritic arborization and the similarity of basal dendrites and axons. The insets show examples of depolarizing responses in type 1 (blue) and type 2 (red) neurons with magnifications of the initial action potentials. D, summary plots of the dendritic lengths for the three membrane compartments (basal, apical dendrites and axon) for the two different cell groups (type 1: blue; type 2: red).
Next, we measured the properties of uEPSPs triggered by a single action potential at low frequency (0.1 Hz) in homotypic and heterotypic connections. As shown in Fig. 4, a large degree of functional variability was present, even within the same group of connections. Homotypic type 1 connections (Fig. 4A and B) generated uEPSPs with failure rates of 42% (SD 21), amplitudes of 0.53(SD 0.39) mV, and rise times and half-widths of 2.3 (SD 1.1) ms and 23.6 (SD 6.4) ms, respectively (n = 20 uEPSPs). Similar values were observed in the uEPSPs recorded between pairs of type 2 cells [Fig. 4C and D: failure rates: 39% (SD 25), amplitudes: 0.53 (SD 0.37) mV, rise times: 2.5 (SD 0.9) ms and half-widths: 21.5 (SD 5.1) ms, n = 22 uEPSPs]. Heterotypic connections between type 1 and type 2 neurons were also identified (Fig. 4E and F) and their parameters were similar to what was estimated in homotypic uEPSPs [failure rate: 41% (SD 26), amplitude: 0.56 (SD 0.78) mV, rise times: 2.6 (SD 0.6) ms and half-widths: 21.9 (SD 6.0) ms, n = 18].
Figure 4. Properties of uEPSPs generated by low-frequency spikes (0.1 Hz, see Methods for details) in the most commonly encountered connections in subicular local circuits.

A, homotypic type 1 to type 1 cell connection. Examples of a strong (left) and weak (right) uEPSP. The presynaptic action potential (average of 12 spikes) and postsynaptic responses (12 superimposed traces) are shown in the top and bottom panels, respectively. The insets show the response to depolarizing current injections (blue) used for the classification of the cells, with the initial action potential enlarged in the sub-insets. B, summary plots of the failure rate, peak amplitude, 20–80% rise time, and half-width of the population of uEPSPs. C–F, same organization as A and B for uEPSPs recorded between homotypic type 2 and heterotypic type 1 to type 2 connections. Note the large variability in all the measured parameters independently of the type of connection considered.
In contrast, heterotypic uEPSPs between type 2 and type 1 cells could be measured only in three connections revealed by low-frequency single spikes [Fig. 5A, failure rate: 13% (SD 10), amplitude: 0.57 (SD 0.37) mV, rise time: 2.9 (SD 0.9) ms and half-width: 28.1 (SD 9.9) ms]. However, some paired recordings from apparently synaptically unconnected type 2 to type 1 neurons revealed very small amplitude uEPSPs when spike-triggered averaging was performed on the traces recorded during the current steps injected to determine firing patterns (Fig. 5B). This suggests the possibility that these connections may be easily missed because of their small amplitude and/or because of their frequency dependence. Unitary EPSPs from these connections could not be accurately measured and therefore their properties were not further analysed.
Figure 5. Properties of uEPSPs of the rarest connection between type 2 and type 1 cells and overall cell type-specificity of local subicular excitatory circuits.

A, example of a uEPSP generated by generated by low-frequency spikes (0.1 Hz, see Methods for details) recorded between a presynaptic type 2 cell and a postsynaptic type 1 cell. The presynaptic action potential (average of 12 spikes) and postsynaptic responses (12 superimposed traces) are shown in the top and bottom panels, respectively. The insets show the response to depolarizing current injections (red, presynaptic cell; blue, postsynaptic neurons) used for classification of the cells, with the initial action potential enlarged in the sub-insets. B, example of a heterotypic type 2 to type 1 connection revealed by spike-triggered averaging of the action potentials generated by the depolarizing currents used for classification of the cells (see insets and sub-insets with the same colour code as in A). Top panel: average of presynaptic spikes (n = 77). Lower panels: several individual traces (n = 77) superimposed (black) and their average (grey). C, summary plot of the connectivity probability between different types of cells (blue, type 1 cells; red, type 2 cells). Note the asymmetry in the connectivity between heterosynaptic pairs.
When we considered the overall probability of finding functional connections (revealed either by single spikes as in Fig. 4 or by firing pattern steps as in Fig. 5B), we observed a cell type-specific-dependent organization (Fig. 5C, P = 0.01, χ2). In particular, we estimated the following probabilities for the various types of connections: type 1 homotypic 4.6% (626 tested), type 2 homotypic 5.2% (652 tested), type 1 to type 2 heterotypic 8.7% (286 tested), and type 2 to type 1 2.4% (286 tested).
Assuming that type 1 and type 2 cells can be translated into regular firing and bursting neurons, then our results would appear very similar to what was reported by Böhm et al. (2015). The only difference is that we suggest the existence of heterotypic connectivity in both directions, whereas the aforementioned study reported exclusively a strict unidirectional heterotypic connectivity from regular spiking to bursting cells, with no uEPSPs generated by bursting cells onto regular firing neurons.
As whole-cell recordings are susceptible to run-down, which could affect intrinsic properties and the resulting classification as type 1 vs. type 2 neurons, we decided to measure with a combined experimental/modelling approach its potential effect on our connectivity estimates. First, we recorded membrane properties and responses to depolarizing current injections from an additional sample of cells (n = 112) immediately after breakthrough and after 10 min, which is the maximum length of our physiological experiments. As shown in Fig. 6A, these neurons were then classified as type 1 or type 2 cells using the same methods described for the pairs tested for connectivity. Although most cells maintained their classification, a small percentage (7.9%) showed a time-dependent loss of its initial type 2 phenotype (Fig. 6B). This is probably explained by the run-down of the calcium currents underlying bursting (Jung et al. 2001). In contrast, no cell that was initially classified as type 1 transitioned to the type 2 phenotype. We then built a mathematical model (see Methods for details) that allowed us to estimate the confidence intervals of the connectivity for various misclassification rates (Fig. 6C: experimentally determined α = 7.9% and Fig. 6D from 5 to 35%). As indicated in Fig. 6C and D, misclassification (even at high rates) would not completely eliminate the presence of type 2 to type 1 connections, therefore indicating that our observation is unlikely to be due to a run-down artefact, but is a real biological phenomenon.
Figure 6. Effect of prolonged recording on membrane properties and cellular classification.

A, left panel: a sample of subicular cells (n = 112) recorded immediately after breakthrough and classified as type 1 (blue) or type 2 cell (red) added to the cells used to test for connectivity in Fig. 1 (grey, n = 995). Right panel: same analysis performed after 10 min of recording. B, the shift in the position of the cells shown in the left and right panels of A is indicated by vectors. Blue and red vectors indicate type 1 and type 2 cells maintaining their phenotype, whereas green vectors indicate type 2 cells acquiring type 1 phenotype (n = 6 out of 76). Note that no type 1 neuron transitioned to a type 2 phenotype. C, cell type-specific connectivity after correction using the experimentally determined misclassification rate of 7.9%. Circles and bars indicate the estimated connectivity probability and its 95% confidence interval. D, plot of the cell type-specific connectivity and 95% confidence intervals after correction for different misclassification rates (5, 10, 15, 20, 25, 30 and 35%). Note that type 2 to type 1 connections persist even at the highest values of misclassification rate.
From a structural point of view, the location of synaptic contacts established by the different subgroups of subicular pyramidal cells is currently unknown. In the hippocampal formation, there are substantial differences between the CA3 and CA1 subfield with connections both on apical and on basal dendrites in CA3 (Ishizuka et al. 1990; Guzman et al. 2016), but only on basal dendrites in CA1 (Deuchars and Thomson, 1996; Esclapez et al. 1999). Figures 7 and 8 show examples of reconstructions obtained from synaptically connected homotypic and heterotypic pairs. We examined areas of overlap between axonal branches of the presynaptic cell and the dendritic arborization of the postsynaptic neuron with the aim of identifying putative synaptic sites. Figure 9 shows summary plots of all the identified putative contact sites and of the relative position of all presynaptic neurons of the connected pairs to their postsynaptic targets.
Figure 7. Anatomical properties of homotypic connections.

A, upper boxed panel: anatomical reconstruction of a type 1 to type 1 connected pair with putative contact sites (green arrowheads). The dendrites of the presynaptic neuron are in light grey and the axon in blue. The postsynaptic neuron is represented with black dendrites and light blue axon. The cartoon in the inset (left upper corner) indicates the relative position of the two cells and the arrow in the axon the direction of connectivity. The boxed insets to the right show the location of the putative contact sites. Lower panel, left: 3D representation, in multimedial space, of the connection between the reconstructed pair in the upper panel (blue vector). Grey vectors represent all the homotypic type 1 pairs tested. Right: presynaptic action potential and uEPSP between the reconstructed cells (average of 30 traces). B, identical organization as in A, but for a type 2 homotypic connection. Axons are in red and purple for the presynaptic and postsynaptic neuron, respectively.
Figure 8. Anatomical properties of heterotypic connections.

A, upper boxed panel: anatomical reconstruction of a type 1 to type 2 connected pair with putative contact sites (green arrowheads). The dendrites of the presynaptic neuron are in light grey and the axon in blue. The postsynaptic neuron is represented with black dendrites and purple axon. The cartoon in the inset (left upper corner) indicates the relative position of the two cells and the arrow in the axon the direction of connectivity. The boxed inset to the right shows the location of the putative contact sites. Lower panel, left: 3D representation, in multimedial space, of the connection between the reconstructed pair in the upper panel (blue vector). Grey vectors represent all the heterotypic type 1 to type 2 pairs tested. Right: presynaptic action potential and uEPSP between the reconstructed cells (average of 30 traces). B, identical organization as in A, but for a type 2 to type 1 heterotypic connection. Axons are in red and light blue for the presynaptic and postsynaptic neuron, respectively.
Figure 9. Biometric properties of connected pyramidal neurons and putative synapses.

A, left: superimposed images of pre-synaptic axons (red) and post-synaptic dendrites (black) from all reconstructed pairs (n = 30); all cells aligned to the post-synaptic soma (white triangle). Middle: light microscopy identified putative synapses and connected post-synaptic dendritic segments (type 1: blue, type 2: red). The type of synaptic pair is coded by the filled circles (homotypic type 1 connections: blue circles, homotypic type 2 connections: red circles, heterotypic type 1 to type 2 connections: blue–red circles, heterotypic type 2 to type 1 connections: red–blue circles). Right: location of pre-synaptic somata (triangles – same colour code as in the previous panel) relative to the postsynaptic cell (white triangle). B, density plot of post-synaptic dendrites (left: dendrites) and pre-synaptic axons (middle: axons) of functionally connected pairs. Right: calculated axo-dendritic overlap with putative synapses indicated by the grey dots (overlap). C, same analysis as in B, but performed on non-connected pairs. Note the lower number of background close appositions.
The number of putative contact sites found in n = 5 homotypic type 1 pairs was 3.0 (SD 2.0), and the vast majority (87%) appeared located on postsynaptic basal dendrites with an overall mean distance of 120 (SD 39) μm from the soma. Similarly, we identified 2.1 (SD 1.1) close appositions in homotypic type 2 connections, located, for the most part, on basal dendrites [84%, mean distance from the soma 97 (SD 40) μm, n = 12 pairs]. In the heterotypic pairs we found 2.2 (SD 1.2) close appositions in type 1 to type 2 connections and 1.0 (SD 0.0) in type 2 to type 1 pairs, with, in both cases, a predominant preference for the basal dendrites of the postsynaptic cell (90 and 100%, respectively). The average distances from the soma were 132 (SD 73) and 103 (SD 31) μm (n = 10 and n = 3, respectively).
It is also interesting to note, as shown in Fig. 9C, that presynaptic neurons of connected pairs were located in the more superficial (i.e. closer to the fissure) and proximal (i.e. more towards CA1) quadrant relative to their targets (P < 0.01, χ2), suggesting a preferential directional bias in the flow of local excitatory connectivity.
We decided to evaluate the degree of reliability for our estimation of putative contact sites (Fig. 9). First, we calculated density maps for the presynaptic axonal cloud and postsynaptic dendritic tree of functionally connected pairs, and from them obtained a quantitative estimation of their degree of overlap. As shown in Fig. 9, and as expected, close appositions between the pre- and post-synaptic structures of connected cells were concentrated in the areas of stronger overlap. In total, from 30 functionally connected pairs, we identified 67 putative contact sites for an average of 2.2 putative contacts per functional connection. However, when the same analysis was performed from pairs with no functional evidence of synaptic connections, the number of putative contact sites per cell pair was 0.6, suggesting that ~73% of the putative contact sites were actual synapses and only 27% were false positive results.
Next, we applied another test of our approach based on the knowledge that the spatial location of synaptic contacts has important physiological implications. For example, the cable properties of dendrites (Rall, 1977) may filter events and impact both amplitudes and kinetics of post-synaptic potentials propagating to the soma (Spruston et al. 1994). As shown in Fig. 10, this was probably the case under our experimental conditions, as a significant correlation between amplitude and rise time of all the uEPSPs recorded was present (r = −0.29, P = 0.02, n = 63 uEPSPs). Therefore, we reasoned that if our estimated somatic distance of putative contact sites was (even partially) correct, then we would expect to observe a correlation with the measured rise times of the uEPSPs. As shown in Fig. 10, this expectation was verified and a significant correlation was found (r = 0.66, P = 0.00, n = 22 uEPSPs), further corroborating the validity of our approach.
Figure 10. Correlation between amplitude and putative synapse location with uEPSP rise time.

Left: summary plot showing the correlation between peak of uEPSP and its rise time. Homotypic type 1 connections: blue circles, homotypic type 2 connections: red circles, heterotypic type 1 to type 2 connections: blue–red circles, heterotypic type 2 to type 1 connections: red–blue circles. Right: population graph of the correlation between uEPSP rise time and location of putative contact sites. The inset shows specific uEPSPs (as indicated by the numbers and arrows) from the different groups of connections (according to the schematics shown by circles and arrows, blue: type 1 neuron; red, type 2 cells). Differences in amplitude and kinetics have been highlighted by superimposing pairs of uEPSPs aligned onto their peaks.
So far, our results suggest the existence of a high degree of excitatory local circuit connectivity mostly mediated by synapses on the basal dendrites of pyramidal cells. As discussed above, the subiculum appears to have the highest level of local excitatory interconnectivity compared to other regions of the hippocampal formation. Thus, we decided to directly test whether this can be translated in a propensity for both hyper-synchronicity and hyper-excitability under conditions of impaired GABAergic neurotransmission.
We prepared subicular slices surgically isolated from its main afferents (i.e. the CA1 hippocampus and adjacent cortical areas; Fig. 11A). Under these experimental conditions, recorded subicular cells did not show any type of supra-threshold synchronization (n = 6 slices, Fig. 11B). In contrast, when antagonists of GABAA and GABAB receptors (gabazine, 12.5 μm and CGP55845, 5 μm) were applied, large synchronous epileptiform events appeared in n = 11 out of 13 slices (Fig. 11C–E, P = 0.00, χ2). These events were quite variable and produced28 (SD 23) spikes at a frequency of 58.9 (SD 40.1) Hz (n = 24 cells recorded in whole-cell mode and three in cell-attached configuration from 11 slices). Their duration was 735 (SD 697) ms and their overall strengths, quantified as the integral of membrane voltage in time, was 20.1 (SD 14.7) V.ms (n = 24, in the three cells recorded in cell-attached configuration these measurements could not be made). Thus, under reduced conditions as in a mini-slice, subicular local excitatory circuits appear to be sufficient to integrate intrinsic excitability and produce population discharges.
Figure 11. Epileptiform activity sustained by local excitatory circuits in subicular mini slices.

A, left: micrograph of a subicular mini slice. Note the surgical cuts isolating the subiculum both from the hippocampal CA1 subfield and from the adjacent cortex. Right: summary plots of the properties of supra-threshold synchronous events recorded in six double and five triple recordings from n = 11 slices exposed to gabazine (GBZ; 12.5 μm) and CGP55845 (5 μm). B, example of a control experiment showing the lack of supra-threshold epileptiform activity in mini slices exposed to drug-free ACSF. Simultaneous recording from two subicular pyramidal neurons (cell 1 and cell 2). C–E, left: examples of synchronous epileptiform discharges in slices exposed to blockers of GABA receptors. The discharges highlighted in red are shown at an expanded time scale to the right.
To further explore the potential differential contribution of type 1 and type 2 pyramidal cells to these hyper-synchronous events, we carried out similar experiments preceded by current step injections before the addition of gabazine so that the recorded pyramidal cells could be classified as type 1 or type 2 (Figs 12 and 13). We analysed the population events (Fig. 12B, D and F) according to the pyramidal cell subtype (Fig. 12A, C and E), as determined by PCA GMM-BIC analysis (Fig. 13A). No differences were noted (Fig. 13B) either in their overall strength [16.1 (SD 12.4) vs. 18.0 (SD 14.6) V.ms for type 1 (n = 22) and type 2 (n = 38) cells, respectively, P = 0.54] or duration [909 (SD 620) vs. 862 (SD 592) ms for type 1 (n = 21, the presence of a cell generating single-spike events prevented the calculation of duration) and type 2 (n = 38) cells, respectively, P = 0.98].
Figure 12. Spike timing of epileptiform activity in type 1 and type 2 subicular cells recorded in mini slices. Examples from different combinations in simultaneous recordings.

A, membrane properties and firing patterns of a homotypic type 1 cell pair following current injection (blue traces). Insets show the first action potential generated by the positive current step. B, same pair as in A in the presence of gabazine (12.5 μm) and CGP55845 (5 μm). Left panel: overall view of a synchronized event. Right panel: temporally expanded view of the initial firing. Note the time difference between the first spikes in the two cells. Vertical black dotted line indicates the peak of the action potential of the earliest firing cell of the pair for reference. C–F, identical to A and B in a homotypic type 2 cell pair (red traces) and in heterotypic type 1/type 2 pair (blue and red traces). Note the reduced number of action potentials in the type 1 compared to the type 2 cell in the mixed pair.
Figure 13. Cell type-specific properties of epileptiform activity in disinhibited subicular mini slices.

A, subicular cells (n = 60) classified at the beginning of the experiment as type 1 (blue) or type 2 cell (red) with the cells used to test for connectivity in Fig. 1 in the background (grey, n = 995). B, summary plots for different parameters of the epileptiform events (from left to right: area, spike frequency, number of spikes, event duration and time difference between the first spikes of events in double simultaneous recordings). The values for type 1 and type 2 cells are shown in blue and red, respectively. Δ latency values measured in type 1 and type 2 homotypic pairs are shown in blue and red, respectively. Mixed double recordings of type 1 and type 2 cells are shown by the blue–red box.
In contrast, cell type-specificity was revealed (Fig. 13B) in the number of action potentials produced [17 (SD 15) vs. 26 (SD 19) spikes for type 1 (n = 22) and type 2 (n = 38) cells], and in their frequency [27.5 (SD 14.4) vs. 47.7 (SD 38.4) Hz for type 1 (n = 21, the presence of a cell generating single-spike events prevented the calculation of frequency)and type 2 (n = 38)cells, respectively, P = 0.00]. Lastly, when we compared (within pairs of simultaneously recorded neurons) the difference in timing between the first spikes of the population event, we also noted cell type-specific differences. The first action potentials in type 2 neurons occurred within 1 ± 4 ms (Δ latency, n = 28 pairs), compared to 20 ± 6 ms (n = 5 pairs) and 10 ± 7 ms (n = 17 pairs) for type 1 and type 1/type 2 double recordings (P = 0.03).
Discussion
To our knowledge, this is the first morphofunctional study of the local excitatory circuits established by individual subicular pyramidal cells. We present three main findings. First, distinct subpopulations of pyramidal neurons (type 1 and type 2), classified by objective and quantitative methods, are non-randomly interconnected both in cell type-specific homotypic and heterotypic networks. Second, our data suggest that local excitatory synapses of these networks are preferentially established onto basal dendrites. Lastly, in the absence of GABA receptor activity, the integration of spontaneous intrinsic excitability with local excitatory connectivity is sufficient to generate cell type-specific epileptiform synchronized population events in mini subicular slices maintained in vitro.
Subicular pyramidal cell diversity and functional connectivity
Although evidence for functional diversity in the intrinsic excitability of subicular pyramidal neurons is not a controversial point and has been confirmed by previous studies (see Introduction), the criteria used in the past to distinguish different subtypes of cells have been largely different, depending on the work considered. Here, we have taken advantage of multivariate PCA and GMM to objectively classify the different cell types in different groups, which we have termed type 1 and type 2. We have used a novel nomenclature to underline that, despite the strong overlap with regular and bursting cells, our distinction was not based on firing patterns exclusively. We argue that our additional finding showing that cells belonging to type 1 and type 2 groups are structurally different in their dendritic arborizations corroborates the validity of the approach used.
Our results regarding the connectivity between type 1 and type 2 cells confirm the asymmetry in probability of finding functional connections between homotypic and heterotypic pairs as previously shown for regular firing and bursting cells by Böhm et al. (2015). However, in contrast to the absolute lack of connectivity between bursting cells to regular firing neurons, we have reported the existence of a low fraction of functionally connected pairs of type 2 to type 1 cells. We think that this apparent discrepancy is probably explained by methodological differences with the aforementioned work. First, Böhm et al. (2015) excluded cells in which the first postsynaptic peak was not clearly discernible. In contrast, we have included in our study functionally connected pairs without clearly discernible uEPSPs triggered by low-frequency single spikes, provided that uEPSPs could be detected after spike-triggered averaging at higher frequencies. Second, our PCA GMM analysis was able to divide all the cells of our sample population into two separate groups based on BIC. In the Böhm et al. (2015) study, neurons that were not easily classifiable on the basis of their firing pattern were discarded and not included in their analysis.
When measured, our collected uEPSPs suggest the presence of a large variability of synaptic strength within all specific types of connections, as the amplitudes of the events ranged between a few hundred microvolts to several millivolts. This variability potentially reflects the impact of several physiological factors, such as the variable distances from the soma of the synapse at which the event originates, the current dynamic plastic state of the synapse and the probability of release at the synaptic site.
Anatomical location of local excitatory connectivity
In contrast to the layered organization of the hippocampus proper, where pyramidal cells are geometrically aligned and specific layers strictly host either basal or apical dendrites, the architecture of the subiculum is more complex (Amaral & Lavenex, 2007). Here, the scattered positioning of pyramidal neurons makes it more difficult to predict the targeting position of local synapses based on the presynaptic axon localization, which is relatively straightforward in the various CA regions. For example, the axons of the principal neurons of the CA3 hippocampal subfield ramify both in stratum oriens and in radiatum (Ishizuka et al. 1990), where they overlap with the basal and apical dendrites of pyramidal cells selectively hosted by these layers. In fact, paired recordings between CA3 pyramidal cells followed by anatomical analysis reported equally distributed proportions of putative contact sites on basal and apical dendrites (Guzmann et al. 2016). In the CA1 hippocampal subfield, where local axon collaterals ramify only in stratum oriens (Esclapez et al. 1999; but see Aniksztejn et al. 2001 for ramifications outside stratum oriens in perinatal animals), similar experiments have only revealed synapses between CA1 pyramidal cells on basal dendrites (Deuchars & Thomson, 1996).
In the subiculum, the scattered and non-aligned spatial distribution of pyramidal cells, together with the large spread of their local axons, prevents the identification of a specific axonal overlap with basal and/or apical dendrites, making a prediction difficult. Our data, based on the analysis of functionally verified connected pairs, suggest that subicular neurons are connected by synapses preferentially, but not exclusively, established on basal dendrites. This arrangement appears to be intermediate between the CA3, which presents a roughly equal distribution of local synapses on basal and apical dendrites (Guzman et al. 2016), and the CA1 subfield with an exclusive location on basal dendrites (Deuchars & Thomson, 1996; Esclapez et al. 1999). Interestingly, basal and apical dendrites have different properties that may lead to complex signalling (Larkum et al. 1999; Schiller et al. 2000; Kampa & Stuart, 2006; Krieger et al. 2017; see also review by Häusser et al. 2000). Thus, the domain-specific segregation of local inputs may reflect the physiological matching between specific presynaptic terminals and post-synaptic dendritic properties.
Relevance of local excitatory circuits for the generation of epileptiform activity
As mentioned in the Introduction, subicular circuits have been implicated in the initiation of epileptiform activity both in human (Cohen et al. 2002; Wozny et al. 2005; Huberfeld et al. 2007, 2011; Alvarado-Rojas et al. 2015; Wang et al. 2017) and in experimental TLE (Fujita et al. 2014; Toyoda et al. 2015). In particular, while interictal activity was maintained in human subicular slices maintained in vitro and was shown to depend on the interplay between excitatory glutamatergic and GABAergic signalling (Cohen et al. 2002), pre-ictal activity, associated with interictal–ictal transitions, was suggested to depend on local glutamatergic circuits, in network states lacking of GABAergic activity (Huberfeld et al. 2011). Our data directly show that the pharmacological blockade of GABA receptors is sufficient to induce epileptiform hyper-synchronization in isolated subicular slices, and the observed population activity is exclusively mediated by local excitatory circuits. Although inhibitory circuits have already been suggested to reduce the propensity for bursting in subicular cells following antidromic stimulation (Menendez de la Prida, 2003) or injection of depolarizing currents (Menendez de la Prida, 2003; but see also Pannuccio et al. 2012), to our knowledge, this is the first evidence for the emergence of spontaneous population events purely mediated by subicular local circuits. Therefore, it is quite possible that pre-ictal events may be locally generated and predispose the network to the explosive development of ictal discharges when appropriately temporally coupled to incoming extra subicular excitatory inputs (Benini & Avoli, 2005). Furthermore, the ability of excitatory subicular circuits to produce epileptiform activity may be increased during pathological states associated with the loss of hyperpolarizing (and emergence of depolarizing) GABAergic signalling, as has been reported in human and animal models of TLE (Cohen et al. 2002; Huberfeld et al. 2007, 2011; Wang et al. 2017).
Lastly, our results indicate that, although both type 1 and type 2 pyramidal cells can be recruited during this type of event, the temporal structure of action potential occurrence during these population events is different. Type 1 cells fire at lower frequencies and generate fewer temporally precise spikes compared to type 2 neurons. This has interesting implications for the timing of propagation of these events to their specific target regions. Thus, even though the proximal and distal subiculum generate outputs via distinct classes of neurons (Cembrowski et al. 2018), a lack of GABAergic inhibition (as has been suggested to occur duringpre-ictal activity, see Huberfeld et al. 2011) may provide a complex pattern of activity leading to mixed population discharges mediated by all subicular pyramidal cells. The cell type-specific synaptic output associated with these events would be predicted to be temporally shifted with respect to their first action potential and to be shaped by different presynaptic spike numbers and frequencies. This type of pathological signalling in the presence of GABAergic disinhibition would significantly deviate from what was reported by Böhm et al. (2015) under physiological conditions in vivo, where the two different classes of pyramidal neurons identified by the authors were selectively active vs. silent.
Conclusions
Our work has shed new light on the morphofunctional organization of subicular local excitatory circuits. We suggest that their general high degree of interconnectivity (especially between type 2 cells that have the ability to produce intrinsic bursts), coupled to the overall short distance of synaptic sites to the soma, makes them particularly efficient in generating epileptiform activity, even in the absence of extra subicular excitation.
Key points.
The activity of local excitatory circuits of the subiculum has been suggested to be involved in the initiation of pathological activity in epileptic patients and experimental animal models of temporal lobe epilepsy.
We have taken advantage of multimodal techniques to classify subicular cells in distinct subclasses and have investigated their morphofunctional properties and connectivity in vitro.
Our results indicate that local subicular excitatory circuits are connected in a cell type-specific fashion and that synapses are preferentially established on basal vs. apical dendrites.
We show that local excitatory circuits, isolated from extrasubicular inputs and pharmacologically disinhibited, are sufficient to initiate synchronous epileptiform activity in vitro.
In conclusion, this work provides a high-resolution description of local excitatory circuits of the subiculum and highlights their mechanistic involvement in the generation of pathological activity.
Funding
This work was supported by the NIH/NINDS (grant NS096092 to G.M.).
Biography
Michael Fiske received his bachelor’s degree in biology from Lake Forest College in 2010. He is currently a graduate student at the Feinberg Medical School, Northwestern University, where he is investigating the microcircuits of the subiculum. His general research interests centre on understanding the cellular mechanisms responsible for the generation of pathological epileptiform activity in cortical structures.

Footnotes
Competing interests
The authors declare no conflicts of interest.
Supporting information
Additional supporting information may be found online in the Supporting Information section at the end of the article.
References
- Alvarado-Rojas C, Huberfeld G, Baulac M, Clemenceau S, Charpier S, Miles R, de la Prida LM & Le Van Quyen M (2015). Different mechanisms of ripple-like oscillations in the human epileptic subiculum. Ann Neurol 77, 281–290. [DOI] [PMC free article] [PubMed] [Google Scholar]
- Amaral D & Lavenex P (2007). Hippocampal neuroanatomy In The Hippocampus Book, ed. Andersen P, Morris R, Amaral D, Bliss T & O’Keefe J, pp. 37–114. Oxford University Press, New York, NY. [Google Scholar]
- Aniksztejn L, Demarque M, Morozov Y, Ben-Ari Y & Represa A (2001). Recurrent CA1 collateral axons in developing rat hippocampus. Brain Res 913, 195–200. [DOI] [PubMed] [Google Scholar]
- Bains JS, Longacher JM & Staley KJ (1999). Reciprocal interactions between CA3 network activity and strength of recurrent collateral synapses. Nat Neurosci 2, 720–726. [DOI] [PubMed] [Google Scholar]
- Behr J, Empson RM, Schmitz D, Gloveli T & Heinemann U (1996). Electrophysiological properties of rat subicular neurons in vitro. Neurosci Lett 220, 41–44. [DOI] [PubMed] [Google Scholar]
- Benini R & Avoli M (2005). Rat subicular networks gate hippocampal output activity in an in vitro model of limbic seizures. J Physiol 566, 885–900. [DOI] [PMC free article] [PubMed] [Google Scholar]
- Bilkey DK & Schwartzkroin PA (1990). Variation in electrophysiology and morphology of hippocampal CA3 pyramidal cells. Brain Res 514, 77–83. [DOI] [PubMed] [Google Scholar]
- Böhm C, Peng Y, Maier N, Winterer J, Poulet JF, Geiger JR & Schmitz D (2015). Functional diversity of subicular principal cells during hippocampal ripples. J Neurosci 35, 13608–13618. [DOI] [PMC free article] [PubMed] [Google Scholar]
- Cembrowski MS, Phillips MG, DiLisio SF, Shields BC, Winnubst J, Chandrashekar J, Bas E & Spruston N (2018). Dissociable structural and functional hippocampal outputs via distinct subiculum cell classes. Cell 173, 1280–1292. [DOI] [PubMed] [Google Scholar]
- Cembrowski MS & Spruston N (2019). Heterogeneity within classical cell types is the rule: lessons from hippocampal pyramidal neurons. Nat Rev Neurosci 20, 193–204. [DOI] [PubMed] [Google Scholar]
- Cohen I, Navarro V, Clemenceau S, Baulac M & Miles R (2002). On the origin of interictal activity in human temporal lobe epilepsy in vitro. Science 298, 1418–1421. [DOI] [PubMed] [Google Scholar]
- Cooper DC, Moore SJ, Staff NP & Spruston N (2003). Psychostimulant-induced plasticity of intrinsic neuronal excitability in ventral subiculum. J Neurosci 23, 9937–9946. [DOI] [PMC free article] [PubMed] [Google Scholar]
- Cooper DC, Chung S & Spruston N (2005). Output-mode transitions are controlled by prolonged inactivation of sodium channels in pyramidal neurons of subiculum. PLoS Biol 3, 1123–1129. [DOI] [PMC free article] [PubMed] [Google Scholar]
- Deuchars J & Thomson AM (1996). CA1 pyramid–pyramid connections in rat hippocampus in vitro: dual intracellular recordings with biocytin filling. Neuroscience 74, 1009–1018. [DOI] [PubMed] [Google Scholar]
- Esclapez M, Hirsch JC, Ben-Ari Y & Bernard C (1999). Newly formed excitatory pathways provide a substrate for hyperexcitability in experimental temporal lobe epilepsy. J Comp Neurol 408, 449–460. [DOI] [PubMed] [Google Scholar]
- Fisher RS (1989). Animal models of the epilepsies. Brain Res Rev 14, 245–278. [DOI] [PubMed] [Google Scholar]
- Fricker D, Verheugen JA & Miles R (1999). Cell-attached measurements of the firing threshold of rat hippocampal neurones. J Physiol 517, 791–804. [DOI] [PMC free article] [PubMed] [Google Scholar]
- Fujita S, Toyoda I, Thamattoor AK & Buckmaster PS (2014). Preictal activity of subicular, CA1, and dentate gyrus principal neurons in the dorsal hippocampus before spontaneous seizures in a rat model of temporal lobe epilepsy. J Neurosci 34, 16671–16687. [DOI] [PMC free article] [PubMed] [Google Scholar]
- Graves AR, Moore SJ, Bloss EB, Mensh BD, Kath WL & Spruston N (2012). Hippocampal pyramidal neurons comprise two distinct cell types that are countermodulated by metabotropic receptors. Neuron 76, 776–789. [DOI] [PMC free article] [PubMed] [Google Scholar]
- Greene JR & Totterdell S (1997). Morphology and distribution of electrophysiologically defined classes of pyramidal and nonpyramidal neurons in rat ventral subiculum in vitro. J Comp Neurol 380, 395–408. [DOI] [PubMed] [Google Scholar]
- Grundy D (2015). Principles and standards for reporting animal experiments in The Journal of Physiology and Experimental Physiology. J Physiol 593, 2547–2549. [DOI] [PMC free article] [PubMed] [Google Scholar]
- Guzman SJ, Schlogl A, Frotscher M & Jonas P (2016). Synaptic mechanisms of pattern completion in the hippocampal CA3 network. Science 353, 1117–1123. [DOI] [PubMed] [Google Scholar]
- Hartigan JA (1975). Clustering Algorithms. John Wiley & Sons, Inc., New York, NY. [Google Scholar]
- Hausser M, Spruston N & Stuart GJ (2000). Diversity and dynamics of dendritic signaling. Science 290, 739–744. [DOI] [PubMed] [Google Scholar]
- Hille B (2001). Ion Channels of Excitable Membranes. Sinauer, Sunderland, MA. [Google Scholar]
- Huberfeld G, Wittner L, Clemenceau S, Baulac M, Kaila K, Miles R & Rivera C (2007). Perturbed chloride homeostasis and GABAergic signaling in human temporal lobe epilepsy. J Neurosci 27, 9866–9873. [DOI] [PMC free article] [PubMed] [Google Scholar]
- Huberfeld G, Menendez de la Prida L, Pallud J, Cohen I, Le Van Quyen M, Adam C, Clemenceau S, Baulac M, & Miles R (2011). Glutamatergic pre-ictal discharges emerge at the transition to seizure in human epilepsy. Nat Neurosci 14, 627–634. [DOI] [PubMed] [Google Scholar]
- Ishizuka N, Weber J & Amaral DG (1990). Organization of intrahippocampal projections originating from CA3 pyramidal cells in the rat. J Comp Neurol 295, 580–623. [DOI] [PubMed] [Google Scholar]
- Jarsky T, Mady R, Kennedy B & Spruston N (2008). Distribution of bursting neurons in the CA1 region and the subiculum of the rat hippocampus. J Comp Neurol 506, 535–547. [DOI] [PubMed] [Google Scholar]
- Joliffe IT (1986). Principal Component Analysis. Springer, New York, NY. [Google Scholar]
- Jung HY, Staff NP & Spruston N (2001). Action potential bursting in subicular pyramidal neurons is driven by a calcium tail current. J Neurosci 21, 3312–3321 [DOI] [PMC free article] [PubMed] [Google Scholar]
- Kampa BM & Stuart GJ (2006). Calcium spikes in basal dendrites of layer 5 pyramidal neurons during action potential bursts. J Neurosci 26, 7424–7432. [DOI] [PMC free article] [PubMed] [Google Scholar]
- Kandel ER, Schwartz JH, Jessel TM, Siegelbaum SA & Hudspeth AJ (2012). Principles of Neural Science, 5th edn. McGraw-Hill, New York, NY. [Google Scholar]
- Kim Y & Spruston N (2012). Target-specific output patterns are predicted by the distribution of regular-spiking and bursting pyramidal neurons in the subiculum. Hippocampus 22, 693–706. [DOI] [PMC free article] [PubMed] [Google Scholar]
- Klausberger T & Somogyi P (2008). Neuronal diversity and temporal dynamics: the unity of hippocampal circuit operations. Science 321, 53–57. [DOI] [PMC free article] [PubMed] [Google Scholar]
- Krieger P, de Kock CPJ & Frick A (2017). Calcium dynamics in basal dendrites of layer 5A and 5B pyramidal neurons is tuned to the cell-type specific physiological action potential discharge. Front Cell Neurosci 11, 194. [DOI] [PMC free article] [PubMed] [Google Scholar]
- Larkum ME, Zhu JJ & Sakmann B (1999). A new cellular mechanism for coupling inputs arriving at different cortical layers. Nature 398, 338–341. [DOI] [PubMed] [Google Scholar]
- Lisman JE (1997). Bursts as a unit of neural information: making unreliable synapses reliable. Trends Neurosci. 20, 38–43. [DOI] [PubMed] [Google Scholar]
- Mason A (1993). Electrophysiology and burst-firing of rat subicular pyramidal neurons in vitro: a comparison with area CA1. Brain Res 600, 174–178. [DOI] [PubMed] [Google Scholar]
- Masukawa LM, Benardo LS & Prince DA (1982). Variations in electrophysiological properties of hippocampal neurons in different subfields. Brain Res 242, 341–344. [DOI] [PubMed] [Google Scholar]
- Mattia D, Hwa GG & Avoli M (1993). Membrane properties of rat subicular neurons in vitro. J Neurophysiol 70, 1244–1248. [DOI] [PubMed] [Google Scholar]
- Menendez de la Prida L (2003). Control of bursting by local inhibition in the rat subiculum in vitro. J Physiol 549, 219–230. [DOI] [PMC free article] [PubMed] [Google Scholar]
- Menendez de la Prida L, Suarez F & Pozo MA (2003). Electrophysiological and morphological diversity of neurons from the rat subicular complex in vitro. Hippocampus 13, 728–744. [DOI] [PubMed] [Google Scholar]
- Miles R & Wong RK (1983). Single neurones can initiate synchronized population discharge in the hippocampus. Nature 306, 371–373. [DOI] [PubMed] [Google Scholar]
- Miles R & Wong RK (1986). Excitatory synaptic interactions between CA3 neurones in the guinea-pig hippocampus. J Physiol 373, 397–418. [DOI] [PMC free article] [PubMed] [Google Scholar]
- Panuccio G, Vicini S & Avoli M (2012). Cell type-specific properties of subicular GABAergic currents shape hippocampal output firing mode. PLoS One 7, e50241. [DOI] [PMC free article] [PubMed] [Google Scholar]
- Pelkey KA, Chittajallu R, Craig MT, Tricoire L, Wester JC & McBain CJ (2017). Hippocampal GABAergic inhibitory interneurons. Physiol Rev 97, 1619–1747. [DOI] [PMC free article] [PubMed] [Google Scholar]
- Rall W (1977). Core conductor theory and cable properties of neurons In Handbook of Physiology, ed. Kandel E & Geiger S, pp. 39–97. American Physiological Society, Washington, DC. [Google Scholar]
- Schiller J, Major G, Koester HJ & Schiller Y (2000). NMDA spikes in basal dendrites of cortical pyramidal neurons. Nature 404, 285–289. [DOI] [PubMed] [Google Scholar]
- Schwartz G (1978). Estimating the dimension of a model. Ann Stat 6, 461–464. [Google Scholar]
- Schwartzkroin PA & Prince DA (1978). Cellular and field potential properties of epileptogenic hippocampal slices. Brain Res 147, 117–130. [DOI] [PubMed] [Google Scholar]
- Simonnet J & Brecht M (2019). Burst firing and spatial coding in subicular principal cells. J Neurosci 39, 3651–3662. [DOI] [PMC free article] [PubMed] [Google Scholar]
- Somogyi P, Tamas G, Lujan R & Buhl EH (1998). Salient features of synaptic organisation in the cerebral cortex. Brain Res Brain Res Rev 26, 113–135. [DOI] [PubMed] [Google Scholar]
- Spruston N, Jaffe DB & Johnston D (1994). Dendritic attenuation of synaptic potentials and currents: the role of passive membrane properties. Trends Neurosci 17, 161–166. [DOI] [PubMed] [Google Scholar]
- Staff NP, Jung HY, Thiagarajan T, Yao M & Spruston N (2000). Resting and active properties of pyramidal neurons in subiculum and CA1 of rat hippocampus. J Neurophysiol 84, 2398–2408. [DOI] [PubMed] [Google Scholar]
- Taube JS (1993). Electrophysiological properties of neurons in the rat subiculum in vitro. Exp Brain Res 96, 304–318. [DOI] [PubMed] [Google Scholar]
- Toyoda I, Fujita S, Thamattoor AK & Buckmaster PS (2015). Unit activity of hippocampal interneurons before spontaneous seizures in an animal model of temporal lobe epilepsy. J Neurosci 35, 6600–6618. [DOI] [PMC free article] [PubMed] [Google Scholar]
- Traub RD & Miles R (1991). Neuronal Networks of the Hippocampus. Cambridge University Press, New York, NY. [Google Scholar]
- Wang Y, Xu C, Xu Z, Ji C, Liang J, Wang Y, Chen B, Wu X, Gao F, Wang S, Guo Y, Li X, Luo J, Duan S & Chen Z (2017). Depolarized GABAergic signaling in subicular microcircuits mediates generalized seizure in temporal lobe epilepsy. Neuron 95, 92–105.e105. [DOI] [PubMed] [Google Scholar]
- Wong RK & Prince DA (1978). Participation of calcium spikes during intrinsic burst firing in hippocampal neurons. Brain Res. 159, 385–390. [DOI] [PubMed] [Google Scholar]
- Wong RK & Traub RD (1983). Synchronized burst discharge in disinhibited hippocampal slice. I. Initiation in CA2–CA3 region. J Neurophysiol 49, 442–458. [DOI] [PubMed] [Google Scholar]
- Wozny C, Knopp A, Lehmann TN, Heinemann U & Behr J (2005). The subiculum: a potential site of ictogenesis in human temporal lobe epilepsy. Epilepsia 46 Suppl 5, 17–21. [DOI] [PubMed] [Google Scholar]