

Summary
We propose protein PTB1:4W as a good candidate for engineering into a downhill folder. PTB1:4W has a probe-dependent thermal unfolding curve and sub-millisecond T-jump relaxation kinetics on more than one time scale. Its refolding rate in denaturant is a nonlinear function of denaturant concentration (curved Chevron plot). Yet at high denaturant concentration its unfolding is probe-independent, and the folding kinetics can be fitted to a single exponential decay. The domain appears to fold via a mechanism between downhill folding and activated folding over several small barriers, and when denaturant is added, one of these barriers greatly increases and simplifies the observed folding to apparent two-state kinetics. We predict the simplest free energy function consistent with the thermal denaturation and kinetics experiments by using the Singular Value Smoluchowski Dynamics (SVSD) model. PTB1:4W is a natural ‘missing link’ between downhill and activated folding. We suggest mutations that could move the protein into the downhill folding limit.
Introduction
The experimental detection of the protein folding ‘speed limit’ and of downhill folding1–3 has attracted great interest among simulators, 4,5 theorists, 6,7 and the community interested in transition state analysis of protein folding.8,9 A key prediction of the energy landscape theory10 is that downhill folders reach the native state without crossing a significant free energy barrier along the reaction coordinate (i.e. the barriers are less than 1 RT ≈ 2.5 kJ/mole). So far, only a few small proteins have been discovered that fall into this category, as classified in ref. 11.
Strategies for finding downhill folders include: testing small proteins for probe-dependent thermodynamics;12 designing molecules with low cooperativity but high stability;13 and searching for wild type proteins that fold downhill.14 Our strategy has been to extensively re-engineer already fast-folding proteins, replacing functionally conserved sidechains by those that increase stability or eliminate non-native traps. Using this approach, several small proteins have been engineered to be incipient downhill folders with barriers less than 3 RT, 15–18 downhill folders, 18,19 and even downhill folders at the melting transition. 20
A good starting point for such engineering is a wild type protein with a broad probe-dependent melting transition (low cooperativity), yet fast folding rate (sub-millisecond). Here we present such a protein. PTB1:4W is a potential downhill folder with more residues and more complex topology than previously reported fast folders. It is a 91-residue protein with an α/β fold topology (Figure 1), comprising the fourth domain of the polypyrimidine tract binding protein, an RNA binding protein involved in both pre-mRNA splicing and translation initiation. 21 The point mutation F86W was introduced in the wild type sequence so that folding thermodynamics and kinetics can be detected by tryptophan fluorescence. This mutation was conservative and led to high protein expression levels.
Fig. 1.
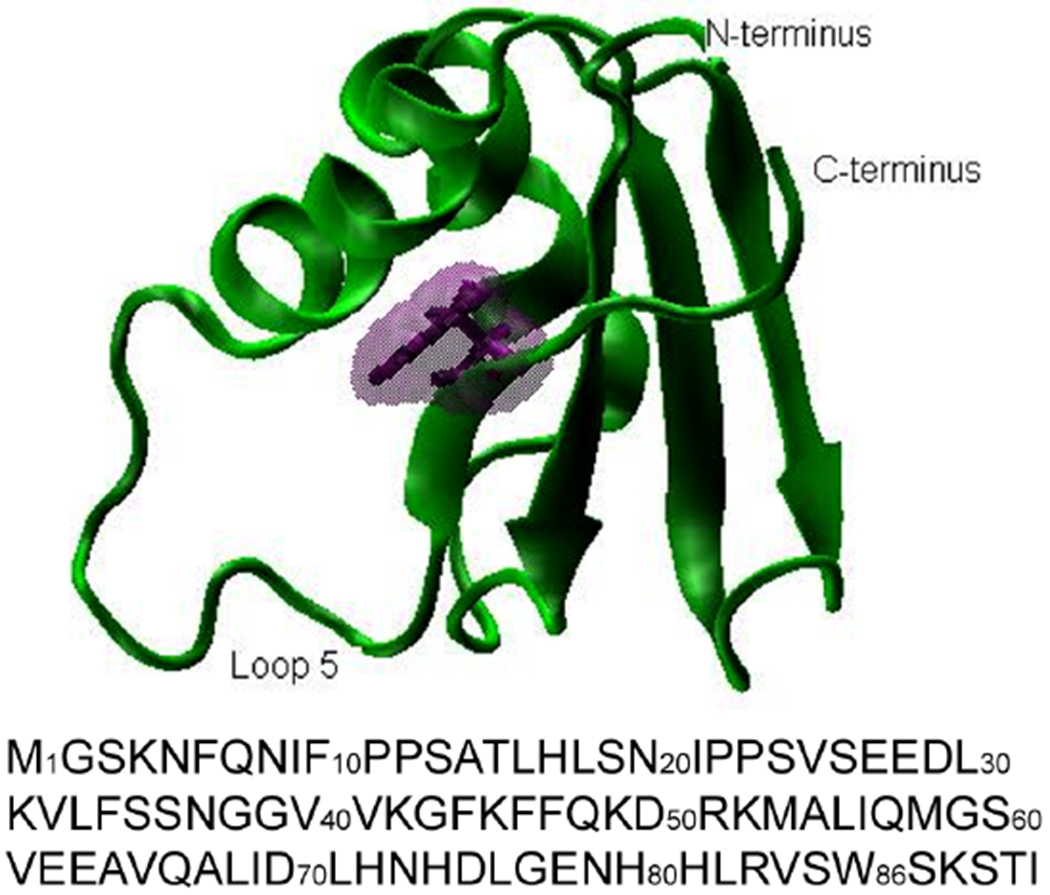
Protein structure and sequence of PTB1:4. The protein structure plot was prepared with VMD. 46 Phe86 shown in purple is replaced by Trp in PTB1:4W. Comparison of the 1H/15N HSQC NMR spectra (data not shown) of the two proteins show local chemical shift changes, but no indications of significant structural changes.
We characterized the equilibrium denaturation as well as the folding kinetics of this protein. PTB1:4W has probe-dependent thermal denaturation curves and two observed T-jump relaxation times of 18-480 μs in the absence of denaturant. Its Chevron plot (log of folding rate vs. denaturant concentration) is curved. On the other hand, at high denaturant concentration it behaves like a two-state folder: different spectroscopic probes yield the same melting curve, and relaxation kinetics are single-exponential and slower than 10 ms. PTB1:4W is not quite as fast as previously reported downhill folders,11 but it has smaller barriers than typical millisecond folders.22 We determine the simplest free energy function compatible with the thermal melt and kinetics data, by using a new fitting approach that combines singular value-decomposed Smoluchowski dynamics (SVSD) with genetic algorithm selection of the best free energy function. PTB1:4W turns out to be a natural ‘missing link’ between activated and downhill folding scenarios, even without sequence re-engineering. We suggest some re-engineering of its sequence that may further speed up its folding.
Results and Discussion
Protein aggregation
We found that PTB1:4W has a very high propensity for aggregation when heated, like downhill-folding mutants of lambda repressor and WW domain.17,23 In the thermodynamic measurements, the concentration of the protein was kept at 2-3 μM to avoid aggregation up to 98 °C. Circular dichroism (CD) spectra before and after temperature titrations from 2 to 98 °C were almost identical, indicating that the measurement was reversible at low protein concentration.
Probe-dependence of protein stability
Figure 2 shows fluorescence and CD spectra spanning the main thermal unfolding transition from 40 to 60 °C at pH 7. The fluorescence spectrum in figure 2B red-shifts from 342 to 352 nm upon heating, indicating solvent exposure of the tryptophan residue. The magnitude of the CD spectrum of PTB1:4W contains a significant contribution from the Trp 86 residue: native PTB1:4W has a more negative signal than PTB1:4 wild type (dotted line in figure 2A), even though the 1H/15N HSQC spectra of the two proteins reveal no overall structural rearrangement (data not shown). The CD signal magnitude of PTB1:4W increases upon thermal denaturation between 40 and 60 °C. This increase is due to a combination of changing aromatic side chain environment and residual structure with extended side chains. (Such ‘extended structure’ involves short stretches of sheet-like backbone geometry with extended side chains, but no long-range secondary or tertiary contacts. 24)
Fig. 2.
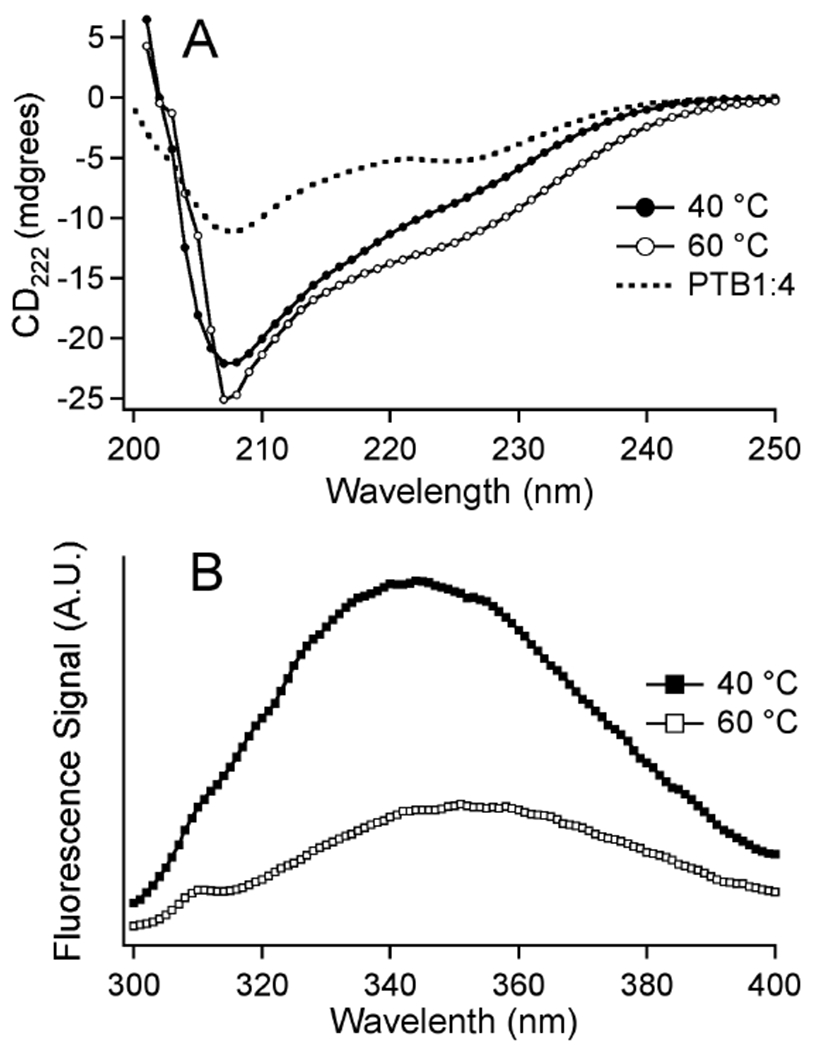
(A) Circular dichroism spectra of PTB1:4W (3 μM, pH 7) spanning the main thermal denaturation transition between 40 and 60 °C. The CD spectrum of the tryptophan-free PTB1:4 (dotted line, 20 °C) is different from PTB1:4W. (The 20 °C spectrum of PTB1:4W is 20% smaller but has the same shape as the 40 °C spectrum shown.) (B) Fluorescence spectra of PTB1:4W (2 μM, pH 7) spanning the main thermal denaturation transition between 40 and 60 °C.
The normalized thermal denaturation curves monitored by CD (at 222 nm), integrated fluorescence intensity (excited at 280 nm) and fluorescence peak shift are shown in figure 3. The fluorescence intensity curve has a very large negative baseline below 40 °C. Thus Trp 86 fluorescence depends strongly on temperature in the native state. A simultaneous fit of all three experimental traces to a two-state model (dotted curves) with arbitrary linear baselines for each trace does not fit the data well. Instead we used a free energy function model to fit the data (solid curves, see below).
Fig. 3.

Circular dichroism (open squares, 3 μM, pH 7) and fluorescence intensity (open triangles, 2 μM, pH 7) thermal titration curves of PTB1:4W were measured simultaneously and normalized to the 0 to 1 range for comparison. The fluorescence wavelength shift (open circles) was measured separately on a fluorimeter. No satisfactory global two-state fit was achieved (dashed lines). The SVSD model produced a satisfactory fit (solid lines).
On the other hand, figure 4 shows that the protein obeys two-state behavior at high concentrations of the denaturant guanidine hydrochloride (GuHCl). A simultaneous two-state model fits that data nicely with a transition midpoint at 1.9 M GuHCl.
Fig. 4.

Fluorescence intensity (circles) and wavelength shift (squares) upon guanidine hydrochloride denaturation of PTB1:4W. This data could be fitted by a global two-state model (dashed lines).
Protein folding kinetics
T-jump experiments were carried out at final temperatures from 56 °C to 63 °C, where the largest relaxation signals could be observed. Relaxation kinetics are reported either as the normalized change in tryptophan lifetime (χ1, see Methods), or as the change in integrated tryptophan fluorescence intensity.
Figure 5 shows the observed relaxation at 60 °C contains a very fast phase of 18 μs, followed by a still fast phase of <500 μs. The data in figure 5 are not compatible with a two-state scenario (single exponential relaxation), but could be fitted by a double-exponential function. The observed slower rate coefficient was temperature-independent within measurement uncertainty over the temperature range we measured.
Fig. 5.

Folding relaxation kinetics of PTB1:4W by a temperature jump from 50 °C to 60 °C detected by normalized fluorescence lifetime change (see Methods). The solid black curve is the SVSD model fit from Smoluchowski dynamics. The top trace shows the residual of a direct double-exponential fit to τ1=18 μs and τ2=479 μs.
Stopped-flow experiments were carried out at room temperature (23 °C) to check whether intermediate states accumulate during refolding when the protein is unfolded by GuHCl. Based on the GuHCl titration measurements (figure 4), PTB1:4W is completely denatured at 3 M GuHCl. Therefore protein solution containing 3 M GuHCl was mixed with a buffer solution to several final denaturant concentrations (figure 6). The observed relaxation times > 10 ms are considerably slower than the microsecond relaxation rate observed in 0 M GuHCl T-jump experiments (figure 5). As seen in figure 6, no evidence of a burst phase was found, nor of slower phases up to 20 seconds that exceed 10% of the resolved millisecond phase. The GuHCl refolding transients could be fitted to a two-state (single exponential) model, just like the GuHCl denaturation curves in figure 4.
Fig. 6.

Stopped-flow experiments at low (0.27 M) and high (1.5 M) final guanidine hydrochloride concentration show slow single exponential refolding kinetics (dashed lines) with no burst phase. For reference, a 3 M to 3 M jump baseline is shown.
Figure 7 summarizes the T-jump and stopped flow relaxation kinetics by plotting logk = −logτ Only the slower phase is plotted for the T-jumps. The stopped flow rate at 23 °C does not approach the slower T-jump rates at 0 M GuHCl, and the stopped flow data do not resemble a linear Chevron plot. Thus the apparent two-state stopped flow kinetics are not supported by a linear Chevron plot.
Fig. 7:

Summary of the kinetic data. The sub-ms phase upon T-jump is shown in open markers at the top with a temperature axis. The ms refolding kinetics from GuHCl stopped flow are shown in black circles at the bottom. The GuHCl Chevron is curved throughout, and the 23 °C stopped flow data do not extrapolate to the much faster T-jump data at 35 °C higher temperature.
Model free energy function
The multi-probe thermodynamics and T-jump kinetics in figures 3 and 5 are not fitted well by a two-state model. Our goal was to determine the simplest one-dimensional free energy function and diffusion coefficient compatible with all the thermal titration and T-jump kinetic data.
The Singular Value Smoluchowski Dynamics (SVSD) model25 summarized in figure 8 uses a genetic algorithm to search the space of folding free energy functions G(x,T), diffusion coefficients D(x,T) and signal functions Si(x) for the best fit to the data. The functional forms fitted are described in Methods. Our reference coordinate x was the radius of gyration in nanometers. This choice is arbitrary, but it provides a mapping for the signal functions S onto a reaction coordinate in nm, so one can compare the magnitude of D to known diffusion coefficients (see Methods). SVSD calculates the time-evolving protein population ρ(x,t) after a T-jump, and equilibrium populations ρeq(x,T) at temperature T, without assigning ‘states’ and without making the transition state approximation.
Fig. 8.

(A) SVSD method. Left: the protein population distribution ρ is calculated at equilibrium or during kinetics on the free energy surface G(x); then S(x)ρ(x) is integrated to yield the signal S(T) or S(t). Right: A genetic algorithm selects the best members from a population of free energy syrfaces and generates the next generation to calculate signals for comparison with experiment. (B) SVSD free energy functions calculated at 50, 60 and 70 °C. Shown are the optimal functions fitted to the temperature jump and titration data in figures 4 and 6. The normalized signal functions are shown at the top.
We carried out SVSD searches in spaces of 1 and 2 reaction coordinates to globally fit the temperature-dependent data in figures 3 and 5. A 1-D surface was sufficient to fit the data. The best 1-D fits to the data are shown as solid lines in figures 3, 5, and 7. Figure 8 shows the corresponding free energy function at three different temperatures. It has three local minima, which we label N, U’ and U. The signal functions are also shown in figure 8. The genetic algorithm does not guarantee that these free energy and signal functions are unique solutions, but they are representative of the type of functions required to explain the experimental data. We fitted only the average diffusion coefficient of D = 1.5·10−5 nm2/ns, independent of position. Different fixed values of D did not produce good fits, but the experimental data is not sufficient to determine the position dependence of G(x) and D(x) independently. All fitting parameters for the best fit are listed in the Electronic Supplementary Information.
Discussion
PTB1:4W has some characteristics of a two-state folder: single exponential relaxation in GuHCl solution and coincident GuHCl denaturation curves. Other characteristics are more representative of a rough free energy surface: double-exponential T-jump kinetics and non-coincident thermal denaturation curves. This discrepancy can be explained if, in the presence of denaturant, a single large barrier partitions the reaction coordinate into a ‘folded’ and an ‘unfolded’ basin, whereas in the absence of denaturant, no single barrier dominates. The latter scenario matches the general situation the SVSD model uncovered via genetic algorithm: without denaturant, a folded state and two unfolded states U and U’ with energies within a few RT compete with one another. The barriers are not quite low enough for downhill folding, not quite high enough so that the local minimum U’ can be assigned to a separate folding intermediate. Instead, the observed thermodynamics and kinetics correspond to a hybrid mechanism. This observation is in keeping with the observed T-jump relaxation time, which lies between the few millisecond relaxation time of fast apparent two-state folders and the few microsecond relaxation time of downhill folders.
GuHCl denaturation differs from thermal denaturation. As suggested by Tanford, proteins are more completely unfolded when they are denatured by GuHCl, while proteins under thermal denaturation have some persistent structure that may lower the folding barrier.26 As discussed by Naganathan et al.27 denaturant-induced unfolding of small fast-folding proteins at room temperature entails higher activation energies than thermally induced unfolding. Our SVSD surface favors the more structured state U’ over U at high temperature (figure 8). We propose that addition of GuHCl favors the less structured state U by raising the U’-U barrier and decreasing the U free energy. Thermally, the protein denatures to U’ rapidly, while in denaturant, it forms U more slowly. We recently observed a candidate for residual structure in U’: ‘extended structure’ in several proteins at high temperature has more ordered side chains than a random coil, and short segments of beta strand-like geometry.28
The switch between two-state kinetics and nearly downhill dynamics is plausible according to the model of Wolynes and coworkers.10 Naganathan et al.27 calculate a denaturant sensitivity of the free energy such that even the slow rate of 12 s−1 we observed in the presence of 1.5 M GuHCl makes PTB1:4W a fast incipient downhill folder (barrier < 3RT) in the absence GuHCl, in accordance with the data in figure 7.
In downhill folding, the fastest phase (τ1=18 μs in figure 5) is usually labeled “τm” for “molecular phase,” indicating that it corresponds to the barrier-free (ΔG† ≤ RT) diffusion time across the reaction coordinate. Experiments show that τm depends on the topology and the size of the protein. Small downhill folders have τm in the range of 0.1 to 2 μs near the thermal denaturation transition,17,20,29–31, and perhaps an order of magnitude slower at room temperature.27 One would expect that downhill folders with more complicated topology have slightly longer τm. The 415 residue protein phosphoglycerate kinase has τm ≈ 10 μs under denaturing condition.32 It is possible that the 91-residue protein PTB1:4W with its α+β topology has a similarly slow molecular time scale. More likely, and supported by the SVSD fit in figure 8, very small residual barriers remain.
SVSD does not allow the arbitrary baselines frequently used for ‘two-state’ fitting; rather, signal changes arise because the protein distribution shifts along the reaction coordinate, sampling different signals S(x). The large fluorescence intensity baseline below the main unfolding transition (figure 3) is caused by a switch of the SVSD signal function. Again, we have observed a candidate for such intensity changes: tryptophan sidechain fluctuations as the native state loosens upon increasing temperature can change the fluorescence quantum yield.33 ‘Two-state’ fits that require large baselines should be suspect, as these baselines could signal low barriers or large shifts in free energy minima, and hence a breakdown of the two-state approximation.
The actual diffusion coefficient of the PtB1:4W folding reaction should be coordinate-dependent,34–36 but even so, the average value 1.5·10−5 nm2/ns we fitted is at the low end of values expected for a polypeptide chain. A larger value could not fit the experimental data with a 1-D free energy function. The small diffusion coefficient can be explained in two ways. It could model additional small traps on the free energy landscape, indicating that the true free energy surface of PTB1:4W is rougher than the 3 well model shown in figure 8. Alternatively, the collective nature of our single reaction coordinate, which reflects diffusion in a multidimensional coordinate space of protein backbone and sidechains, may result in the smaller effective diffusion coefficient in one dimension.36 A similar result was also reported for folding of lambda repressor fragment, where a 1-D free energy model required a diffusion coefficient much smaller than the free chain diffusion value of ≈0.05 nm2/ns.23
The minimal folding barriers in absence of denaturant make PTB1:4W an ideal candidate for protein engineering to produce a downhill folder. We make some suggestions of how such a redesign could be achieved. To increase the magnitude of the fluorescence change for kinetic studies and to increase native bias, mutations L68Y or L71Y are good candidates based on the PDB structure 1qm9.37 In lambda repressor fragment, an analogous Q33Y mutation places a tyrosine in contact with the fluorescent tryptophan probe, producing a great signal enhancement and stabilizing the native state via aromatic stacking interactions.38,39 To stabilize secondary structure, the helix propensity of helix 1 can be increased from 4.98% to 21.03% as predicted by AGADIR 40 by replacing Val32 and Ser35 with Ala; turn formation is promoted by shortening the long loops such as the 9-residue loop 5 or the 6-residue loop 1 by inserting four-residue turn motifs.
In summary, PTB1:4W is a natural ‘missing link’ between downhill and activated folding, even without extensive sequence engineering. Its free energy landscape is likely to be rougher (contain more local minima) than the minimal fitting model in figure 8; otherwise the fitted diffusion coefficient would have been larger. We suggest mutations that could reduce the ≈ 400 μs ‘slow’ phase towards the expected molecular time τm=1-10 μs, which the faster phase in figure 5 already approaches. Addition of GuHCl considerably reduces the bias towards the native state and increases the folding barrier.
Methods
Protein sample
The RRM4 domain of human PTB1 protein was subcloned by polymerase chain reaction from the human PTB1 gene into the pET28A plasmid (obtained from Professor Doug Black, UCLA). The RRM4 gene fragment with an added NcoI restriction enzyme cutting site at the N-terminus and a HindIII cutting site at the C-terminus was cloned into an Isopropyl-β-D-1-thiogalactopyranoside-inducible (IPTG-inducible) ptac plasmid. The RRM4 gene fragment begins with the Met-Gly at position 440 of full length PTB1 protein, and extends through the natural terminus (isoleucine 531). RRM4W was generated by mutation of Phe526 to Trp using the QuickChange site-directed mutagenesis kit (Stratagene). Both DNA constructs were sequenced for verification.
Protein was expressed in E. Coli BL-21 DE3 gold cells grown at 37°C. At OD600=0.9, 1 mM IPTG was used to induce protein overexpression. Cells were harvested after 4 hours, pelleted by centrifugation at 6500 rpm, washed with buffer A (20 mM Tris buffer, pH 7.5, 20 mM NaCl, and 2 mM EDTA), repelleted, and stored at −80 °C overnight. Cells were resuspended in Buffer B (20 mM Sodium Acetate, pH 5.3, 50 mM NaCl, 2mM EDTA) with 20 mg/mL of the serine protease inhibitor phenylmethylsulphonyl fluoride (PMSF), 50 units/g of DNase II, and protease inhibitor cocktail (Sigma), and lysed using a French press. The lysate was spun down at 15,000 rpm and dialyzed against 1L of buffer B at 4°C for 3 hours. The dialysis product was cleared via centrifugation and loaded onto a CM-sepharose column equilibrated in buffer C (50 mM Tris, pH 7.5 10-100 mM NaCl) at room temperature. After flow-through was discarded, the proteins were eluted with the 10-100 mM NaCl gradient of buffer C. Fractions from the column were combined and concentrated using Vivaspin centrifugal concentrators, and then exchanged into buffer. Freshly prepared 2 mM protein samples in 50 mM sodium phosphate and 150 mM NaCl buffer at pH 7 were stored at 4 °C for further measurements because freezing and thawing protein samples can cause protein aggregation. Protein purity was verified by sodium dodecyl sulfate polyacrylamide gel electrophoresis (SVSDS/PAGE).
Thermodynamic measurements
Temperature-dependent fluorescence spectra were collected on a Varian Cary Eclipse fluorimeter. Circular dichroism (CD) spectra and thermal titrations were acquired on a JASCO J-715 spectropolarimeter equipped with a PMT for fluorescence measurements and a Peltier temperature controller. The stored protein sample was diluted with 50 mM sodium phosphate and 150 mM NaCl buffer at pH 7 to reduce its concentration to about 3 μM. The sample was contained in a square quartz cuvette with 1 cm pathlength and covered with mineral oil to prevent evaporation at the higher titration temperatures. The thermal titration was measured from 2 °C to 98 °C in 2 °C steps. Integrated fluorescence data excited at 280 nm was collected simultaneously with the CD signal at 222 nm. Fluorescence peak wavelength was measured on a fluorimeter. The signals Si(T) were fitted to a global two-state model with linear baselines:
| (1) |
where the free energy difference between the native state (N) and the denatured state (D) was fitted by a quadratic polynomial
| (2) |
and Tm is the melting temperature. The two state model was insufficient to fit the three traces in figure 3 simultaneously.
Kinetic measurements
Stopped flow experiments were performed with an Applied Photophysics SX.18 MV system with 1:1 or 10:1 mixing at 23 °C. The protein concentration was 1 μM before mixing and the two buffers used were a 3 M GuHCl/50 mM phosphate/150 mM NaCl solution and a 0 M GuHCl/50 mM phosphate/150 mM NaCl solution. Tryptophan was excited at 280 nm and the integrated fluorescence was collected with a 320 nm cutoff filter (WG 320) before the PMT. The time resolution of the collection was 1 ms and the data were acquired with linear time base or logarithm time base for 1 s to 20 s.
Temperature jump-induced relaxation kinetics were measured on our home-built nanosecond laser induced T-jump apparatus.41 Protein samples were prepared in a 50 mM phosphate and 150 mM NaCl buffer containing 20% D2O at pH 7.0 (without isotope effect corrections). The concentration of the protein was kept below 21 μM, and the final temperature was kept below 65 °C to avoid aggregation. Full reversibility was confirmed by checking that the steady-state fluorescence lifetimes at 25 °C before and after the T-jump experiment were identical.
The output from a Nd:YAG laser was Raman shifted by 360 psi H2 gas to produce 1.9 μm wavelength, 10 ns duration T-jump pump pulses. The pump pulse collimated to 2 mm diameter generated an 8-12 °C T-jump in the protein solution within several nanoseconds. The probe beam was a train of 280 nm sub-ps laser pulses 14 ns apart, generated by tripling the output from a mode-locked Ti-Sapphire laser. Tryptophan fluorescence was collected with a photomultiplier tube through a Hoya B370 filter to filter out the scattered incident light. In each measurement, a series of tryptophan fluorescence decays digitized with 500 ps time resolution and spaced by 14 ns was collected for a total of 500 μs (limited by the memory of the digitizer used). Folding kinetics longer than 500 μs were obtained by delaying the trigger position for data and obtaining several overlapped traces. Data were binned into several-microsecond intervals to achieve better signal to noise ratio.
When proteins relax towards a larger unfolded population after the T-jump, the fluorescence decay profile evolves in time. The folding kinetics traces were extracted by applying either χ-analysis or plotting the integrated fluorescence intensity traces.41,42 χ-analysis fits the change in fluorescence lifetime to a linear combination of two fluorescence decay basis functions, one right after the T-jump, and the other at the end of the data collection window. All the raw data traces obtained by either method (figure 4A) could be fitted to exponential decay functions
| (3) |
The Marquard-Levenberg algorithm used for fitting yielded one standard deviation uncertainties for the relaxation times.43 A nonzero amplitude for more than a single exponential violates the two-state assumption.
SVSD method
In protein folding kinetics, multi-state master equations are usually the fitting model of choice. States are separated by large barriers so protein population can be assigned uniquely to a state for the purposes of thermodynamic fitting; dwell time in such states is long compared to barrier crossing time, so transition state theory can be used. In contrast, downhill folding involves populations that cannot be assigned uniquely to states, and Langevin dynamics30 or other physics-based44 models must be used.
Here we present a model that does not assign protein populations to fixed states separated by large barriers. SVSD achieves this by solving the Smoluchowski equation to determine the protein population probability distribution. The ingredients of SVSD are: a free energy surface G(x,T) which depends on reaction coordinates x and a perturbation (e.g. temperature T), signal functions S(x) that correspond to spectroscopic probes, and a diffusion coefficient D(x) that may be coordinate dependent. For fitting, we assumed D to be constant; the free energy is modeled by a sum of Gaussian ‘dimples’, and the signal functions are modeled by sigmoids, as described in detail in the Electronic Supplementary Information. For x, we picked the radius of gyration Rg. Rg is 1.5 nm for the native state based on the 1QM9 structure in the protein data bank,45 analyzed with VMD46 For the unfolded state, we used the consensus value Rg (nm) = 0.21 · N0.6 from ref. 47, which yielded 3.1 nm. The choice of x is arbitrary in the sense that the experimental reaction coordinates are fluorescence and circular dichroism values, which could be mapped onto any reference coordinate. We chose Rg so the order of magnitude of the diffusion coefficient can be compared with literature values.
We have implemented the SVSD method by combining an efficient singular value integrator for the multi-dimensional Smoluchowski equation with a genetic algorithm search through G, S and D to identify free energy surfaces, diffusion coefficients, and signal functions compatible with the data.25
SVSD involves five steps. 1) a family of solutions {G, S, D} is generated, subject to physically motivated constraints. 2) equilibrium populations are evaluated at temperatures T
| (4) |
for thermodynamic titrations. Time-dependent populations are evaluated after a jump from T-ΔT to T by solving the Smoluchowski equation
| (5) |
for modeling fast relaxation measurements. 3) Signal functions S(x) are integrated over equilibrium populations ρeq(x, T) to yield thermodynamic signals S(T) and over kinetic populations ρ(x,t) to yield kinetic signals S(t). 4) A least squares ‘fitness’ criterion ranks all family members. 5) The fittest family members {G, S, D} are ‘mated’ by the genetic algorithm to produce diverse offspring, which replace less fit family members in the next iteration. The result is a diverse family of free energy surfaces, signal functions and diffusion coefficients compatible with the data, from which the optimized solution can be picked.
The optimal parameters and range of parameter values are listed in a table in Electronic Supplementary Information. These values can be used to reproduce the plots in figure 8, except that we have shifted the minimum free energy of the native state to ΔG=0 in figure 8, since only the relative free energy of states matters.
Supplementary Material
Acknowledgments
This work was supported by a grant from the National Science Foundation (MG), MCB 0613643, and by the National Institutes of Health grant GM0772231 (KBH).
References
- (1).Kubelka J; Hofrichter J; Eaton WA. Curr. Opinion. Struct. Bio, 2004, 14, 76–88. [DOI] [PubMed] [Google Scholar]
- (2).Gruebele M. Comptes Rendus Biol, 2005, 328, 701–712. [DOI] [PubMed] [Google Scholar]
- (3).Munoz V. Ann. Rev. Biophys. Biomol. Struct, 2007, 36, 395–412. [DOI] [PubMed] [Google Scholar]
- (4).Zhang J; Li WF; Wang J; Qin M; Wang W. Proteins-Struct. Funct. Bioinformatics, 2008, 72, 1038–1047. [DOI] [PubMed] [Google Scholar]
- (5).Freddolino PL; Liu F; Gruebele M; Schulten K. Biophys. J, 2008, 94, L75–L77. [DOI] [PMC free article] [PubMed] [Google Scholar]
- (6).Bruscolini P; Pelizzola A; Zamparo M. J. Chem. Phys, 2007, 126, 215103. [DOI] [PubMed] [Google Scholar]
- (7).Cho SS; Weinkam P; Wolynes PG. Proc. Nat. Acad. Sci. USA, 2008, 105, 118–123. [DOI] [PMC free article] [PubMed] [Google Scholar]
- (8).Ferguson N; Schartau PJ; Sharpe TD; Sato S; Fersht AR. J. Mol. Biol, 2004, 344, 295–301. [DOI] [PubMed] [Google Scholar]
- (9).Ivarsson Y; Travaglini-Allocatelli C; Brunori M; Gianni S. Eur. Biophys. J. Biophys. Lett, 2008, 37, 721–728. [DOI] [PubMed] [Google Scholar]
- (10).Bryngelson JD; Onuchic JN; Socci ND; Wolynes PG. Proteins: Struct., Funct., Genet, 1995, 21, 167–195. [DOI] [PubMed] [Google Scholar]
- (11).Liu F; Gruebele M. Chem. Phys. Lett, 2008, 461, 1–8. [Google Scholar]
- (12).Godoy-Ruiz R; Henry ER; Kubelka J; Hofrichter J; Munoz V; Sanchez-Ruiz JM; Eaton WA. J. Phys. Chem. B, 2008, 112, 5938–5949. [DOI] [PubMed] [Google Scholar]
- (13).Zhu Y; Alonso DOV; Maki K; Huang C-Y; Lahr SJ; Daggett V; Roder H; DeGrado WF; Gai F. Proc. Natl. Acad. Sci. USA, 2003, 100, 15486–15491. [DOI] [PMC free article] [PubMed] [Google Scholar]
- (14).Fung A; Li P; Godoy-Ruiz R; Sanchez-Ruiz JM; Munoz V. J. Am. Chem. Soc, 2008, 130, 7489–7495. [DOI] [PubMed] [Google Scholar]
- (15).Liu F; Du D; Fuller AA; Davoren J; Wipf P; Kelly J; Gruebele M. Proc. Nat. Acad. Sci. USA, 2008, 105, 2369–2374. [DOI] [PMC free article] [PubMed] [Google Scholar]
- (16).Nguyen H; Jaeger M; Kelly J; Gruebele M. J. Phys. Chem. B, 2005, 109, 15182–15186. [DOI] [PubMed] [Google Scholar]
- (17).Liu F; Gruebele M. J. Chem. Phys, 2009, 131, 195101. [DOI] [PubMed] [Google Scholar]
- (18).Liu F; Dumont C; Zhu YJ; DeGrado WF; Gai F; Gruebele M. J. Chem. Phys, 2009, 130, 061101. [DOI] [PMC free article] [PubMed] [Google Scholar]
- (19).Yang WY; Gruebele M. J. Am. Chem. Soc, 2004, 126, 7758–7759. [DOI] [PubMed] [Google Scholar]
- (20).Liu F; Gruebele M. J. Mol. Biol, 2007, 370, 574–584. [DOI] [PubMed] [Google Scholar]
- (21).Clerte C; Hall KB. RNA, 2006, 12, 457–475. [DOI] [PMC free article] [PubMed] [Google Scholar]
- (22).Maki K; Cheng H; Dolgikh DA; Roder H. J. Mol. Biol, 2007, 368, 244–255. [DOI] [PMC free article] [PubMed] [Google Scholar]
- (23).Yang WY; Gruebele M. Nature, 2003, 423, 193–197. [DOI] [PubMed] [Google Scholar]
- (24).Yang W; Larios E; Gruebele M. J. Am. Chem. Soc, 2003, 125, 16220–16227. [DOI] [PubMed] [Google Scholar]
- (25).Scott G; Gruebele M. J. Comput. Chem, 2009, submitted. [DOI] [PubMed] [Google Scholar]
- (26).Tanford C. Adv. Protein Chem, 1968, 23, 121–282. [DOI] [PubMed] [Google Scholar]
- (27).Naganathan AN; Doshi U; Munoz V. J. Am. Chem. Soc, 2007, 129, 5673–5682. [DOI] [PMC free article] [PubMed] [Google Scholar]
- (28).Yang WY; Larios E; Gruebele M. J. Am. Chem. Soc, 2003, 125, 16220–16227. [DOI] [PubMed] [Google Scholar]
- (29).Kubelka J; Eaton WA; Hofrichter J. J. Mol. Biol, 2003, 329, 625–630. [DOI] [PubMed] [Google Scholar]
- (30).Yang W; Gruebele M. Biophys. J, 2004, 87, 596–608. [DOI] [PMC free article] [PubMed] [Google Scholar]
- (31).Vu DM; Peterson ES; Dyer BB. J. Am. Chem. Soc, 2004, 126, 6546–6547. [DOI] [PubMed] [Google Scholar]
- (32).Sabelko J; Ervin J; Gruebele M. Proc. Nat. Acad. Sci. USA, 1999, 96, 6031–6036. [DOI] [PMC free article] [PubMed] [Google Scholar]
- (33).Ervin J; Larios E; Osvath S; Schulten K; Gruebele M. Biophys. J, 2002, 83, 473–483. [DOI] [PMC free article] [PubMed] [Google Scholar]
- (34).Chahine J; Oliveira RJ; Leite VBP; Wang J. Proc. Nat. Acad. Sci. USA, 2007, 104, 14646–14651. [DOI] [PMC free article] [PubMed] [Google Scholar]
- (35).Lee CL; Stell G; Wang J. J. Chem. Phys, 2003, 118, 959–968. [Google Scholar]
- (36).Best RB; Hummer G. Proc. Nat. Acad. Sci. USA, 2009, doi: 10.1073/pnas.0910390107. [DOI] [Google Scholar]
- (37).Conte MR; Grune T; Ghuman J; Kelly G; Ladas A; Matthews S; Curry S. Embo Journal, 2000, 19, 3132–3141. [DOI] [PMC free article] [PubMed] [Google Scholar]
- (38).Ghaemmaghami S; Word JM; Burton RE; Richardson JS; Oas TG. Biochemistry, 1998, 37, 9179–9185. [DOI] [PubMed] [Google Scholar]
- (39).Yang WY; Gruebele M. Biochemistry, 2004, 43, 13018–13025. [DOI] [PubMed] [Google Scholar]
- (40).Lacroix E; Viguera AR; Serrano L. J. Mol. Biol, 1998, 284, 173–191. [DOI] [PubMed] [Google Scholar]
- (41).Ballew RM; Sabelko J; Reiner C; Gruebele M. Rev. Sci. Instrum, 1996, 67, 3694–3699. [Google Scholar]
- (42).Ervin J; Sabelko J; Gruebele M. J. Photochem. Photobiol, 2000, B54, 1–15. [DOI] [PubMed] [Google Scholar]
- (43).Press WH; Teukolsky SA; Vetterling WT; Flannery BP Numerical Recipes in Fortran: The Art of Scientific Computing, 2 ed.; Cambridge University Press: Cambridge, 1992. [Google Scholar]
- (44).Kubelka J; Henry ER; Cellmer T; Hofrichter J; Eaton WA. Proc. Nat. Acad. Sci. USA, 2008, 105, 18655–18662. [DOI] [PMC free article] [PubMed] [Google Scholar]
- (45).Berman HM; Westbrook J; Feng Z; Gilliland G; Bhat TN; Weissig H; Shindyalov IN; Bourne PE. Nucleic Acids Research, 2000, 28, 235–242. [DOI] [PMC free article] [PubMed] [Google Scholar]
- (46).Humphrey WF; Dalke A; Schulten K. J. Mol. Graphics, 1996, 14, 33–38. [DOI] [PubMed] [Google Scholar]
- (47).Fitzkee NC; Rose GD. Proc. Nat. Acad. Sci. USA, 2004, 101, 12497–12502. [DOI] [PMC free article] [PubMed] [Google Scholar]
Associated Data
This section collects any data citations, data availability statements, or supplementary materials included in this article.