Abstract
Symptoms induced by caloric or noncaloric satiety test meals and gastric myoelectrical activity (GMA) have not been studied in patients with diabetic gastroparesis (DGP) before and after intense glucose management.
Aims:
To determine the effects of continuous subcutaneous insulin infusion (CSII) with continuous glucose monitoring (CGM) on GI symptoms, volume consumed, and GMA induced by the caloric meal satiety test (CMST) and water load satiety test (WLST) in DGP.
Methods:
45 patients with DGP underwent CMST and WLST at baseline and 24 weeks after CSII with CGM. Subjects ingested the test meals until they were completely full. Visual analog scales were used to quantify pre- and post-meal symptoms and GMA was recorded with cutaneous electrodes and analyzed visually and by computer.
Results:
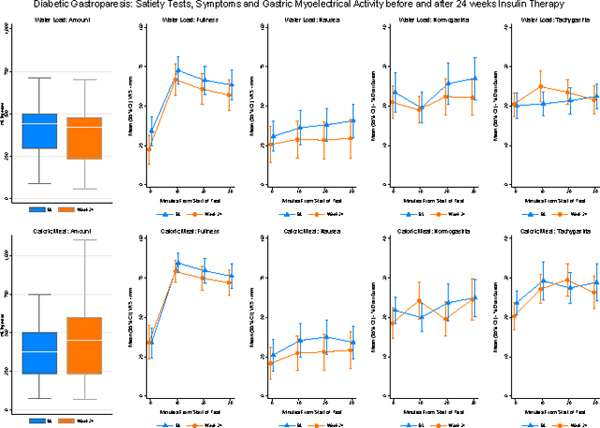
At baseline and 24-week visits, nausea, bloating, abdominal discomfort, and fullness were immediately increased after CMST and WLST (Ps<0.01). The meal volumes ingested were significantly less than normal controls at both visits in almost one-third of the subjects. After the CMST, the percentage 3 cycle per minute GMA increased and bradygastria decreased compared with WLST (Ps<0.05). After treatment for 24 weeks meal volumes ingested, post-meal symptoms, and GMA were no different than baseline.
Conclusions:
1) Satiety test meals elicited symptoms of nausea, bloating, and abdominal discomfort; 2) CMST stimulated more symptoms and changes in GMA than WLST; and 3) CSII with CGM for 24 weeks did not improve symptoms, volumes ingested, or GMA elicited by the two satiety test meals in these patients with diabetic GP.
Keywords: diabetic gastroparesis, caloric and non-caloric test meals, gastric myoelectrical activity, gastric dysrhythmias, Gastroparesis Cardinal Symptom Index (GCSI), Patient Assessment of Upper GI Symptoms (PAGI-SYM)
Graphical Abstract
Introduction
Early satiety, fullness, abdominal discomfort, bloating, and nausea and vomiting are symptoms associated with gastroparesis that usually increase after ingestion of meals.1 The rate of gastric emptying of solid test meals, which is used to define gastroparesis, is poorly related to these postprandial symptoms.2,3 Thus, the origin of postprandial symptoms in gastroparesis remains unclear. Provocative test meals have not been studied to assess immediate postprandial symptoms and gastric myoelectrical activity (GMA) in patients with diabetic gastroparesis.
On the other hand, test meals have been frequently used to study postprandial symptoms in patients with postprandial distress syndrome or dysmotility-like functional dyspepsia. These patients ingested lower volumes of caloric meals or noncaloric water loads compared with healthy control subjects and reported upper gastrointestinal symptoms similar to those reported by patients with gastroparesis.4–7 Patients with functional dyspepsia (dysmotility subtype) ingested smaller volumes of water and developed symptoms and a variety of gastric dysrhythmias compared with healthy subjects.7 In subjects with gastroparesis, lower volumes of water ingested were associated with increased early satiety, postprandial fullness, and severity of delayed emptying.8 Thus, disorders of gastric capacity (accommodation or hypersensitivity) and gastric dysrhythmias, as unmasked by caloric meal satiety tests (CMST) or water load satiety tests (WLST), represent potential pathophysiological mechanisms related to postprandial symptoms in patients with gastroparesis.
The effects of intensive insulin treatment on meal-related symptoms and GMA have not been studied in patients with diabetic gastroparesis. Thus, the aims of the current study were to determine the effect of the CMST and WLST on upper GI symptoms and GMA in well characterized patients with diabetic gastroparesis before and after intensive, open-label, continuous subcutaneous insulin infusion (CSII) therapy and continuous glucose monitoring (CGM) for 24 weeks. The patients were enrolled in the Gastroparesis Clinical Research Consortium study protocol GLUMIT-DG and had monthly clinic visits to assess glucose levels, adjust insulin doses, and review diets in order to assess safety of the intensive insulin treatment approach.9 We hypothesized that the CMST and WLST would evoke upper gastrointestinal symptoms and gastric dysrhythmias in patients with diabetic gastroparesis and that the ingested volumes, the meal-induced symptoms, and GMA would improve if better glucose control was achieved during the 24 weeks of intensive CSII with CGM.
Methods
Patients:
Forty-five patients with diabetic gastroparesis who participated in the GLUMIT-DG study were studied. The patients were recruited from 7 centers of the GpCRC. Patients had symptoms for ≥ 1 year with GCSI scores ˃ 18. Subjects had upper endoscopy within one year to exclude other reasons for symptoms. Gastroparesis was confirmed with gastric scintigraphy before registration with ˃ 60% meal retention at 2 hours and/or ˃ 10% at 4 hours.10 Type 1 diabetes versus Type 2 diabetes was determined by the site investigator based on patient history and review of records.
Continuous Subcutaneous Insulin Infusion and Continuous Glucose Monitoring Protocol:
Patients were instructed in operating the CSII device (MiniMed Paradigm®Model 722 or Model 723, Medtronic, Northridge, CA) coupled with the MiniLink™ REAL-Time Transmitter CGM system (Medtronic, Northridge, CA). Subjects needed to show competency in (i) checking glucose levels with CGM plus finger stick methods ≥4 times daily, (ii) managing CSII including adjusting insulin dosing as described below, and (iii) electronically transferring CGM data from their home computer to the GLUMIT-DG study staff every 2 weeks (CareLink, Medtronic, Northridge, CA). After successful completion of the Run-In, patients were formally enrolled in GLUMIT-DG and permitted to progress to the 24-week treatment and follow-up phase.9
Electrogastrography:
After an overnight fast, the subjects had a finger stick glucose level to confirm glucose was less than 270 gm/dl. If glucose was over 270 mg/dl, then the glucose level was treated or the test was rescheduled. Subjects were seated in a comfortable chair in a quiet area. EKG-type electrodes were placed in standard position on the upper abdominal surface after the skin was cleaned with alcohol wipes. Electrodes were connected to the electrogastrogram (EGG) recording device (3CPM Company, Towson, MD). The EGG signal was digitized for computer analysis.7,11 Patients had a 15-minute baseline EGG recording followed by one of the two satiety test protocols listed below. Patients returned on another day for the other of the two EGG with satiety test protocols.
The percentage distribution of GMA power in the four frequency ranges listed below were averaged for Time 0 (before meal ingestion) and for the 10-minute periods after ingestion of the WLST or CMST for group analyses at baseline and 24 weeks. An EGG clinical diagnosis was also determined for the WL test for each subject by comparing values from historical subjects.7 The individual EGG diagnoses were: normal (2.5–3.5 cpm), tachygastria (3.5–10 cpm), bradygastria (1–2.5 cpm), mixed gastric dysrhythmia (a combination of tachygastria and bradygastria), and duodenal-respiration (10–15 cpm). These diagnoses were based on the GMA response to the WL as determined by the percentage distribution of GMA power in the four frequency ranges in response to WLST.7 EGG recordings from the clinical centers were reviewed and edited at one site (Wake Forest) by one of the authors (KK) who was blinded to the study site and to baseline or Week 24 visit.
Provocative Liquid Test Meals Protocols:
Water Load Satiety Test (WLST)
Subjects ingested water until they achieved the sensation of “completely full” during a five-minute time period.7 The volume of water ingested was recorded. The subjects indicated the intensity of fullness, hunger, abdominal discomfort, bloating, and nausea on a 100 ml visual analog scale (VAS) before and 10, 20, and 30 minutes after the water was ingested. GMA was recorded for 15 minutes before the WL was ingested and for 30 minutes afterwards using electrogastrography methods.
Caloric Meal Satiety Test (CMST)
Subjects ingested 150 ml of Ensure® every four minutes with no time limit until they were “completely full”.11 The volume of Ensure® ingested was recorded. The subjects used a 100 ml VAS to rate the symptoms noted above before and 10, 20, 30, and 60 minutes after the CMST. GMA was recorded for 15 minutes for the CM and for 60 minutes afterwards using electrogastrography methods.
Statistics
Analyses of gastrointestinal symptoms (fullness, hunger, bloating, abdominal discomfort, and nausea) and percentage GMA in the four frequency ranges were stratified by CMST and WLST satiety test results. Changes in meal volume between baseline and 24 weeks were assessed using the paired t-test. For comparisons within the WLST, symptoms and GMAs used 1 pre-satiety test time and 3 post-satiety test times at 10, 20, and 30 minutes. For comparisons within the CMST, symptoms used 1 pre-satiety test time and 4 post-satiety test times at 10, 20, 30, and 60 minutes, whereas GMAs used 1 pre-satiety test time and 6 post-satiety test times at 10, 20, 30, 40, 50, and 60 minutes. Comparisons between the WSTL and CMST used time tests that were common to both, namely the 1 pre-satiety test time and the 3 post-satiety test times at 10, 20, and 30 minutes. Mean scores for symptoms and GMAs compared the baseline vs. 24-week visit assessed at the pre-satiety and post-satiety test times. Changes in scores for symptoms and GMAs compared pre-satiety vs. post-satiety test times separately at the baseline and 24-week visits. Repeated measures were analyzed using linear regression with mixed effects. P values ≤ 0.05 were considered statistically significant. The data analysis for this paper was generated using both SAS12 and Stata software.13
Results
Patients
The patients were 31 women and 14 men ages 18 to 70 years. Thirty-one patients had type 1 diabetes and 14 had type 2 diabetes. Characteristics of the patients are shown in Table 1. Duration of diabetes averaged 21 ± 11 years. Body mass index averaged 29. At baseline HbA1c averaged 9.4% ± 1.4%. The average percent meal retained at two hours was 63% ± 20% and four hours was 32% ± 20%. At four hours 16 patients had severe retention (˃ 30% retained), 5 had moderate retention (20–30% retained), and 15 had mild retention (10–20% retained). GCSI averaged 29.3 ± 7.1 (maximum score of 45). Almost half of the patients were taking prokinetic agents and 70% were taking a proton pump inhibitor. The T2DM patients were significantly older, had higher BMI, used less continuous insulin pump therapy, used more antidiabetic medications other than insulin, and had ingested lower mean volumes during the satiety water load and liquid nutrient tests compared to T1DM patients. Other demographic and standard laboratory results were similar in the two groups as previously published.9
Table 1.
Demographic and Clinical Characteristics of Patients with Diabetic Gastroparesis
| Total n=45 | |
|---|---|
| Demographics | |
| Female | 31 (69%) |
| White | 37 (82%) |
| Hispanic | 8 (18%) |
| Other | |
| Age (years) | 45 (12%) |
| College graduate | 14 (31%) |
| Metabolic | |
| % Type 1/Type 2 Diabetes | 69% |
| Time since diabetes diagnosis (years) | 21 (11) |
| Hemoglobin A1c (%) | 9.4 (1.4) |
| Weight (kg) | 78 (21) |
| Body mass index (kg/m2) | 29 (8) |
| Gastric emptying scintigraphy | |
| 2-hour gastric retention (%) | 60 (20) |
| 4-hour gastric retention (%) | 30 (20) |
| GCSI (Mean ± SD) | |
| Nausea | |
| Nausea component | 3.5 (1.2) |
| Retching component | 2.4 (1.6) |
| Vomiting component | 2.3 (1.9) |
| Sub score | 8.1 (4.2) |
| Fullness or early satiety | |
| Stomach fullness component | 3.9 (0.9) |
| Not able to finish component | 3.3 (1.3) |
| Feeling excessively full component | 3.9 (1.0) |
| Loss of appetite component | 3.0 (1.6) |
| Subscore | 14.1 (3.6) |
| Bloating | |
| Bloating component | 3.7 (1.2) |
| Stomach visibly larger component | 3.4 (1.4) |
| Subscore | 7.1 (2.3) |
| Total GCSI | 29.3 (7.1) |
Results of treatment with CSII with CGM for six months increased time in eu-glycaemia (70–180 mg/dL) from 44% to 52% (P<0.01), decreased time in hypoglycemia (<70 mg/dL) (from 3.9% to 1.8%) and hyperglycemia (>300 mg/dL) (from 14.2% to 6.9%, P<0.0001). HbA1c was reduced from 9.4% to 8.3% or 1.1±1.2% (P<0.01) were previously reported.9 Gastric symptom scores decreased 23% (P<0.0001) with lower nausea/vomiting (35%), fullness/early satiety (17%), and bloating/distention (21%) sub-scores (P≤0.002). Quality-of-life scores improved 29% (P<0.0001). Satiety test tolerance increased 14% (P=0.05). HbA1c decreased more in patients with type 2 diabetes (T2DM) (2.0±2.1% vs. 0.7±1.1%, P=0.002) but symptoms improved more in patients with type 1 diabetes (T1DM) (32% vs. 1%, P=0.01). Six severe hypoglycemic events occurred on treatment versus one during screening (0.3 vs. 0.1/person-year, P=0.23).9
Of the 45 subjects in the current study, 43 and 44 subjects had EGGs with WLSTs and CMSTs, respectively, at baseline. At 24 weeks, 37 and 39 subjects had EGGs with WLSTs and CMSTs, respectively. EGGs were not obtained or analyzed at 24 weeks in 11 patients because a) patients were not able to return for either the water load test or the satiety test, which were performed on separate days, or b) movements of the arms, legs, or torso resulted in off scale deflections of the EGG signal. EGG recordings with excessive movement artifact were not analyzed.
Volumes Ingested during the Water Load Satiety Test and Caloric Meal Satiety Test at Baseline and 24 Weeks
The average volume of water ingested was 437 ml ± 216 ml at baseline and was 413 ± 238 at 24 weeks (p=0.56) (Figure 1). Volumes of water ingested in the five-minute time limit ranged from 150 ml to 1150 ml. Historical control subjects ingested water until completely full using the same protocol and the average volume ingested was 648 ml ± 205 ml.14 Thus, the lower limit of normal was set at ˃ 238 ml water ingested in five minutes. Using this cutoff, 24% of patients had abnormal WLSTs at baseline and 27% at 24 weeks.
Figure 1.
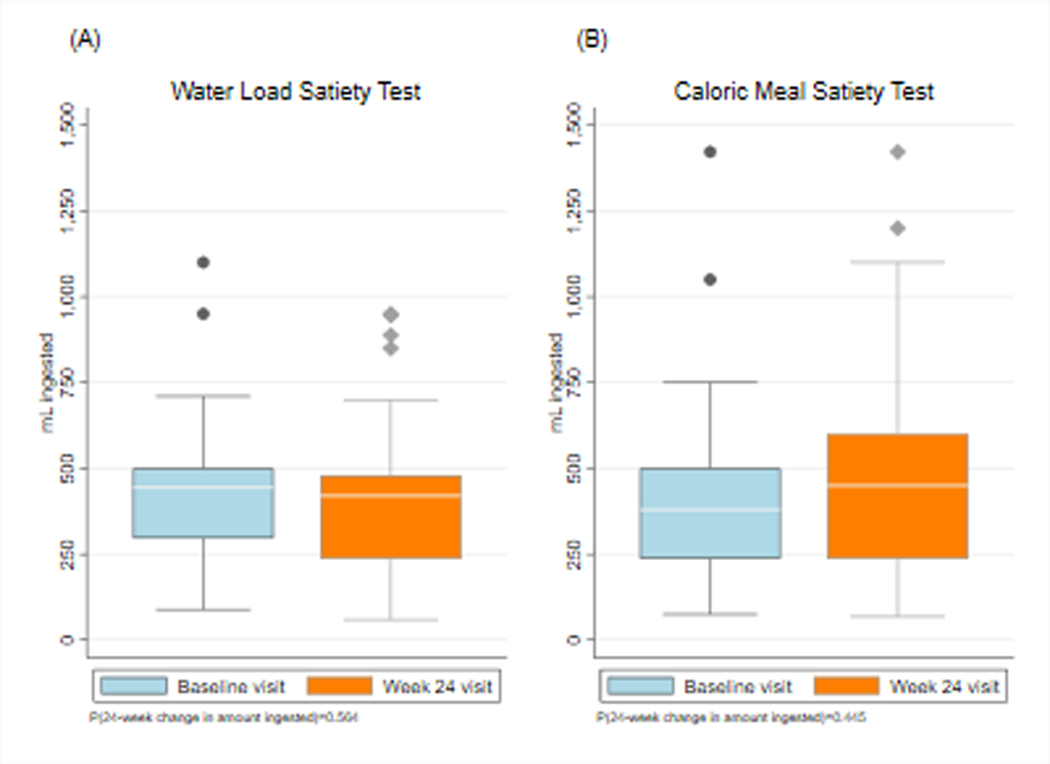
Volumes ingested by subjects during the water load satiety test (WLST) and caloric meal satiety test (CMST) test meals until they were completely full. The X axis shows baseline and Week 24 visits and the Y axis shows the volume in milliliters (ml) ingested at baseline and 24 weeks after insulin pump therapy and continuous glucose monitoring. The volume of water ingested at baseline was 437 ml and 413 ml at 24 weeks (P=0.56). The average volume of caloric test meal ingested at baseline was 427 ml and 480 ml at Week 24 (p=0.44).
The average volume ingested during the CMST was 427 ml ± 287 ml at baseline and was 480 ml ± 217 ml at 24 weeks (p=0.44) (Figure 1). Volumes ingested by our subjects ranged from 125 ml to 1422 ml to achieve the sense of “completely full.” The duration of ingestion ranged from 4–10 minutes. Historical control subjects ingested 800 ml to 1500 ml of a caloric load over unlimited time to achieve maximum satiety using similar CMST protocols.4–6 The CMST with a protocol similar to the current study reported healthy subjects ingest 1048 ± 421.5 Thus, the lower range of normal was set at ≥ 206 ml ingested. Using this cutoff, 15% and 19% of the diabetic subjects ingested less than 206 ml at baseline and at 24 weeks, respectively.
Symptoms and GMA in Response to the Water Load and Caloric Meal Satiety Tests at Baseline and 24 Week Visits
At baseline and 24 weeks fullness increased and hunger decreased significantly and bloating and abdominal discomfort increased significantly after the WLST (Ps<0.02) (Figure 2). Nausea increased significantly after WLST at Week 24 (P<0.01) but not at baseline (P=0.08). There were no differences in the intensity of these symptoms at 24 weeks compared with baseline.
Figure 2.
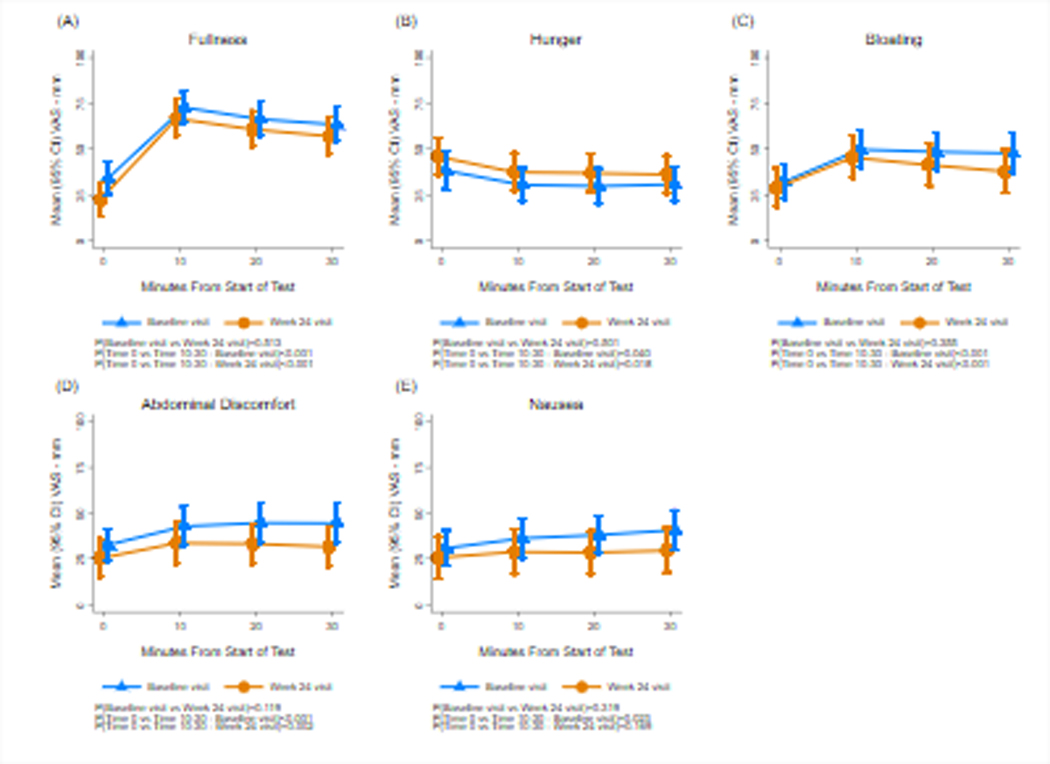
Fullness, hunger, bloating, abdominal discomfort, and nausea scores are shown before and after the water load satiety test (WLST) test at baseline and at 24 weeks. The X axis shows time in minutes. Time 0 indicates the 10 minutes before the test meal and 10, 20, and 30 minutes indicate time after ingestion. The Y axis shows the symptom intensity on the visual analog scale (VAS) in millimeters (mm). Fullness increased significantly after the WLST and hunger decreased significantly at baseline and Week 24 visits. Symptoms of bloating and abdominal discomfort and nausea all increased significantly at the baseline visit, and bloating and abdominal discomfort increased significantly at 24 weeks. Compared with the baseline visit, there were no significant changes in symptoms at Week 24.
Figure 3 shows GMA results in the bradygastria, normogastria, tachygastria, and duodenal frequencies before (Time 0) and 10, 20, and 30 minutes after the subjects ingested water until they were completely full at baseline and 24-week visits. The percentage of normal 3 cpm GMA and tachygastria increased after the WLST at each visit but changes were not statistically significant. There were no changes in the average percentage distribution of GMA in these four frequency ranges at Week 24 compared with baseline values.
Figure 3.
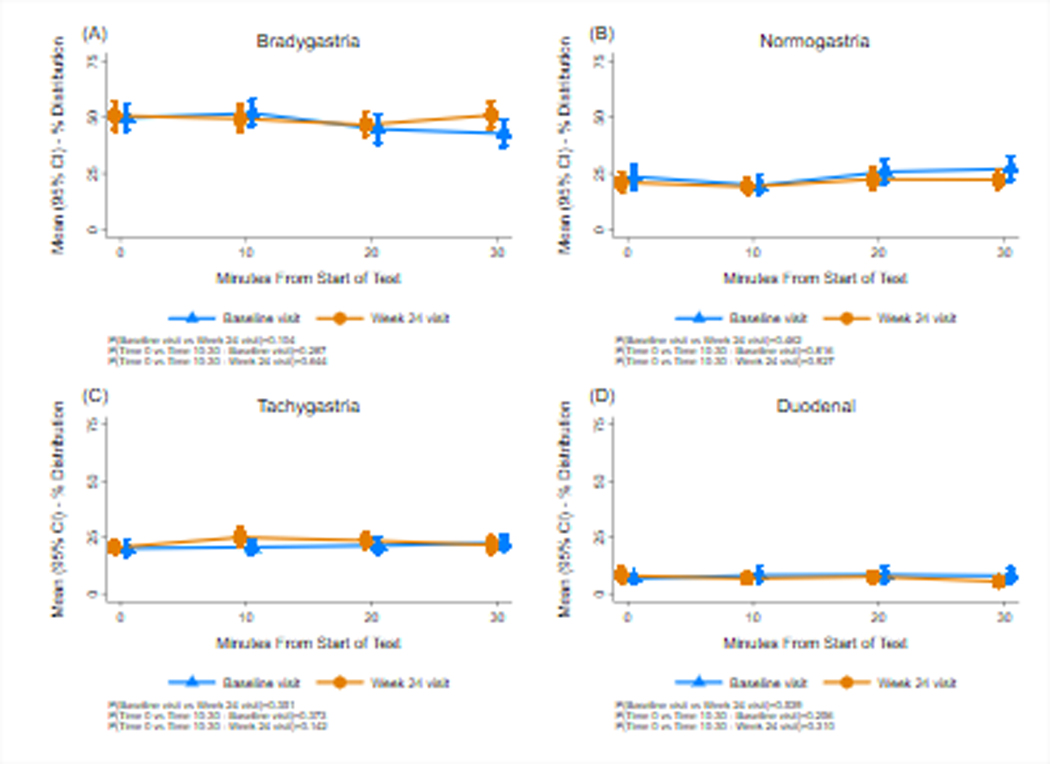
Gastric myoelectrical activity (GMA) before and after the water load satiety test at baseline and at 24 weeks. Bradygastria (1.0–2.5 cpm), normogastria (2.5–3.5 cpm), tachygastria (3.5–10 cpm), and duodenal-respiration (10–15 cpm) frequency ranges are shown. The X axis indicates time in minutes with Time 0 indicating the 10 minutes before the test meal and the 10, 20, and 30-minute periods after ingestion. The Y axis indicates the percent distribution of GMA power in the four frequency ranges. Normogastria and tachygastria increased 20 and 30 minutes after ingestion at baseline and Week 24 visits, but changes were not statistically significant. Compared with baseline there were no significant changes in GMA at Week 24.
Figure 4 shows fullness, hunger, bloating, abdominal discomfort, and nausea before and after the CMST test. Compared with pre-meal, fullness increased and hunger decreased significantly and bloating, abdominal discomfort, and nausea increased significantly after the CMST (Ps<0.01). These latter three symptoms remained significantly elevated for 60 minutes after the meal. There were no significant differences in the intensity of symptoms elicited by the CMST after 24 weeks of CSII therapy compared with the baseline visit.
Figure 4.
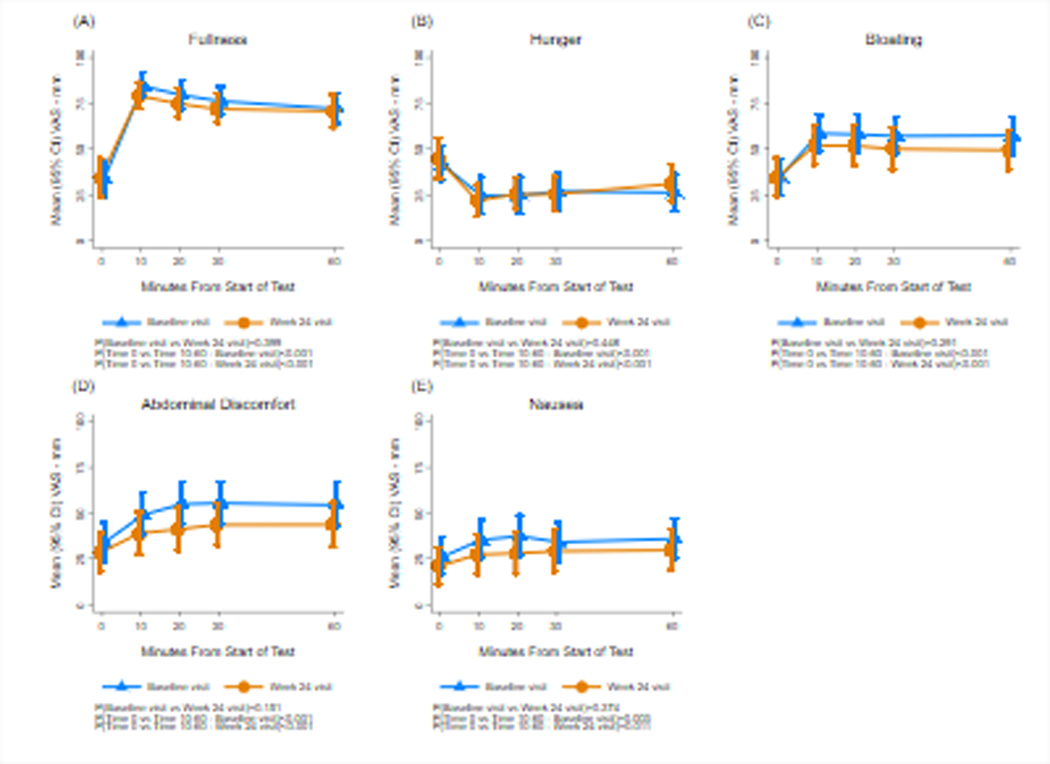
Fullness, hunger, bloating, abdominal discomfort, and nausea scores are shown before and after the caloric meal satiety test (CMST) at baseline and 24 weeks. The X axis shows time in minutes. Time 0 indicates the 10 minutes before the test meal and 10, 20, 30, and 60 minutes indicates time after ingestion. The Y axis shows the symptom intensity on the visual analog scale (VAS) in millimeters (mm). Fullness increased significantly after the CMST and hunger decreased significantly, and symptoms of bloating, abdominal discomfort, and nausea all increased significantly at baseline and the Week 24 visits. Compared with baseline visits, there were no significant changes in symptoms at Week 24.
Figure 5 shows GMA in the bradygastria, normogastria, tachygastria, and duodenal frequencies before and after the CMST. The percentage distribution of GMA decreased significantly in the bradygastria range and increased significantly in the normal 3 cpm range at both visits. The percentage distribution of GMA in the tachygastria range increased significantly (p=0.002) at 24 weeks only. There were no significant differences in the GMA response to the CMST when the Week 24 visit was compared with baseline.
Figure 5.
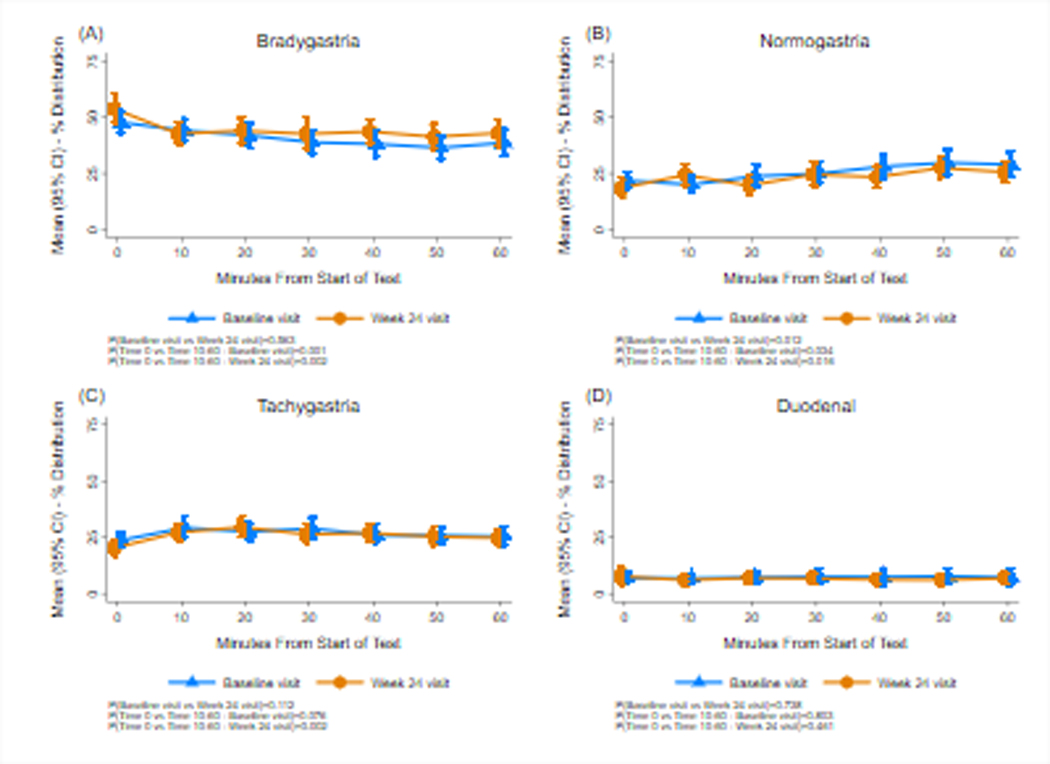
Gastric myoelectrical activity (GMA) before and after the caloric meal satiety test (CMST) are shown at baseline and at 24 weeks. Bradygastria (1.0–2.5 cpm), normogastria (2.5–3.5 cpm), tachygastria (3.5–10 cpm), and duodenal-respiration (10–15 cpm) frequency ranges are shown. The X axis and Y axis are similar to Figure 3. After ingestion of the caloric meal, normogastria significantly increased and bradygastria significantly decreased at baseline and 24 weeks. At 24 weeks tachygastria increased significantly after the CMST. There were no differences in GMA at Week 24 compared with baseline.
Comparison of Symptoms and GMA after Water Load and Caloric Meal Satiety Tests
At baseline, nausea intensity was increased similarly after ingestion of the CMST and WLST (P=0.75). CMST evoked more fullness, less hunger, and more bloating and abdominal discomfort compared with the WL test (Ps<0.01). After the CMST, bradygastria decreased and tachygastria increased significantly more compared with WLST (Ps<0.03). The normal 3 cpm GMA responses to WLST and CMST were similar (P=0.41).
At Week 24, fullness, bloating, abdominal discomfort, and nausea were significantly greater after CMST and hunger significantly less compared with WLST (Ps<0.01). Bradygastria was decreased and tachygastria increased after CMST compared with WLST at Week 24 (Ps<0.001). Normal 3 cpm GMA responses were similar after WLST and CMST (P=0.29).
Clinical EGG Diagnoses after Water Load Satiety Test at Baseline and 24 Weeks
Thirty-one of the 45 patients had the EGG and WLST at baseline and Week 24 (Table 2). The overall clinical EGG diagnoses were as follows: At baseline the EGG was normal in 14 subjects (45%) and abnormal in 17 subjects (6 had tachygastria, 4 had bradygastria, 3 had mixed dysrhythmias, 4 had duodenal-respiration pattern). At 24 weeks 10 subjects (32%) had normal 3 cpm GMA and 20 (68%) had dysrhythmias (10 had tachygastria, 3 had bradygastria, 6 had mixed dysrhythmias, 1 had the duodenal-respiration pattern). The agreement in EGG diagnoses between baseline and 24-week visits was 55%. Five of these 31 subjects (16%) had normal 3 cpm GMA at both baseline and at 24 weeks. Figure 6 shows an example of normal 3 cpm GMA before and after the WLST and consistent 3 cpm peaks in the running spectral analysis of the GMA in a patient with diabetic gastroparesis. Figure 7 shows gastric dysrhythmias before and after the WLST and peaks in the tachygastria range in the running spectral analysis in another patient.
Table 2.
Electrogastrogram (EGG) Diagnoses in Response to Water Load Satiety Test in Patients with Diabetic Gastroparesis at Baseline and after 24 Weeks of Insulin Therapy with Continuous Glucose Monitoring
| Baseline | Week 24 | ||
|---|---|---|---|
| Normal | 14 (45) | Normal | 10 (32 |
| Tachygastria | 6 (19) | Tachygastria | 11 (36) |
| Bradygastria | 4 (13) | Bradygastria | 3 (10) |
| Mixed Dysrhythmias | 3 (10) | Mixed Dysrhythmias | 6 (19) |
| Duodenal-Respiration | 4 (13) | Duodenal-Respiration | 1 (3) |
Figure 6A.
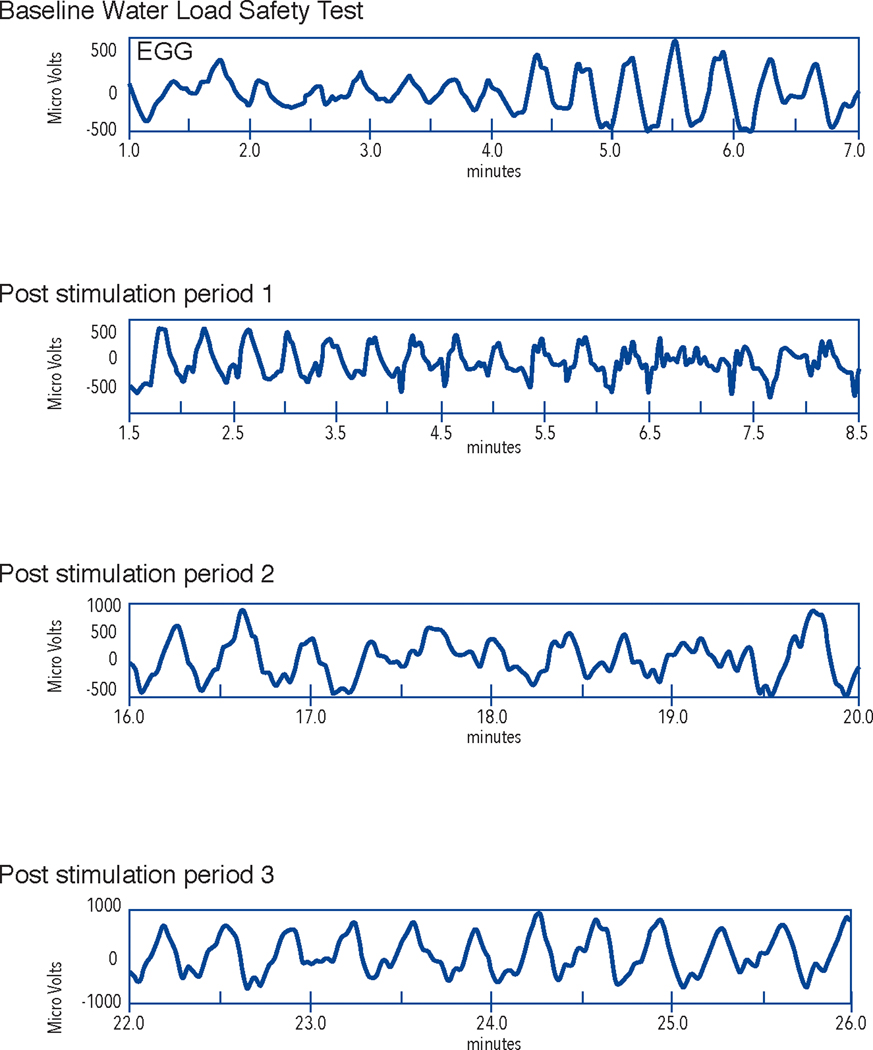
GMA rhythm strips from the electrogastrogram recording from a subject with diabetic gastroparesis. Note the 3 cycle per minute (cpm) waves in GMA at baseline (before water load) and in the rhythm strips from Post stimulation period 1, 2, and 3 which are from the 10, 20, and 30-minute periods after the WLST. GMA rhythm strips from baseline (before WLST) and from 10, 20, and 30 minutes after the WLST (labeled Post stimulation period 1, 2, and 3, respectively) are shown. The X axis shows time in minutes and the Y axis shows microvolts. This is a normal 3 cpm GMA response to the WLST and reflects normal numbers of ICCs in this patient with diabetic GP.
Figure 7A.
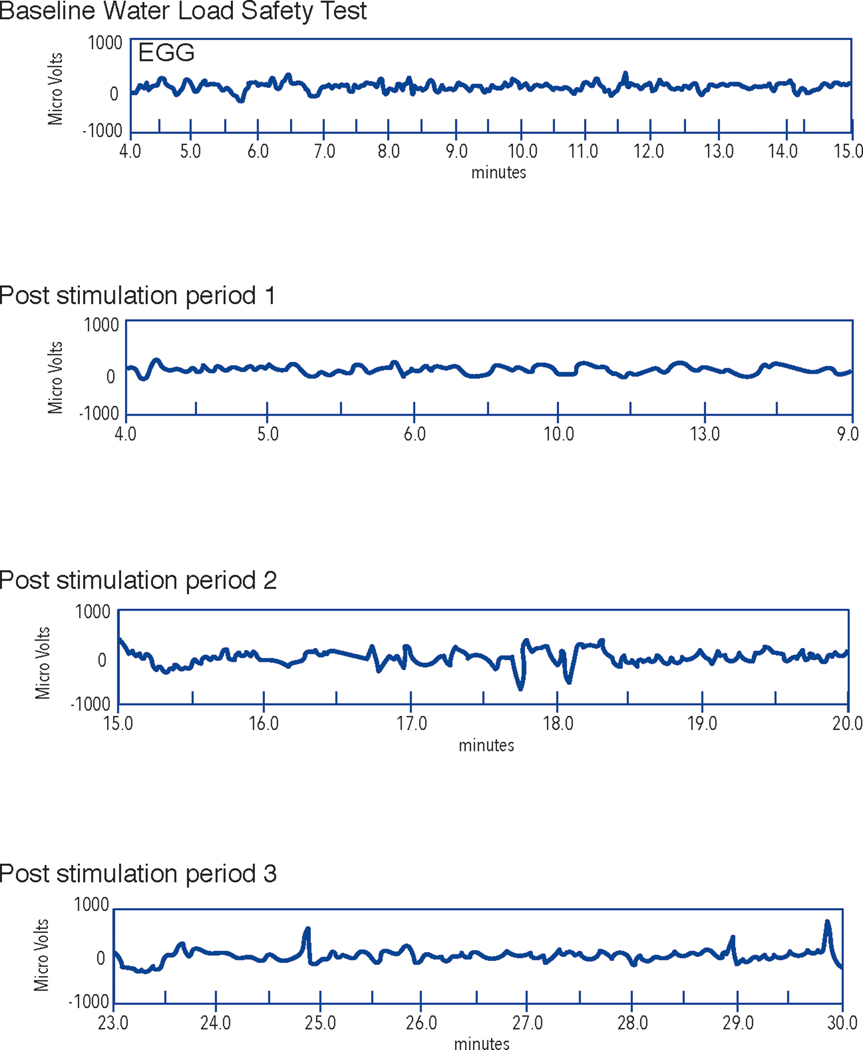
GMA rhythm strips from an electrogastrogram recording from a subject with diabetic gastroparesis. In contrast to Figure 6A, note the lack of 3 cycle per minute (cpm) GMA at baseline and irregular GMA after the WLST in the post stimulation time periods. GMA rhythm strips from baseline (before WLST) and from 10, 20, and 30 minutes after the WLST (labeled Post stimulation period 1, 2, and 3, respectively). The upper channel is the EGG recording and the lower channel shows the respiration recording. The X axis shows time in minutes and the Y axis shows microvolts.
Discussion
Symptoms and physiological measures immediately after meals have been infrequently studied in patient with diabetic gastroparesis. On the other hand, satiety tests with barostat recordings have been studied frequently in patients with functional dyspepsia who ingest low volumes of the meals in association with decreased accommodation and/or gastric hypersensitivity.4–6 In the current study, almost 30% of our diabetic subjects ingested less than 236 ml, which is less than 2 S.D. below the mean in healthy controls.5,14 Karamanolis et al found symptoms evoked with a 200 ml test meal correlated better with gastroparesis symptoms than the rate of gastric emptying or gastric accommodation in patients with idiopathic gastroparesis.2 Gastroparesis patients who consumed small volumes (< 250 ml) during the WLST had increased GCSI scores, especially nausea, and more severe delays in gastric emptying compared with patients who consumed normal volumes (˃ 557 ml).8 Nausea, bloating, and abdominal discomfort were reported within minutes after the caloric meal or water load were ingested. Possible mechanisms include sensitivity to gastric distention, abnormalities in gastric accommodation, or both. However, these possible abnormalities were not investigated in this study.
The normal 3 cpm GMA is associated with normal numbers of gastric ICCs, the pacemaker cells that generate 3 cpm slow waves and coordinate gastric peristalsis during normal gastric emptying.19,20 Studies have suggested that the majority of diabetic patients with gastroparesis have severe depletion of ICCs in the corpus and antrum (0–3 ICCs/hpf) and gastric dysrhythmias ranging from tachygastria to bradygastria.19, 20 Distention of the antrum with a balloon was associated with more upper GI symptoms and more gastric dysrhythmias compared with distention of the fundus in healthy subjects.15 In our study, gastric dysrhythmias were evoked after ingestion of volumes of water in most patients and included tachygastria, bradygastria, and mixed gastric dysrhythmias. Symptoms and changes in 3 cpm GMA increased after the CMST to a greater extent than with the WLST. Thus, distention of the antrum by liquid test meals in our patients with diabetic gastroparesis was associated with changes in GMA and acute postprandial symptoms. Gastric dysrhythmias are also elicited when glucose levels are over 220 mg/dl in normal subjects21 and are more prevalent in diabetic patients during hyperglycemia.22 Glucose levels ˃ 220 mg/dl but less than 270 mg/dl on the day of the satiety test meals may have affected the GMA at baseline and follow-up visits.
Sixteen percent of our patients with diabetic gastroparesis had normal 3 cpm GMA in response to WLST at both baseline and at Week 24. In contrast to gastric dysrhythmias, the presence of normal 3 cpm GMA suggests normal function of the gastric ICCs, the pacemaker cells of the stomach..19,20 Approximately 20% of patients with diabetic gastroparesis had normal numbers of ICCs by immunohistochemical stains from full-thickness biopsies of the stomach corpus, although electron microscopy showed poor ICC-nerve and ICC-smooth muscle contacts in these patients.23 Gastroparesis patients with normal 3 cpm GMA may have a fixed or functional obstructive gastroparesis subtype24,25 secondary to pyloric dysfunction which may contribute to symptoms and the delay in gastric emptying.
We hypothesized that improvement in HbA1c after intense insulin therapy would improve symptoms elicited by the satiety tests and GMA. However, after 24 weeks of CSII with CGM, the symptoms evoked by the caloric and noncaloric satiety test meals were similar to baseline. Our previous study showed that intensive treatment with CSII with CGM was associated with a 23% improvement in GCSI and a 1.1% decrease in HbA1c (from 9.4 ± 1.4% to 8.3 ± 1.3%), supporting the importance of efforts to improve glycemic control.9 However, gastroparesis symptoms reported using GCSI reflect a two-week recall of symptoms and thus reflect an average of symptoms related to daily meals and activities over time.9 In the current study, subjects ingested the liquid test meals until they were completely full, an acute challenge of gastric neuromuscular function that also allowed collection of meal-induced symptoms in real time with concomitant GMA recordings. Under these test meal conditions, the intense insulin therapy with CGM did not affect symptoms or physiological measures during the WLST or CMST.
There are several potential reasons for the lack of improvement in symptoms and physiological measures in response to the satiety meal tests: 1) HbA1c decreased 1.1% from 9.4 to 8.3% during the six-month treatment period, but hypo- and hyperglycemia events still occurred over 40% of the time as recorded with CGM.9 Thus, the overall glycemic control remained abnormal at 8.3%. The 1.1% improvement in HbA1c may not have been sufficient to positively affect gastric neuromuscular function and symptoms in these patients with diabetic GP; 2) our patients had known diabetes for an average of 21 years. The duration of treatment with CSII with CGM was six months, but a longer treatment and better control of glucose may be required to improve poor gastric accommodation, gastric dysrhythmias, and symptoms evoked by the satiety tests in these patients. Improvement in HbA1c was not associated with improved symptoms or rates of gastric emptying in other studies16,17; 3) factors other than glycemic control may be important in meal-induced symptoms and GMA abnormalities in diabetic gastroparesis. Hyperglycemia alone was not enough to cause gastroparesis in diabetic mice. In addition to hyperglycemia, a switch from M2 macrophages to M1 macrophages in the circular muscle layer and in the myenteric plexus of the stomach was required to develop gastroparesis.23 In humans with DGP, the switch from M2 to M1 macrophages in the gastric antrum is associated with decreased numbers of ICCs and gastric dysrhythmias.26 Thus, factors like macrophage switching and decreased ICC numbers, in addition to hyperglycemia, may be associated with the GMA dysfunctions in diabetic GP; and 4) sixteen percent of the GP subjects had normal 3 cpm GMA. In these patients pyloric dysfunction is a key factor in GP; and, pyloric therapies such as balloon dilation or injection of botulinum toxin A improve symptoms.25 Therefore, diabetic patients with 3 cpm GMA in our cohort may not respond to insulin and may have confounded the CSII with CGM therapy results.
The strengths of this study are that it is 1) a multicenter study of well characterized patients with diabetic gastroparesis with poorly controlled glycemia managed with CSII and CGM and 2) standard questionnaires, CSII with CGM treatment, and noncaloric and caloric test meals with standard tests of GMA were obtained. Weaknesses of the study include: 1) lack of a disease control group in regards to insulin therapy, dietary counseling, and concomitant medications during the 24 weeks of intensive CSII with CGM treatment, 2) lack of a healthy control group for symptoms and GMA in response to the CMST, 3) unknown numbers of subjects with glucose levels between 220 mg/dl and 270 mg/dl during the CMST and WLST, and 4) analyses of combined type 1 and type 2 diabetes mellitus subjects because of the small number of subjects in each group limits generalization of results for either group.
In summary, liquid caloric and noncaloric test meals immediately evoked significant increases insymptoms associated with gastroparesis. Almost 30% of patients ingested abnormally low volumes, suggesting poor gastric accommodation in a subset of patients with diabetic gastroparesis. Symptoms and 3 cpm GMA increased after the CMST but not the WLST, indicating caloric meals are more potent stimulants of symptoms and 3 cpm GMA. More aggressive or longer duration insulin therapy may be needed to affect symptoms and GMA in responses to provocative satiety test meals in patients with diabetic gastroparesis.
Figure 6B.
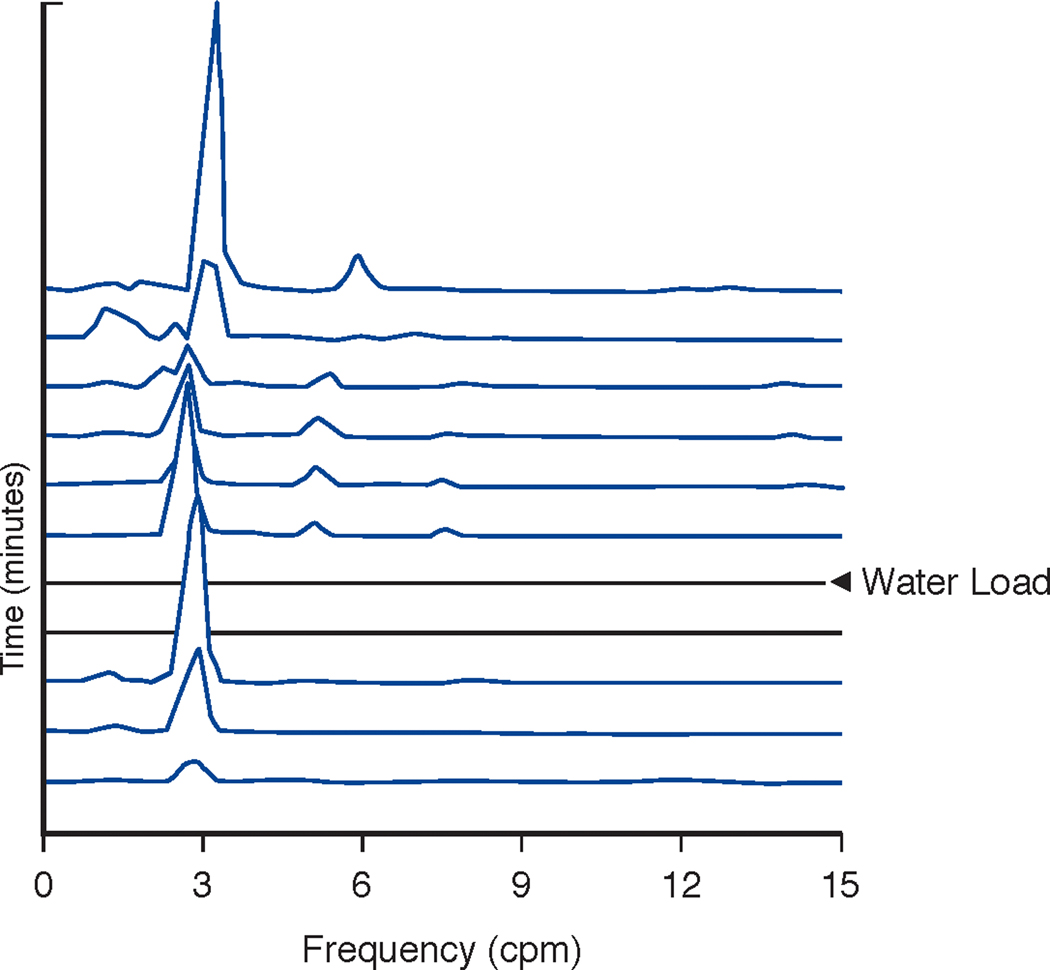
Running spectral analysis of the GMA shown in 6A. Note the clear peaks at 3 cpm before and after ingestion of the water load. This is a very regular 3 cpm pattern in a patient with GP and suggests possible functional gastric outlet obstruction. The X axis shows frequency from 1–15 cpm. The Y axis shows time with each line representing 4 minutes of GMA with 75% overlap. The Z axis shows peaks that reflect the frequencies according to amplitude or power of GMA in the EGG signal. The two flat lines indicate the time of WLST in the EGG recording of GMA. The normal GMA range is 2.5–3.5 cpm.
Figure 7B.
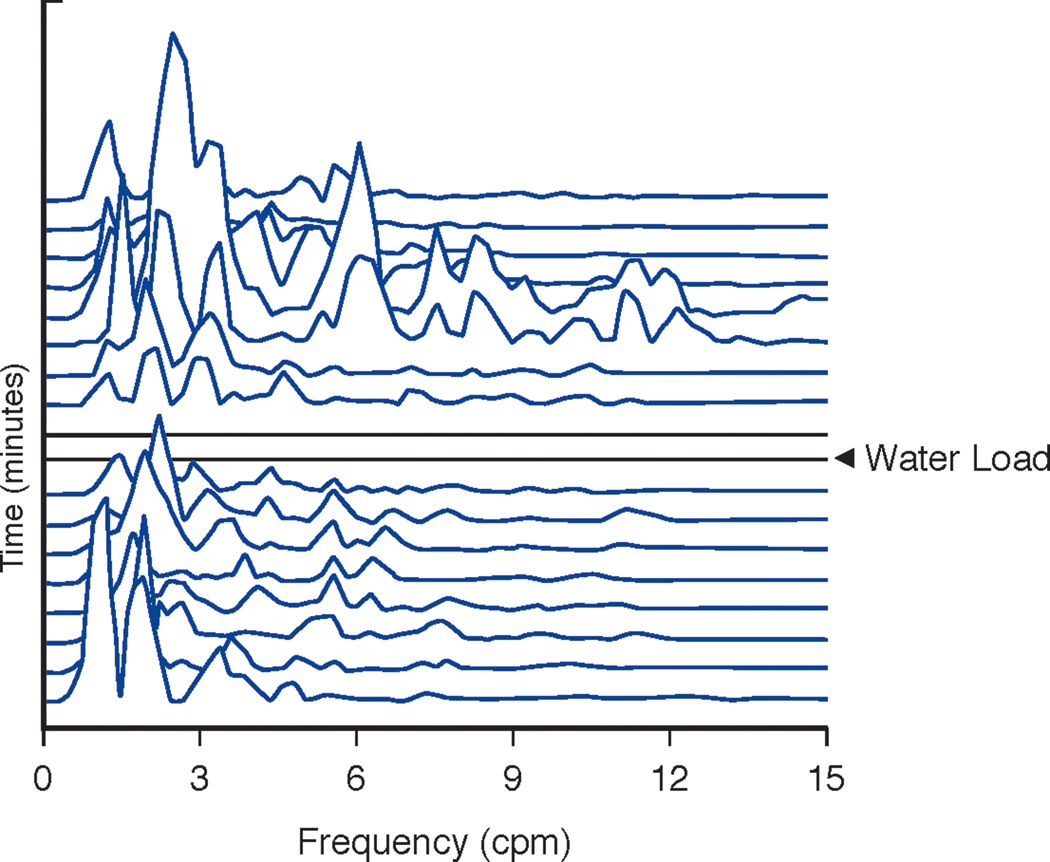
Running spectral analysis of the GMA shown in 7A before and after the WLST. In contrast to Figure 6B, note the multiple peaks in the gastric dysrhythmia frequencies (tachygastria 3.5–10 cpm; bradygastria 1–2.5 cpm) and the lack of 3 cpm peaks before and after the WLST. The X axis shows frequency from 1–15 cpm. The Y axis shows time with each line representing 4 minutes of GMA with 75% overlap. The Z axis shows peaks that reflect frequencies according to amplitude or power of the GMA in the EGG signal. The two flat lines indicate the time of ingestion of the water load.
Table 2B.
Agreement* in EGG Diagnoses between Baseline and Week 24
| Week 24 | |||
|---|---|---|---|
| Baseline | Normal | Abnormal | Total |
| Normal | 5 | 9 | 14 |
| Abnormal | 5 | 12 | 17 |
| Total | 10 | 21 | 31 |
55% with Kappa value 0.06
Acknowledgements
The authors wish to thank Ms. Stuart Pickett for her excellent secretarial assistance.
Source of Funding: The Gastroparesis Consortium (GpCRC) is supported by the National Institute of Diabetes and Digestive and Kidney Diseases (NIDDK) (grants U01DK112193, U01DK112194, U01DK073983, U01DK073975, U01DK074035, U01DK074007, U01DK073985, U01DK073974, U01DK074008) and the National Center for Advancing Translational Sciences (NCATS) (grants UL1TR000424, UL1TR000093, UL1TR000433, UL1TR000135).
Footnotes
Competing of interest: Dr. Koch is a shareholder in 3CPM Company, Inc.; other authors: no competing interests to disclose
ClinicalTrials.gov Identifier: NCT01696747
Contributor Information
Kenneth L. Koch, Section on Gastroenterology, Wake Forest University, Winston-Salem, NC
William L. Hasler, Division of Gastroenterology, University of Michigan, Ann Arbor, MI.
Mark Van Natta, Johns Hopkins University Bloomberg School of Public Health, Baltimore, MD.
Jorge Calles-Escandon, Endocrinology Section, MetroHealth Medical Center, Cleveland, OH.
Madhusudan Grover, May Clinic, Rochester, MN.
Pankaj J. Pasricha, Center for Neurogastroenterology, Johns Hopkins Bayview Medical Center, Baltimore, MD
William J. Snape, California Pacific Medical Center, San Francisco, CA
Henry P. Parkman, Section of Gastroenterology, Temple University, Philadelphia, PA.
Thomas L. Abell, Digestive and Liver Health, University of Louisville, Louisville, KY.
Richard W. McCallum, Division of Gastroenterology, Texas Tech University, El Paso, TX.
Linda A. Nguyen, Division of Gastroenterology, Stanford University, Palo Alto, CA.
Irene Sarosiek, Division of Gastroenterology, Texas Tech University, El Paso, TX.
Gianrico Farrugia, Division of Gastroenterology and Hepatology, Mayo Clinic, Rochester, MN.
James Tonascia, Johns Hopkins University Bloomberg School of Public Health, Baltimore, MD.
Linda Lee, Johns Hopkins University Bloomberg School of Public Health, Baltimore, MD.
Laura Miriel, Johns Hopkins University Bloomberg School of Public Health, Baltimore, MD.
Frank Hamilton, National Institute of Diabetes and Digestive and Kidney Diseases, Bethesda, MD.
References
- 1.Koch KL, Hasler WL, Yates KP, et al. Baseline features and differences in 48 weeks clinical outcomes in patients with gastroparesis and type 1 vs type 2 diabetes. Neurogastroenterol Mot 2016;28:1001–15. [DOI] [PMC free article] [PubMed] [Google Scholar]
- 2.Karamanolis G, Caenepeel P, Arts J, Tack J. Determinants of symptom pattern in idiopathic severely delayed gastric emptying: gastric emptying rate or proximal stomach dysfunction? Gut 2007;56:29–36. [DOI] [PMC free article] [PubMed] [Google Scholar]
- 3.Pasricha PJ, Colvin R, Yates K, et al. Characteristics of patients with chronic unexplained nausea and vomiting and normal gastric emptying. Clin Gastroenterol Hepatol 2011;9:567–76. [DOI] [PMC free article] [PubMed] [Google Scholar]
- 4.Tack J, Caenepeel P, Fischler B, Piessevaux H, Janssens J. Symptoms associated with hypersensitivity to gastric distention in functional dyspepsia. Gastroenterol 2001;121:526–35. [DOI] [PubMed] [Google Scholar]
- 5.Kindt S, Coulie B, Wajs E, Janssens J, Tack J. Reproducibility and symptomatic predictors of a slow nutrient drink test in health and in functional dyspepsia. Neurogastroenterol Motil 2008;20:320–9. [DOI] [PubMed] [Google Scholar]
- 6.Kumar A, Attaluri A, Hashmi S, Schulze KS, Rao SS. Visceral hypersensitivity and impaired accommodation in refractory diabetic gastroparesis. Gastroenterol Motil 2008;20:635–42. [DOI] [PubMed] [Google Scholar]
- 7.Koch KL, Hong SP, Xu L. Reproducibility of gastric myoelectrical activity and the water load test in patients with dysmotility-like dyspepsia symptoms and in control subjects. J Clin Gastroenterol 2000;31:125–9. [DOI] [PubMed] [Google Scholar]
- 8.Parkman HP, Hallinan EK, Hasler WL, et al. Early satiety and postprandial fullness in gastroparesis correlate with gastroparesis severity, gastric emptying, and water load testing. Neurogastroenterol Motil 2017;29 Epub 2016 Oct 25. [DOI] [PMC free article] [PubMed] [Google Scholar]
- 9.Calles-Escandon J, Koch KL, Hasler WL, et al. Glucose sensor-augmented subcutaneous insulin infusion in patients with diabetic gastroparesis: an open-label prospective study. PLoS One 2018;13:e0194759. [DOI] [PMC free article] [PubMed] [Google Scholar]
- 10.Tougas G, Eaker EY, Abell TL, et al. Assessment of gastric emptying using a low fat meal: establishment of international control values. Am J Gastroenterol 2000;95:1456–62. [DOI] [PubMed] [Google Scholar]
- 11.Koch KL. Electrogastrography for Evaluation of Patients with Suspected Gastroparesis In: Gastroparesis: Pathophysiology, Presentation, Diagnosis and Treatment. Eds. Parkman H and McCallum R. Springer, New York, NY, 2011, pp 153–161. [Google Scholar]
- 12.SAS version 9.4, SAS Institute Inc., Cary, NC. [Google Scholar]
- 13.StataCorp. 2017. Stata Statistical Software: Release 15. College Station, TX: StataCorp LLC. [Google Scholar]
- 14.Jones MP, Hoffman S, Shah D, Patek K, Ebert CC. The water load test: observations from healthy controls and patients with functional dyspepsia. Am J Physiol Gastrointest Liver Physiol 2003;284(6):G896–904. [DOI] [PubMed] [Google Scholar]
- 15.Ladabaum U, Koshy SS, Woods ML, Hooper FG, OwYang C, Hasler WL. Differential symptomatic and electrogastrography effects of distal and proximal gastric stimulation. Am J Physiol 1999;275:G418–G424. [DOI] [PubMed] [Google Scholar]
- 16.Reddy S, Ramsubeik K, Vega KJ, Federico J, Palacio C. Do HbA1c levels correlate with delayed gastric emptying in diabetic patients? J Neurogastroenterol Motil 2010;16:414–7. [DOI] [PMC free article] [PubMed] [Google Scholar]
- 17.Lydon A, Murray C, Cooke T, Duggan PF, O’Halloran D, Shorten GD. Evaluation of standard haemodynamic tests of autonomic function and HbA1c as predictors of delayed gastric emptying in patients with type 1 diabetes mellitus. Eur J Anaesthesiol 2000;17:99–104. [DOI] [PubMed] [Google Scholar]
- 18.Parkman HP, Yates KP, McCallum RW, et al. Gastric emptying changes over time in gastroparesis: comparison of initial and 48 week follow up gastric emptying tests in the Gastroparesis Registry of the Gastroparesis Consortium. Gastroenterol 2018;154:S-39. [Google Scholar]
- 19.Grover M, Bernard CE, Pasricha PJ, et al. Clinical-histological associations in gastroparesis: Results from the Gastroparesis Clinical Research Consortium. Neurogastroenterol Motil 2012;24:5319. [DOI] [PMC free article] [PubMed] [Google Scholar]
- 20.O’Grady G, Angeli T, Du P, et al. Abnormal initiation and conduction of slow-wave activity in gastroparesis, defined by high-resolution electrical mapping. Gastroenterol 2012;143:589–98. [DOI] [PMC free article] [PubMed] [Google Scholar]
- 21.Coleski R, Hasler WL. Coupling and propagation of normal and dysrhythmic gastric slow waves during acute hyperglycemia in healthy humans. Neurogastroenterol Motil 2009;21:492–9. [DOI] [PubMed] [Google Scholar]
- 22.Jebbink RJ, Samsom M, Bruijs PP, Bravenboer B, Akkermans LM, Vangerge-Henegouwen GP, Smout AJ. Hyperglycemia induces abnormalities of gastric myoelectrical activity in patients with type 1 diabetes mellitus. Gastroenterol 1994;107:1390–7. [DOI] [PubMed] [Google Scholar]
- 23.Faussone-Pellegrini MS, Grover M, Pasricha PJ, et al. Ultrastructural differences between diabetic and idiopathic gastroparesis. J Cell Mol Med 2012;16:1573–81. [DOI] [PMC free article] [PubMed] [Google Scholar]
- 24.Brzana RJ, Koch KL, Bingaman S. Gastric myoelectrical activity in patients with gastric outlet obstruction and idiopathic gastroparesis. Am J Gastroenterol 1998;93:1803–9. [DOI] [PubMed] [Google Scholar]
- 25.Wellington J, Scott B, Kundu S, Stuart P, Koch KL. Effect of endoscopic pyloric therapies for patients with nausea and vomiting and functional obstructive gastroparesis. Auton Neurosci 2017;202:56–61. [DOI] [PubMed] [Google Scholar]
- 26.Cipriani G, Gibbons SJ, Miller KE, et al. Change in populations of macrophages promotes development of delayed gastric emptying in mice. Gastroenterol 2018;154:2122–2136. [DOI] [PMC free article] [PubMed] [Google Scholar]


