Abstract
The A3 adenosine receptor (A3AR) is a G protein-coupled receptor that is involved in a wide variety of physiological and pathological processes, such as cancer. However, the use of compounds pharmacologically targeting this receptor remains limited in clinical practice, despite extensive efforts for compound synthesis. Moreover, the possible occurrence of biased agonism further complicates the interpretation of the functional characteristics of compounds. Hence the need for simple assays, which are comparable in terms of the used cell lines and read-out technique. We previously established a stable β-arrestin 2 (βarr2) bioassay, employing a simple, luminescent read-out via functional complementation of a split nanoluciferase enzyme. Here, we developed a complementary, new bioassay in which coupling of an engineered miniGαi protein to activated A3AR is monitored using a similar approach. Application of both bioassays for the concurrent determination of the potencies and efficacies of a set of 19 N6-substituted adenosine analogues not only allowed for the characterization of structure-activity relationships, but also for the quantification of biased agonism. Although a broad distribution in potency and efficacy values was obtained within the test panel, no significant bias was observed toward either the βarr2 or miniGαi pathway.
Keywords: G protein-coupled receptor, A3 adenosine receptor, β-Arrestin2, Structure-activity relationship, Biased signaling
1. Introduction
The A3 adenosine receptor (A3AR), together with A1, A2A and A2B, belongs to the class of purinergic G protein-coupled receptors (GPCRs). Adenosine receptors are potently activated by endogenous adenosine, which is a locally released modulator that is involved in a wide variety of both physiological and pathological processes [1]. The A3AR is present in the heart, brain (albeit at relatively low levels), neurons, lung and colon, and is overexpressed in cancer and inflammatory cells. It plays important physiological roles in chronic pain reduction, neuro-protection and several cardiovascular processes, and has been associated with neurological, cardiovascular, inflammatory and auto-immune diseases and cancer. A3AR agonists are in clinical trials for rheumatoid arthritis, plaque psoriasis, hepatocellular carcinoma, nonalcoholic fatty liver disease and nonalcoholic steatohepatitis [1–3].
GPCRs are coupled to a multitude of signaling pathways to induce distinct downstream effects. On the one hand there is the activation of G proteins: upon GPCR activation, a trimeric G protein is recruited to the receptor. This is followed by exchanging guanosine-5′-diphosphate (GDP) for guanosine-5′-triphosphate (GTP), and the dissociation of the Gα and the Gβγ dimeric subunits, each of which engages different secondary messengers. The A3AR is coupled to Gαi, leading to reduced adenylate cyclase activity and inhibition of 3′,5′-cyclic adenosine monophosphate (cAMP) formation. On the other hand, β-arrestin2 (βarr2) is also recruited to an activated receptor. βarr2 has functions in internalization of the receptor, desensitization of the receptor response and, furthermore, has its own signaling properties [1,2,4–6].
Functional selectivity or biased agonism at GPCRs has been described as the preferential coupling of the receptor to one pathway over the others, upon interaction with distinct (orthosteric or allosteric) ligands, stabilizing distinct receptor conformations [6,7]. This phenomenon has been observed for a broad variety of receptors. When the desired and the possible adverse effects caused by the coupling of a compound to a GPCR can be attributed to divergent pathways, the pathway responsible for the envisaged effect can in principle be targeted with synthetic compounds that display biased agonism, thereby reducing the (risk of) adverse events [6,7]. Applications have been suggested for compounds preferentially targeting the G protein (at the μ opioid receptor, for pain relief), and compounds showing a preference towards βarr (at the dopamine D2 receptor in the treatment of schizophrenia, and at the angiotensin II receptor 1 AT1R in cardiovascular diseases) [4,8]. For the A3AR, Baltos et al. observed divergent ranking orders of potency for a series of compounds, depending on the intracellular signaling pathway that was monitored (relative to the reference agonist IB-MECA). This finding illustrates the importance of monitoring more than one pathway in the assessment of newly synthesized compounds for the A3AR [4,9].
However, the implementation of biased ligands in clinical practice is still hampered by the cumbersome characterization of biased agonism. The recognition of true ligand bias, eliminating observational biases that are caused by the system itself, is challenging due to the use of a wide variety of functional assays, of which the results are often difficult to compare. Ideally, biased agonism is assessed by using assays that employ a common detection technique to measure outcomes with equivalent amplification, preferably in real-time, and in an appropriate cell system. The assays should be simple, sensitive and high-throughput amenable, and the results reproducible [8,10]. The present study aimed at functionally characterizing a carefully chosen test set of A3AR agonists, in terms of recruitment of both βarr2 and miniGαi (truncated G protein subunit for measuring G protein activation) [11–14]. Two parallel functional assays were set up in order to assess the recruitment of either βarr2 or miniGαi to the same human (h) A3AR construct. In both cases, the resulting functional complementation of a split-nanoluciferase protein allowed a real-time read-out via bioluminescence, within the same cellular background. As both assays are situated upstream of the signaling cascade, comparison of the results obtained by both assays should allow a good estimate of the presence or absence of ligand bias in a compound set.
2. Materials and methods
2.1. Chemicals and reagents
The nineteen test agonists, N6-modified adenosine analogues, were synthesized and initially characterized pharmacologically at the hA3AR overexpressed in CHO cells, as previously reported [15–17]. Reference agonists 2-Cl-IB-MECA (2-chloro-N6-(3-iodobenzyl)-5′-N-methylcar-boxamidoadenosine) and NECA (5′-N-ethylcarboxamidoadenosine) were purchased from Tocris Bioscience (Biotechne, Abingdon, UK). Poly-D-lysine hydrobromide and DOTAP Liposomal Transfection Reagent were purchased from Sigma-Aldrich (Steinheim, Germany). FuGene® HD and Nano-Glo Live Cell Reagent were provided by Promega (Madison, WI, USA). Dulbecco’s Modified Eagle’s Medium (DMEM) supplemented with GlutaMAX®, Hank’s Balanced Salt Solution (HBSS), Fetal Bovine Serum (FBS), Phosphate Buffered Saline (PBS), pertussis toxin (PTX), penicillin/streptomycin (10,000 IU/mL and 10,000 μg/mL) and amphotericin B (250 μg/mL) were bought from Thermo Fisher Scientific (Pittsburg, PA, USA). The anti-dNGFR (truncated nerve growth factor receptor) antibody was purchased from Chromaprobe (Maryland Heights, MO, USA). Human Embryonic Kidney (HEK) 293T cells (passage 20) were a kind gift of Prof. O. De Wever of the Laboratory of Experimental Cancer Research (Ghent University Hospital, Belgium). The cell lines CB1-NanoBiT®-βarr2 and CB1-NanoBiT®-miniGαi were described before [14,18,19].
2.2. G protein bioassay: miniGαi recruitment to A3AR
2.2.1. Determination of the optimal configuration of GPCR with miniGαi (transient transfection)
For the assessment of the potencies and efficacies of the newly synthesized compounds, the NanoBiT® (Nanoluciferase Binary Technology) system (Promega) was used [20]. This technique allows for the real-time monitoring of protein-protein interactions, via functional complementation of two parts (Large BiT, LgBiT, and Small BiT, SmBiT) of a split nanoluciferase. For the assessment of G protein activation of the A3AR, an approach was followed that was similar to that used previously to establish a βarr2 bioassay for A3AR activation (cfr. Section 2.3) [21,22]. Four miniGαi constructs were generated by fusing miniGαi to LgBiT or SmBiT at its C- and N-terminus [14]. In order to determine the optimal combination of fusion constructs of A3AR with miniGαi, all combinations were evaluated by transient transfection in HEK 293T cells. On the first day, routinely cultured HEK 293T cells were seeded in a 6-well plate at a density of 5×10⁵ cells per well. The next day, the cells were transfected with the 2 constructs of choice, using FuGene® following the manufacturer’s protocol (1.65 μg of each construct at a 1:3 DNA: FuGene® ratio). Twenty-four hours post transfection, the cells were reseeded into a poly-D-lysine coated 96-well plate, at a density of 5×10⁴ cells per well. The following day, the cells were washed twice with HBSS, and 90 μL of HBSS was added to each well, followed by 25 μL of the Nano-Glo live cell reagent (prepared by diluting the substrate 1/20 using the Nano-Glo LCS dilution buffer). Next, the plate was placed in a Tristar2 LB 942 multimode microplate reader (Berthold Technologies GmbH & Co, Germany) to equilibrate. When the signal stabilized, 20 μL of a 6.75 times concentrated agonist solution (in this case the A3AR selective agonist 2-Cl-IB-MECA) was added, yielding a final in-well concentration of 5 μM, followed by a 90 min read-out.
2.2.2. Generation of the stable cell lines
Following selection of the optimal configuration (A3AR-LgBiT and SmBiT-miniGαi) a stable cell line was generated via viral transduction. The advantages of a stable cell system are a reduction in the duration of the assays, and in the variability between assays. The generation of the retroviral vectors for the A3AR-LgBiT (in pLZRS-IRES-EGFP) and the SmBiT-miniGαi (in pLZRS-pBMN-link-I-dNGFR) constructs, and virus generation using a PhoenixA packaging cell line were described previously [14,21]. HEK 293T cells were transduced as described previously [14,21]. Briefly, equal quantities of the viral supernatants were used to transduce HEK 293T cells using DOTAP liposomal transfection reagent. After the incubation step, the cells were centrifuged for 90 min (950 g, 32 °C) to increase the transduction efficiency. The transduction efficiency could be monitored via the markers EGFP (enhanced green fluorescent protein, co-expressed with A3AR-LgBiT) and dNGFR (truncated nerve growth factor receptor, co-expressed with SmBiT-miniGαi). The latter was monitored via tagging with a fluorescently labeled antibody. These co-expressed markers were also used to select the cells with the highest expression of the two constructs through flow cytometry-assisted cell sorting (FACS) using a BD FACSAria III cell sorter (BD Biosciences, Erembodegem, Belgium), equipped with 405, 488, 561, and 640 nm lasers.
2.3. βarr2 recruitment bioassay: stable expression system
The development of the HEK 293T cell line stably expressing hA3AR-LgBiT (co-expressed with EGFP) and SmBiT-βarr2 (co-expressed with dNGFR), hA3AR-NanoBiT®-βarr2 HEK 293T, has been described by Storme et al. [21].
2.4. Cell culture and monitoring of the expression levels of the stably transduced cell lines
All cells were routinely maintained at 37 °C and 5% CO2 in a humidified atmosphere, in DMEM (GlutaMAX®), supplemented with 100 IU/mL of penicillin, 0.25 μg/mL amphotericin B, 100 μg/mL streptomycin and 10% heat-inactivated FBS.
In the stable cell lines, the stability of the expression levels of the transduced constructs was monitored via flow cytometric analysis (CytoFLEX, Beckman Coulter, Brea, CA, USA) of the co-expression markers EGFP and dNGFR.
2.5. A3AR activation assay using the stable cell systems
The protocol for the stable cell systems is similar to the method used for transiently transfected cells and was carried out as reported [21]. Briefly, cells were plated on poly-D-lysine coated 96-well plates at 5×10⁴ cells per well and incubated overnight. The next day, the cells were washed, the NanoGlo live-cell substrate was added and the plate was placed in the luminometer until stabilization of the signal. For each of the compounds, a range of concentrations (in-well concentration of (25 μM) – (10 μM) – 5 μM – 10−6 M – 10−7 M – 10−8 M – 10−9 M – (10−10 M) – (10−11 M)) was added and the luminescent signal was measured for 90 min. The appropriate solvent controls were always included.
2.6. Data analysis and calculations
Curve fitting and statistical analysis were performed using GraphPad Prism software (San Diego, CA, USA). For the determination of the optimal configuration of A3AR with the miniGαi fusion protein, the bioluminescent profiles of the unstimulated and agonist-treated conditions were corrected for inter-well variability, and maximal signal height for both conditions was determined. The Mann-Whitney U test was used to evaluate the statistical significance of the observed differences. The calculation of the AUC values used in the sigmoidal concentration-response curves is visually represented in Fig. 1. First, the obtained activation profiles (panel A), are corrected for inter-well variability (as variation is inherent to biological systems, due to e.g. small differences in cell numbers). To this end, the mean value of all wells at time point t−1 (the time point immediately before agonist/solvent control addition) is calculated and all curves are forced through that value at t−1, obtaining the curves in panel B. This is done by calculating the ratio of the mean t−1 value versus the t−1 value of a specific well and using that ratio to multiply each individual value obtained from that well at each individual time point. The corrected curve is then used to calculate the AUC (the complete red area in panelC) for each curve via the trapezoidal method, after which the AUC of the corresponding blank (the pink area with the grey dots) is subtracted. This yields the final AUC (the red area without grey dots) used for curve fitting. Calculation of the AUC was based on all measurements (at least 45 per condition) during the 90 min read-out. When the AUC values of the highest concentration were more than 20% lower than the values of the preceding concentration, these data points were excluded from the set. The sigmoidal concentration-response curves, normalized to the maximal response of NECA, enabled the calculation of EC50 and Emax values. To this end, the three-parameter model for non-linear regression was employed, as the assumption of a Hill slope that equals 1 is a prerequisite for the implementation of the further calculation of bias factors [8,23].
Fig. 1.

Example of the calculation of the area under the curve (AUC). (A) Raw activation profiles of compound 1 in the βarr2 bioassay. B) Profiles obtained by correcting for inter-well variability, and used to calculate the final AUC (panel C). The latter is calculated by subtracting the blank AUC (grey dotted area) from the total AUC for the curve (red region).
The ‘intrinsic relative activity’ (RAi) of an agonist in a certain pathway was calculated by dividing the ratio of the calculated Emax and EC50 values of the tested agonist by the Emax/EC50 ratio of the reference agonist NECA (considered as non-biased here) in that particular pathway, using the following formula [8,23]:
| (1) |
For each of the compounds, the RAi’s of the two pathways (βarr2 or miniGαi) were then combined into the bias factor, β, by using the following formula [8]:
| (2) |
As Baltos et al. previously found NECA to be an unbiased A3AR agonist, using a set of five different assays, we chose this compound as the reference agonist for both bioassays [9]. Hence the bias factor of NECA was per definition 0. To evaluate compounds with statistically significant deviation from this value (p < 0.05), a Kruskal-Wallis (the non-parametric alternative to one-way ANOVA) test with post hoc Dunn’s multiple comparison, was applied.
3. Results
3.1. Selection of the optimal configuration of A3AR with miniGαi
The developed bioassays employ the NanoBiT® technology to determine the hA3AR activation potential in two different pathways: βarr2 recruitment and miniGαi coupling. This technology, specifically designed for the study of protein-protein interactions, is based on the functional complementation of the two parts of a split nanoluciferase enzyme. The nanoluciferase is split into larger (18 kDa, LgBiT) and smaller (1 kDa, SmBiT) parts, each of which can be fused to one of the (potentially) interacting proteins, i.e. the A3AR and the effector molecule βarr2 or miniGαi, respectively. When the two partners interact, the two parts of the split enzyme complement each other, which is visible as a bioluminescent signal following addition of the substrate furimazine [20].
Previously, HEK 293T cells stably expressing the optimal combination of A3AR-LgBiT with SmBiT-βarr2 (hA3AR-NanoBiT®- βarr2 HEK 293T) were generated and successfully applied for the screening of the potency and efficacy of a set of A3AR ligands [21,22]. In order to obtain a system capable of monitoring G protein activation, we set up a similar system using miniGαi. The miniGαi protein is the thermodynamically stabilized Ras domain of Gαi. This domain is reported to form most of the interactions with the receptor [11–13], and was fused N- or C- terminally to either the LgBiT or SmBiT fragment of the split nanoluciferase [14]. The optimal configuration for functional complementation of the receptor constructs (A3AR C-terminally fused to LgBiT or SmBiT) and the miniGαi constructs was determined by transient transfection of HEK 293T cells and assessing the fold increase in maximal signal height upon stimulation with 5 μM of the A3AR agonist 2-Cl-IB-MECA (Fig. 2). The largest fold increase was observed when A3AR-LgBiT was combined with SmBiT-miniGαi. This configuration is similar to that of the βarr2 recruitment assay, in which we previously found that A3AR-LgBiT combined with SmBiT- βarr2 yielded the highest increase in signal. It is relevant to note that the use of the same receptor construct (A3AR-LgBiT) in both bioassays avoids interassay variability.
Fig. 2.
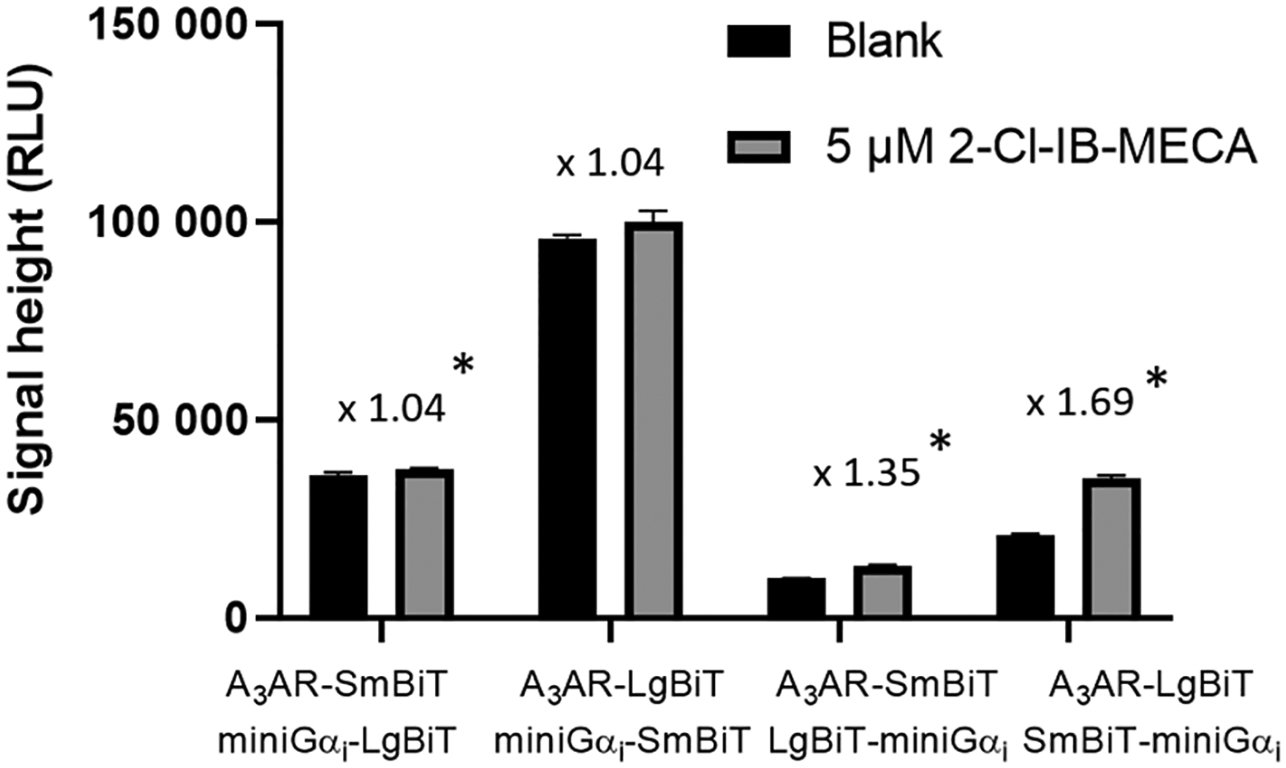
Determination of the optimal combination of A3AR and miniGαi constructs in the NanoBiT® system. For each combination, the (increase in) maximal signal height of the unstimulated versus stimulated cells is depicted. Significance was determined using the Mann-Whitney U test; *: P < 0.05. The mean and standard deviation (n = 4) of one representative experiment are shown.
3.2. Assessment of the activity and suitability of the stable cell line
Similar to the βarr2 recruitment assay, a cell line was developed that stably expresses the A3AR-LgBiT and SmBiT-miniGαi fusion proteins (the hA3AR-NanoBiT®-miniGαi HEK 293T cell line). Expression of the fusion proteins can be monitored via the co-expressed markers EGFP and dNGFR. These markers allow for the selection of the transduced cells expressing the highest levels of both constructs and enable the follow-up of expression levels during later experiments. Application of a concentration range of the A3AR agonist 2-Cl-IB-MECA yielded a clear concentration-dependent response with this cell line, similar to that observed in transiently transfected cells (Fig. 3).
Fig. 3.
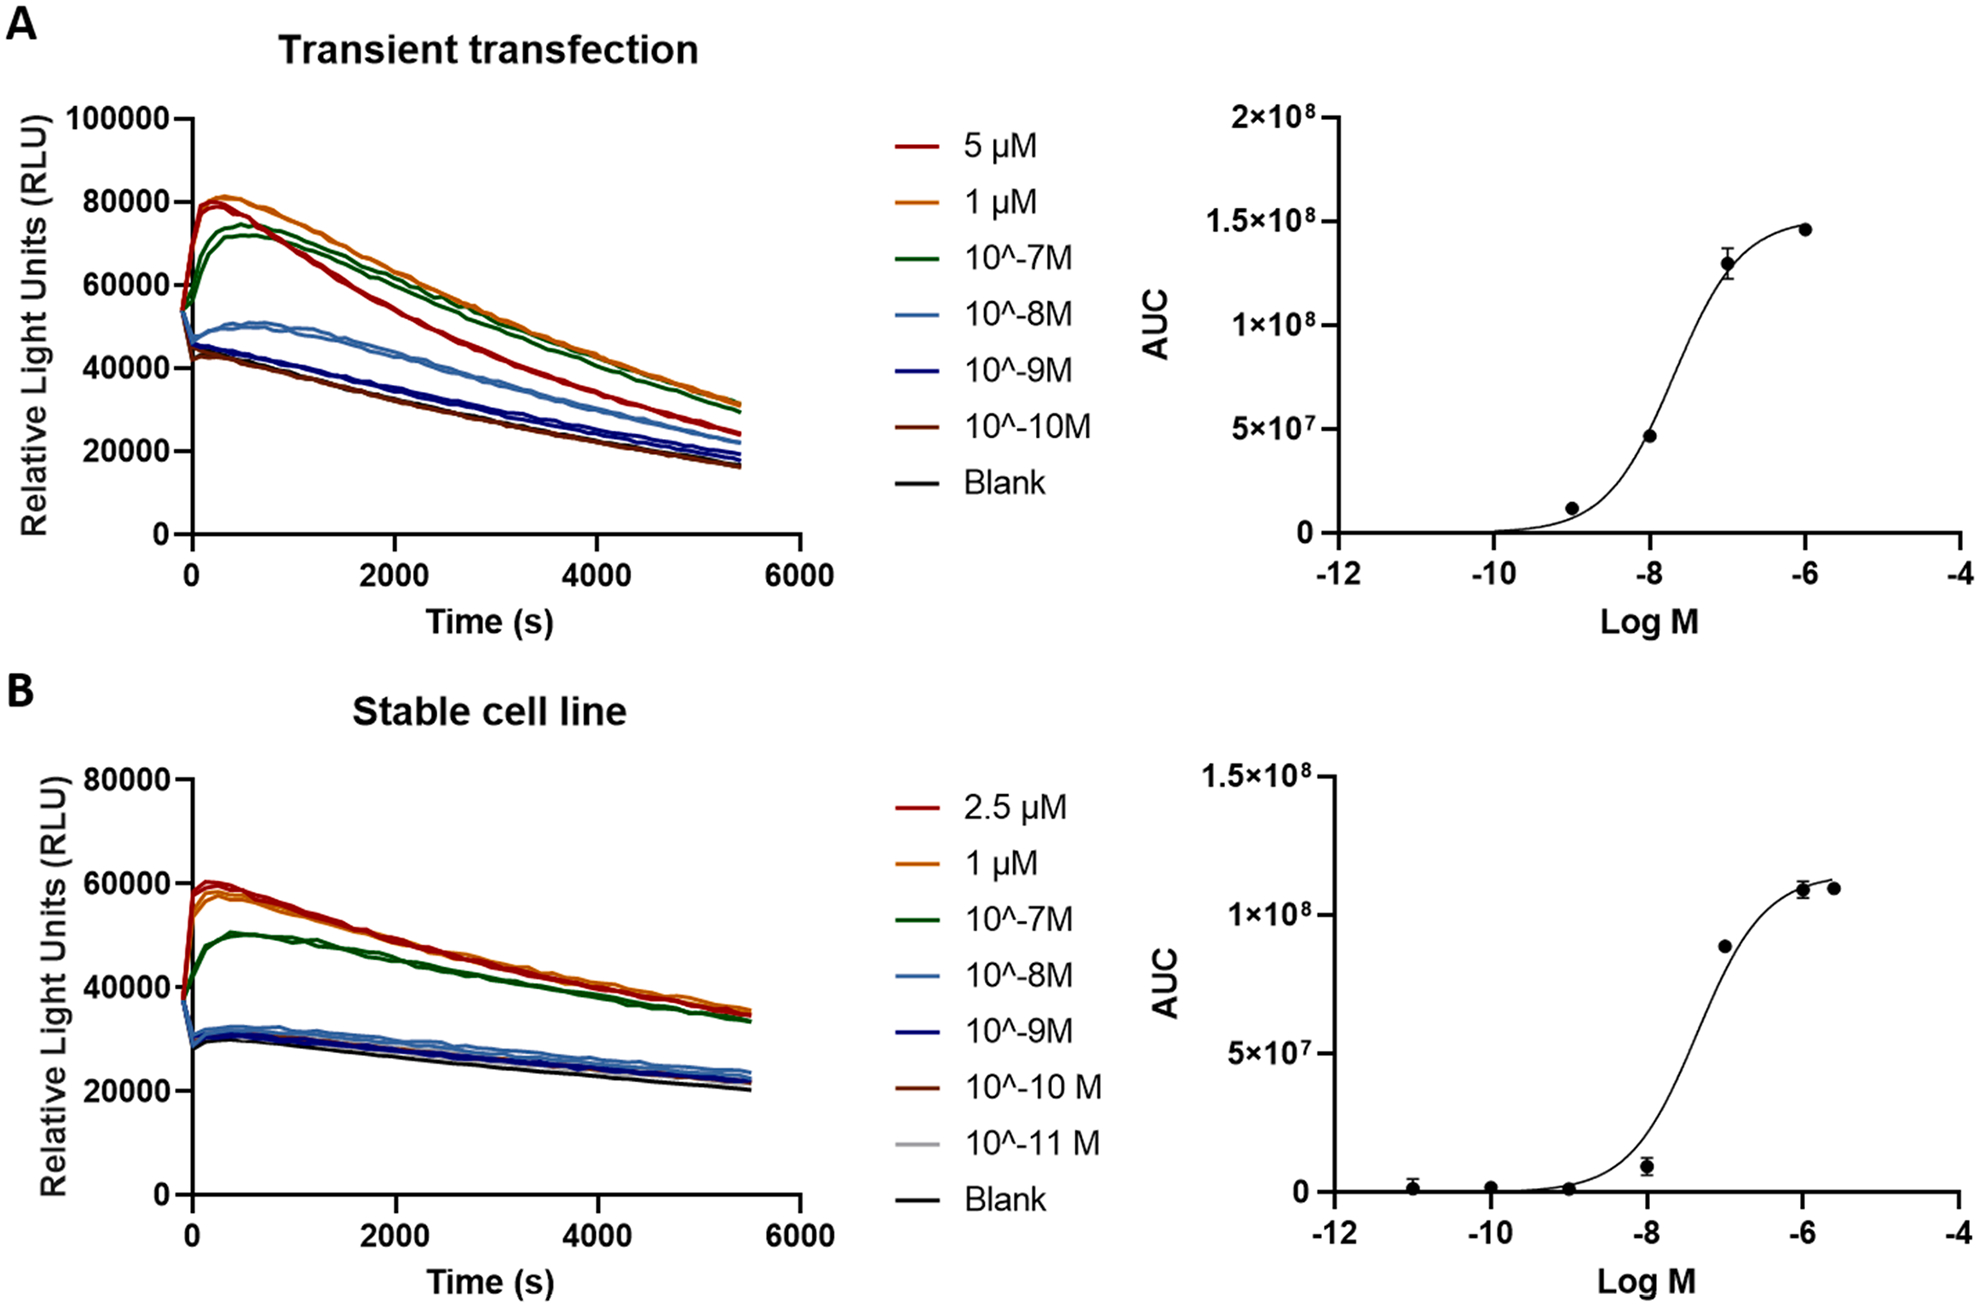
Transiently transfected cells (A) are compared with the newly developed stable cell system (B), each expressing the A3AR-LgBiT and SmBiT-miniGαi constructs. The left panel shows the corrected activation profiles obtained by testing a concentration range (evaluated in duplicate) of the A3AR agonist 2-Cl-IB-MECA, the right panel shows the corresponding sigmoidal concentration–response curve. Data of one representative experiment are shown.
3.3. Evaluation of the potency and efficacy of a panel of A3AR ligands
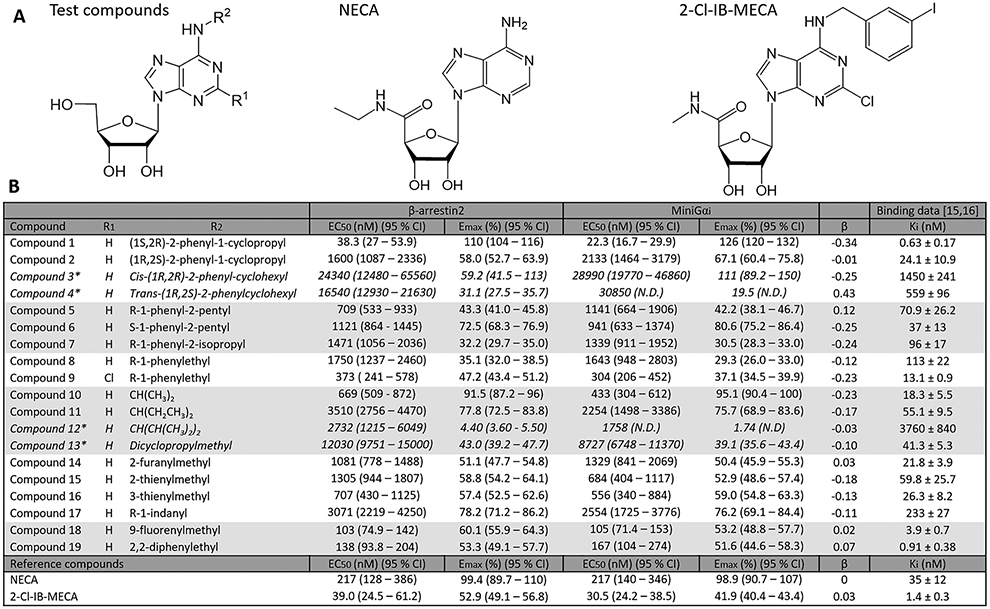
A panel of 19 synthetic A3AR ligands, with a focus on N6-derivatized adenosines (an overview of the structures is provided in Table 1), was analyzed in both the G protein coupling assay (using the hA3AR-Na-noBiT®-miniGαi HEK 293T cell line) and the βarr2 recruitment assay (using the hA3AR-NanoBiT®- βarr2 HEK 293T cell line) [15,16]. The A3AR-selective agonist 2-Cl-IB-MECA and the nonselective adenosine receptor agonist NECA were included in the experiments as extensively described controls. The unbiased agonist NECA was chosen as the reference agonist [9]. The assays provided information on the potency and efficacy of the adenosine derivatives in the two pathways and could reveal potential preferences of a compound toward one pathway or the other. The obtained sigmoidal concentration-response curves are shown in Fig. 4, and the calculated EC50 (as a measure of potency) and Emax (as a measure of maximal efficacy, relative to NECA) values are given in Table 1. Figs. 4 and 5 depict a visual comparison of the results obtained for all tested compounds, using both recruitment assays, using an overlay figure and a representation of pEC50 and Emax values.
Table 1.
A) Chemical structures of the tested compounds and extensively described compounds NECA (used as a reference compound) and 2-Cl-IB-MECA. B) The table describes the N6 and C2 substituents, and the EC50 and Emax (percentage of Emax of reference agonist NECA) obtained in the βarr2 and miniGαi pathways, together with their respective bias factors (β) and the previously reported A3AR binding affinities [15,16]. The compounds represented with *, are those that did not reach the maximal response within the tested concentration range, as seen from the concentration-response curves, therefore, the results must be interpreted with caution. The data shown were calculated using the full 90-min activation profile.
|
Fig. 4.
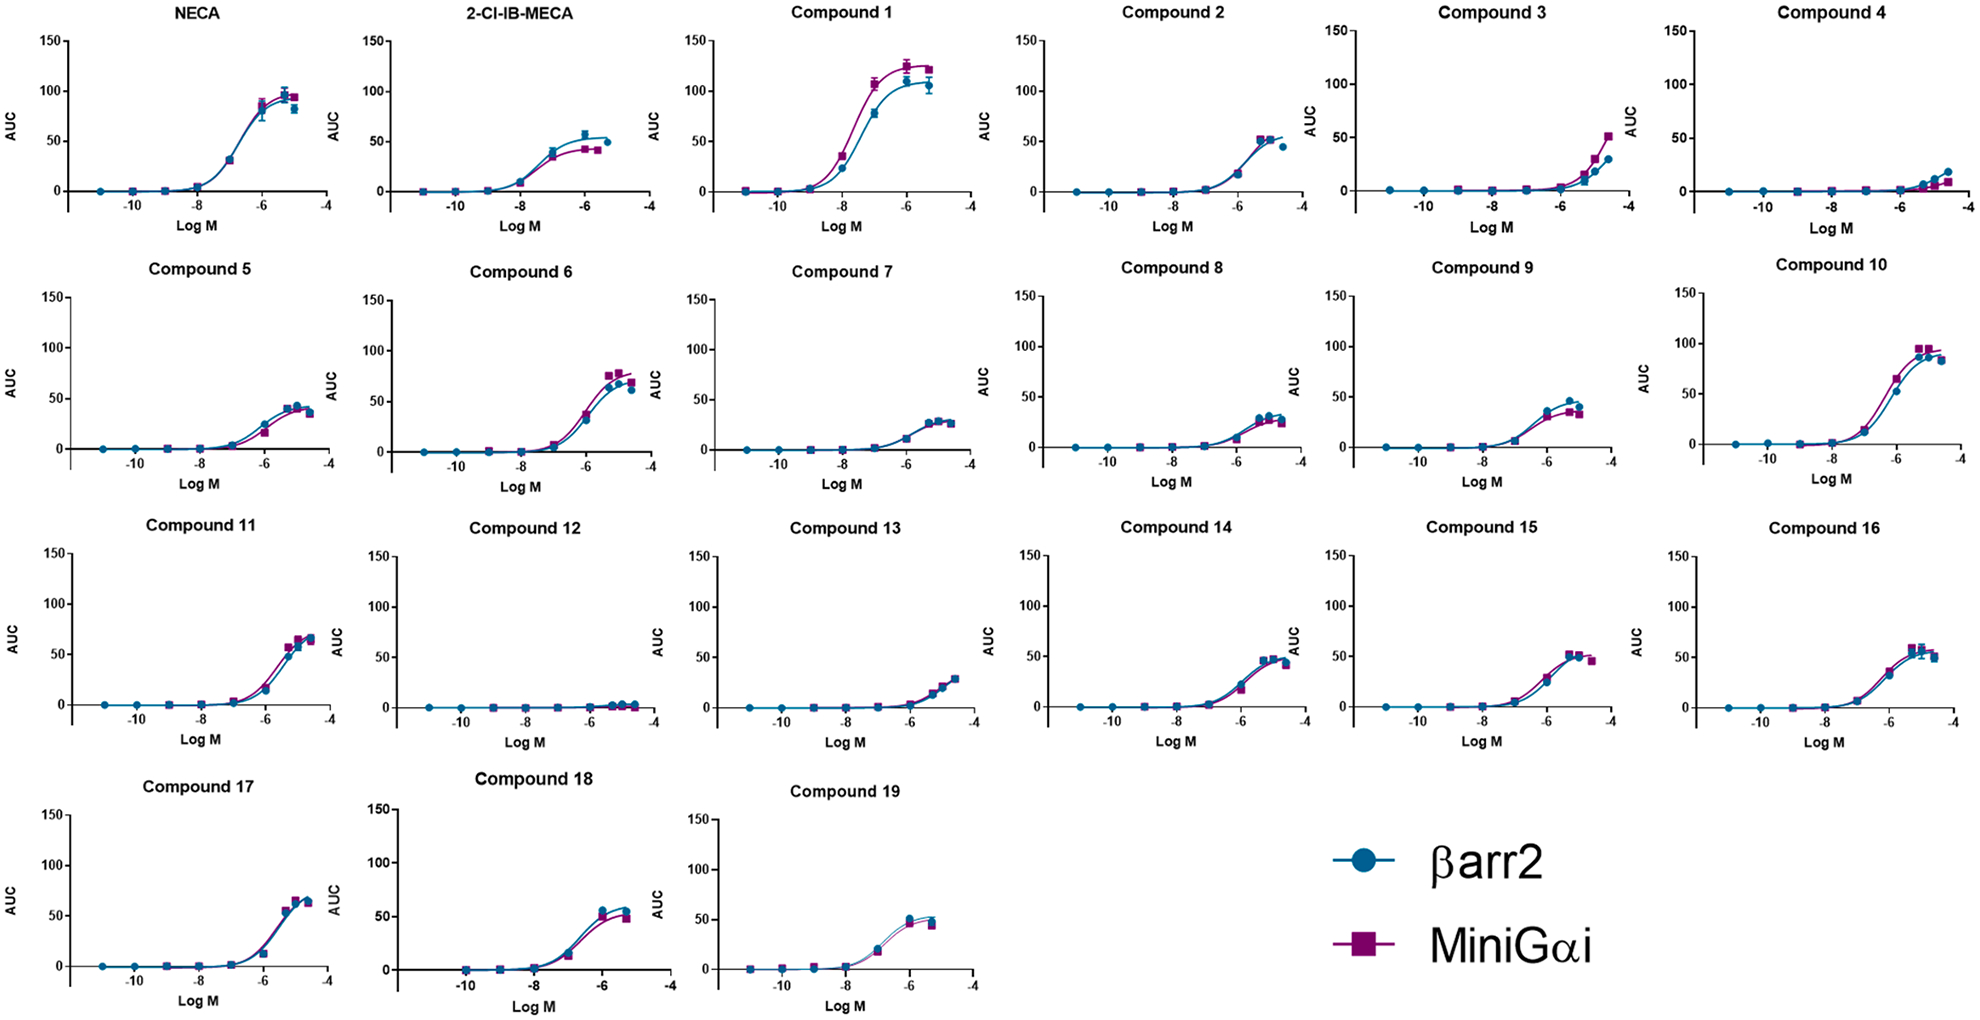
For each of the tested compounds, the fitted concentration-response curves are depicted for both bioassays assessing recruitment of either βarr2 or miniGαi to the A3AR. The curves are obtained through the values of three independent experiments, each normalized for the maximal response with the reference agonist NECA.
Fig. 5.
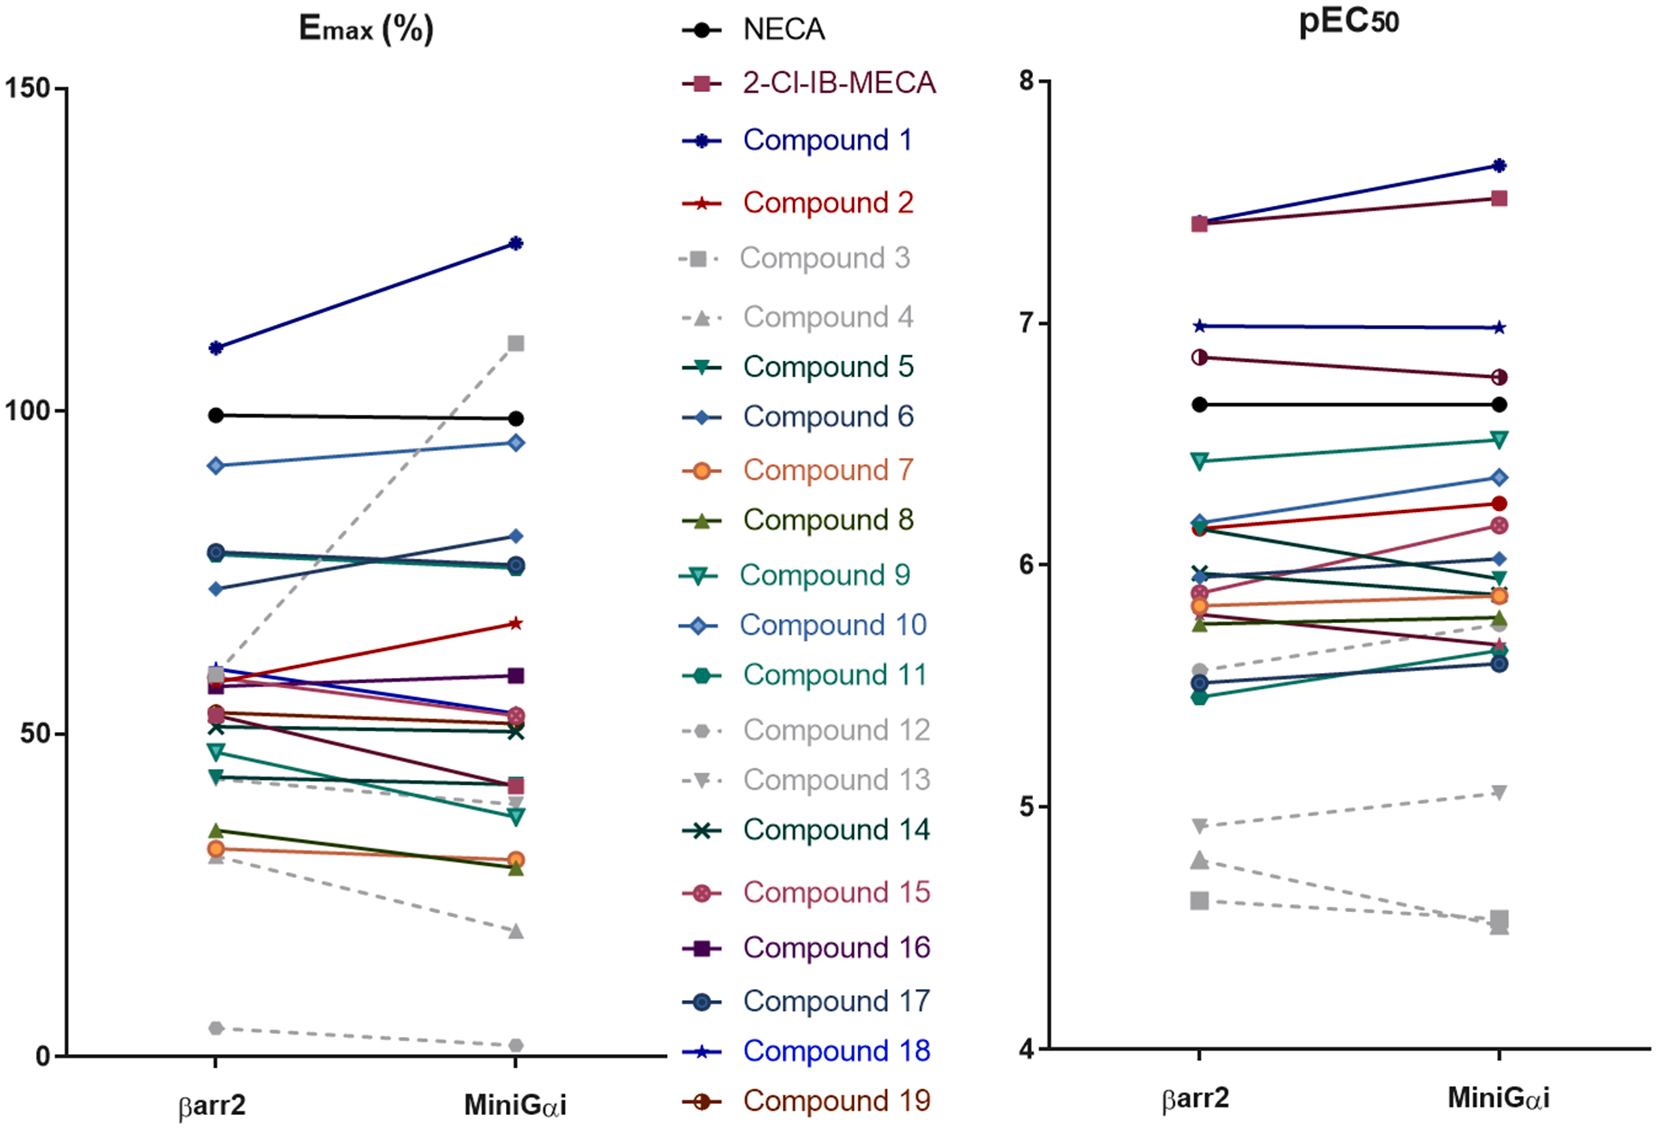
Comparison of the potencies (pEC50, right panel) and efficacies (Emax, left panel, normalized to Emax of reference agonist NECA that was arbitrarily set to 100%) of the compounds, assessed using the two bioassays. This is a visual representation of the potential bias of compounds towards one of the pathways. The compounds represented in grey dotted lines are those that did not reach the maximal response within the tested concentration range, as seen from the concentration–response curves.
The obtained pEC50 and Emax values, combined with those obtained for the unbiased reference agonist NECA, can be used to calculate the intrinsic relative activities (Rai) and, eventually, the bias factors (β) for all compounds. Table 1 provides an overview of the calculated bias factors, with a visual representation in Fig. 6. The filled circles are derived from the full activation profile data (90 min), as shown in Table 1, whereas the open circles are derived from the first 30 min (ascending part of the curves, including the maximum). It is interesting to note that the trends derived from the 90-min curves were fully recapitulated when using data from the 30-min curves. The slight upward trend in bias factors derived from the 30-min curves is owing to a slightly increased EC50 value of NECA (although not significant), slightly raising the RAi of the βarr2 bioassay for each of the compounds. Compounds with a positive value for β show a preference towards βarr2 recruitment upon ligand binding, whereas a negative β value points at a bias towards miniGαi (as compared to the reference agonist). A Krus-kall-Wallis analysis with post hoc Dunn’s test was used to evaluate whether any of the evaluated compounds differed significantly from the unbiased reference agonist NECA, which has a bias factor of 0 [23]. For all the compounds that generated a full sigmoidal curve in the bioassays, relatively small bias factors were observed (within the range −0.34 to 0.12, as can be seen in Table 1), none being significantly different from NECA.
Fig. 6.
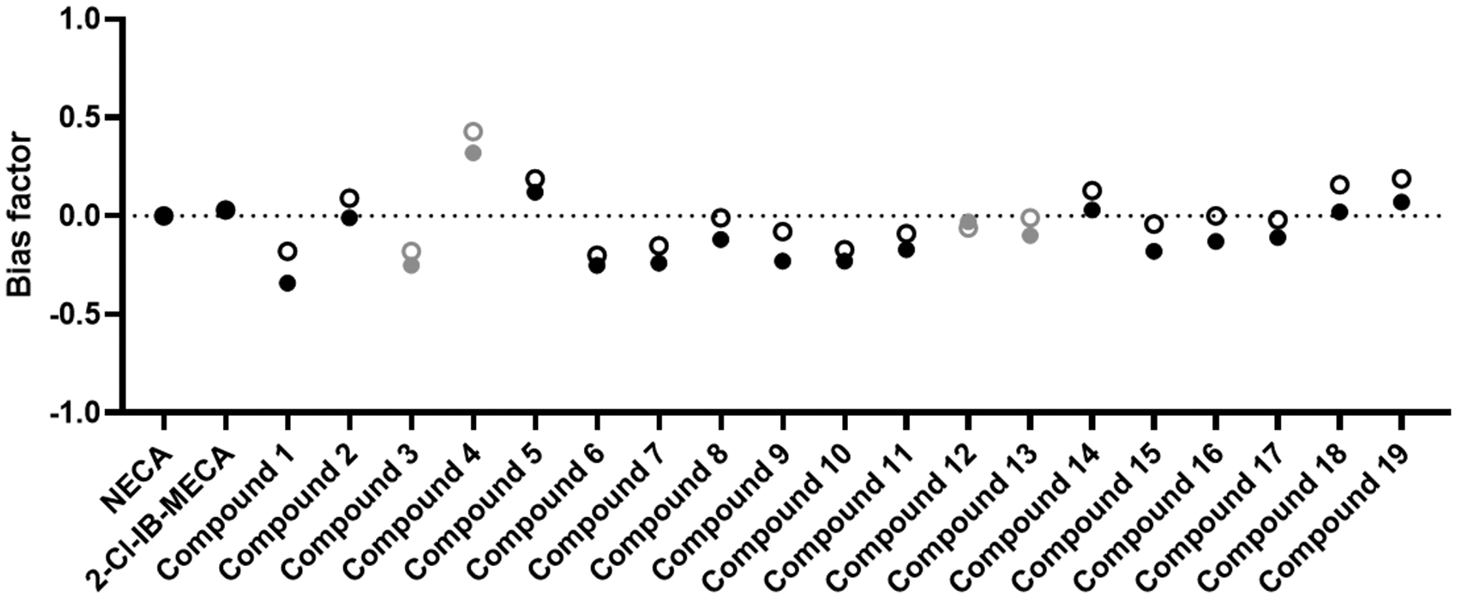
Visual representation of the bias factors calculated for each of the compounds. The closed circles represent the bias factors that were obtained using the full activation profiles (90 min), the open circles show the bias factors obtained by using only the ascending part of the activation curves (only the first 30 min of the read-out). A positive value would imply a preference towards the βarr2 pathway, a negative value a bias towards miniGαi as compared to the reference agonist NECA. Kruskal-Wallis analysis with post hoc Dunn’s test did not reveal statistical differences between the reference and the test compounds. The compounds represented in grey are those that did not reach the maximal response within the tested concentration range, as seen from the concentration-response curves. As this may impact the calculation of the bias factor β, no conclusions on the (non-) biased nature of these compounds can be drawn.
3.4. Selectivity and independence of the observed response
As a control, to assess the selectivity of the A3AR stable cell systems, and to verify that the observed responses are not owing to an aspecific association of both fusion constructs, the response of a potent A3AR agonist (N6-((1S,2R)-2-phenyl-1-cyclopropyl)-adenosine, compound 1) [15,16] in the described cell systems was compared to that obtained in a similar system expressing a different GPCR (cannabinoid receptor CB1) of Family A. In contrast to the synthetic cannabinoid agonist JWH-018 (5 μM), compound 1 (5 μM) was unable to generate a signal in the βarr2 recruitment and miniGαi coupling assays when combined with the CB1 cannabinoid receptor (CB1-LgBiT) [14,18]. This confirms the absence of an aspecific response induced by this representative A3AR ligand.
In a second control experiment, we verified whether βarr2 recruitment is independent of G protein coupling to the A3AR. For this, prior to treating with a NECA concentration gradient, both stable cell lines (expressing hA3AR-LgBiT with either SmBiT-βarr2 or with SmBiT-miniGαi) were treated overnight (or not) with 400 ng/mL pertussis toxin (PTX), which prompts uncoupling of Gi. As shown in Fig. 7, pre-incubation with PTX clearly resulted in a shift of the concentration–response curve for NECA in the miniGαi assay, while the βarr2 assay remained unaffected. From this experiment, it is clear that βarr2 recruitment does not rely on the coupling of PTX-sensitive G-proteins.
Fig. 7.
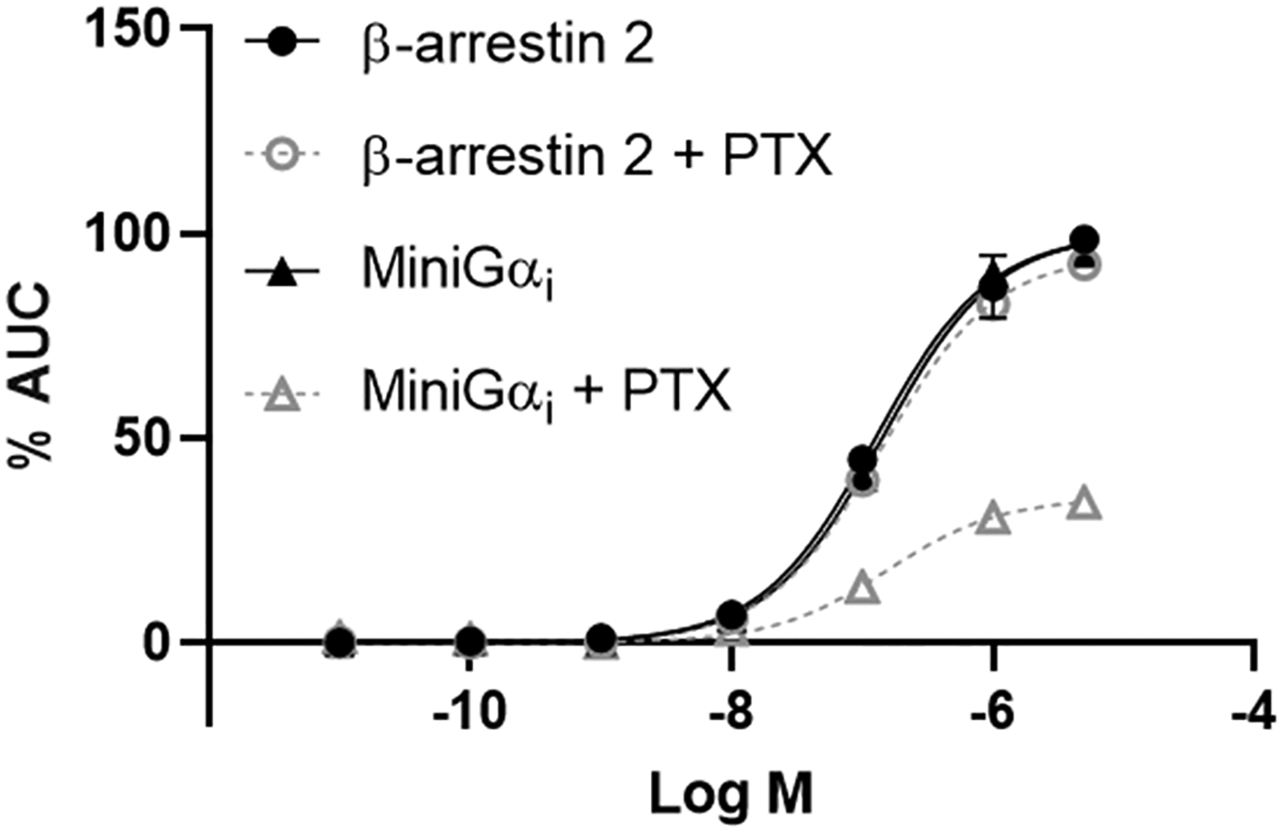
Normalized concentration-esponse curves for the reference agonist NECA in both the βarr2 and miniGαi bioassay, following overnight pre-incubation with 400 ng/mL PTX or not. Data of one representative experiment are shown.
4. Discussion
Here, we report on the development of a new live-cell GPCR activation assay, monitoring G protein recruitment to hA3AR, employing a NanoBiT® luminescence reporting system [20]. This set-up was chosen to complement a βarr2 recruitment assay we previously developed [21,22]. In the new assay, functional complementation of a split-nanoluciferase takes place when miniGαi protein (fused to the small part of a split-nanoluciferase) couples to the A3AR (fused to the large part of split-nanoluciferase) upon agonist binding.
As the sensitivity of the bioassay depends on the optimal orientation of the interacting partners, the four possible combinations of receptor with miniGαi were tested. The combination of A3AR-LgBiT with SmBiT-miniGαi was selected and a stable cell line was created that highly expresses these fusion constructs. This cell line remained stable for at least 10 passages, as monitored via flow cytometry of the co-expressed markers EGFP and dNGFR. Both the previously developed βarr2 assay and the new G protein assay were used for the functional characterization of a set of A3AR ligands [15,16].
A3AR agonists are typically designed by starting from the endogenous agonist adenosine, via introducing modifications at the N6 and C2 positions of adenine (as depicted in Table 1) and/or at the ribose moiety and its 5′ position [2,3,24]. In this study, a set of 19 compounds with N6 modifications was evaluated in terms of potency and efficacy, and their potential preference to recruit either βarr2 or miniGαi to the A 3AR [15,16]. The introduction of small substituents at N6 has been reported to strongly increase the potency of 2-alkynyl-substituted compounds at the A3AR, and the selectivity for the A3AR over other adenosine receptors [25]. In contrast, larger alkyl groups and the introduction of branching points at the N6 substituent are poorly tolerated, leading to a decrease in affinity and potency at the A3AR. Moreover, the substitution at this position with a phenyl or benzyl group was reported to result in reduced Emax, but increased selectivity for A3AR [15,24].
In our functional evaluation of the N6-substituted analogues, we included the extensively described compounds NECA and 2-Cl-IB-MECA as positive controls. Furthermore, NECA has been reported to be an unbiased reference agonist [9]. The resulting concentration-response curves are shown in Fig. 8. In accordance with data from previous studies, we found a high response for NECA in both the βarr2 and miniGαi assays (arbitrarily set to 100%), with EC50 values of 217 nM in both assays [21]. The A3AR-selective agonist 2-Cl-IB-MECA, however, was found to have approximately only half the efficacy of NECA (with E max of 52.9% for βarr2 and 41.9% in the miniGαi assay), while demonstrating 5-to-6 fold higher potency values (EC50 of 39.0 nM and 30.5 nM, respectively). These results are consistent with data obtained with the calcium assay, the GTPγS assay and our previously published findings [21,26,27]. However, 2-Cl-IB-MECA and NECA have been described as equipotent in the PathHunter® assay for βarr2 recruitment and the cAMP assay [26].
Fig. 8.
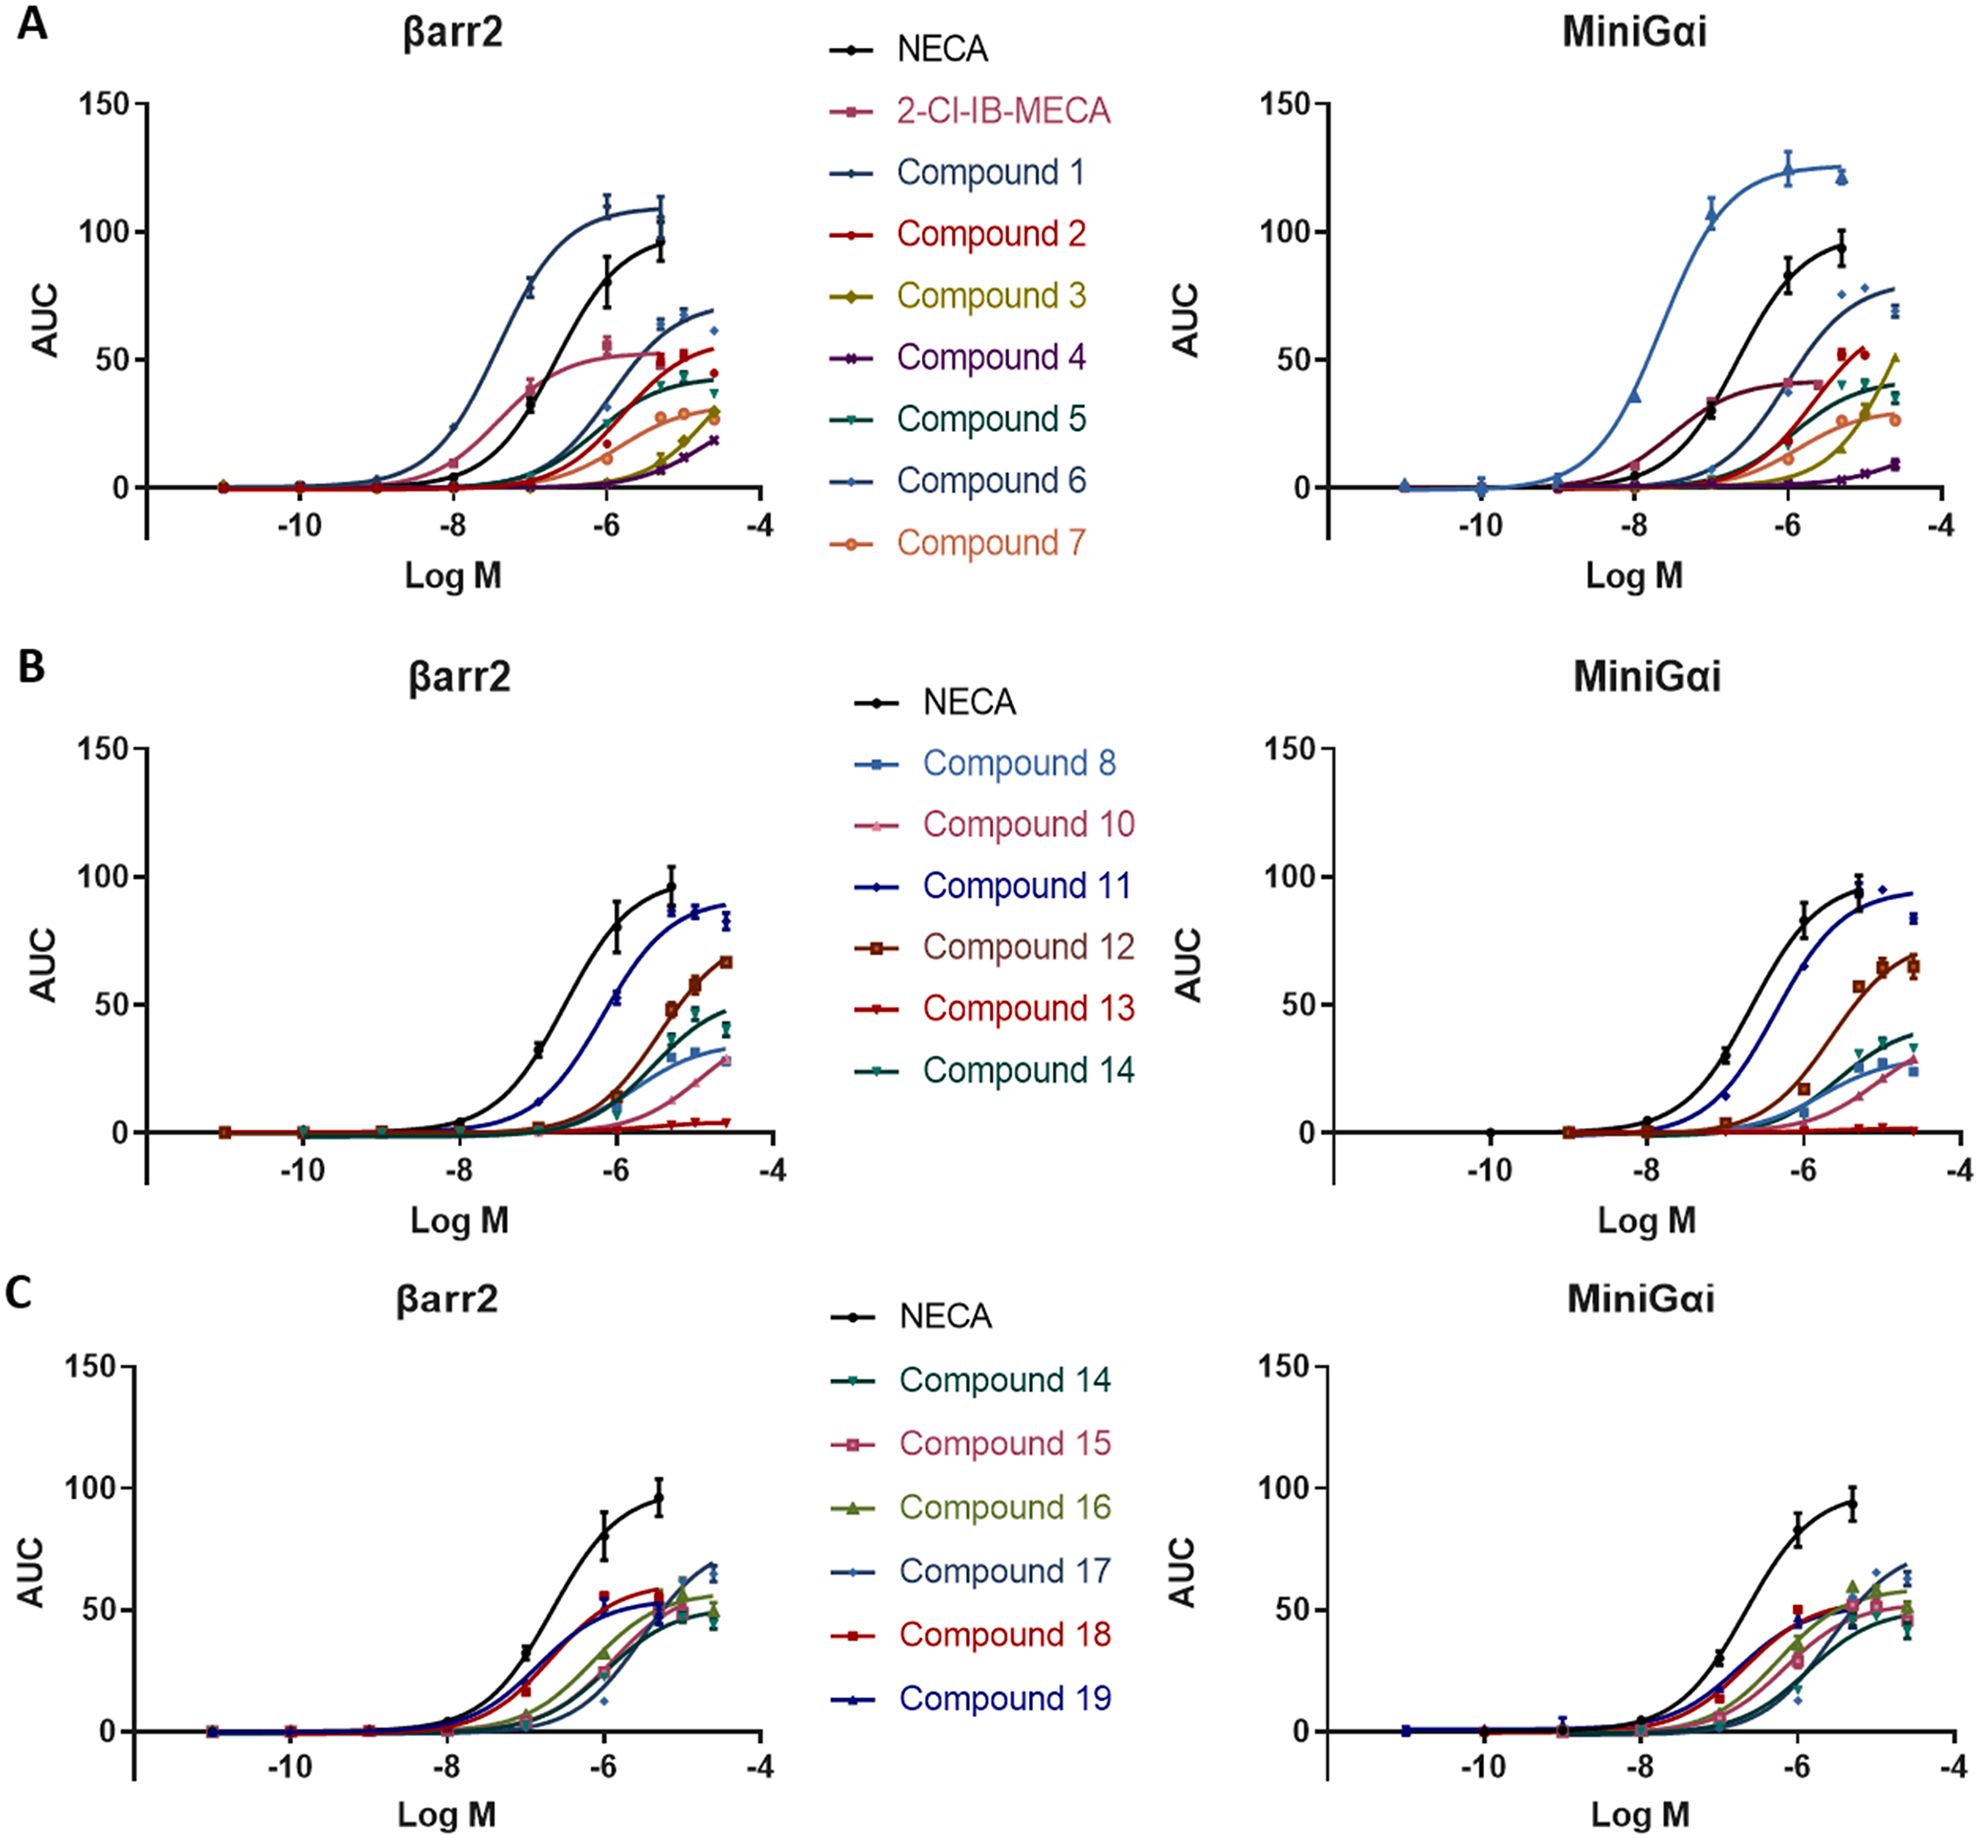
Each panel shows the sigmoidal concentration-response curves of a subset of the tested compounds, the left and right graphs showing the obtained results for βarr2 recruitment and miniGαi coupling to the A3AR. Curves are resulting from three independent experiments, each performed in duplicate.
In structure-activity relationship studies, the stereochemistry, the orientation, the structural constraints and the bulkiness of a certain substituent are known to potentially influence the activity of a compound [15]. For A3AR ligands, the stereochemistry of the cyclic structure including positions C1 and C2 of the N6 side chain appears to be determinative for the functionality of a compound. The 1S, 2R orientation of the cyclopropyl group (compound 1) resulted in the highest potencies and efficacies in this study, using both assays. This steric orientation was reported to be optimal for the phenyl group to interact with a defined hydrophobic region in the putative A3AR binding site[16]. The inversion of that group to the 1R, 2S orientation (compound2) strongly reduced the potency (40-fold for βarr2 and close to 100-fold for miniGαi) and roughly halved maximal efficacies in both assays. Both the cis – (1R,2R)-2-phenyl-cyclohexyl substitution (compound 3) and the trans-(1R,2S)-2-phenylcyclohexyl (compound 4) substitution at N6 of adenosine rendered the resulting compounds essentially inactive, with no clear activation signal in either of the bioassays. These findings are consistent with the low binding affinities reported for the latter two compounds [15] (Table 1).
In the stereoisomeric compounds with the R-1-phenyl-2-pentyl (compound 5) substituent and its inverted S-1 diastereomer (compound6), the orientation appeared to have a less pronounced impact on the activity, as seen in Table 1. While this inversion did not substantially alter the potency in the βarr2 or miniGαi assay, the efficacy of compound 6 was higher in both assays. Comparison of compound 5 with the branched R-1-phenyl-2-isopropyl isomer (compound 7), revealed a slightly reduced efficacy in both assays for the latter, and a reduced potency for compound 7 in the βarr2 recruitment assay, but not in the miniGαi assay. This is consistent with findings by Gao et al., reporting a similar affinity for both compounds, but diminished efficacy upon branching at the terminal alkyl position in the cAMP assay [15].
The addition of a 2-chloro substituent to the pyrimidine group of compound 8, yielding compound 9 (2-Cl-R-PIA), resulted in an approximately five-fold increased potency in both assays (Table 1). In contrast to the similar efficacies that were reported previously with a cAMP assay, compound 9 showed a slightly higher efficacy than compound 8 [15]. This is in accordance with the increased binding affinity reported for the 2-Cl-substituted compound [15]. The introduction of a 2-Cl functional group is a common modification of adenosine, which does not have an unambiguous influence on the potencies and efficacies of the concerned structures [28]. For example, in the comparison between IB-MECA and 2-Cl-IB-MECA, we previously reported similar EC50 values obtained with the cAMP (3.63 nM and 2.81 nM, respectively) and βarr2 (13.5 and 29.5 nM) assays. Furthermore, the obtained Emax values for the cAMP assay were similar (Emax of 100% for both compounds), with a slightly reduced efficacy for the 2-Cl substituted analogue in the βarr2 bioassay (78.4% for IB-MECA compared to 56.1% for 2-Cl-IB-MECA) [21]. Furthermore, also Gao et al. concluded that the introduction of the 2-chloro group increased the A3AR affinity and decreased the efficacy, when measuring 10 μM of compounds 8 and 9 in the cAMP assay [15].
A subset of the tested compounds incorporated a branching point in their N6 substituent (Table 1). In the structures not containing a cyclic structure, potency and efficacy drastically decreased with increasing bulkiness of the substituted group. While compound 10 (branched at C1 into two methyl groups) still had EC50 values in the nanomolar range (669 nM for βarr2 and 433 nM for miniGαi), with high Emax values, this activity was strongly reduced in the corresponding analogue with two ethyl groups (compound 11), with EC50 values in the micromolar range (3510 and 2254 nM, respectively) and a decreased Emax (77.8% and 75.7%). The receptor activation potential even could not be measured anymore for the analogue with 2 isopropyl groups (compound 12), presumably due to the low binding affinity of this compound for the A 3AR [15]. (Table 1) The same observation was made for compound 13, where C1 of the N6 group was substituted with two cyclopropyl groups.
Besides the phenyl groups discussed above, several other cyclic (aromatic) structures were introduced at the N6-side chain of the adenosine molecule (Table 1). EC50 values in the micromolar range were obtained for the compounds encompassing a 2-furanylmethyl (compound 14), R-1-indanyl (compound 17) or a 2-thienylmethyl (compound 15) group. Similar efficacies were observed for compound 14 and compound 15, with a higher Emax value for compound 17. When the 2-thienylmethylgroup was changed to a 3-thienylmethylgroup (compound 16), the highest potencies within this group were reached, similar to compound 15 in terms of the miniGαi assay, and double as high in the βarr2 assay, with efficacies lying in the same range.
While structural rigidification of a compound can result in increased potency and efficacy, this was not observed when comparing compound 19 (with a 2,2-diphenylethyl substituent) and compound 18, an analogue structurally constrained by the introduction of a biaryl bond between the two phenyl groups (with a 9-fluorenylmethyl substituent)[16]. Neither in the βarr2 assay, nor in the miniGαi assay a marked difference was observed in potency or efficacy (Table 1). This is in contrast with the findings of Tchilibon et al., who reported compound 19 to be an A3AR antagonist in the cAMP pathway [16].
We previously functionally characterized a set of A3AR ligands using a βarr2 recruitment assay and compared these findings with those from a cAMP assay as a measure of G protein activation. This comparison revealed a consistent difference for the potency, when obtained with the cAMP assay, compared to βarr2 assay results, with a logEC50 value that was approximately one unit higher in the cAMP assay [21]. This consistent difference was not observed with the current miniGαi assay as a measure of G protein activation. Furthermore, when comparing the data of the employed bioassays to the previously obtained cAMP data, several discrepancies are observed [15,16]. The dissimilarity in results can presumably be explained by the use of distinct assay platforms in separate cell lines, with the associated differences in signal amplification, expression levels and receptor reserve. By using the reported recruitment bioassays, this study monitors a signaling event further upstream, whereas cAMP accumulation occurs more downstream the signaling cascade and may be subject to a “plateauing effect”. Furthermore, the use of recruitment bioassays also rules out the need for an additional stimulation step, which may introduce extra variability in results [10,21,29]. Although a key strength of this study lies in the use of systems that were maximally similar, the utilized systems remain somewhat ‘artificial’, as is the case with any system allowing real-time assessment of protein recruitment. Hence, we cannot fully exclude a potential impact of e.g. overexpression, the use of fusion proteins, or the use of a miniGαi protein instead of a full length G protein.
Despite the extensive characterization of the structure-activity relationship of A3AR agonists, and the development of several selective molecules, the translation to clinically used pharmaceuticals is hampered by the occurrence of adverse effects [24]. The identification of the pathway(s) responsible for the therapeutic effects, and their preferential stimulation, omitting signaling through deleterious pathways, could provide a solution for this problem. The selective induction of several pathways has been reported for A3AR signaling for both orthosterically and allosterically binding ligands, respectively designated biased signaling and biased allosteric enhancement [6,9,26,30]. Gao et al. classified 2-Cl-IB-MECA as a partial agonist in a calcium mobilization assay, and as a full agonist in cAMP inhibition and in the PathHunter® assay for βarr2 recruitment [26]. Baltos et al. compared the potencies of a set of bicyclic (N)-methanocarba 5′-N-methyluronamide nucleoside derivatives in assays for cAMP, calcium mobilization, ERK1/2 and Akt 1/2/3 phosphorylation and cell survival. Differences were observed between the tested compounds, when comparing the ranking order of their relative potencies in this selected panel of signaling pathways (compared to the used reference agonist) [9]. Concerning allosteric modulation, positive allosteric modulator LUF 6000 has been reported to differentially affect the signaling effects of 2-Cl-IB-MECA, depending on the measured pathway [30].
In this study, biased agonism was quantified by calculating the ‘intrinsic relative activity’ RAi for each of the compounds in two closely designed yet distinct bioassays, and compared to the unbiased reference agonist NECA. From the combination of the RAi for βarr2 and miniGαi, the bias factor β was determined [8,23]. As depicted in Fig. 6, we did not detect a significant preference of any of the studied compounds towards βarr2 or miniGαi recruitment, using a 90- or 30-min read-out. Importantly, the 30-min read-out (covering the ascending part of the curve and the maximum) essentially confirmed all structure-activity relationships, as well as the conclusions regarding (absence of) biased agonism. This observation lends further support to the robustness of our approach.
As discussed above, this is not completely consistent with the bias reported for 2-Cl-IB-MECA, which can be explained by the fact that in previous studies different assays were used, with different levels of signal amplification and receptor reserve (the ‘number’ of receptors required to reach a maximal signal in the bioassay) [8,26]. Using a similar approach, comparing the results of a βarr2 recruitment assay with those of a miniGαi assay for a series of ligands of another receptor, the CB1 receptor, we did identify compounds displaying biased agonism towards either of the pathways, demonstrating that the deployment of parallel assays can yield more pronounced differences. There, the bias factors at CB1 receptor ranged from −1.018 to 1.204, as opposed to the very narrow range observed here (−0.34 to 0.12 for compounds for which a full profile was obtained) [14]. We can now use the parallel A 3AR assays established here to analyze more diversely modified adenosine agonists.
In conclusion, we report on the successful establishment of a stable miniGαi system to assess A3AR activation using a luminescent read-out through the NanoBiT® system, as a measure of G protein recruitment to the A3AR. The use of a stable cell line reduces the variability between experiments, thereby improving the reproducibility of the results, and adding to the simplicity of the experiments. The use of assays monitoring different signaling outcomes enables a more nuanced characterization of newly synthesized compounds. Moreover, these consistent assays enable the characterization of structure-activity relationships, thereby guiding the structural design of future compounds. Furthermore, the miniGαi system, in combination with the previously reported βarr2 recruitment assay, enables the assessment of biased agonism at the A3AR. The comparison of results obtained with these real time, live-cell bioassays is facilitated by the use of the same luminescent technique in the same cell system (HEK 293T) to measure events most upstream in the signaling cascade (βarr2 recruitment versus miniGαi recruitment to the same receptor), thereby reducing possible differences in receptor reserve and signal amplification between the assays.
Acknowledgments
We thank the Scientific Research Fund Flanders (Grant G0B8817N) and the NIDDK Intramural Research Program (ZIADK31117) for support.
References
- [1].Borea PA, Gessi S, Merighi S, Vincenzi F, Varani K, Pharmacology of adenosine receptors: the state of the art, Physiol. Rev 98 (3) (2018) 1591–1625. [DOI] [PubMed] [Google Scholar]
- [2].Borea PA, Varani K, Vincenzi F, Baraldi PG, Tabrizi MA, Merighi S, Gessi S, The A3 adenosine receptor: history and perspectives, Pharmacol. Rev 67 (1) (2015) 74–102. [DOI] [PubMed] [Google Scholar]
- [3].Jacobson KA, Merighi S, Varani K, Borea PA, Baraldi S, Aghazadeh Tabrizi M,Romagnoli R, Baraldi PG, Ciancetta A, Tosh DK, Gao ZG, Gessi S, A3 Adenosine Receptors as Modulators of Inflammation: From Medicinal Chemistry to Therapy, Medicinal research reviews 38(4) (2018) 1031–1072. [DOI] [PMC free article] [PubMed] [Google Scholar]
- [4].Rankovic Z, Brust TF, Bohn LM, Biased agonism:a An emerging paradigm in GPCR drug discovery, Bioorg. Med. Chem. Lett 26 (2) (2016) 241–250. [DOI] [PMC free article] [PubMed] [Google Scholar]
- [5].Smith JS, Lefkowitz RJ, Rajagopal S, Biased signalling: from simple switches to allosteric microprocessors, Nat. Rev. Drug Discovery 17 (4) (2018) 243–260. [DOI] [PMC free article] [PubMed] [Google Scholar]
- [6].Verzijl D, Ijzerman AP, Functional selectivity of adenosine receptor ligands, Purinergic Signalling 7 (2) (2011) 171–192. [DOI] [PMC free article] [PubMed] [Google Scholar]
- [7].Kenakin T, Christopoulos A, Signalling bias in new drug discovery: detection, quantification and therapeutic impact, Nat. Rev. Drug Discovery 12 (3) (2013) 205–216. [DOI] [PubMed] [Google Scholar]
- [8].Rajagopal S, Ahn S, Rominger DH, Gowen-MacDonald W, Lam CM,Dewire SM, Violin JD, Lefkowitz RJ, Quantifying ligand bias at seven-transmembrane receptors, Mol. Pharmacol 80 (3) (2011) 367–377. [DOI] [PMC free article] [PubMed] [Google Scholar]
- [9].Baltos JA, Paoletta S, Nguyen AT, Gregory KJ, Tosh DK, Christopoulos A, Jacobson KA, May LT, Structure-activity analysis of biased agonism at the human adenosine A3 receptor, Mol. Pharmacol 90 (1) (2016) 12–22. [DOI] [PMC free article] [PubMed] [Google Scholar]
- [10].Wouters E, Walraed J, Banister SD, Stove CP, Insights into biased signaling at cannabinoid receptors: synthetic cannabinoid receptor agonists, Biochem. Pharmacol 169 (2019) 113623. [DOI] [PubMed] [Google Scholar]
- [11].Wan Q, Okashah N, Inoue A, Nehme R, Carpenter B, Tate CG, Lambert NA, Mini G protein probes for active G protein-coupled receptors (GPCRs) in live cells, J. Biol. Chem 293 (19) (2018) 7466–7473. [DOI] [PMC free article] [PubMed] [Google Scholar]
- [12].Carpenter B, Tate CG, Engineering a minimal G protein to facilitate crystallisation of G protein-coupled receptors in their active conformation, Protein Eng. Des. Selection: PEDS 29 (12) (2016) 583–594. [DOI] [PMC free article] [PubMed] [Google Scholar]
- [13].Nehme R, Carpenter B, Singhal A, Strege A, Edwards PC, White CF, Du H,Grisshammer R, Tate CG, Mini-G proteins: novel tools for studying GPCRs in their active conformation, PLoS ONE 12 (4) (2017) e0175642. [DOI] [PMC free article] [PubMed] [Google Scholar]
- [14].Wouters E, Walraed J, Robertson MJ, Szpakowska M, Chevigné A, Skiniotis G, Assessment of biased agonism among distinct synthetic cannabinoid receptor scaffolds, ACS Pharmacol. Transl. Sci (2019). [DOI] [PMC free article] [PubMed] [Google Scholar]
- [15].Gao ZG, Blaustein JB, Gross AS, Melman N, Jacobson KA, N6-Substituted adenosine derivatives: selectivity, efficacy, and species differences at A3 adenosine receptors, Biochem. Pharmacol 65 (10) (2003) 1675–1684. [DOI] [PMC free article] [PubMed] [Google Scholar]
- [16].Tchilibon S, Kim SK, Gao ZG, Harris BA, Blaustein JB, Gross AS, Duong HT,Melman N, Jacobson KA, Exploring distal regions of the A3 adenosine receptor binding site: sterically constrained N6-(2-phenylethyl)adenosine derivatives as potent ligands, Bioorg. Med. Chem 12 (9) (2004) 2021–2034. [DOI] [PMC free article] [PubMed] [Google Scholar]
- [17].Daly JW, Padgett W, Thompson RD, Kusachi S, Bugni WJ, Olsson RA, Structure-activity relationships for N6-substituted adenosines at a brain A1-adenosine receptor with a comparison to an A2-adenosine receptor regulating coronary blood flow, Biochem. Pharmacol 35 (15) (1986) 2467–2481. [DOI] [PubMed] [Google Scholar]
- [18].Cannaert A, Franz F, Auwarter V, Stove CP, Activity-based detection of consumption of synthetic cannabinoids in authentic urine samples using a stable cannabinoid reporter system, Anal. Chem 89 (17) (2017) 9527–9536. [DOI] [PubMed] [Google Scholar]
- [19].Cannaert A, Storme J, Franz F, Auwarter V, Stove CP, Detection and activity profiling of synthetic cannabinoids and their metabolites with a newly developed bioassay, Anal. Chem 88 (23) (2016) 11476–11485. [DOI] [PubMed] [Google Scholar]
- [20].Dixon AS, Schwinn MK, Hall MP, Zimmerman K, Otto P, Lubben TH,Butler BL, Binkowski BF, Machleidt T, Kirkland TA, Wood MG, Eggers CT,Encell LP, Wood KV, NanoLuc complementation reporter optimized for accurate measurement of protein interactions in cells, ACS Chem. Biol 11 (2) (2016) 400–408. [DOI] [PubMed] [Google Scholar]
- [21].Storme J, Tosh DK, Gao ZG, Jacobson KA, Stove CP, Probing structure-activity relationship in beta-arrestin2 recruitment of diversely substituted adenosine derivatives, Biochem. Pharmacol 158 (2018) 103–113. [DOI] [PMC free article] [PubMed] [Google Scholar]
- [22].Storme J, Cannaert A, Van Craenenbroeck K, Stove CP, Molecular dissection of the human A3 adenosine receptor coupling with beta-arrestin2, Biochem. Pharmacol 148 (2018) 298–307. [DOI] [PubMed] [Google Scholar]
- [23].Ehlert FJ, On the analysis of ligand-directed signaling at G protein-coupled receptors, Naunyn-Schmiedeberg’s Arch. Pharmacol 377 (4–6) (2008) 549–577. [DOI] [PubMed] [Google Scholar]
- [24].Jacobson KA, Klutz AM, Tosh DK, Ivanov AA, Preti D, Baraldi PG, Medicinal chemistry of the A3 adenosine receptor: agonists, antagonists, and receptor engineering, Handb. Exp. Pharmacol 193 (2009) 123–159. [DOI] [PMC free article] [PubMed] [Google Scholar]
- [25].Volpini R, Dal Ben D, Lambertucci C, Taffi S, Vittori S, Klotz KN, Cristalli G, N6-methoxy-2-alkynyladenosine derivatives as highly potent and selective ligands at the human A3 adenosine receptor, J. Med. Chem 50 (6) (2007) 1222–1230. [DOI] [PubMed] [Google Scholar]
- [26].Gao ZG, Jacobson KA, Translocation of arrestin induced by human A(3) adenosine receptor ligands in an engineered cell line: comparison with G protein-dependent pathways, Pharmacol. Res 57 (4) (2008) 303–311. [DOI] [PMC free article] [PubMed] [Google Scholar]
- [27].Gao ZG, Ye K, Goblyos A, Ijzerman AP, Jacobson KA, Flexible modulation of agonist efficacy at the human A3 adenosine receptor by the imidazoquinoline allosteric enhancer LUF6000, BMC Pharmacol 8 (2008) 20. [DOI] [PMC free article] [PubMed] [Google Scholar]
- [28].Gao ZG, Kim SK, Biadatti T, Chen W, Lee K, Barak D, Kim SG, Johnson CR, Jacobson KA, Structural determinants of A(3) adenosine receptor activation: nucleoside ligands at the agonist/antagonist boundary, J. Med. Chem 45 (20) (2002) 4471–4484. [DOI] [PMC free article] [PubMed] [Google Scholar]
- [29].Hill SJ, Williams C, May LT, Insights into GPCR pharmacology from the measurement of changes in intracellular cyclic AMP; advantages and pitfalls of differing methodologies, Br. J. Pharmacol 161 (6) (2010) 1266–1275. [DOI] [PMC free article] [PubMed] [Google Scholar]
- [30].Gao ZG, Verzijl D, Zweemer A, Ye K, Goblyos A, Ijzerman AP, Jacobson KA, Functionally biased modulation of A(3) adenosine receptor agonist efficacy and potency by imidazoquinolinamine allosteric enhancers, Biochem. Pharmacol 82 (6) (2011) 658–668. [DOI] [PMC free article] [PubMed] [Google Scholar]


