

Abstract
Crustaceans have been long used as model animals for neuromodulation studies because of their well-defined neural circuitry. The identification of small molecule metabolites and signaling molecules in circulating fluids and neuronal tissues presents unique challenges due to their diverse structures, biological functions, and wide range of concentrations. LC combined with high resolution MS/MS is one of the powerful tools to uncover endogenous small molecules. Here we explored several sample preparation techniques (solid-phase extraction and denaturing) and MS data acquisition strategies (data-dependent acquisition and targeted MS2-based acquisition) that provided complementary coverage and improved overall identification rate in C18 LC-MS/MS experiment. By MS/MS spectral matching with mzCloud database and those generated from standard compounds, a total of 129 small molecule metabolites and neurotransmitters were identified from crustacean hemolymph and neuronal tissues. These confidently identified small molecules covered predominant biosynthetic pathways for major neurotransmitters, validating the effectiveness of the high-throughput RPLC-MS/MS approach in studying the metabolism of neurotransmitters.
Keywords: LC-MS/MS, metabolites, neurotransmitters, profiling, identification
1. Introduction
Small molecule metabolites and neurotransmitters play essential roles in physiological regulation processes, including neural signaling, biological development and behavioral control [1-3]. Study of these molecules improves understanding of their functions in the nervous system and will ultimately aid in developing therapeutic strategies for neurological disorders, such as Alzheimer’s disease [4, 5] and Parkinson’s disease [6, 7].
As one of the valuable model organisms, crustaceans have been used in neurobiological and electrophysiological studies for many years [8-10]. The well-defined neuronal circuitry and relatively simple nervous system enable functional studies at the single cell and neural network levels. As signaling molecules, crustacean neuropeptides and their functions have been well-characterized in various regulatory processes, such as feeding and stress exposure [11-16]. Previous studies have been mainly focused on the identification and/or quantification of biogenic amines in crustaceans using various analytical methods, including fluorescent spectroscopy [17], colorimetric test [18], paper chromatography [19, 20], thin layer chromatography [21, 22], histochemical fluorescence technique [23, 24], electrophoresis [25, 26], HPLC with electrochemical detection [27, 28], and immunocytochemistry [29]. In addition to these diverse techniques, mass spectrometry has become an emerging tool for monoamine analysis in lobster tissues [30, 31]. Recently a multifaceted mass spectrometric approach [32] was developed and enabled successful identification of endogenous small molecules in crustacean hemolymph. Although small molecule metabolites and neurotransmitters in crustaceans have been studied, the large-scale profiling and confident identification of those compounds using a single analytical platform has not been demonstrated. The focus of this research is to develop an LC-MS/MS based global profiling and label-free identification method for endogenous small molecule metabolites, including typical neurotransmitters, in crustacean model systems.
High-throughput detection and identification of small molecules face tremendous challenges due to their diverse physiochemical properties and wide range of abundance levels. To address these challenges, a plethora of separation techniques (e.g., CE, GC and LC) and detection methodologies (e.g., NMR and MS), have been developed and integrated to obtain enhanced chemical information for more confident assignment [33-41]. MS imaging (MSI) has provided another powerful approach due to its ability to enable visualization of molecular distributions within anatomical context [42-44]. The application of ambient MS enables real-time metabolite analysis with little sample preparation in clinical studies and disease diagnostics [45]. Among a variety of methods, LC coupled with high resolution mass analyzers has been widely applied in bioanalytical field [46, 47]. Compared with another commonly used technique NMR, MS enables detection and quantification of molecules present at lower concentrations [48, 49], which is more suitable for low abundance molecular analysis in small crustacean tissues. While chemical derivatization isotopic tags have been used to enrich specific types of molecules with enhanced signal and improved throughput [50-52], label-free analysis minimizes sample loss brought by extra derivatization steps. The acquired retention times (RTs), molecular masses and MS/MS spectra in an LC-MS/MS experiment provide multidimensional information for compound identification. Researchers have successfully detected neurotransmitters in several animals by employing stable isotope-encoded internal standards (ISs) via RT alignment [53-56]. However, this approach is usually costly and restrained by limited kinds of accessible isotope-labeled standards. Another useful strategy is to compare detected MS/MS spectra with spectral library. Several online databases, e.g., Human Metabolome Database (HMDB) [57], Metlin [58], and MetFrag [59], produce in silico fragmentation patterns of metabolites and CID MS/MS spectra generated from Q-TOF and/or QQQ instruments. Although the structural information is shown for comparison, there is no quantitative or objective assessment of similarity between a reference and an experimental spectrum.
The intricate nature of a biological system presents inherent difficulty for small molecule identification interfered with matrix effect. Many sample preparation methods have proven to be effective removing proteins, lipids and salts. A common strategy involves organic solvent extraction [60] to allow deproteinization. Small molecules can then be easily separated from small proteins and peptides through molecular weight cut-off (MWCO) filters. To detect low abundance molecules, extra separation steps are usually necessary. Solid phase extraction (SPE) is one of the most prevalent approaches for sample cleanup and compound enrichment according to pKa [61]. In this study, we utilized an SPE with Mixed-Mode Cation eXchange (MCX) sorbent to separate basic compounds from neutral/acidic components in sample extracts. The performance of MCX was also compared with a Hydrophilic-Lipophilic Balanced (HLB) reversed-phased sorbent packed SPE in the detection of neurotransmitters.
In vivo metabolism is dynamic and fast-changing due to enzyme-catalyzed biochemical processes. Therefore, the accurate measurement of small molecules requires maximum preservation of original states. Immediate quenching or denaturing after sampling is effective to prevent degradation as it quickly deactivates enzymes at high temperature. Without the need to add additional substances, heat stabilization offers instant and homogenous preservation that makes it superior to other methods like snap freezing and inhibitor binding [62].
In this work, we couple C18 reversed phase liquid chromatography with high resolution accurate mass Orbitrap mass spectrometry to study small molecule metabolites and neurotransmitters in rock crab Cancer irroratus neuronal tissues and hemolymph. Although polar compounds tend to elute early on a C18 column, the fast scan rate in Orbitrap instrument allows molecules isolation and fragmentation on the chromatography time scale. To improve coverage, analytes were separated into two fractions (neutral/acidic and basic fractions) depending on their physiochemical properties analyzed in both positive and negative ESI modes. The identification confidence score was generated by comparing experimental MS/MS spectra with the reference HCD MS/MS spectrum in the mzCloud database. The effectiveness of denaturing via heat stabilization was evaluated. Overall, we demonstrated success of the developed methodology in identification and structure elucidation of endogenous small molecules.
2. Materials and Methods
2.1. Chemicals and materials
ACS plus certified ammonium hydroxide, Optima grade acetic acid (HAc), formic acid (FA), acetonitrile, methanol (MeOH) and water were purchased from Fisher Scientific (Fair Lawn, NJ, USA). Amicon 3K MWCO was from Sigma–Aldrich (St. Louis, MO, USA). Waters Oasis 1cc MCX and HLB cartridges were purchased from Waters Corporation (Milford, MA, USA). A Thermo Scientific Hypersil GOLD C18 column (2.1mm×100mm, 1.7 μm) was used for LC separation.
2.2. Animal experiment
Rock crab Cancer irroratus were purchased from Ocean Resources Inc. (Sedgwick, ME, USA) and kept in artificial saline water. All animal experiments were operated following institutional guidelines (University of Wisconsin-Madison IACUC). Crabs were anesthetized in ice for 20 min before sample collection. Aliquot of 400 μL hemolymph was withdrawn with a syringe from legs of rock crab and stored in dry ice. Another crab was sacrificed for tissue collection, including one brain, one thoracic ganglia (TG), one stomatogastric ganglion (STG), one pair of commissural ganglion (CoG), one pair of pericardial organs (PO) and one pair of the sinus glands (SG). Tissues were put in 100 μL acidified methanol (MeOH/H2O/HAc = 90/9/1, v/v/v) before transferring to dry ice. All samples were stored in −80 °C freezer until further handling.
2.3. Sample preparation
Hemolymph was mixed with 400 μL acidified methanol after thawing on ice. Tissues and hemolymph were probe sonicated at 4 °C with a sonic dismembrator (Fisher Scientific, Pittsburgh, PA, USA) with 8 s on 15 s off pulse for 3 times. After centrifugation (18000g, 15 min, 4 °C) hemolymph extract was dried down using a Savant SC 110 Speedvac (Thermo Electron Corporation, Waltham, MA, USA). Tissue supernatants were mixed with 85 μL Optima water then transferred to 3k Da Molecular Weight Cut-off (MWCO) filters (pre-rinsed with Optima water) and further spun for 30 min with 14000 g at 4 °C. MWCO filter was rinsed by 50 μL MeOH/H2O (50/50, v/v) and spun again (14000 g, 15 min, 4 °C). Tissue extracts were then dried down.
To perform MCX SPE, extracts were first resuspended in 500 μL 2% FA in water then transferred into cartridge that was preconditioned by 1 mL MeOH and 2 mL water. After washing by 2 mL 2% FA in water, neutral and acidic compounds (fraction 1) were eluted by 1.5 mL MeOH and basic compounds (fraction 2) eluted by 1.5 mL 5% NH4OH in MeOH. Both fractions were dried down and dissolved in 100 μL 0.1% FA water for LC-MS/MS analysis. The HLB SPE separation was conducted as following steps: 1 mL sample was loaded into cartridge preconditioned by 1 mL MeOH/H2O (50/50, v/v), 1 mL MeOH/H2O (5/95, v/v) was used in washing step, small molecules were eluted by 1 mL MeOH. The sample was dried down and resuspended in 0.1% FA H2O for LC-MS/MS analysis. The workflow is illustrated in Figure 1.
Figure 1.
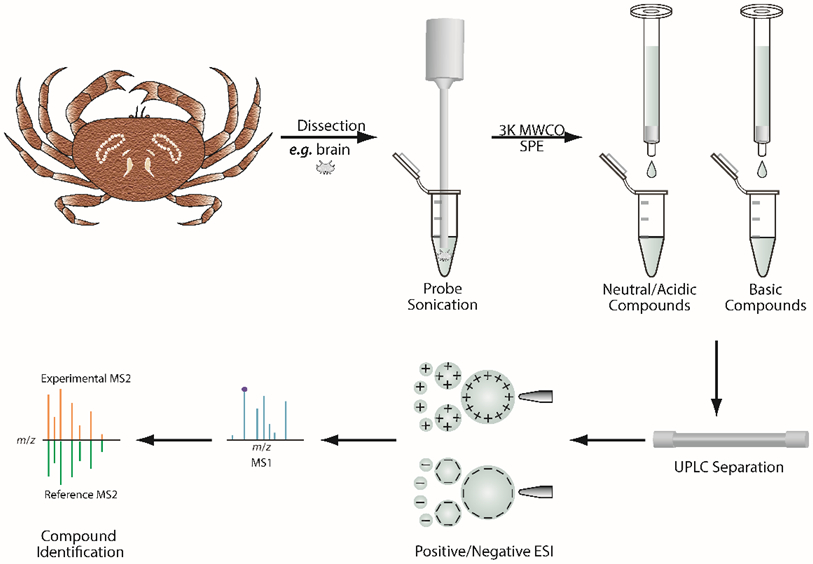
Sample preparation and data analysis workflow.
The denaturing of neuronal tissues was performed with Stabilizor T1 (Denator AB, Uppsala, Sweden) in fresh (structure preserve) mode. Immediately after dissection, three brain and TG tissues were denatured and transferred in 100 μL acidified methanol and stored in dry ice. As control, the other three dissected brain and TG tissues were directly stored in 100 μL acidified methanol to deactivate enzymatic activities. Following sample preparation and analysis steps mentioned before, the compounds in basic fraction with significant EIC area changes have been discovered.
2.4. LC-MS/MS analysis
With 10 μL injection amount, extract of each tissue/hemolymph was subjected to LC-MS/MS analysis using Thermo Q Exactive Orbitrap mass spectrometer (Thermo Scientific) interfaced with Dionex UltiMate 3000 LC system. Molecules were separated by C18 column at 30 °C using a flow rate of 0.450 mL/min with mobile phase A as 0.1% FA water and mobile phase B (MPB) being 0.1% FA ACN. The binary gradient was set as follows: 0-2 min, 0% MPB; 2-5 min, 0-0.5% MPB; 5-10 min, 0.5-5% MPB; 10-13min, 5-98% MPB; 13-16 min, 98% MPB; 16-24 min, 0% MPB for column conditioning. A top 5 data-dependent acquisition (DDA) method was used with an inclusion list of 46 compounds of interest. Full MS scan (m/z 70-1000) was acquired with a resolution of 70 K, AGC target of 1e6 and maximum injection time of 100 msec. For MS/MS scans, the following parameters were used: dynamic exclusion 6.0 s, isolation window 0.5 m/z, normalized collision energy 30, resolution 17.5 K, AGC target 1e5, maximum injection time 100 msec, and underfill ratio 10%. To acquire MS/MS spectra of low abundance compounds, a parallel-reaction monitoring (PRM) method was employed to achieve best sensitivity.
Raw data from DDA experiments were processed by Compound Discoverer 2.0 software with a workflow shown in Figure S1 for MS/MS spectral comparison and small molecule identification.
3. Results and Discussion
3.1. Selection of SPE cartridge
To select a proper SPE capable of separating compounds, removing salt and proteins as well as reducing matrix effect in complex samples, two SPE cartridges (MCX and HLB) were compared before targeted LC-MS/MS analysis of typical neurotransmitters (acetylcholine, GABA, serotonin and dopamine) in hemolymph extract. 3 mL of hemolymph was withdrawn from two rock crabs and boiled in hot water for 5 min to eliminate enzymatic activities. Then 3 mL of solvent (MeOH/H2O = 10/1, v/v) was added into hemolymph and probed sonicated. Supernatant was collected and aliquoted into three parts. The dried first aliquot went through MCX SPE cartridge; the dried second aliquot was reconstituted in 1 mL 2% FA for HLB SPE cleanup; the third aliquot was purified by HLB SPE directly. Owing to the complex mixture of analytes, only when using MCX SPE not HLB SPE could dopamine be detected and fragmented, as shown in Figure S2a) and b). Figure S2c) demonstrates using mzCloud database for dopamine MS/MS fragment ion assignment. The four annotated fragments match well with reference spectra, leading to confident identification of dopamine in crustacean hemolymph. To test if acidified MeOH extraction and following MCX SPE step is applicable to future quantitative studies, absolute quantification of serotonin in a rock crab brain was performed using internal standard (IS) method. Based on the EIC area of IS (d4-serotonin) and serotonin in samples and calibration curve generated from different ratios of serotonin and IS mixture (illustrated in Figure S3), the concentration of serotonin in 50 μL 0.1% FA water was found to be 1.212 ± 0.008 μg/mL. The amount of serotonin in this brain was determined to be 60.60 ±0.40 ng. The result is an order of magnitude greater than 2.1 ng per brain in previous study [17] where rock crab brain serotonin was quantified via its fluorescence signal. While the difference is likely due to biological variation, it is also possible that there was sample loss in previous study suffered from multistep extraction and separation.
3.2. Small molecules identified in two MCX SPE fractions
The confident identification of small molecules requires structural information provided by MS/MS spectra due to the complexity of biological system and interference from coeluting isomers. A mix-mode column was tested (TIC shown in Figure S4 and experimental details mentioned in figure caption) for LC-MS but we found the mobile phase used for C18 column generates more stable baseline (illustrated in Figure S5). When using a C18 column for separation, many hydrophilic molecules would barely retain on the column and elute at the very beginning, bringing difficulties in isolating and detecting all compounds. The use of MCX SPE helps reduce sample complexity as small molecules in samples are separated into two fractions according to their distinct physicochemical properties. Then both positive and negative ESI modes allowed more comprehensive identification of analytes. The acquired MS/MS spectra were searched against reference spectra of endogenous metabolites. A list of all 129 identified molecules with corresponding mzCloud score can be found in Table S1. Considering the varying compound abundance levels among different tissues (shown in Figure S5 with distinct TIC profiles) and precursor intensity dependent MS/MS acquisition, MS/MS spectra of certain metabolites were not detected in all samples. However, if the compound was identified from one tissue sample with confident MS/MS fragmentation pattern, we were able to assign its identity in other tissue samples based on retention time alignment and accurate MS1 mass matching, if the compound MS/MS was not available. Figure S6 shows the number of compounds identified in each fraction. Although several molecules were identified in both fractions, the basic fraction provided the highest number of identifications. The analysis of both fractions was beneficial as it offered cross validation for the unknown components.
mzCloud database enables confident assignment of MS/MS spectra. The database reference spectra were acquired by analyzing standard compounds in Orbitrap under different collision dissociation parameters and the generated spectra were filtered and recalibrated to reduce fragmented ion dissimilarities caused by various internal energies. Both m/z values and relative abundance of fragment ions were considered when calculating the confidence score. The generated score (out of 100) serves as a useful tool to evaluate MS/MS spectral quality and similarity to the reference spectra, as shown in Figure 2. MS/MS spectra with high scores (typically greater than 75) revealed good accordance with standard compounds and enabled confident identification.
Figure 2.

Identification of small molecule neurotransmitters in samples by searching high resolution HCD MS/MS spectra (top) against reference spectra (bottom) from mzCloud database. Four neurotransmitters are shown with good matching between experimental and reference fragmentation spectra, including a) GABA, b) acetylcholine, c) L-DOPA and d) histamine.
3.3. Small molecule neurotransmitters in crustacean neuronal tissues and hemolymph
Crustacean nervous system shares many small molecule neurotransmitters employed by vertebrates. To further validate the results, standard compounds (acetylcholine, γ-aminobutyric acid, choline, dopamine, glutamine, histidine, 5-hydroxytryptophan, serotonin, tryptophan and tyrosine) were mixed, dissolved in water and injected onto LC for separation and subsequent MS analysis. The retention time (RT) of standards were recorded and compared with identified compounds. RT verified compounds were marked in Supporting Information Table S1. For most molecules identified by Compound Discoverer software, RT matches well with standards except the case of serotonin. Two isobaric peaks with [M+H]+ of m/z 177.1022, eluted at 2.5 min and 2.85 min respectively, share common fragment ion m/z 160.0759 generated from neutral loss of NH3. By spiking d4-serotonin standard into real sample, we confirmed that the peak eluted at 2.50 min corresponded to serotonin (Figure S7). However, Compound Discoverer misidentified the peak at 2.85 min as serotonin. Similar situation happened for 5-hydroxytryptophan with standard compound RT being 2.52 min while software assigned peak at 3.7 min for identification. These are the cases showing the deficiency of identification depending only on MS/MS spectra without RT information. Although in most cases, compound identification based on high quality MS/MS is more reliable than accurate mass matching by MS alone. Figure 3 illustrates typical metabolic pathways involved in neurotransmitter synthesis [63]. The confirmed existence of these molecules may help understand how crustacean neurons communicate with each other. While most compounds in Figure 3 distribute universally among six tissues and hemolymph. It was noticeable that 5-hydroxytryptophan was not detected in the STG, CoG and SG. Considering the tiny size of those tissues, this might be caused by sample loss during extraction and cleanup steps. Furthermore, MS/MS spectra of two biogenic amines (norepinephrine and epinephrine) were not detected with the given method, although previous study reported on the detection of norepinephrine in crustacean brains and eyestalks utilizing electrochemical detection [27].
Figure 3.

Metabolic pathways of major known small molecules involved in neurotransmitter synthesis. Neurotransmitters and their precursors detected in crustacean neuronal tissues and hemolymph are labeled.
3.4. Effects of denaturing
To better preserve metabolic phenotypes in biological samples, tissues were treated by Stabilizor T1 to deactivate enzymes that catalyze degradation. In denaturing procedure, the fresh tissue underwent high temperature (~95 °C) for a short period of time (~1 min, depending on tissue size). Since the analysis of basic fraction in positive mode offers the largest number of identifications, the data were acquired under the same condition to evaluate the effect of denaturing. The effectiveness of this sample preparation method was measured by calculating normalized EIC area of compounds detected in tissues with and without denaturing. Molecules with significant level changes (p-value < 0.05) are listed in Supporting Information Table S2a) and S2b). For compounds with a relatively short half-life time, such as adenosine and choline, denaturing is highly beneficial to preserve the integrity of the original sample and can yield higher level of concentration in the heat stabilized samples compared to untreated samples. In this experiment, both adenine and adenosine which belong to adenine and adenosine salvage pathways exhibited elevated levels after denaturing. While adenine level change was within two-fold, adenosine exhibited a larger fold change, possibly because denaturing helps preserve compounds with shorter half-life. Coverages of compounds detected in denaturing and non-denaturing samples were also compared, as shown in Figure 4. Although the majority of the components in both samples were the same, the non-denaturing tissues showed apparent evidence of degradation. For instance, 5-aminovaleric acid was a lysine degradation product. Additionally, prolylglycine resulted from proteolytic breakdown of larger proteins. Similarly, protein digestion/catabolism produced alanyltyrosine. Oxidation also occurred during sample handling process as cystine was an oxidized dimeric form of cysteine. These results suggested that denaturing step helped to best preserve the in vivo states and prevent degradation enzymes from altering the state of metabolism being investigated in the system.
Figure 4.

Venn diagram shows the effect of denaturing treatment and distinct yet overlap identifications of small molecules from brain and thoracic ganglion tissues with or without denaturing treatment.
4. Concluding Remarks
In summary, we employed separation techniques, SPE and LC, coupled with high-resolution accurate mass Orbitrap instrument for metabolite and neurotransmitter identifications in crustacean nervous system and circulating fluid. Compounds detected were further validated with mzCloud database which offers reference spectra comparison and numeric score evaluation. A total of 129 small molecules were identified with confidence. Among them, 13 compounds are involved in six pathways for neurotransmitter biosynthesis. The success of separation and identification of these endogenous small molecules in complex samples demonstrated the versatility of the developed method. The future follow-up studies on dynamic changes of these metabolites and neurotransmitters under different physiological processes would improve our understanding about molecular mechanism underlying neural signaling and reveal specific functions of these signaling molecules.
Supplementary Material
Acknowledgements
We thank Molly Pellitteri Hahn and Dr. Cameron O Scarlett from Analytical Instrumentation Center in the School of Pharmacy at UW-Madison for instrument maintenance and helpful suggestions. Q. C. gratefully acknowledges a former Li Lab member Dr. Ling Hao for scientific discussions. This work was supported by the National Institutes of Health grants R01 DK071801 and S10RR029531. L. L. thanks a Vilas Distinguished Achievement Professorship and Janis Apinis Professorship with funding provided by the Wisconsin Alumni Research Foundation and University of Wisconsin-Madison School of Pharmacy.
Footnotes
Supporting Information is available in the online version of this article at the publisher’s web site.
The authors have declared no conflict of interest.
5 References
- [1].Graybiel AM, Trends in Neurosciences 1990, 13, 244–254. [DOI] [PubMed] [Google Scholar]
- [2].Lauder JM, Trends in Neurosciences 1993, 16, 233–240. [DOI] [PubMed] [Google Scholar]
- [3].Nutt DJ, The Journal of clinical psychiatry 2008, 69, 4–7. [PubMed] [Google Scholar]
- [4].Reinikainen KJ, Soininen H, Riekkinen PJ, Journal of Neuroscience Research 1990, 27, 576–586. [DOI] [PubMed] [Google Scholar]
- [5].Francis PT, Palmer AM, Snape M, Wilcock GK, Journal of Neurology, Neurosurgery & Psychiatry 1999, 66, 137–147. [DOI] [PMC free article] [PubMed] [Google Scholar]
- [6].Remy P, Doder M, Lees A, Turjanski N, Brooks D, Brain 2005, 128, 1314–1322. [DOI] [PubMed] [Google Scholar]
- [7].Brichta L, Greengard P, Flajolet M, Trends in Neurosciences 2013, 36, 543–554. [DOI] [PubMed] [Google Scholar]
- [8].Atwood HL, American Zoologist 1967, 7, 527–551. [Google Scholar]
- [9].Quackenbush LS, Canadian Journal of Fisheries and Aquatic Sciences 1986, 43, 2271–2282. [Google Scholar]
- [10].Rajashekhar KP, Wilkens JL, Journal of Neurobiology 1992, 23, 680–691. [DOI] [PubMed] [Google Scholar]
- [11].Chen R, Hui L, Cape SS, Wang J, Li L, ACS Chemical Neuroscience 2010, 1, 204–214. [DOI] [PMC free article] [PubMed] [Google Scholar]
- [12].Webster S, The Journal of Experimental Biology 1996, 199, 1579. [DOI] [PubMed] [Google Scholar]
- [13].Wang J, Zhang Y, Xiang F, Zhang Z, Li L, Journal of Chromatography A 2010, 1217, 4463–4470. [DOI] [PMC free article] [PubMed] [Google Scholar]
- [14].Chung JS, Zmora N, FEBS Journal 2008, 275, 693–704. [DOI] [PubMed] [Google Scholar]
- [15].Chen R, Xiao M, Buchberger A, Li L, Journal of Proteome Research 2014, 13, 5767–5776. [DOI] [PMC free article] [PubMed] [Google Scholar]
- [16].Zhang Y, Buchberger A, Muthuvel G, Li L, PROTEOMICS 2015, 15, 3969–3979. [DOI] [PMC free article] [PubMed] [Google Scholar]
- [17].Welsh JH, Moorhead M, Journal of Neurochemistry 1960, 6, 146–169. [DOI] [PubMed] [Google Scholar]
- [18].Kerkut GA, Price MA, Comparative Biochemistry and Physiology 1961, 3, 315–317. [DOI] [PubMed] [Google Scholar]
- [19].Gersch M, Unger H, Fischer F, Kapitza W, Zeitschrift für Naturforschung B 1963, 18, 587–588. [Google Scholar]
- [20].Kerkut GA, Sedden CB, Walker RJ, Comparative Biochemistry and Physiology 1966, 18, 921–930. [DOI] [PubMed] [Google Scholar]
- [21].Barker DL, Molinoff PB, Kravitz EA, Nature New Biology 1972, 236, 61. [DOI] [PubMed] [Google Scholar]
- [22].Barker DL, Kushner PD, Hooper NK, Brain Research 1979, 161, 99–113. [DOI] [PubMed] [Google Scholar]
- [23].Aramant R, Elofsson R, Cell and Tissue Research 1976, 166, 1–24. [DOI] [PubMed] [Google Scholar]
- [24].Aramant R, Elofsson R, Cell and Tissue Research 1976, 170, 231–251. [DOI] [PubMed] [Google Scholar]
- [25].Sullivan RE, Life Sciences 1978, 22, 1429–1437. [DOI] [PubMed] [Google Scholar]
- [26].Livingstone MS, Schaeffer SF, Kravitz EA, Developmental Neurobiology 1981, 12, 27–54. [DOI] [PubMed] [Google Scholar]
- [27].Laxmyr L, Comparative Biochemistry and Physiology Part C: Comparative Pharmacology 1984, 77, 139–143. [DOI] [PubMed] [Google Scholar]
- [28].Elofsson R, Laxmyr L, Rosengren E, Hansson C, Comparative Biochemistry and Physiology Part C: Comparative Pharmacology 1982, 71, 195–201. [Google Scholar]
- [29].Siwicki K, Beltz B, Kravitz E, The Journal of Neuroscience 1987, 7, 522–532. [DOI] [PMC free article] [PubMed] [Google Scholar]
- [30].Juorio AV, Sloley BD, Brain Research 1988, 444, 380–382. [DOI] [PubMed] [Google Scholar]
- [31].Friedman RN, Shank RP, Freeman AR, Brain Research 1981, 214, 101–111. [DOI] [PubMed] [Google Scholar]
- [32].Jiang S, Liang Z, Hao L, Li L, ELECTROPHORESIS 2016, 37, 1031–1038. [DOI] [PMC free article] [PubMed] [Google Scholar]
- [33].Fernie AR, Trethewey RN, Krotzky AJ, Willmitzer L, Nat Rev Mol Cell Biol 2004, 5, 763–769. [DOI] [PubMed] [Google Scholar]
- [34].Exarchou V, Godejohann M, van Beek TA, Gerothanassis IP, Vervoort J, Analytical Chemistry 2003, 75, 6288–6294. [DOI] [PubMed] [Google Scholar]
- [35].van der Hooft JJJ, Mihaleva V, de Vos RCH, Bino RJ, Vervoort J, Magnetic Resonance in Chemistry 2011, 49, S55–S60. [DOI] [PubMed] [Google Scholar]
- [36].Liu H, Zheng A, Liu H, Yu H, Wu X, Xiao C, Dai H, Fuhua H, Zhang L, Wang Y, Tang H, Identification of Three Novel Polyphenolic Compounds, Origanine A-C, with Unique Skeleton from Origanum vulgare L. Using the Hyphenated LC-DAD-SPE-NMR/MS Methods, 2011. [DOI] [PubMed]
- [37].WeiJin Y, YaWei W, Zhou Q, Tang H, Analysis of human urine metabolites using SPE and NMR spectroscopy, 2008.
- [38].Liu G, Zheng M, Cai Z, Occurrence, profile and possible sources of PCNs in Hong Kong soils, and a comparison with PCBs, PCDDs and PCDFs, 2014. [DOI] [PubMed]
- [39].Towhidi F, Cai Z, GC/MS analysis of triclosan and its degradation by-products in wastewater and sludge samples from different treatments, 2015. [DOI] [PubMed]
- [40].Ramautar R, Berger R, van der Greef J, Hankemeier T, Current Opinion in Chemical Biology 2013, 17, 841–846. [DOI] [PubMed] [Google Scholar]
- [41].Scalbert A, Brennan L, Fiehn O, Hankemeier T, Kristal BS, van Ommen B, Pujos-Guillot E, Verheij E, Wishart D, Wopereis S, Metabolomics 2009, 5, 435. [DOI] [PMC free article] [PubMed] [Google Scholar]
- [42].Ye H, Wang J, Greer T, Strupat K, Li L, ACS Chemical Neuroscience 2013, 4, 1049–1056. [DOI] [PMC free article] [PubMed] [Google Scholar]
- [43].Sugiyama E, Masaki N, Matsushita S, Setou M, Analytical Chemistry 2015, 87, 11176–11181. [DOI] [PubMed] [Google Scholar]
- [44].Shariatgorji M, Strittmatter N, Nilsson A, Källback P, Alvarsson A, Zhang X, Vallianatou T, Svenningsson P, Goodwin RJA, Andren PE, NeuroImage 2016, 136, 129–138. [DOI] [PubMed] [Google Scholar]
- [45].Clendinen CS, Monge ME, Fernandez FM, Analyst 2017, 142, 3101–3117. [DOI] [PMC free article] [PubMed] [Google Scholar]
- [46].Xiao JF, Zhou B, Ressom HW, TrAC Trends in Analytical Chemistry 2012, 32, 1–14. [DOI] [PMC free article] [PubMed] [Google Scholar]
- [47].Zang X, Monge ME, McCarty NA, Stecenko AA, Fernández FM, Journal of Proteome Research 2017, 16, 550–558. [DOI] [PubMed] [Google Scholar]
- [48].Dettmer K, Aronov PA, Hammock BD, Mass Spectrometry Reviews 2007, 26, 51–78. [DOI] [PMC free article] [PubMed] [Google Scholar]
- [49].Cajka T, Fiehn O, Analytical Chemistry 2015. [DOI] [PubMed]
- [50].Guo K, Ji C, Li L, Analytical Chemistry 2007, 79, 8631–8638. [DOI] [PubMed] [Google Scholar]
- [51].Guo K, Li L, Analytical Chemistry 2010, 82, 8789–8793. [DOI] [PubMed] [Google Scholar]
- [52].Hao L, Zhong X, Greer T, Ye H, Li L, Analyst 2015, 140, 467–475. [DOI] [PMC free article] [PubMed] [Google Scholar]
- [53].Zhu KY, Fu Q, Leung KW, Wong ZCF, Choi RCY, Tsim KWK, Journal of Chromatography B 2011, 879, 737–742. [DOI] [PubMed] [Google Scholar]
- [54].Tareke E, Bowyer JF, Doerge DR, Rapid Communications in Mass Spectrometry 2007, 21, 3898–3904. [DOI] [PubMed] [Google Scholar]
- [55].Wei B, Li Q, Fan R, Su D, Chen X, Jia Y, Bi K, Journal of Pharmaceutical and Biomedical Analysis 2014, 88, 416–422. [DOI] [PubMed] [Google Scholar]
- [56].Huang F, Li J, Shi H. l., Wang T. t., Muhtar W, Du M, Zhang B. b., Wu H, Yang L, Hu Z. b., Wu X. j., Journal of Neuroscience Methods 2014, 229, 8–14. [DOI] [PubMed] [Google Scholar]
- [57].Wishart DS, Tzur D, Knox C, Eisner R, Guo AC, Young N, Cheng D, Jewell K, Arndt D, Sawhney S, Fung C, Nikolai L, Lewis M, Coutouly M-A, Forsythe I, Tang P, Shrivastava S, Jeroncic K, Stothard P, Amegbey G, Block D, Hau DD, Wagner J, Miniaci J, Clements M, Gebremedhin M, Guo N, Zhang Y, Duggan GE, MacInnis GD, Weljie AM, Dowlatabadi R, Bamforth F, Clive D, Greiner R, Li L, Marrie T, Sykes BD, Vogel HJ, Querengesser L, Nucleic Acids Research 2007, 35, D521–D526. [DOI] [PMC free article] [PubMed] [Google Scholar]
- [58].Smith CA, Maille GO, Want EJ, Qin C, Trauger SA, Brandon TR, Custodio DE, Abagyan R, Siuzdak G, Therapeutic Drug Monitoring 2005, 27, 747–751. [DOI] [PubMed] [Google Scholar]
- [59].Wolf S, Schmidt S, Müller-Hannemann M, Neumann S, BMC Bioinformatics 2010, 11, 148. [DOI] [PMC free article] [PubMed] [Google Scholar]
- [60].Dunn WB, Broadhurst D, Begley P, Zelena E, Francis-McIntyre S, Anderson N, Brown M, Knowles JD, Halsall A, Haselden JN, Nicholls AW, Wilson ID, Kell DB, Goodacre R, The Human Serum Metabolome, C., Nature Protocols 2011, 6, 1060. [DOI] [PubMed] [Google Scholar]
- [61].Berrueta LA, Gallo B, Vicente F, Chromatographia 1995, 40, 474–483. [Google Scholar]
- [62].Svensson M, Borén M, Sköld K, Fälth M, Sjögren B, Andersson M, Svenningsson P, Andrén PE, Journal of Proteome Research 2009, 8, 974–981. [DOI] [PubMed] [Google Scholar]
- [63].Nicholls JG, Martin AR, Wallace BG, Fuchs PA, From neuron to brain, Sinauer Associates; Sunderland, MA: 2001. [Google Scholar]
Associated Data
This section collects any data citations, data availability statements, or supplementary materials included in this article.