

Abstract
Analysis of the properties of the tongue has been used in traditional Chinese medicine for disease diagnosis. Notably, tongue analysis, which is non-invasive and convenient compared with gastroscopy and pathological examination, can be used to assess chronic gastritis (CG). In order to find potential diagnostic biomarkers and study the metabolic mechanisms of the endogenous small molecules in the tongue coating related to CG, a non-targeted metabolomic analysis method was developed using ultra high performance liquid chromatography combined with quadrupole time-of-flight mass spectrometry (UHPLC-Q/TOF-MS). It was performed using two different columns in positive and negative ion scanning modes separately. The stability of the samples was evaluated and the age and gender factors of the subjects were excluded to ensure the reliability of the data in this study. Finally, under the four analysis models, 130, 229, 113 and 92 differential compounds were found using multivariate statistical methods respectively. 37 potential biomarkers were putatively identified after removing the duplicate compounds and five potential diagnostic biomarkers were putatively identified by receiver operating characteristic (ROC) curve analysis, including inosine, oleamide, adenosine, N-acetylglucosamine (GlcNAc) and xanthine. The main metabolic pathways associated with CG were purine metabolism, amino acid metabolism, sphingolipid metabolism and energy metabolism, which suggested that oxygen free radicals and energy metabolism were altered in patients with CG. These results provided a potential new basis for the quantitative diagnosis and pathogenesis of CG.
Keywords: Metabolomics, Tongue coating, Chronic gastritis, UHPLC-Q/TOF-MS, Diagnostic biomarker
1. Introduction
Chronic gastritis is a chronic inflammation of the gastric mucosa, which is characterized by the infiltration of inflammatory cells and has a high incidence in China [1,2]. The active period of CG is an important precancerous period of gastric cancer, which is one of the most frequently occurring cancers in the world, but the pathogenesis of CG is not clear [3,4]. In terms of current clinical practice, the main method of diagnosis for CG relies on gastroscopy, biopsy and pathological examination. Meanwhile, the biochemical markers that support the diagnosis of CG are only gastrin and pepsinogen derived from gastric juice and blood, respectively, which are generally considered invasive, expensive and time-consuming for the patients [5,6]. Therefore, it is important to find other diagnostic biomarkers that can be detected with a simple, non-invasive and convenient method and to more thoroughly clarify the pathogenesis of CG.
Tongue diagnosis is a diagnostic method through the observation of changes of tongue body, tongue coating and sublingual vein to diagnose diseases. Tongue coating is an important observation object and was used in tongue diagnosis as early as two thousand years ago [7]. It is the grayish white deposit on the tongue surface formed of exfoliated epithelial cells, living epithelial cells, bacteria and saliva [8,9]. In the Traditional Chinese Medicine (TCM) clinic, tongue coating is always considered as the first clue for doctors to make a diagnosis of stomach disease. Its different color and thickness corresponding to different causes of the gastric disease [10,11]. Therefore, the analysis of the tongue coating may provide a clue for the pathogenesis and clinical diagnosis of CG.
Studies related to CG and tongue coating mainly had the following aspects: (1) For the cells of the tongue coating, recent studies found that there was a significant change in apoptosis-related protein levels of the tongue coating cells in CG patients and the formation of the tongue coating was related to the apoptosis. In addition, the ultrastructure of the tongue coating cells also had a significant change in chronic atrophic gastritis (CAG) patients [12,13]. (2) For the microorganism of the tongue coating, 251 differential microorganisms were found by next-generation sequence technology in CG patients with different syndromes. The species Bacillus, a member of the phylum Firmicutes, was found to be a potential diagnostic biomarker for CG patients with yellow tongue coating [14,15]. (3) For the appearance of the tongue coating, the thickness and water content of tongue coating was different between CG patients and the healthy controls. Thus, the automated tongue feature extraction technique was established and believed to be a potential clinical approach to assist the diagnosis of CG [16].
Although these studies showed that there was a significant association between CG and tongue coating, there were few reports about the endogenous small molecules in the tongue coating of CG patients. Metabolomics is a comprehensive and effective technique which can analyze endogenous small molecule metabolites [17,18]. Gas Chromatography-Mass Spectrometer (GC–MS) technology has been used for metabolomics research and four potential differential biomarkers were found based on Helicobacter pylori positive or negative patients with CG [19], but the derivatization needed for this method is tedious and the number of compounds that can be detected is limited. In another study, ten potential biomarkers were identified based on the liquid chromatograph-mass spectrometer (LC–MS) platform only using RPLC separation system with positive ion scanning, which might cause information loss of some components [20].
In view of the current limitations of CG-related studies of the tongue coating and the need for clinical diagnosis, in this study, we performed a comprehensive metabolomics based on the UHPLC-Q/TOF-MS platform. It was performed using two different columns in positive and negative ion modes separately. According to this method, we searched for small molecules that can be the non-invasive and convenient biochemical markers to aid the diagnosis of CG.
2. Materials and methods
2.1. Reagents and materials
HPLC grade acetonitrile was purchased from Fisher (Fair Lawn, NJ, USA), formic acid and ammonium acetate were HPLC grade purchased from Dikma Technologies Inc. (Lake Forest, CA, USA). Purified water was purchased from Wahaha (Zhejiang, Hangzhou, China). SiHuan freeze dryer (LGJ-18A, Beijing, China), ultrasonic cell crusher (VOSHIN92-IIDL, Wuxi, Jiangsu, China) and tissuelyser-192 (Shanghai, China) were performed for the sample processing.
2.2. Study participants
The patients of the CG group (30 cases, 13 males, 17 females) whose mean age was 37 years old (22–63 years) were recruited from Hebei Province Hospital of Traditional Chinese Medicine (Shijiazhuang, China). The healthy volunteers of the healthy controls (HC) group (30 cases, 12 males, 18 females) whose mean age was 33 years old (23–53 years) were college students and the hospital staff recruiting from Hebei Medical University (Shijiazhuang, China) and Hebei Province Hospital of Traditional Chinese Medicine (Shijiazhuang, China). The study was approved by the local ethics committee of Hebei Medical University, (Shijiazhuang, China) and all of the participants signed the informed consent.
The participants who had recently smoked, drank and taken drugs were excluded. The eligible patients’ inclusion criteria were as follows: (1) the patient was diagnosed with CG by a doctor’s diagnosis and gastroscopy, biopsy and pathological examination. (2) the patient had a yellow-greasy tongue coating by the tongue diagnosis. The exclusion criteria for screening patients were as follows: (1) patients who had any oral disease or major organic disease like cancer and heart disease. (2) patients who had any diseases like hypertension, hyperglycemia and hyperlipidemia et. (3) patients who were on unpregnant. The healthy volunteers were diagnosed as healthy by physical examination and doctor’s diagnosis.
2.3. Tongue coating samples collection and handling
All samples were taken from fasting participants at 8 to 10 a.m. The participants were asked to gargle with pure water for three to 5 times before sampling to rinse possible food or saliva that might influence the samples. The tongue coating was collected by scraping the surface of the tongue with a stainless-steel spoon treated by high temperature and high-pressure sterilization. The collected samples were placed in a sterilized centrifuge tube (pre-weighted) containing 2 mL of purified water, sealed and stored at −80 °.
The frozen samples were placed in the freeze dryer to produce freeze-dried powder. Appropriate amounts of freeze-dried powder were weighed and acetonitrile added at a ratio of 1 mg/400 μL, and then treated with an ultrasonic cell crusher (work time 3 s, chill time 7 s) and ground by a tissue grinding machine (frequency 50 Hz, time 60s) to get the mixture. The mixture was centrifuged twice at 15,000 rpm for 10 min at 4 ° to remove the precipitates from the solution. As the quantity of tongue coating sample was limited, the resulting solution was divided into four aliquots, one of which was injected immediately to the UPLC column for analysis. The other three solutions were stored at −20 ° for the other detection models. 5 μL of the supernatant was injected for analysis.
2.4. UHPLC-Q/TOF-MS conditions
The analysis of tongue coating sample was performed on a Shimadzu UHPLC system (Kyoto, Japan) coupled to a hybrid quadrupole time-of-flight tandem mass spectrometer (Triple-TOF 5600+, AB SCIEX, Redwood City, CA, USA). MS was operated using an electrospray ionization source in positive (+) and negative (−) ion detection modes respectively for each chromatographic separation. Two different columns including a HILIC column and a RP (HSS T3) column were used for chromatographic separation. Four chromatographic analysis were performed; HILIC (+) model, HILIC (−) model, HSS T3 (+) model and HSS T3 (−) model.
For the analysis with a HILIC column, the tongue coating samples were separated by a Waters ACQUITY UHPLC® BEH HILIC(2.1 × 100 mm, 1.7 μm;)with the column temperature set at 35 °. The elution solvents were 10 mmol/L ammonium acetate in water (A) and acetonitrile (B) with a flow rate at 300 μL/min. A 20 min elution gradient was run as follows: 0–4 min, 95–95% B;4–13 min, 95–80% B;13–14.5 min, 80–60% B;14.5–15 min, 60–95% B;15–20 min, 95–95% B. The volume of injection was 5 μL and the sample chamber temperature of the autosampler was 4 °.
For the analysis with a RP column, the tongue coating samples were separated by a Waters ACQUITY UHPLC® HSS T3(2.1 × 100 mm, 1.8 μm)with the column temperature set at 35 °. The elution solvents were 0.1% formic acid and 5 mmol/L ammonium acetate in water (A) and acetonitrile (B) with a flow rate at 300 μL/min. A 20 min elution gradient was run as follows: 0–2 min, 10–50% B;2–14.5 min, 50–95%B;14.5–15 min, 95–10%B;15–20 min, 10–10%B. The volume of injection was 5 μL and the sample chamber temperature of the autosampler was 4 °.
For the mass spectrometry conditions, a full scan was run with a mass range from m/z 100 to m/z 1000 with a 200 ms accumulation time. For the positive ion detection mode, the parameters of the TOF-MS detector were as follows: the ion spray voltage floating (ISVF), declustering potential (DP), collision energy (CE), turbo spray temperature (TME), nebulizer gas (GS1), heater gas (GS2) and curtain gas were set at 5.5 kV, 10 V, 50 eV, 550 °, 35, 55 and 55 psi respectively. The MS/MS was run with a mass range from m/z 50 to m/z 1000 with a 100 ms accumulation time. The DP, CE and CES were 50 V, 30 eV and 15 eV respectively. For the negative ion detection mode, the parameters of the TOF-MS detector were as follows: the ion spray voltage floating (ISVF), declustering potential (DP), collision energy (CE), turbo spray temperature (TME), nebulizer gas (GS1), heater gas (GS2) and curtain gas were set at −4.5 kV, −10 V, −50 eV, 550°, 35, 55 and 55 psi respectively. The MS/MS was run with a mass range from m/z 50 to m/z 1000 with a 100 ms accumulation time. The DP, CE and CES were −50 V, −30 eV and 15 eV respectively. The information dependent acquisition (IDA) was used to trigger the acquisition of MS/MS spectra for ions matching the IDA criteria. IDA was used in our study, in which eight candidate ions with highest intensity were monitored and then their MS/MS spectra were obtained by triggering IDA in each scanning cycle. A real-time dynamic background subtract (DBS) were used to fulfill the IDA criteria. Two specific calibration solutions of the AB SCIEX Triple-TOF™ 5600 System was used calibrating the mass range from 50 to 1000 Da in the positive and negative ion detection mode respectively. Data were acquired using Analyst TF 1.6 software (AB SCIEX, Redwood City, CA, USA)
2.5. Sample analysis
Four different types of samples were used during the sample analysis, including blank solution, the quality control sample 1 (QC1), the quality control sample 2 (QC2) and the real sample. The injection order of the samples can have a significant impact on the experimental results. Therefore, the injection sequence in each model was varied. The blank solution and QC1 sample were sequentially injected five times and six times, respectively. After that the random sampling method was performed in the real sample analysis process and one blank solution and one QC2 sample were inserted into every eight real samples. The blank solution was a 95% acetonitrile solution used to balance the system. QC1 and QC2 were separately prepared and each of them was pooled and mixed by the same volume of six randomly selected processed real sample. The QC1 was used to evaluate the precision of the instrument before the analysis process. And the QC2 was used to evaluate whether the experimental condition was stable from the first real sample to the last one in each analysis model.
2.6. Stability of the sample
Investigation of sample stability and analyzing samples during their stable period are the guarantee to acquire reliable data. For the HILIC (+) model, since the sample was injected immediately after preparation, the stability of the QC2 samples in the HILIC (+) model can reflect the stability of the real samples and the determination time of stability was 24h. For the HILIC (−) model, six randomly typical real samples were treated following the above method, each resulting solution was divided into six aliquots and stored at −20 °, which were analyzed at 0, 2, 4, 8,12, 24 h respectively. For the HSS T3 (+) and HSS T3 (−) model, six randomly typical real samples had been treated follow the above method, respectively. Each resulting solution was divided into seven aliquots and stored at −20 °, which were analyzed at 0, 4, 12, 24, 32, 40, 48 h and 0, 12, 24, 36, 48, 60, 72 h respectively. Principal component analysis (PCA) score plots were performed to evaluate the stability of the real samples. In addition, for each typical sample, the relative standard deviation (RSD) of the peak area of the potential biomarkers which were putatively identified under four analysis models was also calculated to evaluate the data.
2.7. Data processing and analysis
A series of data processing will be performed after obtaining the original data (Fig. 1). The raw data was collected by Analyst TF 1.6 software (AB SCEIX, USA), and then imported into the Progenesis QI software (Waters, USA) which was used for peak alignment, deconvolution and selection of the adduct ion. The data of each sample was normalized by the total intensity. The processed data set was imported into the SPSS Statistics 21 software (IBM, USA) to do independent Student’s t-test to get the P value. Meanwhile, the processed data set was imported into the SIMCA-p 14.0 software (Umetrics, Sweden) for multivariate data analysis. The PCA mode is an unsupervised multivariate statistical method reflecting the distribution state of the real samples while the orthogonal projection to latent squares-discriminant analysis (OPLS-DA) is a supervised multivariate statistical method which is able to determine the VIP score. In this study, the scaling method of PCA and OPLC-DA was Pareto. Compounds that satisfy both P < 0.05 and VIP> 1 were considered as differential compounds. The quality of the OPLS-DA mode was evaluated by R2Y(cum), Q2(cum) and 200 times permutation test. The calculated R2Y(cum) estimates the goodness of fit of the model that represents the fraction of explained Y-variation and Q2(cum) estimates the ability of prediction.
Fig. 1.

Flowchart of UPLC-QTOF-MS-based tongue coating metabolomics analysis approach for the CG group and HC group. The details of the sample running sequence is shown in “B”: the red, green, blue and yellow color represent the blank solution, the QC1 samples, the real samples and the QC2 samples, respectively.
The information of the 37 potential biomarkers screened in the positive and negative ion modes of HILIC and HSS T3 was again subjected to PCA analysis to verify the accuracy of the potential biomarkers. The results were compared to the first PCA.
The potential biomarkers were putatively identified by the online databases such as HMDB (http://www.hmdb.ca/) and METLIN (http://metlin.scripps.edu/). The m/z of the differential compounds was imported into the online databases and the tolerance was set below 10 ppm and then the possible compounds will be given by the database. The real MS/MS of differential compounds from the peak view 2.0 will match the MS/MS in the online database to get the potential biomarkers.
The online software Metaboanalyst 3.6 (http://www.metaboanalyst.ca/) and the online database KEGG (http://www.genome.jp/kegg/ligand.html) were used to enrich the metabolites and screen for metabolic pathways for all of the potential biomarkers. The ROC curve analysis evaluating the diagnostic power of potential biomarkers was performed by the GraphPad Prism 6.0 software.
3. Results
3.1. The reliability of the data
To assure the reliability of the data, QC1 samples and QC2 samples were injected during the analysis process respectively. The data sets of the QC1 samples and QC2 samples were imported into the SMICA-p 14.0 to establish a PCA model. The PCA score plots of QC1 samples (Fig. 2A, yellow) and QC2 samples (Fig. 2A, red) in each analysis model showed segregation, indicating that the experimental conditions were stable from the first sample to the last sample in each analysis model. Therefore, the data was reliable in each detection model.
Fig. 2.

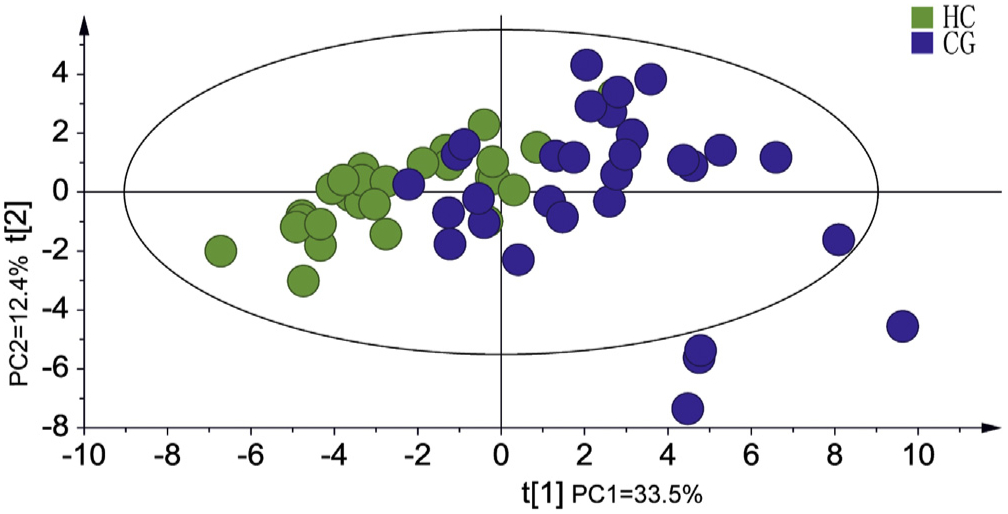
The PCA score plots (A), OPLS-DA score plots (B) and 200 permutation tests (C). A: the PCA score plots for samples of CG group (green), HC group (blue), QC1 samples (yellow) and QC2 samples (red) in each model. B: the OPLS-DA score plots for the CG group (green) and HC group (blue). C: 200 permutation tests to evaluate the quality of the OPLS-DA model.
3.2. Stability of the tongue coating sample
For the evaluation of stability of the tongue coating samples, PCA score plots are shown in Fig. S1. Six samples displayed segregation at different time points in the HILIC (−) model, HSS T3 (+) model and HSS T3 (−) model respectively. For the HILIC (+) model, the QC2 also showed segregation. In addition, the range of RSD of the peak area of the potential biomarkers in each analysis model was listed as follows: HILIC (−) model (2.05%–14.79%), HSS T3 (+) model (2.23%–14.29%), HSS T3 (−) model (8.35%–19.95%). These results indicated that the samples in each analysis model were relatively stable.
3.3. Examination for the influence of age and gender on grouping
The physiological indicators such as age and gender of the participants will affect experimental results. The Chi-squared test and rank-sum test was applied to access whether age and gender had an impact on the experimental grouping result. The statistic analysis of Chi-square test was employed to evaluate the interference of the gender and the analysis result was P = 0.793 > 0.05, which indicated that gender had no effect on the grouping between the HC group and CG group. To evaluate the influence of the age, the normality test was firstly performed for the age of all of the participants. The calculated value was less than 0.1 indicating that the age of the participants was not satisfied the normal distribution. Thus, the rank sum test was chosen for data analysis and the calculated result was P = 0.283 > 0.05, which indicated that the age also had no effect on the grouping between the HC group and CG group.
3.4. Multivariate statistical analysis and identification of the potential biomarker
In order to clearly show the relationship between the two groups of samples, PCA was established and there was no clear distinction for the two groups. OPLS-DA was then performed to find the potential biomarker (Fig. 2B). 200 times permutation was performed to ensure the reliability and accuracy of the model, the R2Y(cum) and Q2(cum) results were (0.959, 0.663), (0.895, 0.622), (0.995, 0.645) and (0.901, 0.470) in each model respectively. In each model, 4212, 3820, 3628 and 1949 peaks were obtained by data pretreatment respectively. The typical tongue coating base peak intensity chromatograms from the RP column and the HILIC column in both ESI positive and ESI negative modes are shown in Fig. S2. The compounds with both P < 0.05 and VIP> 1 were selected as different features. Under the four analysis models, 130, 229, 113 and 92 potential compounds related to disease were found for the HILIC (+), HILIC (−), HSS T3 (+) and HSS T3 (−), respectively. The possible identity of these compounds was putatively identified with the online databases (HMDB and METLIN) by matching the MS/MS data.
Finally, for the HILIC (+) model, 22 potential biomarkers were putatively identified including: N-palmitoylsphingosine, oleamide, threonine, 3-ketosphingosine, sphingosine, δ-valerolactam, 5-deoxy-5-methylthioadenosine, vitamin B2, hypoxanthine, inosine, GlcNAc, adenosine, deoxyadenosine, guanine, guanosine, cytidine, adenine, creatinine, nicotinic acid, isoleucine, l-proline; For the HILIC (−) model, 18 potential biomarkers were putatively identified including: cholesterol sulfate, 5-Hydroxyisourate, oleic acid, eicosenoic acid, 12-hydroxystearic acid, d-glucoseheptose, xanthine, succinic acid, hydratedtyrosine-1-O-glucoside, xanthosine, xanthine, inosine, GlcNAc, guanosine, adenine, N-acetyl-dl-methionine, niacin, pantothenic acid; For the HSS T3 (+) model, 10 potential biomarkers were putatively identified including: l-glutamic acid, thiamine, choline, l-proline, N-acetylpatrescine, l-isoleucine, adenine, hypoxanthine, nicotinic acid; For the HSS T3 (−) model, 2 potential biomarkers were putatively identified including: l-glutamic acid and adenine. Excluding compounds which have been repeatedly putatively identified in each mode, a total of 37 compounds were putatively identified as the potential biomarkers in all of the models (Table 1).
Table 1.
Potential biomarkers and related metabolic pathways.
| Description | Detection model | Retention time (min) |
m/z | Adducts | Mass error (ppm) |
p-value | VIP | Fold change | The trend of change |
pathway |
|---|---|---|---|---|---|---|---|---|---|---|
| N-palmitoylsphingosine | HILIC(+) | 1.05 | 538.5182 | M+H | −0.99 | 1.01E-02 | 2.88 | 2.17 | down | –– |
| Oleamide | HILIC(+) | 1.09 | 282.2787 | M+H | −1.13 | 2.75E-13 | 5.57 | 3.45 | down | –– |
| L-threonine | HILIC(+) | 1.63 | 102.0572 | M+H-H2O | −0.82 | 1.68E-03 | 1.31 | 1.95 | up | Aminoacyl-tRNA biosynthesis |
| 3-ketosphinganine | HILIC(+) | 1.85 | 300.2813 | M+H | 0.14 | 1.12E-02 | 3.36 | 2.60 | up | Sphingalipid metabolism |
| δ-valerolactam | HILIC(+) | 1.91 | 100.0781 | M+H | 2.69 | 4.10E-05 | 9.30 | 1.91 | up | –– |
| HSS T3(+) | 2.16 | 100.0757 | M+H | −0.16 | 5.98E-05 | 8.63 | 2.03 | |||
| 5-Deoxy-5-(Methylthio)adenosine | HILIC(+) | 2.14 | 298.0977 | M+H | 0.51 | 4.67E-03 | 4.76 | 2.25 | up | –– |
| Sphinganine | HILIC(+) | 2.21 | 302.3054 | M+H | −0.78 | 9.51E-06 | 1.15 | 2.08 | up | Sphingalipid metabolism |
| Vitamin B2 | HILIC(+) | 2.51 | 377.1461 | M+H | −0.62 | 4.27E-02 | 1.61 | 1.98 | up | Riboflavin metabolism |
| Hypoxanthine | HILIC(+) | 2.64 | 137.0471 | M+H | 1.11 | 3.04E-12 | 8.69 | 3.01 | up | Purine metabolism |
| HILIC(−) | 2.69 | 135.0322 | M-H | 3.64 | 7.41E-06 | 3.27 | 2.33 | |||
| HSS T3(+) | 1.18 | 137.0458 | M+H | −3.93 | 2.58E-08 | 2.34 | 4.43 | |||
| Inosine | HILIC(+) | 2.64 | 269.0879 | M+H | −0.92 | 1.30E-10 | 6.27 | 2.64 | up | Purine metabolism |
| HILIC(−) | 2.69 | 267.0737 | M-H | −0.66 | 5.54E-05 | 7.07 | 2.51 | |||
| N-acetyl-d-glucosamine | HILIC(+) | 3.03 | 222.0971 | M+H | −2.19 | 8.78E-04 | 2.77 | 1.57 | up | Amino sugar and nucleotide sugar metabolism |
| HILIC(−) | 3.11 | 220.0827 | M-H | 2.70 | 3.74E-03 | 1.37 | 1.54 | |||
| Adenosine | HILIC(+) | 3.09 | 268.1043 | M+H | 1.58 | 3.19E-02 | 7.42 | 2.15 | up | Purine metabolism |
| Deoxyadenosine | HILIC(+) | 3.64 | 252.1093 | M+H | 0.07 | 4.45E-02 | 2.32 | 2.37 | up | Purine metabolism |
| Guanine | HILIC(+) | 3.66 | 152.0571 | M+H | −3.93 | 2.47E-05 | 1.79 | 1.68 | up | Purine metabolism |
| Guanosine | HILIC(+) | 3.66 | 284.0989 | M+H | −0.66 | 6.26E-04 | 3.20 | 3.81 | up | Purine metabolism |
| Guanosine | HILIC(−) | 3.70 | 282.0844 | M-H | −1.42 | 1.01E-02 | 1.79 | 2.43 | up | Purine metabolism |
| Cytidine | HILIC(+) | 4.23 | 244.0929 | M+H | −1.19 | 2.75E-13 | 2.12 | 2.39 | up | Pyrimidine metabolism |
| Adenine | HILIC(+) | 4.51 | 136.0618 | M+H | 1.93 | 1.68E-03 | 6.75 | 1.86 | up | Purine metabolism |
| HILIC(−) | 4.52 | 134.0473 | M-H | 3.96 | 1.12E-02 | 2.20 | 1.95 | |||
| HSS T3(+) | 1.14 | 136.0617 | M+H | −2.67 | 4.10E-05 | 2.77 | 2.37 | |||
| HSS T3(−) | 1.13 | 134.0482 | M-H | 3.23 | 5.98E-05 | 1.69 | 2.21 | |||
| Creatinine | HILIC(+) | 6.52 | 114.0666 | M+H | −1.82 | 4.67E-03 | 2.04 | 2.55 | down | Arginine and proline metabolism |
| Niacin | HILIC(+) | 6.98 | 124.0405 | M+H | −0.27 | 9.51E-06 | 7.97 | 2.03 | up | Nicotinate and nicotinamide metabolism |
| HILIC(−) | 7.08 | 122.0267 | M-H | −3.08 | 4.27E-02 | 5.12 | 1.97 | |||
| HSS T3(+) | 1.20 | 124.0392 | M+H | −4.11 | 3.04E-12 | 2.86 | 2.13 | |||
| Pantothenic acid | HILIC(+) | 8.06 | 220.1181 | M+H | −0.42 | 5.14E-11 | 4.00 | 3.01 | up | Pantothenate and CoA biosynthesis |
| HILIC(−) | 8.11 | 218.1028 | M-H | −0.62 | 7.41E-06 | 2.17 | 2.49 | |||
| L-isoleucine | HILIC(+) | 10.97 | 132.1018 | M+H | −4.89 | 2.58E-08 | 1.11 | 2.94 | up | Aminoacyl-tRNA biosynthesis |
| HSS T3(+) | 1.12 | 132.1019 | M+H | −4.45 | 1.30E-10 | 1.72 | 2.37 | |||
| L-proline | HILIC(+) | 11.94 | 116.0706 | M+H | −2.13 | 5.54E-05 | 1.94 | 2.72 | up | Aminoacyl-tRNA biosynthesis |
| HSS T3(+) | 1.00 | 116.0723 | M+H | −2.40 | 8.78E-04 | 3.60 | 3.00 | |||
| Cholesterol sulfate | HILIC(−) | 0.57 | 465.3034 | M-H | −0.89 | 3.74E-03 | 19.71 | 2.74 | down | Steroid hormone biosynthesis |
| 5-Hydroxyisourate | HILIC(−) | 1.12 | 183.0152 | M-H | 0.61 | 3.19E-02 | 1.82 | 2.63 | down | Purine metabolism |
| Oleic acid | HILIC(−) | 1.14 | 281.2482 | M-H | −0.7 | 4.45E-02 | 5.57 | 3.09 | up | Fatty acid biosynthesis |
| Eicosenoic acid | HILIC(−) | 1.14 | 309.2799 | M-H | −1.57 | 2.47E-05 | 1.69 | 1.98 | up | Biosynthesis of unsaturated fatty acids |
| d-glucoheptose | HILIC(−) | 1.54 | 209.0667 | M-H | −1.05 | 6.26E-04 | 1.11 | 2.73 | up | –– |
| Xanthine | HILIC(−) | 1.93 | 151.0262 | M-H | 2.06 | 1.01E-02 | 2.38 | 4.13 | up | Purine metabolism; |
| 12-Hydroxystearic acid | HILIC(−) | 1.45 | 299.2595 | M-H | −1.71 | 2.75E-13 | 4.61 | 3.32 | up | –– |
| Succinic acid | HILIC(−) | 2.08 | 117.0220 | M-H | −3.50 | 2.47E-05 | 12.62 | 2.20 | up | TCA |
| Hydroxytyrosol-1-O-glucoside | HILIC(−) | 2.37 | 315.1085 | M-H | −1.71 | 3.50 | 2.23 | up | –– | |
| Xanthosine | HILIC(−) | 2.52 | 283.2626 | M-H | 0.69 | 3.31E-03 | 1.43 | 2.22 | up | Purine metabolism |
| N-acetyl-dl-methionine | HILIC(−) | 6.91 | 190.0524 | M-H | 0.13 | 1.63E-03 | 1.95 | 1.79 | up | –– |
| l-glutamate | HSS T3(+) | 0.93 | 148.0604 | M+H | −3.57 | 2.27E-02 | 2.75 | 1.95 | up | Alanine, aspartate and glutamate metabolism |
| HSST3(−) | 0.96 | 146.0466 | M-H | 1.85 | 3.15E-02 | 1.29 | 2.08 | |||
| Thiamine | HSS T3(+) | 0.93 | 266.1196 | M+H | −1.67 | 1.99E-04 | 4.95 | 5.39 | up | Thiamine metabolism |
| Choline | HSS T3(+) | 0.94 | 105.1148 | M+H | 2.19 | 3.60E-02 | 4.57 | 2.65 | up | Glycine, serine and threonine metabolism |
| N-acetylpatrescine | HSS T3(+) | 1.02 | 131.1177 | M+H | −1.74 | 1.30E-05 | 3.53 | 2.81 | up | –– |
The trend of change is the trend of the CG group compared with HC group; (up) or (down) represent the corresponding compound is up-regulated or down-regulated in CG group compared with the HC group, respectively.
In this study, 37 potential biomarkers were used for PCA analysis to verify the reliability of biomarkers. The results showed that the HC group and the CG group were well separated (Fig. 3). Due to the existence of disease development between normal people and patients with chronic gastritis, some samples in the PCA model overlap, which further indicates that there is a trend change in the whole development process of the disease. Compared with Fig. 2A, the results show a good separation advantage, indicating that the model has no significant over-fitting.
Fig. 3.
PCA analysis with 37 potential biomarkers as information screened in the positive and negative ion modes of HILIC and HSS T3.
3.5. Metabolite enrichment and metabolic pathway analysis
In order to explore the possible pathways of the various biomarkers MetaboAnalyst 3.6 was used to enrich the metabolites and heat maps were employed to indicate the extent of the potential biomarkers which existed in each sample (Fig. S3). Some pathways that could be related to CG are purine metabolism, aminoacyl-tRNA biosynthesis, caffeine metabolism, sphingolipid metabolism and amino acid metabolism (Fig. 4).
Fig. 4.

The disturbed pathway of CG patients (left) and enrichment of the biomarkers related to CG. The color and size of each circle is based on P value and pathway impact value respectively. 1: Purine metabolism 2:Aminoacyl-tRNA biosynthesis 3: Caffeine metabolism 4: Alanine, aspartate and glutamate metabolism 5: Sphingolipid metabolism 6: Valine, leucine and isoleucine biosynthesis 7: Arginine and proline metabolism.
3.6. Receiver operating characteristic (ROC) curve analysis
The ROC curves were used in this study to evaluate the diagnostic capabilities of these potential biomarkers which could discover the most suitable cut-off point according to the maximum corresponding specificity and sensitivity. In this study, an in-depth ROC curve analysis was performed to characterize potential biomarkers. The area under the ROC curve (AUC) represented the overall accuracy of CG diagnostic test. Thirty-seven putatively identified potential markers were used for ROC curve analysis. The detail of the AUC, asymptotic 95% confidence interval and P value are shown in Table S2. The five metabolites including inosine, oleamide, adenosine, GlcNAc and xanthine provided AUC value of 0.918 (CI: 0.851–0.985), 0.918 (CI: 0.840–0.996), 0.899 (CI: 0.821–0.977), 0.877 (CI: 0.792–0.961) and 0.873 (CI: 0.784–0.962) respectively, which implied a high accuracy in predicting. The ROC curves are illustrated in Fig. 5.
Fig. 5.
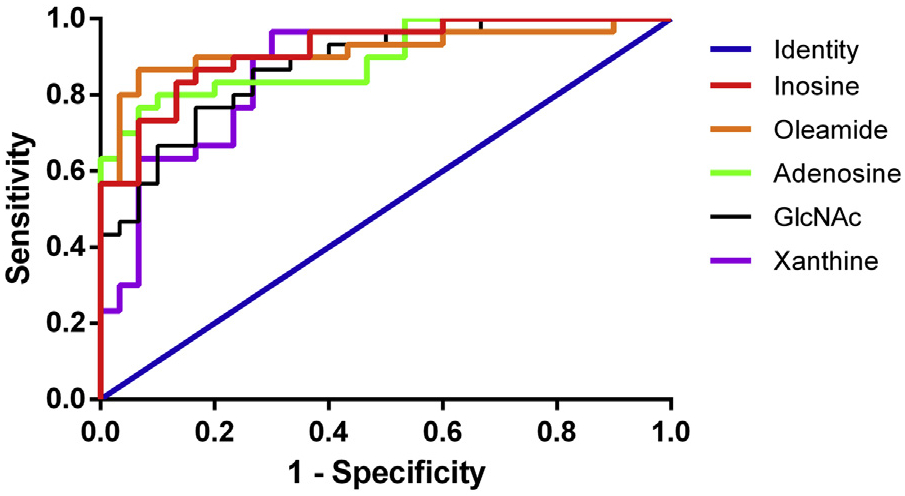
ROC analysis of 5 potential diagnostic biomarkers in diagnosis of CG.
4. Discussion
4.1. Optimization of pre-treatment method
As non-targeted metabolomics is a comprehensive analysis of endogenous components, an appropriate method of sampling and pretreatment for each sample will have a great impact on the experimental results [21]. Through course of experimentation, we found that the precise weight of samples had a great relationship on the mass spectrometry response of the compounds, which would affect accurate detection in the samples. In a previous study, counting free cells were used to determine the amount of sample [19,20]. The appearance of tongue coating was noted by white lumps and many cells accumulated in the lumps observed through the microscopically, which did not reflect the number of free cells represented in the whole of the tongue coating sample. Therefore, we preferred to take the tongue coating samples by the weighing method. In order to keep a parallel sampling, the method of converting the tongue coating sample to freeze-dried powder was performed. Acetonitrile was added to the freeze-dried powder to get a mixture which was then disrupted so that endogenous substances could be quantitatively extracted from the tongue coating samples.
4.2. Perturbed metabolic pathways of patients with chronic gastritis
Metabolism changes of the samples can provide a biochemical foundation for the etiology and development of the disease [22]. In the present study, a total of 37 differential biomarkers were detected and putatively identified under the four detection models. We mapped out the relationship between these biomarkers through KEGG (Fig. 6) and there were multiple metabolic pathways involved, including purine metabolism, sphingolipid metabolism, amino acid metabolism, caffeine metabolism and aminoacyl-tRNA biosynthesis. The fatty acids and hydrophobic metabolites like lipids were detected in reverse phase column separation analysis. However, due to the similarity of the lipid structure and the insufficient information for MS/MS fragmentation, the reliability of the identification of lipids was not accepted by us, so the identification results of lipids were not used.
Fig. 6.

Disturbed metabolic pathways related to the tongue coating of patients with CG. Metabolites with red or green words represent significant increase or decrease in CG group compared to HC group.
4.2.1. Purine metabolism
Compared with the tongue coating samples of the HC group, significant up-regulation of hypoxanthine, xanthine, inosine, deoxyadenosine, guanine, guanosine, adenine and adenosine were found in the CG group. Hypoxanthine serves as a substrate and nitrogen source, which is positively correlated with cell proliferation [23,24]. Tongue coating is formed by the abnormal proliferation, differentiation, apoptosis and shedding of tongue epithelial cells. In our study, the increase of hypoxanthine might be related to the abnormal proliferation of tongue epithelial cells. Xanthine oxidase (XO) is the last enzyme involved in purine metabolism. XO has been widely found in the gastrointestinal tract and considered as an important source of reactive oxygen species in the gastrointestinal tract. XO can convert hypoxanthine and xanthine into uric acid and produces superoxide radicals (Fig. 6A). It was found that oxygen free radicals play an important role in the digestive system damage, which will lead to gastric mucosal injury, the destruction of cell structure and even cancer [25,26]. It was suggested that the significantly increase of hypoxanthine and xanthine might be a possible reason of the abnormal proliferation and apoptosis of tongue epithelial cells leading to the patient showing a different type of tongue coating. Hypoxanthine-guanine phosphoribosyl transferase (HGPRT) and adenine phosphoribosyl transferase (APRT) can convert adenine, hypoxanthine and guanine to adenosine 5′-monophosphate (AMP), inosine 5′-phosphate (IMP) and guanosine 5′-phosphate (GMP), respectively. They are the substrates for the synthesis of high-energy nucleotides and it was reported that AMP and GMP levels were significantly up-regulated in normal gastric tissue from patients with gastric cancer [11,27,28]. In the present study, adenine, hypoxanthine and guanine were significantly up-regulated in the chronic gastritis group, which might suggest that the synthesis of AMP, IMP, and GMP was enhanced. Therefore, the changes of these compounds indicated that purine metabolism is abnormal in the tongue coating of patients with CG.
4.2.2. Energy metabolism
The tricarboxylic acid (TCA) cycle is a pathway for generating energy. Succinic acid (SA) is an intermediate of the TCA cycle through conversion of SA to fumaric acid by succinate dehydrogenase (SDH). CG is the gastric mucosal inflammation of the stomach, and it has been found that SA was considered as a signal for processes involved in inflammation and cancer [29]. In the present study, SA in the CG group was significantly up-regulated compared with the HC group (Fig. 6C), which agreed with a report that SA was significantly increased in rats with CAG [30,31]. Nicotinic acid, also known as niacin, is one of the naturally occurring vitamins B3. It is the functional part of nicotinamide adenine dinucleotide (NAD)+ and its analog nicotinamide adenine dinucleotide phosphate (NADP), both of which play crucial roles in energy metabolism and cell protection pathways [32,33]. Coenzyme A (CoA), as a key enzyme in TCA, is the functioning form of the pantothenic acid. The activation products of niacin and pantothenic acid constitute NAD+ and CoA of the TCA respectively. Recent studies found that TCA cycle was altered in rats with CG [34,35]. The increased levels of pantothenic acid and nicotinic acid in the patient’s tongue coating samples in the CG group might indicate that the synthesis of CoA and NAD+ was blocked. This indicates that energy metabolism is out of balance in the tongue coating samples of the patients with CG.
4.2.3. Sphingolipid metabolism
The balance of cellular sphingolipid metabolism is an important aspect of cellular homeostasis and also plays an important role in the regulation of cell proliferation, differentiation and apoptosis. Sphingomyelin metabolites include various metabolites such as ceramide, sphingosine and sphingosine-1-phosphate (S1P) [35,36]. Ceramide and sphingosine are negative regulators of cell proliferation, which are able to inhibit cell growth and promote apoptosis, while S1P stimulates cell growth and inhibits apoptosis [37]. In normal organisms, ceramide, sphingosine and S1P maintain their homeostasis via enzymatic reactions to maintain cellular physiology (Fig. 6B) [38]. In the tongue coating of CG patients, tongue epithelial cells undergo abnormal proliferation, differentiation, apoptosis and shedding. Sphingosine levels were significantly up-regulated in the tongue coating of CG patients in the present study, which was speculated that accelerated apoptosis of tongue epithelial cells might be related to the up-regulation of sphingosine. Possibly due to the limits of detection and identification, we did not find any changes in ceramide and S1P in the CG group and HC group and there were few studies having been reported. Targeted studies of sphingolipid metabolism in the tongue coating of CG patients might reveal abnormal proliferation and apoptosis of tongue epithelial cells and the mechanism of the formation of different tongue coating.
4.2.4. Amino acid and other metabolisms
Amino acids are the most basic substances in the body and the most important material for the synthesis of proteins which are closely related with life activities [11]. It was found that most of the amino acids in gastric tumor tissue was significantly higher than normal tissue [39]. There was a significant up-regulation of l-proline, l-glutamate, l-threonine and isoleucine in the tongue coating of chronic gastritis patients compared with normal subjects in our study (Fig. 6D). Thus, amino acid metabolism of CG patients might be disturbed. Creatinine is the end product of creatine and creatine phosphate metabolism in the body which is an essential substrate for arginine and proline metabolism and muscle energy [32]. Creatinine levels in the tongue coating of CG patients were significantly down-regulated, which was also found in the CAG rats [31].
4.3. The reliability of diagnostic potential biomarkers
For the ROC curve analysis, 0.5<AUC ≤ 0.7 means low diagnostic accuracy, 0.7 <AUC ≤ 0.9 means medium diagnostic accuracy, and 0.9 < AUC<1.0 means high diagnostic accuracy [40]. The five metabolites including inosine, oleamide, adenosine, N-acetylglucosamine and xanthine provided AUC values of 0.918 (CI: 0.851–0.985), 0.918 (CI: 0.840–0.996), 0.899 (CI: 0.821–0.977), 0.877 (CI: 0.792–0.961) and 0.873 (CI: 0.784–0.962), respectively, which implied a high accuracy in predicting. To further elucidate their possible use as diagnostic markers, we elaborated their relative metabolic pathways and the possible causes for their changes.
Oxidative stress refers to the imbalance of oxidation and antioxidation in vivo, which is a negative effect of free radicals in the body and considered to be an important cause of senescence and disease. XO catalyzes the reaction of hypoxanthine to xanthine and xanthine to uric acid [41]. Each reaction can produce a large amount of superoxide anion and hydrogen peroxide which results in oxidative stress and oxidative stress damage [42-44]. According to our study, the level of xanthine, inosine and adenosine were significantly increased in the tongue coating of CG patients, which indicated the disordered of purine metabolic pathway and a large number of oxygen free radicals may be produced leading to the occurrence of CG. In addition, we found GlcNAc content was significantly elevated in the tongue coating of CG patients. GlcNAc can link to the serine or threonine residues on nuclear and cytoplasmic proteins to form O-GlcNAc under the catalysis of O-GlcNAc transferase (OGT) [45,46]. Some studies have revealed that a state of oxidative stress can rapidly increase O-GlcNAc content in cells. Other studies found that GlcNAc was induced by OGT to become O-GlcNAc in gastric cancer tissue leading to the increases of O-GlcNAc and the expression of OGT-related mRNA [47-49]. In our study, we speculated that the disorder of purine metabolism could cause oxidative stress by generating a large amount of oxygen free radicals in tongue coating cells of CG patients, which promote the OGT-mediated reaction and lead to the accumulation of GlcNAc in host. Therefore, the inosine, adenosine, GlcNAc and xanthine have the potential to become diagnostic biomarkers.
5. Conclusion
In summary, a UHPLC-Q/TOF-MS-based non-targeted metabolomic analysis method using positive and negative ion modes with a HILIC column and a RP column was established to analyze the tongue coating of HC and the patients with CG. Thirty-seven metabolites were finally putatively identified as the potential biomarkers related to CG, which involved multiple metabolism disorders of the purine metabolism, amino acid metabolism, sphingolipid metabolism and energy metabolism in the tongue coating of CG patients. Among them, five metabolites were screened for potential biomarkers using the ROC curve analysis and these five metabolites with good sensitivity and specificity showing a high accuracy in predicting CG. However, there is still a great challenge to obtain the final clinical biomarkers. Our global tongue coating metabolomics results should be combined with the proteomic, genomic and transcriptomics in the future to obtain a systematic and in-depth investigation about the CG so as to make the potential biomarkers be applied to real clinical diagnostics.
Supplementary Material
Acknowledgment
This study was financially supported by Hebei Science and Technology Department (17392501D) and Clinical Medicine Excellent Talents Training and Basic Research Project of Hebei Province (361025).
Footnotes
Appendix A. Supplementary data
Supplementary material related to this article can be found, in the online version, at doi:https://doi.org/10.1016/j.jpba.2019.06.025.
References
- [1].Rahmani A, Moradkhani A, Hafezi Ahmadi MR, Jafari HA, Abangah G, Asadollahi K, Association between serum levels of high sensitive C-reactive protein and inflammation activity in chronic gastritis patients, Scand. J. Gastroenterol 51 (2016) 531–537. [DOI] [PubMed] [Google Scholar]
- [2].Du Y, Bai Y, Xie P, Fang J, Wang X, Hou X, Chronic gastritis in China: a national multi-center survey, BMC Gastroenterol. 14 (2014) 21. [DOI] [PMC free article] [PubMed] [Google Scholar]
- [3].Liu CC, Chen JL, Chang XR, He QD, Shen JC, Lian LY, Comparative metabolomics study on therapeutic mechanism of electro-acupuncture and moxibustion on rats with chronic atrophic gastritis (CAG), Sci. Rep 7 (2017) 14362. [DOI] [PMC free article] [PubMed] [Google Scholar]
- [4].Correa P, Piazuelo MB, The gastric precancerous cascade, J. Dig. Dis 13 (2012) 2–9. [DOI] [PMC free article] [PubMed] [Google Scholar]
- [5].Zagari RM, Rabitti S, Greenwood DC Eusebi LH, Vestito A, Bazzoli F, Systematic review with meta-analysis: diagnostic performance of the combination of pepsinogen, gastrin-17 and anti-Helicobacter pylori antibodies serum assays for the diagnosis of atrophic gastritis, Aliment. Pharmacol. Ther 46 (2017) 657. [DOI] [PubMed] [Google Scholar]
- [6].Sugano K, Tack J, Kuipers EJ, Graham DY, El-Omar EM, Miura S, Kyoto global consensus report on Helicobacter pylori gastritis, Gut 64 (2015) 1353–1367. [DOI] [PMC free article] [PubMed] [Google Scholar]
- [7].Ye J, Cai X, Yang J, Sun X, Hu C, Xia J, Bacillus as a potential diagnostic marker for yellow tongue coating, Sci. Rep 6 (2016) 32496. [DOI] [PMC free article] [PubMed] [Google Scholar]
- [8].Seerangaiyan K, Juch F, Winkel EG, Tongue coating: its characteristics and role in intra-oral halitosis and general health- a review, J. Breath Res 12 (2018)03400. [DOI] [PubMed] [Google Scholar]
- [9].Li X, Zhang JF Yang YP, Primary discussion of association of microecology and tongue coating, LiaoNing J. Tradit. Chin. Med 6 (2014) 1102–1105. [Google Scholar]
- [10].Li DY, Dong-Yuan’s Treatise on the Spleen & Stomach: A Translation of the Pi Wei Lun, Blue Poppy Press, 2004. [Google Scholar]
- [11].Dong H, Guo Z, Zeng C, Zhong H, He Y, Wang RK, Quantitative analysis on tongue inspection in traditional Chinese medicine using optical coherence tomography, J. Biomed. Opt 13 (2008), 011004. [DOI] [PubMed] [Google Scholar]
- [12].Li CD, Lan QF, Zhang JJ, Study on relationship between tongue picture and cell apoptosis in patients with chronic gastritis, Chin. J. Integr. Med 23 (2003) 433–435. [PubMed] [Google Scholar]
- [13].Li Y, Guo ZQ, The ultrastructural changes of tongue coating in chronic atrophic gastritis with deficiency cold or stagnated heat syndromes, Chin. J. Integr. Med 11 (1991) 188–190. [PubMed] [Google Scholar]
- [14].Jiang B, Liang X, Chen Y, Ma T, Liu L, Li J, Integrating next-generation sequencing and traditional tongue diagnosis to determine tongue coating microbiome, Sci. Rep 2 (2012) 936. [DOI] [PMC free article] [PubMed] [Google Scholar]
- [15].Xu JT, Bao YM, Wang ZG, Fang ZQ, Qiu L, Zhang C, Preliminary observation of relationship between feature of tongue manifestations and syndrome patterns in 166 cases of chronic gastritis, Acta Universitatis Tradionis medicalis Sinensis Pharmacologiaeque Shanghai 17 (2003) 34–37. [Google Scholar]
- [16].Ratchadaporn K, Obafemi-Ajayi T, Tao M, Dong X, Shao L, Ye D, Automated tongue feature extraction for ZHENG classification in traditional chinese medicine, Evid. Complement. Alternat. Med 2012 (2012), 912852. [DOI] [PMC free article] [PubMed] [Google Scholar]
- [17].Mohamed R, Varesio E, Ivosev G, Burton L, Bonner R, Hopfgartner G, Comprehensive analytical strategy for biomarker identification based on liquid chromatography coupled to mass spectrometry and new candidate confirmation tools, Anal. Chem 81 (2009) 7677–7694. [DOI] [PubMed] [Google Scholar]
- [18].Ceglarek U, Leichtle A, Brügel M, Kortz L, Brauer R, Bresler K, Challenges and developments in tandem mass spectrometry based clinical metabolomics, Mol. Cell. Endocrinol 301 (2009) 266. [DOI] [PubMed] [Google Scholar]
- [19].Liu X, Sun ZM, Liu YN, Ji Q, Sui H, Zhou LH, The metabonomic studies of tongue coating in H. pylori positive chronic gastritis patients, Evid. Complement. Alternat. Med 2015 (2015), 804085. [DOI] [PMC free article] [PubMed] [Google Scholar]
- [20].Sun ZM,Zhao J, Qian P Wang YQ, Zhang WF, Guo CR, Metabolic markers and microecological characteristics of tongue coating in patients with chronic gastritis, BMC Complement. Altern. Med 13 (2013) 227. [DOI] [PMC free article] [PubMed] [Google Scholar]
- [21].Nicolas D, Serge R, Julie S. Sample preparation for polar metabolites in bioanalysis, Analyst 143 (2018) 16–20. [DOI] [PubMed] [Google Scholar]
- [22].Chang AY, Lalia AZ, Jenkins GD, Dutta T, Carter RE, Singh RJ, Combining a nontargeted and targeted metabolomics approach to identify metabolic pathways significantly altered in polycystic ovary syndrome, Metabolism 71 (2017) 52–63. [DOI] [PMC free article] [PubMed] [Google Scholar]
- [23].Doğan Özlem, Cubukcu HC, Durak ZE, Kocaoglu H, Durak İlker, Effects of garlic extract on adenosine deaminase, 5′ nucleoditase, and xanthine oxidase enzymes in cancerous gastric tissues, Biomed. Res 28 (2017) 6080–6084. [Google Scholar]
- [24].Wu H, Xue R, Tang Z, Deng C, Liu T, Zeng H, Metabolomic investigation of gastric cancer tissue using gas chromatography/mass spectrometry, Anal. Bioanal. Chem 396 (2010) 1385–1395. [DOI] [PubMed] [Google Scholar]
- [25].Moriwaki Y, Yamamoto T, Yamaguchi K, Takahashi S, Higashino K, Immunohistochemical localization of aldehyde and xanthine oxidase in rat tissues using polyclonal antibodies, Histochem. Cell Biol 105 (1996) 71–79. [DOI] [PubMed] [Google Scholar]
- [26].Al-Abbasi FA, Acrylonitrile-induced gastric toxicity in rats: the role of xanthine oxidase, Med. Sci. Monit 18 (2012) 208–214. [DOI] [PMC free article] [PubMed] [Google Scholar]
- [27].Yu T, Wang Y, Zhang H, Johnson CH, Jiang Y, Li X, Metabolomics reveals mycoplasma contamination interferes with the metabolism of PANC-1 cells, Anal. Bioanal. Chem 408 (2016) 4267–4273. [DOI] [PMC free article] [PubMed] [Google Scholar]
- [28].Santos AP, Guimaraes AM, do Nascimento NC, Sanmiguel PJ, Martin SW, Messick JB, Genome of Mycoplasma haemofelis, unraveling its strategies for survival and persistence, Vet. Res 42 (2011) 102. [DOI] [PMC free article] [PubMed] [Google Scholar]
- [29].Jiang S, Yan W, Succinate in the cancer-immune cycle, Cancer Lett. 390 (2017) 45–47. [DOI] [PubMed] [Google Scholar]
- [30].Cui JJ, Liu YT, Hu YH, Tong JY, Li AP, Qu TL, NMR-based metabonomics and correlation analysis reveal potential biomarkers associated with chronic atrophic gastritis, J. Pharm. Biomed Anal 132 (2017) 77–86. [DOI] [PubMed] [Google Scholar]
- [31].Liu Y, Cui J, Hu Y, Du G, Qin X, integrating untargeted metabonomics, partial least square regression analysis and MetPA to explore the targeted pathways involved into Huangqi Jiangzhong Tang against chronic atrophic gastritis rats, Chemometr. Intell. Lab. Syst 164 (2017) 16–25. [Google Scholar]
- [32].Li Q, Xie G, Zhang W, Zhong W, Sun X, Tan X, Dietary nicotinic acid supplementation ameliorates chronic alcohol-induced fatty liver in rats, Alcohol. Clin. Exp. Res 38 (2014) 1982–1992. [DOI] [PMC free article] [PubMed] [Google Scholar]
- [33].Godin AM, Ferreira WC, Rocha LT, Ferreira RG, Paiva AL, Merlo LA, Nicotinic acid induces antinociceptive and anti-inflammatory effects in different experimental models, Pharmacol. Biochem. Behav 101 (2012) 493–498. [DOI] [PubMed] [Google Scholar]
- [34].Xu J, Zheng X, Cheng KK, Chang X, Shen G, Liu M, NMR-based metabolomics reveals alterations of electro-acupuncture stimulations on chronic atrophic gastritis rats, Sci. Rep 7 (2017) 45580. [DOI] [PMC free article] [PubMed] [Google Scholar]
- [35].Hait N, Oskeritzian C, Paugh S, Milstien SS, Sphingosine kinases, sphingosine 1-phosphate, apoptosis an diseases, Biochim. Biophys. Acta 1758 (2006) 2016–2026. [DOI] [PubMed] [Google Scholar]
- [36].Sud M, Fahy E, Cotter D, Brown A, Dennis EA, Glass CK, LMSD: LIPID MAPS structure database, Nucleic Acids Res. 35 (Database issue) (2007) D527–532. [DOI] [PMC free article] [PubMed] [Google Scholar]
- [37].Pandey S, Murphy RF, Agrawal DK, Recent advances in the immunobiology of ceramide, Exp. Mol. Pathol 82 (2007) 298. [DOI] [PMC free article] [PubMed] [Google Scholar]
- [38].Uehara K, Miura S, Takeuchi T, Nakashita M, Adachi M, Significant role of ceramide pathway in experimental gastric ulcer formation in rats, J. Pharmacol. Exp. Ther 305 (2003) 232–239. [DOI] [PubMed] [Google Scholar]
- [39].Hirayama A, Kami K, Sugimoto M, Toki N, Onozuka H, Quantitative metabolome profiling of colon and stomach cancer microenvironment by capillary electrophoresis time-of-flight mass spectrometry, Cancer Res. 69 (2009) 4918. [DOI] [PubMed] [Google Scholar]
- [40].Zheng K, Shen N, Chen H, Ni S, Zhang T, Hu M, Global and targeted metabolomics of synovial fluid discovers special osteoarthritis metabolites, J. Orthop. Res 35 (2017) 1973. [DOI] [PubMed] [Google Scholar]
- [41].Kostić Danijela, Dimitrijević Danica S., Stojanović Gordana S., Palić Ivan R., Ðorđević Aleksandra S., Ickovski JD, Xanthine oxidase: isolation, assays of activity, and inhibition, J. Chem 2015 (2015) 1–8. [Google Scholar]
- [42].Li L, Kong L, Song H, The therapeutic effect of zerumbone on chronic gastritis via antioxidant mechanisms, Exp. Ther. Med 14 (2017) 2505–2510. [DOI] [PMC free article] [PubMed] [Google Scholar]
- [43].Kim SH, Um SI, Nam Y, Park SY, Dong JH, Ko SK, The effect of synthetic ceramide analogues on gastritis and esophagitis in rats, Arch. Pharm. Res 39 (2016) 1313–1323. [DOI] [PubMed] [Google Scholar]
- [44].Setiawan VW, Zhang ZF, Yu GP, Lu QY, Li YL, Lu ML, Protective effect of green tea on the risks of chronic gastritis and stomach cancer, Int. J. Cancer 92 (2001) 600. [DOI] [PubMed] [Google Scholar]
- [45].Kamthan M, Mukhopadhyay G, Chakraborty N, Chakraborty S, Datta A, Quantitative proteomics and metabolomics approaches to demonstrate N-acetyl-D-glucosamine inducible amino acid deprivation response as morphological switch in Candida albicans, Fungal Genet. Biol 49 (2012) 369–378. [DOI] [PubMed] [Google Scholar]
- [46].Kátai E.Pál J, Poór VS, Purewal R, Miseta A, Nagy T, Oxidative stress induces transient O-GlcNAc elevation and tau dephosphorylation in SH-SY5Y cells, J. Cell. Mol. Med 20 (2016) 2269–2277. [DOI] [PMC free article] [PubMed] [Google Scholar]
- [47].Trinca GM, Goodman ML, Papachristou EK, D’Santos CS, Chalise P, Madan R, O-GlcNAc-dependent regulation of progesterone receptor function in breast cancer, Horm. Cancer 9 (2018) 12–21. [DOI] [PMC free article] [PubMed] [Google Scholar]
- [48].Wen T, Hou K, Li Z, Li L, Yu H, Liu Y, Silencing β-linked N-acetylglucosamine transferase induces apoptosis in human gastric cancer cells through PUMA and caspase-3 pathways, Oncol. Rep 34 (2015) 3140–3146. [DOI] [PubMed] [Google Scholar]
- [49].Jang TJ, Kim UJ, O-GlcNAcylation is associated with the development and progression of gastric carcinoma, Pathol. Res. Pract 212 (2016) 622–630. [DOI] [PubMed] [Google Scholar]
Associated Data
This section collects any data citations, data availability statements, or supplementary materials included in this article.