

Summary
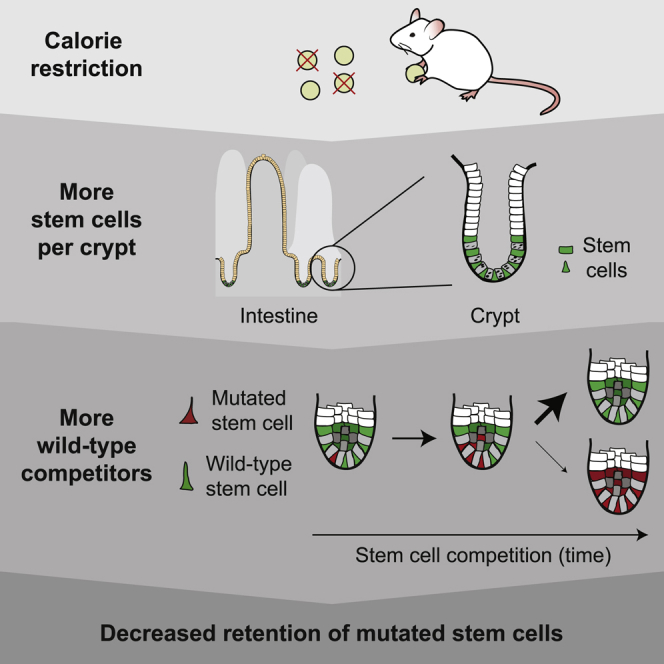
Calorie restriction (CR) extends lifespan through several intracellular mechanisms, including increased DNA repair, leading to fewer DNA mutations that cause age-related pathologies. However, it remains unknown how CR acts on mutation retention at the tissue level. Here, we use Cre-mediated DNA recombination of the confetti reporter as proxy for neutral mutations and follow these mutations by intravital microscopy to identify how CR affects retention of mutations in the intestine. We find that CR leads to increased numbers of functional Lgr5+ stem cells that compete for niche occupancy, resulting in slower but stronger stem cell competition. Consequently, stem cells carrying neutral or Apc mutations encounter more wild-type competitors, thus increasing the chance that they get displaced from the niche to get lost over time. Thus, our data show that CR not only affects the acquisition of mutations but also leads to lower retention of mutations in the intestine.
Keywords: calorie restriction, intestine, stem cells, competition, Lgr5, diet, mutation retention
Graphical Abstract
Highlights
-
•
Calorie restriction increases stem cell numbers in intestinal crypts
-
•
Increased stem cell numbers per crypt strengthen stem cell competition
-
•
Mutant stem cells encounter more wild-type competitors upon calorie restriction
-
•
More wild-type competitors reduce retention of mutant stem cells in the intestine
Calorie restriction increases the number of stem cells in intestinal crypts. Bruens et al. show that this increase results in stronger stem cell competition. Consequently, mutated stem cells encounter more wild-type competitors, which decreases the chance that these mutated stem cells are retained in the intestinal epithelium.
Introduction
Aging and age-related pathologies such as cancer are the consequence of deleterious changes in cells and tissues over time, including the progressive accumulation of DNA mutations (López-Otín et al., 2013). Calorie restriction (CR) can prevent many age-related changes, resulting in extended lifespan and reduced age-related pathologies (Bartke et al., 2001; Colman et al., 2009; Sohal and Weindruch, 1996). Several intracellular mechanisms through which CR can reduce the accumulation of mutations have been identified, including attenuating oxidative stress and enhancing DNA repair (Heydari et al., 2007). In addition to these intracellular mechanisms, mechanisms that act at the tissue level may be at play. For example, in Drosophila, CR enhances intestinal cellular fitness through outcompetition of less fit cells, thereby preventing age-related decline of intestinal integrity (Akagi et al., 2018). Whether related mechanisms upon CR in mammals exist that act at a tissue level is currently unknown.
The mammalian intestinal wall is a single layer of epithelial cells curved into so-called crypt-villus units where proliferative cells are located at the bottom of the crypts, giving rise to more differentiated cells that travel upward along the villus in a conveyor-belt-like fashion (Clevers, 2013). As a protective barrier against the external environment, this epithelial sheet is constantly exposed to potentially DNA-damaging substances. However, most mutated cells are naturally lost due to the highly dynamic self-renewing nature of the epithelium. This imposes a short lifetime on the majority of the cells, as they are shed at the tips of villi within a few days after birth, preventing manifestation or propagation of genomic damage (van Rheenen and Bruens, 2017). Lgr5+ stem cells at the bottom of crypts are long-lived and can thus accumulate mutations (Barker et al., 2007). However, these Lgr5+ stem cells compete for niche occupancy, resulting in continuous replacement and loss of neighboring stem cells, which is often referred to as stem cell competition (Barker et al., 2007; Ritsma et al., 2014; Snippert et al., 2010). As a result, most stem cells, including those carrying mutations, will be lost while the progeny of one stem cell ultimately replaces all other stem cells in the crypt. Therefore, mutations will only be retained in the intestine if they are acquired by stem cells that win the stem cell competition (van Rheenen and Bruens, 2017). Even in the case of non-neutral mutations, a mutant stem cell is outnumbered by a multitude of wild-type cells per crypt and likely to be outcompeted and expelled from the niche to be transported and lost at the villus tip (Snippert et al., 2014; Vermeulen et al., 2013).
We and others have recently shown that the chance that a stem cell can outcompete its neighbors can be manipulated by lowering the number of stem cells through pharmacologically inhibiting WNT protein gradients (Huels et al., 2018; Yan et al., 2017). We showed that in the presence of less wild-type competitors, APC-deficient cells can colonize crypts more rapidly, leading to faster tumorigenesis (Huels et al., 2018). Thus, mutated stem cells can more rapidly spread within crypts when there are less competing stem cells. Interestingly, CR has been shown to increase the number of stem cells in intestinal crypts (Igarashi and Guarente, 2016; Yilmaz et al., 2012) and decrease adenoma formation in APCmin mice (Mai et al., 2003). However, it is unknown whether this is accompanied by an increasing strength of stem cell competition as a putative mechanism to reduce permanent mutational retention in the intestinal epithelium, which could be one of the reasons why fewer polyps form in mice under CR. Here, we use Cre-mediated DNA recombination of a confetti reporter allele as a proxy for neutral mutations and follow the retention of these mutations using intravital imaging in control and CR mice.
Results
CR Reversibly Alters Crypt Morphology
To study the effect of CR on stem cell competition in the intestinal epithelium, we set up a CR protocol for Lgr5eGFP-IRES-CreERT2;R26-confetti mice resulting in 40% reduced calorie intake while maintaining adequate nutrition (Pugh et al., 1999). After 8 weeks on CR, the mice showed a 25.1% ± 7.4% reduced bodyweight compared to mice on control food (Figure S1A), while both length and width of the small intestine (SI) were unaltered (Figures S1B and S1C). In line with previous reports (Beyaz et al., 2016; Igarashi and Guarente, 2016), we found that this CR protocol resulted in increased numbers of Lgr5+ stem cells and their niche cells (i.e., lysozyme+ Paneth cells) per crypt, resulting in larger crypt diameters (Figures 1A–1D). Interestingly, this phenotype was fully reversible when diets were reverted (Figure 1E).
Figure 1.

CR Reversibly Alters Crypt Morphology
(A–D) Representative staining for Lgr5+ stem cells and lysozyme+ Paneth cells (A) (scale bar, 100 μm) in Lgr5eGFP-IRES-CreERT2 mice shows that both cell populations are larger per crypt under CR [(B) n = 14 control mice and n = 15 CR mice; (C) n = 29 control mice, n = 28 CR mice], which results in a larger crypt diameter [(D) n = 33 control mice and n = 31 CR mice].
(E) After diet change (8–16 weeks on the first diet and 8 weeks on the second diet), crypt diameter (n = 9 mice per group) is reversed.
Significance in B–E was determined by a Mann-Whitney test. Data represent mean ± SEM. Dots represent individual mice.
CR Does Not Affect Crypt Numbers
We previously demonstrated the existence of crypt fusion during which two separate crypts merge into one, counterbalancing crypt fission (Bruens et al., 2017). Therefore, the observed increase in crypt size could be the result of two stem cell populations uniting during fusion, or it could solely be the result of increasing the number of stem cells per crypt (Yilmaz et al., 2012). To distinguish between these two possibilities, we performed repetitive intravital microscopy (IVM) experiments in which we imaged the same crypts before and after diet change in vivo in Lgr5eGFP-IRES-CreERT2;R26-confetti mice (Figures S1D–S1F). We used landmarks such as vessels, sporadic distribution of confetti-colored crypts, and patchy expression patterns of Lgr5-GFP to validate successful retracing of the same crypts over time (Figure S1D–S1F). After the first imaging session, the diet was swapped in half of the mice, resulting in four experimental groups: control diet, control to CR diet, CR diet, and CR to control diet (Figure S2A). Strikingly, we did not observe a significant gain or loss of crypts 8 weeks after diet change (Figures S2B and S2C), confirmed by the finding that the same number of crypts fed into one villus in control and CR conditions (Figures S2D and S2E). We did observe the expected increase in crypt diameter when diet was changed from control to CR and a decrease in crypt diameter upon the reverse dietary change, indicating that IVM did not affect the diet phenotype (Figure S2F). Together, these data indicate that CR does not alter crypt fusion but solely expands the stem cell niche in each crypt.
Increased Stem Cell Numbers under CR Results in Slower Stem Cell Competition
Next, we tested whether this enlargement of the pool of stem cells changes the nature of the stem cell competition within crypts by initiating lineage tracing experiments in Lgr5eGFP-IRES-CreERT2;R26-confetti control and CR mice (Figures 2A and 2B). We injected a low dose of tamoxifen to activate Cre-mediated DNA recombination of the confetti allele in one stem cell per every ∼10 crypts. This stochastic recombination results in expression of one of four confetti colors per recombined cell and is a proxy for a stem cell bearing a sporadic neutral mutation that is inherited by all its progeny (genetic lineage tracing). By monitoring these confetti-labeled stem cells over time, we measured the competitive nature of the stem cell populations upon increasing their size. As expected for stem cell competition, we observed the following three scenarios in both control and CR mice: (1) confetti-mutated stem cells that were outcompeted by neighboring wild-type cells (i.e., clones that were lost), (2) confetti-mutated stem cells that were in ongoing competition (crypts in which part of the stem cells were confetti labeled), and (3) confetti-mutated stem cells that outcompeted all wild-type cells (crypts in which all stem cells were confetti labeled) (Figures 2C and 2D). Strikingly, when we analyzed the stem cell clones that were still present in the crypts, we found that the average size of confetti mutant clones was smaller in CR animals than in control animals at every measured time point, showing that there is slower stem cell competition under CR (Figures 2E and S3). Moreover, the average clone size significantly correlated with the average size of the crypt size (Figure 2F). Together, this indicates that there is slower stem cell competition under CR, because it takes longer to resolve the competition when there are more stem cell competitors.
Figure 2.

CR Results in Slower and Stronger Stem Cell Competition as Shown by Lineage Tracing
(A) Lineage tracing was performed in Lgr5EGFP-ires-CreERT2;R26-confetti mice. Mice were put on diet for 8 weeks to let the phenotype manifest before starting lineage tracing by tamoxifen injection. Mice were clonally induced (maximum of 1 cell per ~10 crypts).
(B) Representative images of 48 h and 8 weeks of tracing (scale bar, 200 μm). Lgr5 is in green, and confetti colors are in yellow, red, and blue.
(C and D) When looking at the same clones via intravital imaging 48 h and 12 weeks after induction, clones are lost (top panel), in ongoing competition (middle panel), or have taken over the whole crypt, which is schematically represented in (C). In (D), dotted lines encircle the same crypts at week 0 and week 12. Arrowheads show the clone at week 0. Lgr5 is in green, and confetti colors are pseudocolored in red.
(E) When looking at the average clone size of clones still present in the crypt (percentage of crypt labeled with confetti color) at different time points after tracing, stem cell competition is more slowly resolved under CR (for control and CR respectively, n = 2 and n = 2 at 48 h, n = 5 and n = 4 at 1 week, n = 4 and n = 4 at 2 weeks, n = 4 and n = 5 at 4 weeks, and n = 4 and n = 4 at 8 weeks).
(F) Clone size correlates with crypt diameter, which can be seen when the average clone size from (E) is plotted against the average crypt diameter of the same mouse (n = 4 at 48 h, n = 9 at 1 week, n = 8 at 2 weeks, n = 9 at 4 weeks, and n = 8 at 8 weeks).
(G and H) Slower stem cell competition is not explained by altered proliferation upon CR as shown by a 4-h EdU pulse to measure S phase or phospho-Histone H3 (PH3) staining labeling mitosis. Representative image in left panel (scale bar, 40 μm) and quantification in right panel [(G) n = 14 control mice and n = 12 CR mice; (H) n = 13 control mice and n = 13 CR mice].
Data represent mean ± SEM. Dots represent individual mice. Significance in (E), (G), and (H) was determined by a Mann-Whitney test.
To test whether this slower stem cell competition could be partly explained by an altered proliferation rate of the competing stem cells, we quantified EdU incorporation (marking S phase) and phospho-Histone H3+ cells (marking mitosis) in CR and control mice. Importantly, we found that these numbers were not altered, indicating that proliferation was not changed upon CR (Figures 2G and 2H). Therefore, we conclude that the slower stem cell competition upon CR is not caused by altered proliferation but rather by the increased number of competing stem cells.
To test the direct link between the number of stem cell competitors and the speed of the stem cell competition, we performed additional analyses. First, using our repetitive IVM approach (Figures S1D–S1F and S2), we found that the size of individual crypts was rather stable over 8 weeks; small crypts at the first imaging session were on average small 8 weeks later. Similarly, large crypts were on average still large after 8 weeks (Figures S4A and S4B). Second, crypt sizes were highly variable; although on average the diameter of crypts was larger in CR mice than in control mice, there were many crypts with similar sizes in CR mice and control mice (Figure S4C). These two observations together allowed us to directly compare the speed of the stem cell competition in crypts of similar sizes in control and CR mice (Figures S4C and S4D). If the slower competition under CR was only caused by increased stem cell numbers, then the speed of the stem cell competition should be equal between crypts of similar sizes in control and CR mice. By contrast, if other mechanisms could (partly) explain this, then a different speed of competition would be expected for crypts of similar size in control and CR mice. To select crypts with an average equal crypt diameter in the control and CR conditions, we used a sampling approach in which we separated all control and all CR crypts on the basis of crypt diameter into discrete bins of round numbers (i.e., from 39 μm to 40 μm and from 40 μm to 41 μm) and sampled each bin that was present in both control and CR situation three separate times. These samples indeed had similar average crypt diameters (Figure S4D). Importantly, we did not find significant differences in clone sizes between the two groups of mice (Figure S4E). Together, this analysis shows that the speed of competition is the same for control and CR conditions if the crypts have the same size. Moreover, when we did the reverse and separated small and large crypts (<50 μm and >50 μm, respectively) for both control and CR conditions, we found that at every time point, both in control and CR mice, the average clone size was smaller in larger crypts than in smaller crypts (Figure S4F–S4I). Together, these data show that CR results in slower stem cell competition, which is for a large part the direct consequence of increased stem cell numbers.
CR Results in Lower Mutation Retention Due to Stronger Stem Cell Competition
Since we find that CR leads to increased numbers of stem cells that can displace mutated stem cells from the niche as a result of stem cell competition, we next tested whether this results in reduced retention of mutated cells in the epithelium. We again made use of the power of our repetitive intravital imaging technique (described above) to follow the fate of mutated stem cells in control and CR crypts. We induced confetti mutations by Cre activation and imaged the same mutant clones 48 h and 12 weeks after induction (Figures 3A–3C). This enabled us to determine the retention of mutations in the epithelium after 12 weeks. While in control crypts 15.21% of all mutations (96 out of 631 clones) were still present, only 11.82% of all mutations were present after 12 weeks in CR crypts (Figure 3D). This shows that mutations in crypts of CR mice have 22.29% less chance to remain in the epithelium than mutations in control mice. Taken together, we show that CR leads to enlarged crypts harboring more stem cells that can participate in competition for niche occupancy. This results in slower but stronger competition, as there is a higher chance for mutant stem cells to be outcompeted by wild-type stem cells, consequently lowering mutation retention.
Figure 3.

CR Reduces Mutation Retention as Shown by Repetitive Intravital Imaging
(A) Clonal persistence was measured using repetitive intravital imaging in Lgr5EGFP-ires-CreERT2;R26-confetti mice. After 8 weeks on control or CR diet, clones were induced by tamoxifen injection and imaged 48 h after induction.
(B and C) The same clones were imaged 12 weeks later in control (B) and CR (C) mice. Dotted lines show the clones present at 48 h (left panel) and 12 weeks (right panel). Below, zooms show examples of lost clones (1 and 3) and remaining clones (2 and 4). Lgr5 is in green, and confetti colors are in yellow and red (top panels: scale bar, 250 μm; bottom panels: scale bar, 50 μm).
(D) The number of clones at 48 h and number of those clones still present after 12 weeks was determined. The percentage of “winners” was determined under control and CR conditions by determining the percentage of clones at 48 h that was still present at 12 weeks (n = 631 followed clones in 7 mice for control conditions and n = 643 followed clones in 7 mice for CR conditions).
CR Results in Slower Fixation Time of APC−/− Stem Cells
To test whether stronger stem cell competition under CR also affects the dynamics of stem cells carrying pathological mutations, we investigated the competitional strength of stem cells carrying oncogenic Apc mutations in Lgr5eGFP-IRES-CreERT2;Apcfl/fl control and CR mice (Figure 4A). We could not use the same IVM methodology as described above, as this would require mice in which loss of APC is simultaneously induced with gain of fluorescent protein expression within the same cell. However, these models do currently not exist (Huels et al., 2018). Therefore, we employed an alternative approach. To identify mutant cells, we used RNAScope in situ hybridization for Notum, since Notum is highly upregulated upon APC loss (Kleeman et al., 2019; Tian et al., 2017). This enabled us to score for crypts in which APC-depleted cells were still in competition with their wild-type neighbors (i.e., partially labeled crypts) and crypts in which APC-depleted cells had won the competition and outcompeted all other cells (i.e., fully labeled crypts) (Figure 4B). The ratio of fully labeled crypts to partially labeled crypts increases over time, reflecting the strength and speed of the stem cell competition. Strikingly, this analysis revealed that under CR conditions, it took longer to obtain fully labeled APC-negative crypts than under control conditions, illustrating that the competition takes longer (Figure 4C). Thus, the slower stem cell competition and decreased fixation time upon CR affects not only stem cells with neutral mutations but also stem cells with oncogenic APC mutations.
Figure 4.

Stronger Stem Cell Competition under CR Results in Slower Crypt Fixation by Apc−/− Stem Cells
(A) Schematic representation of the lineage-tracing experiment. After establishment of the CR phenotype, Lgr5eGFP-IRES-CreERT2;Apcfl/fl mice were induced with 3 mg tamoxifen. 2, 4, and 6 weeks after tamoxifen administration, mice were sacrificed.
(B) Crypts were scored for Notum expression (as a marker for APC expression) by RNAScope and categorized into partially and fully labeled crypts (representative images of clones at 6 weeks; scale bar, 50 μm).
(C) The ratio of fully labeled crypts in relation to the number of partially labeled crypts is plotted as mean ± SEM (2 weeks: n = 3 control, n = 4 CR; 4 weeks: n = 6 control, n = 5 CR; and 6 weeks: n = 3 control, n = 4 CR).
Discussion
CR has been shown to reduce the acquisition of DNA mutations that cause aging and age-related pathologies such as cancer. For example, CR reduces tumor initiation and progression in many tumor models, including intestinal polyp formation in APCmin mice (Mai et al., 2003). While, under CR, mechanisms such as reduced DNA damage and improved DNA repair may lower the acquisition of mutations, CR may also have other modes of action. Here, we show that when mutations occur, the chance that these mutations are retained in intestinal tissues is reduced in CR settings. Our data suggest that the reduced retention of mutations is due to increased number of wild-type competitors.
Our study also has some limitations. We have not directly tested whether the reduced mutation retention upon CR contributes to the beneficial effect of CR on aging and age-related pathologies such as cancer. Future experiments will be required to test this. Moreover, although we did not find evidence for other mechanisms that underlie the reduced mutation retention, we cannot completely exclude minor contributing mechanisms independent of increased stem cell numbers. Future studies should include blocking the increase in stem cell numbers under CR and determine if mutation retention is brought back to control levels, which would indicate that increased numbers of stem cell competitors underlie the observed reduced mutation retention upon CR. Nevertheless, since crypts with comparable sizes in CR and control animals showed similar competitional dynamics, our data suggest that increased stem cell number is the main contributor to reduced mutation retention (including cells that lose functional APC).
Our finding that mutations are more frequently eliminated by CR-enhanced stem cell competition is in line with previous findings that damaged or less fit cells are eliminated by fitness-based cell competition. This competition was initially shown in Drosophila to promote elimination of weaker cells, ensuring maintenance of tissue health (Clavería and Torres, 2016) and prolonging lifespan (Merino et al., 2015). In addition, cell competition enhances stemness and proliferation of healthy stem cells in the Drosophila intestine (Kolahgar et al., 2015). Recently, this mechanism has also been shown to occur in mammals, specifically during skin development, where forced differentiation of weaker stem cells ensures tissue function (Ellis et al., 2019). Moreover, it has been reported that oncogenic RasV12-transformed cells are eliminated from the intestinal epithelium through cell competition induced forced apical extrusion (Kon et al., 2017). Interestingly, this process is suppressed by a high-fat diet (Sasaki et al., 2018), illustrating the influence of diet on cell-competition-driven control of transformed cells. Future studies will have to show whether CR also reduces the retention of mutations through fitness-based cell competition in addition to the here-uncovered CR-induced strengthening of stem cell competition.
STAR★Methods
Key Resources Table
| REAGENT or RESOURCE | SOURCE | IDENTIFIER |
|---|---|---|
| Antibodies | ||
| Anti-GFP | Abcam | Cat# ab6673; |
| RRID: AB_305643 | ||
| Anti-human lysozyme | DAKO | Cat# A0099; |
| RRID: AB_2341230 | ||
| Anti-phospho-Histone H3 (Ser10) | Millipore | Cat# 06-570; |
| RRID: AB_310177 | ||
| Donkey anti-Goat IgG (H+L) Cross-Adsorbed Secondary Antibody, Alexa Fluor 488 | Invitrogen | Cat# A-11055 |
| Donkey anti-Rabbit IgG (H+L) Highly Cross-Adsorbed Secondary Antibody, Alexa Fluor 568 | Invitrogen | Cat# A-10042 |
| Chicken anti-Rabbit IgG (H+L) Cross-Adsorbed Secondary Antibody, Alexa Fluor 647 | Invitrogen | Cat#A-21443 |
| Chemicals, Peptides, and Recombinant Proteins | ||
| Isoflurane | Pharmachemie BV, Haarlem, Netherlands | Cat# 45.112.110 |
| Rimadyl Cattle (carprofen) | Zoetis B.V. | Registration# REG NL 10130 |
| Temgesic | Indivior UK Limited | Registration# RVG 08725 |
| Sucrose | Sigma | Cat#S0389-500G |
| L-Lysine | Sigma | Cat#W384720-100G-K |
| Sodium Dihydrogen Phosphate Dihydrate | Fischer Scientific | Cat#RS228270015 |
| Paraformaldehyde | Alfa Aesar | Cat#43368 |
| RNAScope 2.5 LS Probe- Mm-Notum-O1 | Advanced Cell Diagnostics | Cat#472548 |
| RNAScope 2.5 LS Positive Control Probe_Mm-PPIB | Advanced Cell Diagnostics | Cat#313918 |
| Critical Commercial Assays | ||
| Click-it EdU Alexa Fluor imaging kit | ThermoFisher | Cat# C10340 |
| RNAscope 2.5 LS Reagent Kit–BROWN | Advanced Cell Diagnostics | Cat# 322100 |
| Experimental Models: Organisms/Strains | ||
| Lgr5eGFP-IRES-CreERT2: B6.129P2-Lgr5tm1(cre/ERT2)Cle/J | Jackson Laboratory | Stock No: 008875 |
| Rosa26-Confetti: Gt(ROSA)26Sortm1(CAG-Brainbow2.1)Cle/J | Jackson Laboratory | Stock No: 013731 |
| Apcfl/fl: Apctm1Tno | Gift from Hans Clevers | NA |
| Software and Algorithms | ||
| Prism v7 | Graphpad | https://www.graphpad.com/scientific-software/prism/ |
| Excel2010 | Microsoft Office | https://www.microsoft.com/en/microsoft-365/excel |
| LasX | Leica Microsystems | https://www.leica-microsystems.com/products/microscope-software/p/leica-las-x-ls/ |
| ImageJ-win64 | Fiji | https://fiji.sc/ |
| Other | ||
| AIN-93M control diet | Plexx B.V. | F05312 |
| AIN-93M 20% CR diet | Plexx B.V. | F06298 |
| AIN-93M 40% CR diet | Plexx B.V. | F05314 |
Resource Availability
Lead Contact
Further information and requests for resources and reagents should be directed to and will be fulfilled by the Lead Contact, Jacco van Rheenen (j.v.rheenen@nki.nl).
Materials Availability
This study did not generate any unique reagents.
Data and Code Availability
All used software is listed in the Key Resources Table. This study did not generate new datasets.
Experimental Model and Subject Details
All experiments were carried out in accordance with the guidelines of the animal welfare committee of the Netherlands Cancer Institute. Lgr5EGFP-ires-CreERT2 (Barker et al., 2007), R26-confetti (Snippert et al., 2010) and Apcfl/fl (Shibata et al., 1997) mice were gifts from Hans Clevers. Lgr5EGFP-ires-CreERT2 (heterozygous), Lgr5EGFP-ires-CreERT2;R26-confetti (double heterozygous) and Lgr5EGFP-ires-CreERT2;Apcfl/fl (heterozygous and homozygous, respectively) male and female mice (Bl6 background) were housed under standard laboratory conditions and received standard laboratory chow and water ad libitum prior to start of the experiment. Mice entered the experiment between 8-12 weeks of age. Male and female littermates were randomly assigned to experimental groups and analysis was performed in a blinded fashion. We did not observe differences in the quantified effects of CR, except when looking at bodyweight.
Method Details
Diet
Calorie restriction in mice was performed according to established protocols (Pugh et al., 1999). All mice were fed an AIN-93M control diet (Plexx B.V.; F05312) ad libitum for 2 weeks to get used to the food. From the third week, mice were housed individually and food intake was measured three times. In the fourth week, mice were randomly divided into two groups: CR mice received 80% of their ad libitum food intake using the AIN-93M 20% CR diet (Plexx B.V.; F06298), while control mice received 90% of their ad libitum food intake using the AIN-93M control diet. After one week, CR mice were switched to AIN-93M 40% CR diet (Plexx B.V.; F05314) and fed 60% of their ad libitum food intake, while control mice received 90% of their ad libitum food intake using the control diet. The mice were fed with these diets for > 5 weeks. For diet switching experiments, diets were switched from control to CR and from CR to control after 8-16 weeks with a transition period of 1 week for both groups on 80% of ad libitum food intake of AIN-93M 20% CR diet. Subsequently, the mice were on the new diet for 8 weeks.
Lineage tracing
For confetti lineage tracing experiments, mice received an intraperitoneal injection with 1 mg / 30 g bodyweight tamoxifen (Sigma, T5648) dissolved in oil resulting in maximally 1 labeled cell per ∼10 crypts. For crypt pattern experiments, mice were injected with 5 mg / 30 g bodyweight tamoxifen, while for Apcfl/fl tracing experiments, mice received 3 mg / 30 g bodyweight tamoxifen. Mice were sacrificed at specified time points and the distal small intestine was isolated for direct imaging or further processing.
Repetitive in vivo imaging
Before and 8-12 hour after surgery mice received buprenorphine (subcutaneous, 100 ug/kg mouse, Temgesic; BD Pharmaceutical System). In addition, mice received Rimadyl (64 μg/ml, Carprofen; Zoetis B.V.) in the drinking water from 1 day prior to surgery until 3 days post-surgery. For surgery, mice were anesthetized through inhalation of ∼2% isoflurane (v/v). The abdomen was shaved and sterilized using povidone-iodine solution (Betadine). A midline abdominal incision was made and the distal small intestine was exposed and placed on sterile, PBS drenched gauze. The animal was placed in a custom-made imaging box and tissue hydration was maintained by creating a wet chamber, covering the mice with parafilm and the exposed tissue with PBS drenched gauze. During imaging, anesthesia was maintained with ∼1.5% isoflurane (v/v). The mice were imaged 12 weeks after clone induction for the crypt density experiment to create a recognizable pattern and 48 h after clone induction for the mutation retention experiment. The second imaging session was 8-12 weeks after the first session. Images were recorded using an inverted Leica TCS SP8 multiphoton microscope. All images were collected in 12 bit with 25X water immersion objective (HC FLUOTAR L N.A. 0.95 W VISIR 0.17 FWD 2.4 mm). Overview images were recorded using a color camera and the Navigator function in the Leica LasX software. After imaging, the intestine was placed back and the abdomen was closed using resorbable sutures (GMED Healthcare BVBA). For diet switching experiments, the day after the first imaging session the diets were switched for half the mice in the control and CR groups.
Whole mount preparation
To prepare intestinal whole mounts, the distal small intestine was harvested and directly put on ice. After flushing three times with ice cold PBSO it was cut open along its length. Using a cover glass, the villi were scraped off and the tissue was washed in ice cold PBSO. After fixing the tissue for 30 min in 4% formaldehyde solution (w/v) (Klinipath), the tissue was washed and either directly mounted between two coverslips using Vectashield HardSet Antifade Mounting Medium (Vector Laboratories) or further processed for immunofluorescence (see below). For long-term storage while maintaining endogenous fluorescence, tissues were fixed in periodate-lysine-4% paraformaldehyde (PLP) buffer (McLean and Nakane, 1974) overnight at 4°C, incubated in 30% sucrose > 6h at 4°C and embedded in Tissue Freezing medium (Leica Biosystems).
Immunofluorescence
Stainings were performed on either 4% formaldehyde (w/v) (Klinipath) fixed or PLP fixed whole mounts. Tissues were blocked and permeabilized using 3% bovine serum albumin (w/v) (BSA) and 0.8% Triton X-100 in PBS. The stainings were performed with the following primary antibodies: anti-GFP (Abcam, cat. no. ab6673), anti-RFP (Rockland, cat. no. 600-401-379), anti-lysozyme (DAKO, A0099) and anti-Phospho-Histone H3 (Ser10) (Millipore, 06-570). Secondary antibodies were combined with DAPI and/or phalloidin (Life Technologies, A-22287) and the tissue was mounted using Vectashield HardSet Antifade Mounting Medium (Vector Laboratories). To visualize the whole crypt-villus axis, tissues were cleared using FUnGI as described in Rios et al., 2019 (Rios et al., 2019). Whole mount preparations were imaged with TCS SP8 confocal and multiphoton microscopes (Mannheim, Germany). All images were collected with 20X dry (HCX IRAPO N.A. 0.70 WD 0.5 mm) or 25X water immersion (HC FLUOTAR L N.A. 0.95 W VISIR 0.17 FWD 2.4 mm) objectives in 12 bit. Images were only if necessary, corrected for bleed through, cropped, smoothened, rotated and contrasted linearly in Fiji. Quantification was performed in Fiji.
Cell proliferation
To label cells in S-phase, 1 mg of 5-ethynyl-2-deoxyuridine (EdU, 200 ul in PBS) was injected intraperitoneally. After 4 hours, the intestine was isolated and whole mounts were prepared as described above. Click-it staining reaction was performed according to the manufacturer’s protocol (Click-it EdU, cat. no. C10340; ThermoFisher). The tissues were incubated with a GFP (Abcam, cat. no. ab6673) and lysozyme (DAKO; cat. no. A0099) primary antibodies. DAPI was combined with the secondary antibodies after which the tissues were mounted using Vectashield HardSet Antifade Mounting Medium (Vector Laboratories).
In situ hybridization
In situ hybridization for Notum (Advanced Cell Diagnostics, #472548) mRNA was performed using RNAScope 2.5 LS Reagent Kit–BROWN (Advanced Cell Diagnostics) on a BOND RX autostainer (Leica) according to the manufacturer’s instructions. Positive control probes (Mm-Ppib; Advanced Cell Diagnostics, #313918) were included in each run to ensure RNA integrity and staining specificity.
Quantification and Statistical Analysis
Statistical details can be found in the figure legends. A Mann-Whitney test was performed using GraphPad Prism (GraphPad Software, LA Jolla, CA) to determine statistically significant differences between two means. Differences were considered statistically significant when p < 0.05. R2 was determined using linear regression in GraphPad Prism (GraphPad Software, LA Jolla, CA).
Acknowledgments
The authors would like to thank the staff at The Hubrecht Institute animal facility and the Netherlands Cancer Institute (NKI) animal facility and bioimaging facility for technical support and input and members of the van Rheenen laboratory for discussions. They would also like to thank Maartje Damen for help with the graphical abstract. This work was supported by the Netherlands Organization of Scientific Research (NWO) (Veni grant 863.15.011 to S.I.J.E. and Cancer Genomics Netherlands to J.v.R.), the European Research Council (consolidator grant 648804 to J.v.R.), Worldwide Cancer Research (grant 13-0297 to J.v.R.), the Dutch Cancer Society (KWF) (grant 2013-6070 to H.J.S.), and the Doctor Josef Steiner Foundation, Switzerland (to J.v.R.). This work was also supported by a Cancer Research UK core grant to the Beatson Institute (A17196) and core funding to O.J.S. (A21139). In particular, they would like to thank the Core Services and Advanced Technologies at the Cancer Research UK Beatson Institute. D.J.F. was funded by MRC grant MR/R017247/1.
Author Contributions
L.B., H.J.S., and J.v.R. perceived the conceptual ideas and designed the experiments. L.B., S.I.J.E., H.J.S., and J.v.R. wrote the manuscript. L.B., S.I.J.E., S.J.E.S., M.A., A.J.H., and P.T. performed experiments. D.J.F. and O.J.S. facilitated the in situ hybridizations.
Declaration of Interests
The authors declare no competing interests.
Published: July 21, 2020
Footnotes
Supplemental Information can be found online at https://doi.org/10.1016/j.celrep.2020.107937.
Contributor Information
Hugo Johannes Snippert, Email: h.j.g.snippert@umcutrecht.nl.
Jacco van Rheenen, Email: j.v.rheenen@nki.nl.
Supplemental Information
References
- Akagi K., Wilson K.A., Katewa S.D., Ortega M., Simons J., Hilsabeck T.A., Kapuria S., Sharma A., Jasper H., Kapahi P. Dietary restriction improves intestinal cellular fitness to enhance gut barrier function and lifespan in D. melanogaster. PLoS Genet. 2018;14:e1007777. doi: 10.1371/journal.pgen.1007777. [DOI] [PMC free article] [PubMed] [Google Scholar]
- Barker N., van Es J.H., Kuipers J., Kujala P., van den Born M., Cozijnsen M., Haegebarth A., Korving J., Begthel H., Peters P.J., Clevers H. Identification of stem cells in small intestine and colon by marker gene Lgr5. Nature. 2007;449:1003–1007. doi: 10.1038/nature06196. [DOI] [PubMed] [Google Scholar]
- Bartke A., Wright J.C., Mattison J.A., Ingram D.K., Miller R.A., Roth G.S. Extending the lifespan of long-lived mice. Nature. 2001;414:412. doi: 10.1038/35106646. [DOI] [PubMed] [Google Scholar]
- Beyaz S., Mana M.D., Roper J., Kedrin D., Saadatpour A., Hong S.J., Bauer-Rowe K.E., Xifaras M.E., Akkad A., Arias E. High-fat diet enhances stemness and tumorigenicity of intestinal progenitors. Nature. 2016;531:53–58. doi: 10.1038/nature17173. [DOI] [PMC free article] [PubMed] [Google Scholar]
- Bruens L., Ellenbroek S.I.J., van Rheenen J., Snippert H.J. In vivo imaging reveals existence of crypt fission and fusion in adult mouse intestine. Gastroenterology. 2017;153:674–677.e3. doi: 10.1053/j.gastro.2017.05.019. [DOI] [PMC free article] [PubMed] [Google Scholar]
- Clavería C., Torres M. Cell competition: mechanisms and physiological roles. Annu. Rev. Cell Dev. Biol. 2016;32:411–439. doi: 10.1146/annurev-cellbio-111315-125142. [DOI] [PubMed] [Google Scholar]
- Clevers H. The intestinal crypt, a prototype stem cell compartment. Cell. 2013;154:274–284. doi: 10.1016/j.cell.2013.07.004. [DOI] [PubMed] [Google Scholar]
- Colman R.J., Anderson R.M., Johnson S.C., Kastman E.K., Kosmatka K.J., Beasley T.M., Allison D.B., Cruzen C., Simmons H.A., Kemnitz J.W., Weindruch R. Caloric restriction delays disease onset and mortality in rhesus monkeys. Science. 2009;325:201–204. doi: 10.1126/science.1173635. [DOI] [PMC free article] [PubMed] [Google Scholar]
- Ellis S.J., Gomez N.C., Levorse J., Mertz A.F., Ge Y., Fuchs E. Distinct modes of cell competition shape mammalian tissue morphogenesis. Nature. 2019;569:497–502. doi: 10.1038/s41586-019-1199-y. [DOI] [PMC free article] [PubMed] [Google Scholar]
- Heydari A.R., Unnikrishnan A., Lucente L.V., Richardson A. Caloric restriction and genomic stability. Nucleic Acids Res. 2007;35:7485–7496. doi: 10.1093/nar/gkm860. [DOI] [PMC free article] [PubMed] [Google Scholar]
- Huels D.J., Bruens L., Hodder M.C., Cammareri P., Campbell A.D., Ridgway R.A., Gay D.M., Solar-Abboud M., Faller W.J., Nixon C. Wnt ligands influence tumour initiation by controlling the number of intestinal stem cells. Nat. Commun. 2018;9:1132. doi: 10.1038/s41467-018-03426-2. [DOI] [PMC free article] [PubMed] [Google Scholar]
- Igarashi M., Guarente L. mTORC1 and SIRT1 cooperate to foster expansion of gut adult stem cells during calorie restriction. Cell. 2016;166:436–450. doi: 10.1016/j.cell.2016.05.044. [DOI] [PubMed] [Google Scholar]
- Kleeman S.O., Koelzer V.H., Jones H.J., Vazquez E.G., Davis H., East J.E., Arnold R., Koppens M.A., Blake A., Domingo E. Exploiting differential Wnt target gene expression to generate a molecular biomarker for colorectal cancer stratification. Gut. 2019;69:1092–1103. doi: 10.1136/gutjnl-2019-319126. [DOI] [PMC free article] [PubMed] [Google Scholar]
- Kolahgar G., Suijkerbuijk S.J.E., Kucinski I., Poirier E.Z., Mansour S., Simons B.D., Piddini E. Cell competition modifies adult stem cell and tissue population dynamics in a JAK-STAT-dependent manner. Dev. Cell. 2015;34:297–309. doi: 10.1016/j.devcel.2015.06.010. [DOI] [PMC free article] [PubMed] [Google Scholar]
- Kon S., Ishibashi K., Katoh H., Kitamoto S., Shirai T., Tanaka S., Kajita M., Ishikawa S., Yamauchi H., Yako Y. Cell competition with normal epithelial cells promotes apical extrusion of transformed cells through metabolic changes. Nat. Cell Biol. 2017;19:530–541. doi: 10.1038/ncb3509. [DOI] [PubMed] [Google Scholar]
- López-Otín C., Blasco M.A., Partridge L., Serrano M., Kroemer G. The hallmarks of aging. Cell. 2013;153:1194–1217. doi: 10.1016/j.cell.2013.05.039. [DOI] [PMC free article] [PubMed] [Google Scholar]
- Mai V., Colbert L.H., Berrigan D., Perkins S.N., Pfeiffer R., Lavigne J.A., Lanza E., Haines D.C., Schatzkin A., Hursting S.D. Calorie restriction and diet composition modulate spontaneous intestinal tumorigenesis in Apc(Min) mice through different mechanisms. Cancer Res. 2003;63:1752–1755. [PubMed] [Google Scholar]
- McLean I.W., Nakane P.K. Periodate-lysine-paraformaldehyde fixative. A new fixation for immunoelectron microscopy. J. Histochem. Cytochem. 1974;22:1077–1083. doi: 10.1177/22.12.1077. [DOI] [PubMed] [Google Scholar]
- Merino M.M., Rhiner C., Lopez-Gay J.M., Buechel D., Hauert B., Moreno E. Elimination of unfit cells maintains tissue health and prolongs lifespan. Cell. 2015;160:461–476. doi: 10.1016/j.cell.2014.12.017. [DOI] [PMC free article] [PubMed] [Google Scholar]
- Pugh T.D., Klopp R.G., Weindruch R. Controlling caloric consumption: protocols for rodents and rhesus monkeys. Neurobiol. Aging. 1999;20:157–165. doi: 10.1016/s0197-4580(99)00043-3. [DOI] [PubMed] [Google Scholar]
- Rios A.C., Capaldo B.D., Vaillant F., Pal B., van Ineveld R., Dawson C.A., Chen Y., Nolan E., Fu N.Y., Jackling F.C., 3DTCLSM Group Intraclonal plasticity in mammary tumors revealed through large-scale single-cell resolution 3D imaging. Cancer Cell. 2019;35:618–632.e6. doi: 10.1016/j.ccell.2019.02.010. [DOI] [PubMed] [Google Scholar]
- Ritsma L., Ellenbroek S.I.J., Zomer A., Snippert H.J., de Sauvage F.J., Simons B.D., Clevers H., van Rheenen J. Intestinal crypt homeostasis revealed at single-stem-cell level by in vivo live imaging. Nature. 2014;507:362–365. doi: 10.1038/nature12972. [DOI] [PMC free article] [PubMed] [Google Scholar]
- Sasaki A., Nagatake T., Egami R., Gu G., Takigawa I., Ikeda W., Nakatani T., Kunisawa J., Fujita Y. Obesity suppresses cell-competition-mediated apical elimination of RasV12-transformed cells from epithelial tissues. Cell Rep. 2018;23:974–982. doi: 10.1016/j.celrep.2018.03.104. [DOI] [PMC free article] [PubMed] [Google Scholar]
- Shibata H., Toyama K., Shioya H., Ito M., Hirota M., Hasegawa S., Matsumoto H., Takano H., Akiyama T., Toyoshima K. Rapid colorectal adenoma formation initiated by conditional targeting of the APC gene. Science. 1997;278:120–133. doi: 10.1126/science.278.5335.120. [DOI] [PubMed] [Google Scholar]
- Snippert H.J., van der Flier L.G., Sato T., van Es J.H., van den Born M., Kroon-Veenboer C., Barker N., Klein A.M., van Rheenen J., Simons B.D., Clevers H. Intestinal crypt homeostasis results from neutral competition between symmetrically dividing Lgr5 stem cells. Cell. 2010;143:134–144. doi: 10.1016/j.cell.2010.09.016. [DOI] [PubMed] [Google Scholar]
- Snippert H.J., Schepers A.G., van Es J.H., Simons B.D., Clevers H. Biased competition between Lgr5 intestinal stem cells driven by oncogenic mutation induces clonal expansion. EMBO Rep. 2014;15:62–69. doi: 10.1002/embr.201337799. [DOI] [PMC free article] [PubMed] [Google Scholar]
- Sohal R.S., Weindruch R. Oxidative stress, caloric restriction, and aging. Science. 1996;273:59–63. doi: 10.1126/science.273.5271.59. [DOI] [PMC free article] [PubMed] [Google Scholar]
- Tian A., Benchabane H., Wang Z., Zimmerman C., Xin N., Perochon J., Kalna G., Sansom O.J., Cheng C., Cordero J.B., Ahmed Y. Intestinal stem cell overproliferation resulting from inactivation of the APC tumor suppressor requires the transcription cofactors Earthbound and Erect wing. PLoS Genet. 2017;13:e1006870. doi: 10.1371/journal.pgen.1006870. [DOI] [PMC free article] [PubMed] [Google Scholar]
- van Rheenen J., Bruens L. Cellular protection mechanisms that minimise accumulation of mutations in intestinal tissue. Swiss Med. Wkly. 2017;147:w14539. doi: 10.4414/smw.2017.14539. [DOI] [PubMed] [Google Scholar]
- Vermeulen L., Morrissey E., van der Heijden M., Nicholson A.M., Sottoriva A., Buczacki S., Kemp R., Tavaré S., Winton D.J., Nowell P.C. Defining stem cell dynamics in models of intestinal tumor initiation. Science. 2013;342:995–998. doi: 10.1126/science.1243148. [DOI] [PubMed] [Google Scholar]
- Yan K.S., Janda C.Y., Chang J., Zheng G.X.Y., Larkin K.A., Luca V.C., Chia L.A., Mah A.T., Han A., Terry J.M. Non-equivalence of Wnt and R-spondin ligands during Lgr5+ intestinal stem-cell self-renewal. Nature. 2017;545:238–242. doi: 10.1038/nature22313. [DOI] [PMC free article] [PubMed] [Google Scholar]
- Yilmaz Ö.H., Katajisto P., Lamming D.W., Gültekin Y., Bauer-Rowe K.E., Sengupta S., Birsoy K., Dursun A., Yilmaz V.O., Selig M. mTORC1 in the Paneth cell niche couples intestinal stem-cell function to calorie intake. Nature. 2012;486:490–495. doi: 10.1038/nature11163. [DOI] [PMC free article] [PubMed] [Google Scholar]
Associated Data
This section collects any data citations, data availability statements, or supplementary materials included in this article.
Supplementary Materials
Data Availability Statement
All used software is listed in the Key Resources Table. This study did not generate new datasets.