

Abstract
Interestingly, only the D‐form of firefly luciferin produces light by luciferin–luciferase (L–L) reaction. Certain firefly luciferin analogues with modified structures maintain bioluminescence (BL) activity; however, all L‐form luciferin analogues show no BL activity. To this date, our group has developed luciferin analogues with moderate BL activity that produce light of various wavelengths. For in vivo bioluminescence imaging, one of the important factors for detection sensitivity is tissue permeability of the number of photons emitted by L–L reaction, and the wavelengths of light in the near‐infrared (NIR) range (700–900 nm) are most appropriate for the purpose. Some NIR luciferin analogues by us had performance for in vivo experiments to make it possible to detect photons from deep target tissues in mice with high sensitivity, whereas only a few of them can produce NIR light by the L–L reactions with wild‐type luciferase and/or mutant luciferase. Based on the structure–activity relationships, we designed and synthesized here a luciferin analogue with the 5‐allyl‐6‐dimethylamino‐2‐naphthylethenyl moiety. This analogue exhibited NIR BL emissions with wild‐type luciferase (λ max = 705 nm) and mutant luciferase AlaLuc (λ max = 655 nm).
Keywords: Akaluc, luciferin analogues, luciferin‐luciferase reaction, mutant luciferase, near‐infrared bioluminescence, Photinus pyralis luciferase, TokeOni
1. INTRODUCTION
Firefly bioluminescence (BL) showed light emission caused by the reaction of firefly luciferin (1, Figure 1) catalyzed with firefly luciferase in the presence of Mg2+, in which 1 is first adenylated with ATP followed by the oxidative reaction with O2 to generate oxyluciferin with a yellow‐green light (λ max = 560 nm). 1 , 2 This reaction is termed as the luciferin–luciferase (L–L) reaction. Firefly luciferin 1 and luciferase are biosynthesized in the body of firefly, and 1 has a chiral center at C3 with the same stereochemistry as unnatural d‐cysteine (d‐form). Interestingly, despite the fact that the l‐form of firefly luciferin has significantly low BL activity of L–L reaction 1 , 3 , 4 ; however, we reported that the l‐form of firefly luciferin is able to produce light by conversion to d‐form 1 through the luciferyl‐CoA under the action of luciferase. 5
FIGURE 1.
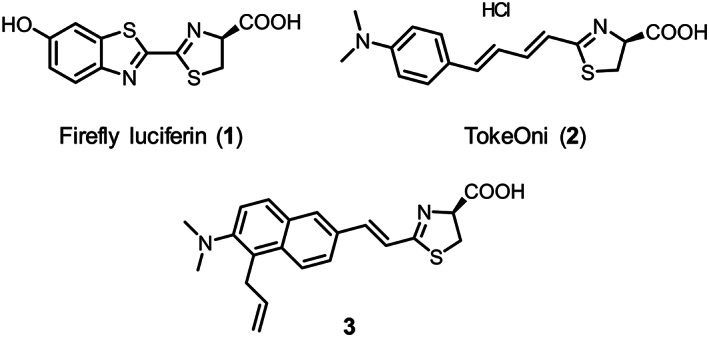
Structures of firefly luciferin (1), TokeOni (2), and designed luciferin analogue 3 [Correction added on 5 June 2020, after first online publication: The figure 1 image has been corrected.]
The L–L reaction is applied to optical imaging techniques in the fundamental research fields of medical and biological sciences. 6 , 7 , 8 One of the solutions to improve optical in vivo imaging technique is an increase in the permeability of light from deep site of biological tissue. Because the permeability of near‐infrared (NIR) light is higher than that of visible light (450–600 nm) for biological tissue, 9 , 10 researchers have been engaged in developing luciferin analogues 11 , 12 and mutant luciferases 13 producing NIR light by the L–L reactions. These luciferin analogues and mutant luciferases successfully enabled high‐resolution optical in vivo imaging compared with the use of the wild‐type luciferin 1 and luciferase. Our group developed luciferin analogues producing light with various wavelengths, 14 , 15 , 16 , 17 and some of the analogues were tested for in vivo experiments. Then, we confirmed that the analogues enabled to detect light emission from the deep target tissue of mice with high sensitively. 18 , 19 , 20 In addition, Aka‐BLI, which is the combination of a NIR luciferin analogue, TokeOni (2, Figure 1) with a mutant luciferase, Akaluc, produced NIR light and made it possible to detect the BL emission from the brain in a marmoset. 21
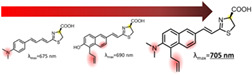
Although, there are a number of luciferin analogues, only limited analogues can produce NIR light (over 700 nm) reacted with wild‐type luciferase. To design a new luciferin analogue, we have evaluated a structure–BL activity relationship of our luciferin analogues for the wavelength of L–L reaction with wild‐type luciferase (Figure 2). 14 , 17 One conclusion of the evaluations lead us to design analogue 3 based on the data of 2, 4, and 5. The BL emission maximum (λ BL) of 2 with the dimethylamino group is 35‐nm red shifted from that of 4 with the hydroxyl group, although 2 and 4 have the common phenyl‐1,3‐butadiene structure. 14 When 4 and 5, both of which contain the hydroxyl group, are compared, the λ BL of 5 is 50‐nm red shifted from that of 4. 17 Hence, we designed 3 to have the 5‐allyl‐2‐naphthylethenyl moiety and a dimethylamino group at C6. The structure–BL activity relationship predicts that the λ BL value of 3 will be 725 nm. In this report, we prepared 3 and investigated its BL activity with Photinus pyralis (Ppy) luciferase and Akaluc, 17 comparing its properties to those of 1, 2, and 5.
FIGURE 2.

Structure–BL activity relationships for luciferin analogues. Analogues 2, 4, and 5 were previously reported 14 , 17
2. MATERIALS AND METHODS
2.1. General
Commercially available reagents and solvents were used without further purification. For bioluminescence measurements, TokeOni (2) was provided by Kurogane Kasei Co., Ltd. and recombinant Ppy luciferase (QuantiLum® recombinant luciferase, E1701, Promega) was used. Wako Silica gel 70 F254 thin‐layer chromatography plates were used for analytical thin‐layer chromatography, and Kanto Chemical Silica gel 60 N (spherical, neutral) was used for column chromatography. For preparative flash chromatography, an automated system (Smart Flash EPCLC AI‐580S, Yamazen Corp., Japan) was used with universal columns of silica gel. Melting points were measured with a Yanaco MP‐500P. IR spectra were obtained with a Nicolet 6700 spectrometer with an attenuated total reflection attachment.1H and 13C nuclear magnetic resonance (NMR) spectra were recorded on a JEOL ECA‐500 instrument (500 MHz for 1H and 126 MHz for 13C). High‐resolution electrospray ionization mass spectra were obtained with a JEOL JMS‐T100LC mass spectrometer. The optical purities of NIR analogue 3 was analyzed by high‐performance liquid chromatography (HPLC; Agilent 1100 series) using a Daicel chiral column (Daicel Chemical Industries, OD‐RH, 5 μm, 4.6 × 150 mm, flow rate 0.5 ml/min). Bioluminescence spectra were measured with an ATTO AB‐1850 spectrophotometer. Bioluminescence intensities were monitored using an ATTO AB‐2270 luminometer. Density functional theory (DFT) calculations were performed with the Gaussian 09 program (Rev. D.01). 22 DFT included the B3LYP function with the 6–31 + G(d) basis set. 23 , 24 , 25 Molecular graphics were prepared with GaussView, Version 5. 26
2.2. Synthesis of NIR analogue 3
2.2.1. Bromoamine 3b
A solution of 6‐amino‐2‐naphthoic acid methyl ester (3a) (5.35 g, 26.6 mmol) in dimethyl sulphoxide (DMSO; 50 ml) and N‐bromosuccinimide (4.84 g, 27.2 mmol) was added, and the mixture was stirred for 10 min at r.t. The reaction mixture was diluted with water and extracted with ethyl acetate (3 × 150 ml). The combined organic layers were dried over Na2SO4, filtered, and the solvent are removed under reduced pressure. The obtained residue was purified by silica gel column chromatography (hexane/ethyl acetate = 4/1) to yield bromoamine 3b (6.97 g, 24.9 mmol, 93%) as a light brown solid: 1H NMR (500 MHz, CDCl3) δ 8.43 (d, J = 1.7, 1H), 8.06 (dd, J = 8.6, 1.7 Hz, 1H), 8.03 (d, J = 8.6 Hz, 1H), 7.70 (d, J = 8.6 Hz, 1H), 7.03 (d, J = 8.6 Hz, 1H), 3.96 (s, 3H); 13C NMR (126 MHz, CDCl3) δ 167.29, 144.31, 135.62, 131.30, 130.16, 127.46, 127.34, 125.09, 124.36, 118.24, 103.40, 77.38, 77.12, 76.86, 52.20; HR‐ESI‐MS: m/z: [M + H]+ calcd for C12H11BrNO2, 279.9973, 281.9953; found, 279.9931, 281.9910.401.
2.2.2. Dimethylamine 3c
To a solution of bromoamine 3b (2.39 g, 8.54 mmol) in tetrahydrofuran (30 ml), sodium cyanoborohydride (2.63 g, 41.9 mmol) and formaldehyde (35% in H2O, 15 ml, 195 mmol) were added, and the mixture was stirred in an ice bath. The mixture was slowly added to acetic acid (4 ml, 70 mmol) and stirred for 14 h. To the reaction mixture, saturated NaHCO3 aqueous solution (100 ml) was added to quench the reaction. Further, the reaction mixture was diluted with water and extracted with ethyl acetate (3 × 100 ml). The combined organic layers were dried over Na2SO4, filtered, and the solvents was removed under reduced pressure. The obtained residue was purified by silica gel column chromatography (hexane only to hexane/ethyl acetate = 3/1) to yield dimethylamine 3c (912 mg, 2.96 mmol, 35%) as a white solid: 1H NMR (500 MHz, CDCl3) δ 8.50 (s, 1H), 8.31 (d, J = 8.6 Hz, 1H), 8.08 (dd, J = 9.2, 1.7 Hz, 1H), 7.86 (d, J = 8.6 Hz, 1H), 7.41 (d, J = 8.6 Hz, 1H), 3.97 (s, 3H), 2.95 (s, 6H); 13C NMR (126 MHz, CDCl3) δ 167.11, 152.03, 135.86, 131.09, 130.02, 129.85, 127.15, 126.82, 126.28, 120.87, 116.27, 52.32, 44.40; HR‐ESI‐MS: m/z: [M + H]+ calcd for C14H15BrNO2, 308.0286, 310.0266; found, 308.0295, 310.0274.
2.2.3. Allyl dimethylamine 3d
To a solution of dimethylamine 3c (2.61 g, 8.46 mmol) in dimethylformamide (40 ml), allyltributylitin (3.4 ml, 11 mmol), LiCl (1.14 g, 28.3 mmol), and Pd (PPh3)2Cl2 (584 mg, 0.832 mmol) were added, and the mixture was stirred for 10 h at 90°C. The reaction mixture was purified by silica gel column chromatography with 10 wt% K2CO3 (hexane/ethyl acetate = 1/1). The obtained crude compound was purified by silica gel column chromatography (hexane/ethyl acetate = 4/1) to yield allyl dimethylamine 3d (2.15 g, 7.99 mmol, 94%) as a colorless oil: 1H NMR (500 MHz, CDCl3) δ 8.54 (d, J = 1.7 Hz, 1H), 8.02 (dd, J = 8.9, 2.0 Hz, 1H), 7.95 (d, J = 8.6 Hz, 1H), 7.83 (d, J = 8.6 Hz, 1H), 7.45 (d, J = 8.6 Hz, 1H), 6.12–6.19 (m, 1H), 5.91–6.00 (m, 1H), 5.08 (dd, J = 10.3, 1.7 Hz, 1H), 4.89 (dd, J = 17.2, 1.7 Hz, 1H), 4.80 (dd, J = 16.6, 1.7 Hz, 1H), 4.66 (dd, J = 10.0, 2.0 Hz, 1H), 4.00 (q, J = 2.3 Hz, 1H), 3.96 (s, 3H), 2.79 (s, 6H); 13C NMR (126 MHz, CDCl3) δ 167.11, 152.03, 135.86, 131.09, 130.02, 129.85, 127.15, 126.82, 126.28, 120.87, 116.27, 52.32, 44.40; HR‐ESI‐MS: m/z: [M + H]+ calcd for C17H20NO2, 270.1494; found, 270.1448.
2.2.4. Allyl alcohol 3e
A solution of allyl dimethylamine 3d (2.15 mg, 7.99 mmol) in dry toluene (30 ml) under Ar at 0°C was slowly added 1.0‐M diisobutylaluminium hydride (DIBAL‐H) in toluene (16.0 ml, 16 mmol), and the mixture was stirred for 1 h at r.t. Then to the reaction mixture was added 1‐M hydrochloric acid (10 ml). The mixed solution was extracted with ethyl acetate (3 × 100 ml). The combined organic layers were dried over Na2SO4, filtered, and the solvent was removed under reduced pressure. The obtained residue was purified by silica gel column chromatography (hexane/ethyl acetate = 3/1) to yield alcohol 3e (1.65 mg, 6.83 mmol, 85%) as a colorless oil: 1H NMR (500 MHz, CDCl3) δ 7.92 (d, J = 9.2 Hz, 1H), 7.69 (d, J = 9.2 Hz, 2H), 7.41 (d, J = 8.6 Hz, 2H), 6.12 (qd, J = 11.0, 5.3 Hz, 1H), 5.03 (d, J = 10.3 Hz, 1H), 4.88 (d, J = 17.2 Hz, 1H), 4.78 (d, J = 6.9 Hz, 2H), 3.99 (q, J = 1.7 Hz, 2H), 2.75 (s, 6H); 13C NMR (126 MHz, CDCl3) δ 150.19, 137.84, 136.63, 132.92, 130.89, 128.76, 127.75, 126.04, 125.50, 125.31, 120.16, 115.60, 65.46, 45.77, 31.15; HR‐ESI‐MS: m/z: [M + H]+ calcd for C16H20NO, 242.1545; found, 242.1507.
2.2.5. Allyl aldehyde 3f
To a solution of alcohol 3e (1.46 mg, 6.07 mmol) in dichloromethane (50 ml), Dess–Martin periodinane (2.71 g, 6.39 mmol) and pyridine (1.0 ml, 12 mmol) were added, and the mixture was stirred for 5 h at r.t. The reaction mixture was diluted with water and extracted with chloroform (3 × 100 ml). The combined organic layer was dried over Na2SO4, filtered, and the solvent was removed under reduced pressure. The obtained residue was purified by silica gel column chromatography (hexane/ethyl acetate = 5/1) to yield allyl aldehyde 3f (477 mg, 2.00 mmol, 33%) as a yellow oil: 1H NMR (500 MHz, CDCl3) δ 10.11 (s, 1H), 8.26 (d, J = 1.7 Hz, 1H), 7.99 (d, J = 9.2 Hz, 1H), 7.87–7.90 (complex, 2H), 7.48 (d, J = 8.6 Hz, 1H), 6.12–6.20 (m, 1H), 5.09 (dq, J = 10.3, 1.9 Hz, 1H), 4.88 (dq, J = 17.2, 1.9 Hz, 1H), 3.97–3.99 (m, 2H), 2.82 (s, 6H); 13C NMR (126 MHz, CDCl3) δ 192.17, 153.35, 137.19, 136.84, 134.88, 132.27, 129.50, 129.36, 127.84, 125.83, 122.77, 120.70, 115.99, 45.18, 31.37; HR‐ESI‐MS: m/z: [M + H]+ calcd for C16H18NO, 240.1388; found, 240.1359.
2.2.6. Allyl ethyl ester 3g
A solution of allyl aldehyde 3f (474 mg, 1.98 mmol) in toluene (15 ml) and (carbethoxymethylene)triphenylphosphorane (2.03 g, 5.82 mmol) was added, and the mixture was stirred for 7 h at r.t. The reaction mixture was purified by silica gel column chromatography (hexane/ethyl acetate = 7/1) to yield allyl ethyl ester 3g (584 mg, 1.89 mmol, 95%) as a green‐yellow oil: 1H NMR (500 MHz, CDCl3) δ 7.91 (d, J = 9.2 Hz, 1H), 7.86 (d, J = 1.1 Hz, 1H), 7.82 (d, J = 16.0 Hz, 1H), 7.74 (d, J = 8.6 Hz, 1H), 7.63 (dd, J = 9.2, 1.7 Hz, 1H), 7.43 (d, J = 9.2 Hz, 1H), 6.50 (d, J = 16.0 Hz, 1H), 6.10–6.18 (m, 1H), 5.06 (dd, J = 10.3, 1.7 Hz, 1H), 4.89 (dd, J = 17.2, 1.7 Hz, 1H), 4.28 (q, J = 7.1 Hz, 2H), 3.98 (t, J = 2.6 Hz, 2H), 2.77 (s, 6H), 1.35 (t, J = 7.2 Hz, 3H); 13C NMR (126 MHz, CDCl3) δ 167.35, 151.61, 144.85, 137.58, 134.40, 130.55, 130.43, 130.17, 128.44, 125.71, 123.52, 120.56, 117.57, 115.80, 60.54, 45.51, 31.22, 14.46; HR‐ESI‐MS: m/z: [M + H]+ calcd for C20H24NO2, 310.1807; found, 310.1801.
2.2.7. Carboxylic acid 3h
A solution of allyl ethyl ester 3g (198 mg, 0.642 mmol) in 2‐propanol (4 ml) was added 1‐M NaOH aq. (2 ml), and the mixture was heated at reflux for 3 h. After cooling, the reaction mixture was neutralized by adding 1‐M HCl aq. The mixed solution was extracted with ethyl acetate (3 × 100 ml). The combined organic layers were dried over Na2SO4, filtered, and the solvent was removed under reduced pressure to give carboxylic acid 3h (148 mg, 0.525 mmol, 82%) as a green‐yellow solid: 1H NMR (500 MHz, CDCl3) δ 7.89–7.95 (m, 3H), 7.77 (d, J = 8.6 Hz, 1H), 7.66 (dd, J = 8.6, 1.7 Hz, 1H), 7.45 (d, J = 8.6 Hz, 1H), 7.26 (s, 2H), 6.53 (d, J = 16.0 Hz, 1H), 6.11–6.19 (m, 1H), 5.06–5.09 (m, 1H), 4.88–4.92 (m, 1H), 3.98 (t, J = 2.6 Hz, 2H), 2.78 (d, J = 7.4 Hz, 6H); 13C NMR (126 MHz, CDCl3) δ 172.26, 151.76, 147.09, 137.44, 134.59, 130.91, 130.39, 129.70, 128.50, 128.27, 125.73, 123.49, 120.53, 116.54, 115.77, 45.39, 31.16; HR‐ESI‐MS: m/z: [M + H]+ calcd for C18H20NO2, 282.1494; found, 282.1469.
2.2.8. Amide 3i
To a solution of carboxylic acid 3h (255 mg, 0.905 mmol) and S‐trityl‐d‐cysteine methyl ester (521 mg, 1.38 mmol) in dimethylformamide (10 ml), 4‐(4,6‐dimethoxy‐1,3,5‐triazin‐2‐yl)‐4‐methylmorpholinium chloride (DMT‐MM) was added, and the reaction mixture was stirred for 7 h at r.t. The reaction was quenched by adding water (50 ml), and the product was extracted with ethyl acetate (3 × 100 ml). The combined organic layer was dried over Na2SO4, filtered, and concentrated under reduced pressure. The residue was purified by silica gel column chromatography (hexane/ethyl acetate = 2/1) to yield amide 3i (551 mg, 0.859 mmol, 95%) as a green‐yellow solid 1H NMR (500 MHz, CDCl3) δ 7.93 (d, J = 8.6 Hz, 1H), 7.85 (d, J = 1.7 Hz, 1H), 7.75 (s, 1H), 7.73 (d, J = 6.9 Hz, 1H), 7.62 (dd, J = 9.2, 1.7 Hz, 1H), 7.44 (d, J = 9.2 Hz, 1H), 7.39–7.41 (m, 6H), 7.27–7.30 (m, 6H), 7.19–7.24 (m, 3H), 6.44 (d, J = 15.5 Hz, 1H), 6.11–6.19 (m, 2H), 5.06–5.09 (m, 1H), 4.90–4.94 (m, 1H), 4.78–4.82 (m, 1H), 3.99 (q, J = 1.9 Hz, 2H), 3.74 (s, 3H), 2.78 (d, J = 4.0 Hz, 6H); 13C NMR (126 MHz, CDCl3) δ 171.01, 165.45, 151.34, 144.31, 141.98, 137.51, 134.13, 130.56, 130.24, 130.03, 129.50, 128.40, 128.30, 128.03, 126.92, 125.57, 123.43, 120.43, 119.20, 115.70, 66.98, 52.71, 51.20, 45.45, 34.02, 31.11,; HR‐ESI‐MS: m/z: [M + Na]+ calculated for C41H40N2NaO3S, 663.2657; found, 663.2703, [M + K]+ calcd for C41H40N2KO3S, 679.2397; found, 679.2415.
2.2.9. Thiazolidine ester 3j
To a solution of trifluoromethanesulfonic anhydride (Tf2O) (0.30 ml, 1.8 mmol) in dichloromethane (5 ml), a solution of amide 3i (540 mg, 0.843 mmol) in dichloromethane (5 ml) was added under Ar at 0°C, and the mixture was stirred for 10 min. Saturated NaHCO3 aq. was added to the reaction mixture for neutralization. The product was extracted with chloroform (3 × 50 ml). The combined organic layer was dried over Na2SO4, filtered, and concentrated under reduced pressure. The crude products were purified by silica gel column chromatography (hexane/ethyl acetate = 5/1) to yield thiazolidine ester 3j (122 mg, 0.322 mmol, 39%) as orange oil: 1H NMR (500 MHz, CDCl3) δ 7.91 (d, J = 9.2 Hz, 1H), 7.81 (d, J = 1.7 Hz, 1H), 7.73 (d, J = 8.6 Hz, 1H), 7.62 (dd, J = 9.2, 1.7 Hz, 1H), 7.43 (d, J = 8.6 Hz, 1H), 7.28 (d, J = 16.0 Hz, 1H), 7.17 (d, J = 16.0 Hz, 1H), 6.11–6.16 (m, 1H), 5.22 (t, J = 9.2 Hz, 1H), 5.07 (dd, J = 10.3, 1.7 Hz, 1H), 4.90 (dd, J = 17.2, 1.7 Hz, 1H), 3.97–3.98 (m, 2H), 3.84 (s, 3H), 3.65 (dd, J = 10.9, 9.2 Hz, 1H), 3.58 (dd, J = 10.9, 9.2 Hz, 1H), 2.77 (s, 6H); 13C NMR (126 MHz, CDCl3) δ 171.31, 170.32, 151.37, 142.51, 137.48, 134.04, 130.52, 129.68, 128.41, 128.23, 125.71, 123.09, 121.60, 120.45, 115.72, 77.95, 52.87, 45.44, 34.61, 31.10; HR‐ESI‐MS: m/z: [M + H]+ calcd for C22H25N2O2S, 381.1637; found, 381.1623.
2.2.10. NIR analogue 3
A solution of thiazolidine ester 3j (32.8 mg, 0.0862 mmol) in 4 M HCl aq. (1 ml) and tetrahydrofuran (1 ml) was stirred at r.t. for 18 h. After neutralization of the reaction mixture by adding NaHCO3, the mixture was then concentrated under reduced pressure. The crude products were purified by automated flash chromatography (Smart Flash EPCLC AI‐580S, ULTRAPACK COLUMNS C18, H2O/methanol = 9/1 to 1/9) to yield NIR analogue 3 (8.7 mg, 0.023 mmol, 28%) as an orange solid: m.p. 160–164 °C; IR (attenuated total reflection, cm−1): 1590, 1369, 1195, 1143, 983, 955, 816; 1H NMR (500 MHz, CD3OD) δ 7.91 (t, J = 9.5 Hz, 2H), 7.77 (d, J = 9.2 Hz, 1H), 7.67 (dd, J = 8.9, 1.4 Hz, 1H), 7.47 (d, J = 8.6 Hz, 1H), 7.36 (d, J = 16.0 Hz, 1H), 7.15 (d, J = 16.0 Hz, 1H), 6.08–6.15 (m, 1H), 5.17 (t, J = 8.9 Hz, 1H), 5.02 (dd, J = 10.3, 1.7 Hz, 1H), 4.80–4.84 (m, 1H), 3.96 (t, J = 2.6 Hz, 2H), 3.59–3.69 (m, 2H), 2.75 (s, 6H); 13C NMR (126 MHz, CD3OD) δ 173.25, 171.83, 151.38, 143.03, 137.56, 134.08, 130.89, 130.68, 129.59, 128.38, 128.32, 125.53, 122.90, 120.44, 120.24, 114.61, 77.63, 44.51, 34.34, 30.59; HR‐ESI‐MS: m/z: [M + H]+ calcd for C21H23N2O2S, 367.1480; found, 367.1437; 93%e.e. from chiral HPLC on a CHIRALCEL OD‐RH (retention time of l‐isomer: 13.69 min; d‐isomer: 14.43 min; H2O containing with 0.1% formic acid/acetonitrile = 90/10 to 10/90; UV detection: 254 nm).
2.3. Luminescence measurements
Bioluminescence activities of 3 together with those of wild‐type luciferin 1 and TokeOni (2) were investigated using Ppy luciferase and Akaluc. The substrates were dissolved in 50‐mM potassium phosphate buffer (KPB, pH 6.0), Ppy luciferase and Akaluc were dissolved in 50‐mM KPB (pH 8.0) containing 35% glycerol, and Mg‐ATP was dissolved in ultrapure water. An L–L reaction was initiated by injection of 10 μl of Mg‐ATP (200 μM) into a mixture of 5 μl of a substrate solution (100 μM), 5 μl of luciferase solution (1 mg/ml), and 5 μl of KPB (500 mM, pH 8.0). Emission spectra were measured on the AB‐1850 spectrophotometer in the range of 400–790 nm (slit width: 1.0 mm; exposure time: 10 min [3 and 5] or 15 s [1 and 2]). Light emission intensity by Ppy luciferase was monitored on an AB‐1850 spectrophotometer to provide emission spectra (slit width: 1.0 mm; exposure time: 1 s; scan: 600), and light intensity was determined as the intensity at the λ BL value of the emission spectrum.
Chemiluminescence emission spectra for the reactions of the luciferin methyl esters of 1–2, 5, and 3j with t‐BuOK in DMSO under air were measured on an AB‐1850 spectrophotometer (slit width: 1.0 mm; exposure time: 180 s). A solution of the luciferin methyl ester (2.5 mm) in DMSO (200 μl) was placed in a polystyrene tube. This solution was mixed with t‐BuOK (250 mm) in DMSO (200 μl), which was injected with a syringe, to initiate the chemiluminescence reaction with final concentrations of the substrate (1.25 mm) and t‐BuOK (125 mm).
3. RESULTS AND DISCUSSION
3.1. Synthesis of luciferin analogue 3
Analogue 3 was prepared according the procedure as shown in Scheme 1. The synthesis of 3 was started from bromination of commercially available methyl ester 3a to obtain 3b. Dimethylation of 3b followed by allylation yielded 3d. Alcohol 3e was prepared from 3d via diisobutylaluminium hydride (DIBAL‐H) reduction. Allylaldehyde 3f was prepared via oxidation of 3e, followed by Dess–Martin periodinane. Wittig reaction of 3f with (carbethoxymethylene)triphenylphosphorane (Ph3PCHCOOEt) afforded ethyl ester 3g, which was hydrolyzed to give carboxylic acid 3h. The condensation of 3h with S‐trityl‐d‐cysteine methyl ester gave amide 3i, and the following thiazoline ring formation with trifluoromethanesulfonic anhydride (Tf2O) and triphenylphosphine oxide (Ph3PO) afforded ester 3j. Finally, acid hydrolysis of 3j produced target analogue 3.
SCHEME 1.
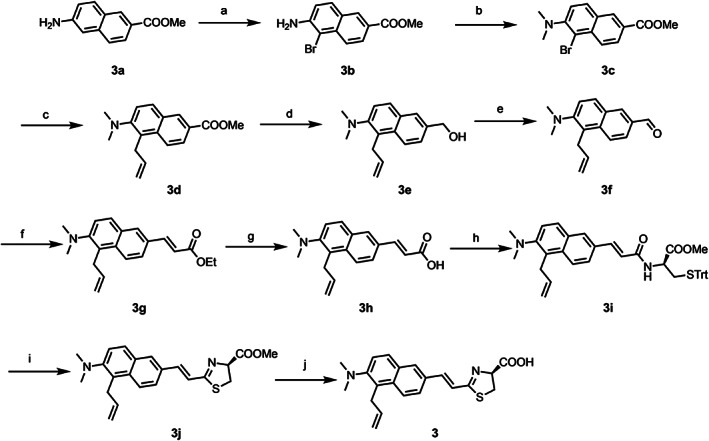
Synthetic routes for luciferin analogue 3. A, NBS, DMSO, r.t.; B, NaBH3CN, formaldehyde, CH3COOH, CH3OH, 0°C to r.t.; C, Allyltributyltin, Pd (PPh3)2Cl2, LiCl, DMF, 90°C; D, DIBAL‐H, toluene, 0°C to r.t.; E, DMP, pyridine, CH2Cl2, 0°C to r.t.; F, Ph3PCHCOOEt, toluene, r.t.; G, NaOH aq., iPrOH, reflux; H, d‐Cys (Trt)‐OMe, DMT‐MM, DMF, r.t.; I, Tf2O, CH2Cl2, 0 °C; J, HCl aq., THF, r.t
3.2. Bioluminescence activity of analogues 3 and 5
BL activity and emission spectrum of 3 together with those of 1, 2, and 5 were investigated with wild‐type recombinant Ppy luciferase and a mutant luciferase, Akaluc (Table 1 and Figure 3).
TABLE 1.
Bioluminescence and chemiluminescence properties of 1–3 and 5
| Compound | Rel. Int. a (Ppy luc.) | λ BL b /nm (Ppy luc.) | λ BL c /nm (Akaluc) | λ CL d /nm |
|---|---|---|---|---|
| 1 | 100% | 570 | 610 | 595 |
| 2 | 10% | 675 | 660 | 685 |
| 3 | 1.3% | 705 | 665 | 685 |
| 5 | 0.8% | 690 | 660 | 620 |
Relative light intensity at λ BL upon reaction with Ppy luciferase for the L–L reactions of 3 during the initial 600 s compared with that of 1.
Bioluminescence emission maximum upon reaction with Ppy luciferase.
Bioluminescence emission maximum upon reaction with mutant luciferase Akaluc.
Chemiluminescence emission maximum.
FIGURE 3.
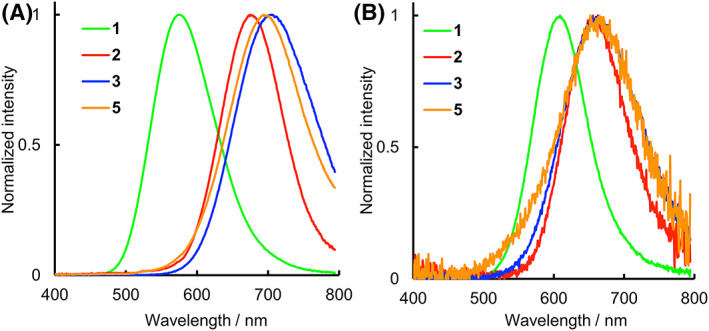
The bioluminescence spectra of 1–3 and 5 reacted with Ppy luciferase A, and Akaluc B, respectively
Before investigating BL properties, the d‐ and l‐forms of 3 were separated by HPLC with a chiral octadecylsilane column, and their fractions were screened for BL measurements. The d‐form of 3 showed sufficient luminescence with Ppy luciferase, whereas the l‐form of 3 showed negligible luminescence similar to the background (Table S1). Similar to wild‐type luciferin 1, NIR luciferin analogue produces light only in the d‐form and not in the l‐form. We used only d‐form of 3 for the following experiments. The light intensity (Rel. Int.) obtained through the L–L reaction with Ppy luciferase during the initial 600 s for 3 was 1.3% as a relative value compared with that for 1 (Table 1), and the Rel. Int. value was similar to that of 5 (0.8%). The light intensity of 3 with Akaluc was weaker than that with Ppy luciferase and could not be determined relative intensity. These results indicate that 3 and 5 have weak BL activities compared with 2. The λ BL value of 3 was recorded at 705 nm with Ppy luciferase (Table 1 and Figure 3), which red shifted from that of 5 (690 nm). The λ BL values of 3 and 5 are 135 and 120 nm longer than that of 1, respectively, and even 30 and 15 nm longer than that of 2, respectively. On the other hand, the emission spectra of 3 measured with Akaluc showed the λ BL value at 665 nm (Table 1 and Figure 3), which is red shifted by 15 nm compared with that of 2. Also, the λ BL value of 5 reacted with Akaluc was observed at 660 nm that is same as that of 2. To investigate the cause of the variation in λ BL values for 3 and 5, chemiluminescence reaction of the methyl esters of 1–3 and 5 were performed in DMSO containing t‐BuOK under air. The chemiluminescence emission maxima (λ CL) of 1–3 and 5 were observed at 595, 685, 685, and 620 nm, respectively (Table 1 and Figure S1). The λ CL value of 3 is same as that of 2, and the λ CL value of 5 is blue shifted by 65 nm compared with that of 2.
4. DFT AND TIME‐DEPENDENT DFT CALCULATIONS FOR OXY‐2, OXY‐3, AND OXY‐5
To further evaluate the observed λ BL and λ CL values for 3, the electronic properties of the oxyluciferin form of 3 (oxy‐3) together with that of the oxyluciferin form of 5 (oxy‐5) were investigated using DFT and time‐dependent DFT (TD‐DFT) calculations with the B3LYP/6–31 + G(d) method. Prior performing a search for the most stable optimized structures of oxy‐3 and oxy‐5, we found the most stable optimized structures of the luciferin forms 3 and 5. We then used the structures of 3 and 5 shown in Figure 4 as the basis for starting conformations of oxy‐3 and oxy‐5 for further calculations because the structures of 3 and oxy‐3 have steric hindrance between the allyl and dimethylamino groups, and their dimethylamino groups are twisted and pyramidal. Next, we analyzed the electronic transition properties of the oxyluciferin forms (Table 2). In the case of oxy‐5, the phenolate anion and its sodium salt model were calculated in the manner similar to the previous literature. 2
FIGURE 4.
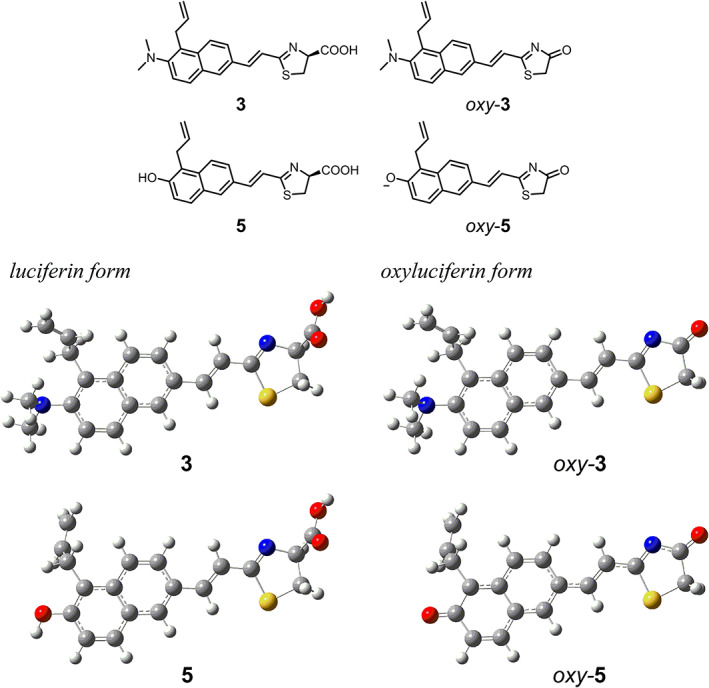
The most stable optimized structures of the luciferin forms 3 and 5 and optimized structures of the oxyluciferin forms oxy‐3 and oxy‐5(phenolate) having the conformations corresponding to the structures of 3 and 5
TABLE 2.
Time‐dependent density functional theory calculation data for oxy‐2, oxy‐3, and oxy‐5
| Compound | Transition a | E ex/eV b | λ ex/nm (f) c | Configuration d |
|---|---|---|---|---|
| oxy‐ 2 e | S0 → S1 | 2.82 | 439 (1.38) | H → L (0.70) |
| oxy‐ 3 | S0 → S1 | 2.85 | 435 (0.58) | H → L (0.70) |
| oxy‐5(phenolate) | S0 → S1 | 2.40 | 516 (1.23) | H → L (0.71) H ← L (−0.14) |
| oxy‐5(ONa) | S0 → S2 | 2.67 | 464 (0.87) | H → L + 1 (0.70) |
The allowed transition to the excited singlet state with the lowest excitation energy (S0 → S1 or S0 → S2).
Vertical excitation energy for the transition.
Wavelength (λ ex) estimated from the transition energy. Oscillator strength (f) is in the parenthesis.
Configuration of excitation. Coefficient is in the parenthesis. H, L, and L + 1 denote highest occupied molecular orbital (HOMO), lowest unoccupied molecular orbital (LUMO), and LUMO+1, respectively.
Kiyama et al. 16
Table 2 summarizes vertical excitation energies (E ex), excitation wavelengths (λ ex), oscillator strengths (f), and configurations of the allowed transitions to the excited singlet states with the lowest energies for oxy‐3, oxy‐5(phenolate), and oxy‐5(ONa) together with those for oxy‐2. 16 The S0 → S1 transitions of oxy‐3 and oxy‐5(phenolate) are π, π* transitions corresponding to the highest occupied molecular orbital (HOMO) → lowest unoccupied molecular orbital (LUMO) configuration and the S0 → S2 transition of oxy‐5(ONa) is a π, π* transition corresponding to the HOMO → LUMO + 1 configuration. Although the λ BL value of 3 with Ppy luciferase is red shifted from that of 2, the λ ex values of oxy‐2 and oxy‐3 are similar. Results indicate that λ BL values were mainly determined by the effect of the active site of Ppy luciferase to stabilize the excited states of oxy‐2 and oxy‐3. Because the HOMO–LUMO transition of oxy‐2 has charge‐transfer character, the S1 state is more highly polarized than the ground state. 20 The HOMO and LUMO of oxy‐3 have primary electronic distributions at the (6‐dimethylaminonaphtalenyl) and 2‐ethenyl‐1,3‐thiazolone moieties, respectively (Figure 4), indicating that the HOMO–LUMO transition of oxy‐3 also has charge‐transfer character. Thus, the S1 state of oxy‐3 also has polarized character. The environment surrounding the excited oxy‐3 in Ppy luciferase will be more polar than that surrounding the excited oxy‐2, resulting in the red‐shifted λ BL value of 3. The electronic distributions of the HOMO and LUMO of oxy‐3 indicate that the allyl group has no contribution to the π electronic conjugation. The calculations showing that the λ ex values of oxy‐5(phenolate) and oxy‐5(ONa) are red shifted from that of oxy‐3 are opposite to the λ BL data with Ppy luciferase and Akaluc. Although the oxido (O−) group of oxy‐5(phenolate) and oxy‐5(ONa) has the potential to donate more electron density than that of the dimethylamiono group of oxy‐3, the anionic property of the oxido group in the luciferase active site may be weakened.
5. CONCLUSION
We synthesized luciferin analogue 3 and investigated their luminescence properties. The λ BL values for 3 upon reaction with Ppy luciferase and mutant luciferase Akaluc were 705 and 665 nm, respectively. Furthermore, the results of BL and TD‐DFT calculations suggest that the allyl group of 3 induced the excited oxy‐3 to be more stable in the active site of luciferase, thus increasing the λ BL value of 3 to over 700 nm. A λ BL value of over 700 nm is quite noteworthy; however, the intensity of 3 was very weak compared with those of 1 and 2. We should modify the new analogue design to produce a higher bioluminescence intensity for animal experiments.
Supporting information
Data S1 Supporting information
ACKNOWLEDGMENTS
The authors wish to thank Kurogane Kasei Co., Ltd. for providing AkaLumine and TokeOni (AkaLumine‐HCl). This work was supported in part by Grants‐in‐Aid for Scientific Research on Innovative Areas “Resonance Bio” (JP15H05948) to S. A. M. and for Scientific Research on Innovation Areas “Soft Crystals” (JP17H06371) and Scientific Research (C) (JP18K05075) to T. H. from Japan Society for the Promotion of Science, and Adaptable & Seamless Technology Transfer Program through Target‐driven R&D (A‐STEP) (AS2614119N) to S. A. M. from the Japan Science and Technology Agency.
Kitada N, Saito R, Obata R, et al. Development of near‐infrared firefly luciferin analogue reacted with wild‐type and mutant luciferases. Chirality. 2020;32:922–931. 10.1002/chir.23236
Nobuo Kitada and Ryohei Saito contributed equally to this work.
[This article is part of the Special Issue: In honor and memory of Prof. Koji Nakanishi. See the first articles for this special issue previously published in Volumes 31:12, 32:3, 32:4, 32:5, and 32:6. More special articles will be found in this issue as well as in those to come.]
REFERENCES
- 1. Airth RL, Rhodes WC, McElroy WD. The function of coenzyme A in luminescence. BBA ‐ Biochim. Biophys. Acta. 1958;27(C):519‐532. [DOI] [PubMed] [Google Scholar]
- 2. Hirano T, Hasumi Y, Ohtsuka K, et al. Spectroscopic studies of the light‐color modulation mechanism of firefly (beetle) bioluminescence. J. Am. Chem. Soc. 2009;131(6):2385‐2396. [DOI] [PubMed] [Google Scholar]
- 3. White EH, McCapra F, Field GF. The structure and synthesis of firefly luciferin. J. Am. Chem. Soc. 1963;85(3):337‐343. [Google Scholar]
- 4. Nakamura M, Maki S, Amano Y, et al. Firefly luciferase exhibits bimodal action depending on the luciferin chirality. Biochem. Biophys. Res. Commun. 2005;331(2):471‐475. [DOI] [PubMed] [Google Scholar]
- 5. Nakamura M, Niwa K, Maki S, Hirano T, Ohmiya Y, Niwa H. Construction of a new firefly bioluminescence system using L‐luciferin as substrate. Tetrahedron Lett. 2006;47(7):1197‐1200. [Google Scholar]
- 6. Adams ST, Miller SC. Beyond D‐luciferin: expanding the scope of bioluminescence imaging in vivo. Curr. Opin. Chem. Biol. 2014;21:112‐120. [DOI] [PMC free article] [PubMed] [Google Scholar]
- 7. Miller SC, Mofford DM, Adams ST. Lessons learned from luminous luciferins and latent luciferases. ACS Chem. Biol. 2018;13(7):1734‐1740. [DOI] [PMC free article] [PubMed] [Google Scholar]
- 8. Hall MP, Woodroofe CC, Wood MG, et al. Click beetle luciferase mutant and near infrared naphthyl‐luciferins for improved bioluminescence imaging. Nat. Commun. 2018;9:132. [DOI] [PMC free article] [PubMed] [Google Scholar]
- 9. Weissleder R. A clearer vision for in vivo imaging progress continues in the development of smaller, more penetrable probes for biological imaging. Toward the phosphoproteome. Nat. Biotechnol. 2001;19(4):316‐317. [DOI] [PubMed] [Google Scholar]
- 10. Weissleder R, Ntziachristos V. Shedding light onto live molecular targets. Nat. Med. 2003;9(1):123‐128. [DOI] [PubMed] [Google Scholar]
- 11. Reddy GR, Thompson WC, Miller SC. Robust light emission from cyclic alkylaminoluciferin substrates for firefly luciferase. J. Am. Chem. Soc. 2010;132(39):13586‐13587. [DOI] [PMC free article] [PubMed] [Google Scholar]
- 12. Anderson JC, Grounds H, Jathoul AP, Murray JAH, Pacman SJ, Tisi L. Convergent synthesis and optical properties of near‐infrared emitting bioluminescent infra‐luciferins. RSC Adv. 2017;7(7):3975‐3982. [DOI] [PMC free article] [PubMed] [Google Scholar]
- 13. Branchini BR, Southworth TL, Fontaine DM, Kohrt D, Florentine CM, Grossel MJ. A firefly luciferase dual color bioluminescence reporter assay using two substrates to simultaneously monitor two gene expression events. Sci. Rep. 2018;8(1):1‐7. [DOI] [PMC free article] [PubMed] [Google Scholar]
- 14. Iwano S, Obata R, Miura C, et al. Development of simple firefly luciferin analogs emitting blue, green, red, and near‐infrared biological window light. Tetrahedron. 2013;69(19):3847‐3856. [Google Scholar]
- 15. Miura C, Kiyama M, Iwano S, et al. Synthesis and luminescence properties of biphenyl‐type firefly luciferin analogs with a new, near‐infrared light‐emitting bioluminophore. Tetrahedron. 2013;69(46):9726‐9734. [Google Scholar]
- 16. Kiyama M, Iwano S, Otsuka S, et al. Quantum yield improvement of red‐light‐emitting firefly luciferin analogues for in vivo bioluminescence imaging. Tetrahedron. 2017;74(6):652‐660. [Google Scholar]
- 17. Kitada N, Saitoh T, Ikeda Y, et al. Toward bioluminescence in the near‐infrared region: tuning the emission wavelength of firefly luciferin analogues by allyl substitution. Tetrahedron Lett. 2018;59(12):1087‐1090. [Google Scholar]
- 18. Kuchimaru T, Iwano S, Kiyama M, et al. A luciferin analogue generating near‐infrared bioluminescence achieves highly sensitive deep‐tissue imaging. Nat. Commun. 2016;7:11856. [DOI] [PMC free article] [PubMed] [Google Scholar]
- 19. Fukuchi M, Izumi H, Mori H, et al. Visualizing changes in brain‐derived neurotrophic factor (BDNF) expression using bioluminescence imaging in living mice. Sci. Rep. 2017;7(1):1‐5. [DOI] [PMC free article] [PubMed] [Google Scholar]
- 20. Saito R, Kuchimaru T, Higashi S, et al. Synthesis and luminescence properties of near‐infrared N‐heterocyclic luciferin analogues for in vivo optical imaging. Bull. Chem. Soc. Jpn. 2019;92:608‐618. [Google Scholar]
- 21. Iwano S, Sugiyama M, Hama H, et al. Single‐cell bioluminescence imaging of deep tissue in freely moving animals. Science (80). 2018;359(6378):935‐939. [DOI] [PubMed] [Google Scholar]
- 22. Frisch, M. J. ; Trucks, G. W. ; Schlegel, H. B. ; Scuseria, G. E. ; Robb, M. A. ; Cheeseman, J. R. ; Scalmani, G. ; Barone, V. ; Mennucci, B. ; Petersson, G. A. ; et al. Gaussian 09, Revision D.01. Gaussian, Inc.: Wallingford, CT 2004, p Gaussian 09, Revision D.01.
- 23. Becke AD. Density‐functional thermochemistry. III. The role of exact exchange. J. Chem. Phys. 1993;98(7):5648‐5652. [Google Scholar]
- 24. Lee C, Yang W, Parr RG. Development of the Colle‐Salvetti correlation‐energy formula into a functional of the electron density. Phys. Rev. B. 1988;37(2):785‐789. [DOI] [PubMed] [Google Scholar]
- 25. Stephens PJ, Devlin FJ, Chabalowski CF, Frisch MJ. Ab initio calculation of vibrational absorption and circular dichroism spectra using density functional force fields. J. Phys. Chem. 1994;98(45):11623‐11627. [Google Scholar]
- 26. Dennington, R. ; Keith, T. ; Millam, J. GaussView, Version 5. Semichem Inc., Shawnee Mission, KS . 2009, p Semichem Inc.
Associated Data
This section collects any data citations, data availability statements, or supplementary materials included in this article.
Supplementary Materials
Data S1 Supporting information