

Abstract
Cellular signaling is regulated by the assembly of proteins into higher‐order complexes. Bottom‐up creation of synthetic protein assemblies, especially asymmetric complexes, is highly challenging. Presented here is the design and implementation of asymmetric assembly of a ternary protein complex facilitated by Rosetta modeling and thermodynamic analysis. The wild‐type symmetric CT32–CT32 interface of the 14‐3‐3–CT32 complex was targeted, ultimately favoring asymmetric assembly on the 14‐3‐3 scaffold. Biochemical studies, supported by mass‐balance models, allowed characterization of the parameters driving asymmetric assembly. Importantly, our work reveals that both the individual binding affinities and cooperativity between the assembling components are crucial when designing higher‐order protein complexes. Enzyme complementation on the 14‐3‐3 scaffold highlighted that interface engineering of a symmetric ternary complex generates asymmetric protein complexes with new functions.
Keywords: cooperativity, noncovalent interactions, proteins, protein–protein interactions, self-assembly
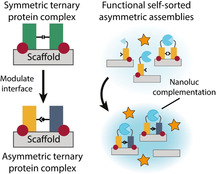
Made to order: A designed asymmetric assembly creates novel synthetic higher‐order protein assemblies. A symmetric ternary protein complex is formed through stabilizer (red) mediated peptide (green) binding to a scaffold (grey). Modulation of the interface between the peptides (yellow, blue) leads to asymmetric protein self‐sorting. This elucidation of higher‐order protein structures provides insights into protein assembly and the connected role of scaffold proteins.
Introduction
Signal‐protein assembly into higher‐order complexes facilitates the coexistence of signaling cascades in cells.1 High efficiency and selectivity for specific pathways is achieved, amongst other mechanisms, through spatial organization by scaffold proteins.2, 3 Assembly of proteins through orthogonal protein–protein interactions establishes the central basis for high fidelity signaling within the complexity of a cell.4 Orthogonality of interacting species is encoded into their chemical structure, for example, recognition motifs in kinase substrates5 and phosphorylation‐induced SH2–ligand interaction.6 To elucidate key parameters of complex formation, in vitro assembly of native signaling complexes comprising scaffold proteins has been investigated.7, 8, 9, 10 Additionally, engineering of native scaffold proteins has led to insight into the plasticity of cellular signaling pathways and allowed introduction of either new pathways or functionalities to the cell.11, 12 In contrast, the bottom‐up design of synthetic higher‐order assemblies is much less addressed with challenges relating to achieving fundamental insights into the underlying assembly parameters.
Strategies to design synthetic protein complexes have predominantly been focused on components possessing inherent self‐assembling properties, such as coiled‐coils forming higher‐order nanostructures,13, 14, 15 design of self‐assembling repeat proteins,16, 17 or forced complex formation through encapsulation inside self‐assembling compartments.18, 19 Since the de novo design of protein–protein interactions remains challenging, the focus in designing synthetic higher‐order signaling complexes has been on native and well‐characterized scaffold proteins. Efforts in the engineering of synthetic scaffold proteins have led to insight into the basis of scaffolding20, 21 and the rewiring of cellular processes,22, 23, 24 highlighting the strength of synthetic biology approaches. Starting from a natural homodimeric scaffold protein, we generate a synthetic ternary protein complex through introduction of orthogonality between interacting components in a rational fashion, ultimately favoring asymmetric protein self‐sorting (Figure 1 a).
Figure 1.

Designed asymmetric protein self‐sorting on a homodimeric protein scaffold. a) The native complex comprises two CT32 constructs (green) that bind symmetrically on the dimeric 14‐3‐3 scaffold (grey) upon stabilization by the small molecule fusicoccin (FC; red). Through careful redesign of the CT32–CT32 (yellow and blue) interface, orthogonal asymmetric binding on this scaffold can be achieved. b) Crystal structure (PDB 2O98) of the native complex consisting of CT32 (green), FC (red), and 14‐3‐3 (grey). Zoom shows residues subjected to mutation. c) Overview of workflow. Mutations of selected residues within the CT32–CT32 interface are modeled using Rosetta. CT32 pairs that are predicted to assemble asymmetrically are synthesized and characterized using fluorescence polarization assays supplemented with mass‐balance models. The opportunities for the designed asymmetric ternary complexes are shown in context of in vitro enzyme complementation.
As scaffold we use the dimeric 14‐3‐3 protein. This native eukaryotic protein serves as an ideal scaffold as this versatile hub protein is well characterized25, 26 and plays a pivotal role in many cellular processes.27, 28 Of special interest is the interaction of Tobacco 14‐3‐3cΔC (T14‐3‐3) with the C‐terminal part (CT32) of the plant plasma membrane H+‐ATPase (PMA2).29 This interaction is strongly enhanced by the presence of the small molecule fusicoccin (FC), enabling a switchlike binding response (Figure 1 b).29, 30 By fusing enzymes with a CT32 peptide construct, we have previously shown cooperative symmetric enzyme assembly, that is, binding of two identical constructs, on 14‐3‐3 scaffold proteins induced by addition of FC.31 One of the functions of 14‐3‐3 is the scaffolding of two different binding partners, in which 14‐3‐3 acts as an adaptor molecule bridging the interaction between both proteins.32 The selective recruitment of two different proteins to generate ternary complexes on the homodimeric 14‐3‐3 scaffold is thus an important strategy to regulate signaling. Design and understanding of synthetic asymmetric self‐sorting, that is, binding of two non‐identical constructs on homodimeric 14‐3‐3 would offer widespread application in bottom‐up synthetic biology.
Here, we present the design, implementation, and detailed characterization of the synthetic asymmetric assembly into ternary protein complexes formed through interaction of carefully designed orthogonal asymmetric CT32 pairs on the homodimeric scaffold protein 14‐3‐3. Using the Rosetta protein design suite,33 which has been used for the design and redesign of protein–protein interfaces,34, 35 we perform in silico mutation of selected residues at the CT32–CT32 interface and score each variant by their ability to form asymmetric pairs over symmetric pairs. From these structures, we choose combinations that are predicted to destabilize symmetric, and stabilize asymmetric complexes. To verify the orthogonality of these ternary complexes, extensive experimental characterization assisted by binding‐site mutants and subsequent analysis of the experimental binding data by tailored mass‐balance models are used. The opportunities for the designed self‐sorting complexes are shown in context of in vitro enzyme complementation. By fusion of the NanoBiT sytem36 to the CT32 peptide constructs, we show efficient asymmetric reconstitution of the full enzyme, indicating increased orthogonality (Figure 1 c).
Results and Discussion
CT32 Residue Selection
Our asymmetric ternary protein complex is based on the 14‐3‐3—CT52 crystal structure (PDB 2O98). This structure reveals a central interaction site between the two CT52 elements (Figure 1 b), as well as a coiled‐coil domain near their N‐terminal region.29 To eliminate hydrophobic interactions induced by these coiled‐coil domains, we removed the twenty N‐terminal amino acids after which 32 C‐terminal residues (CT32) remain (see Supporting Discussion 2.2 in the Supporting Information). It was reasoned that asymmetric assembly can be favored over symmetric assembly by introducing mutations in the central site between the two CT32 constructs (Figure 1 b). An elaborate discussion on the choice of CT32 residues considered for the design of asymmetric complex assembly can be found in the Supporting Information (see Supporting Discussion 2.1). Summarizing, CT32 glutamate 928 and serine 938 were considered as mutation targets based on their central position in the CT32–CT32 interface.
Rosetta Modeling
We used Rosetta modeling to predict mutations at E928 and S938 in CT32 that enhance stability of the asymmetric ternary protein complex over the respective symmetric complex. The mutations are indicated by E928X‐1 and S938X‐1 for one construct and E928X‐2 and S938X‐2 for the other (Figure 2 a). The detailed workflow is indicated in Figure 2 b. Preparation of the initial structure is described in the methods section. To obtain structures for all combinations of E928X‐1, E928X‐2, S938X‐1, and S938X‐2 mutants, two rounds of double mutant‐scanning were performed, mutating E928 and S938 to all possible residues. Proline and cysteine were excluded to prevent disruption of the α‐helices and formation of disulfide bridges, resulting in a total of 52 488 unique models.
Figure 2.

Rosetta modeling. a) Schematic representation of the mutation sites in both CT32 constructs. b) Flowchart showing the Rosetta protocol used to predict orthogonal CT32 pairs. c–e) 2D histograms showing the frequency of combinations of mutations leading to orthogonal CT32 pairs on the c) E928X‐1 and E928X‐2 positions, d) S938X‐1 and S938X‐2 positions, and e) E928X‐2 and S938X‐1 positions. f–h) Visual representation of models from Rosetta with E928E (WT)+S938A and E928A+S938R constructs showing f) CT32‐asymmetric complex, g) CT32‐symmetric complex with both E928E‐1 mutant constructs, and h) CT32‐symmetric complex with both S938R‐2 mutant constructs.
To determine the effect of specific mutations on the preference for asymmetric assembly, a measure that quantifies the interaction between the constructs is required. Rosetta's interface analyzer37 was used to compute the interface energy (ΔG) of a 14‐3‐3–CT32 construct complex and every other mutant construct. We quantified the orthogonality of each complex by calculating the difference between the interface energies of the symmetric assembly that shows the strongest binding and the asymmetric assembly, which we term ω. The results show an increase in ω for models containing opposite charges at the S938 positions, which can be explained by salt bridges favoring the formation of the asymmetric complex, while the identical charges disfavor formation of symmetric complexes (see Supporting Discussion 2.3). Given the large number of models, we examined trends in mutations that occur frequently in pairs of mutant constructs with high ω values. To find structures that are both stable and orthogonal, we selected all models with an orthogonality value ω>3 Rosetta Energy Units (R.E.U.), and with an interface energy ΔG that is lower than that of the wild type. The frequency of mutations on both E928X positions, both S938 positions, or one E928X and one S938X position, resulting in increased orthogonality, is displayed in 2D histograms (Figures 2 c–e). The results show that in most of these models glutamate or arginine is present in either construct. In particular, the combination with arginine on the E928X position and glutamate on the S938X position, or vice versa, is predicted to form an orthogonal pair. Since E928E‐1, the wild‐type residue at this position, and S938R‐2 mutant pair shows the most promising result, we visually inspected the models of this asymmetric pair where E928X‐2 and S938X‐1 are mutated to alanine (Figure 2 f). We observe a favorable interaction between the positively charged arginine and the negatively charged glutamate caused by the size of the residues and their relative positions in the central region. The respective symmetric complexes (Figures 2 g,h) contain identically charged residues in the central pocket, destabilizing the interaction between the CT32 constructs. Collectively, these results show that using a Rosetta protocol we can make predictions for mutations in CT32 that favor asymmetric over symmetric assembly on a 14‐3‐3 scaffold. Combinations of arginine and glutamate on both the E928 and S938 position seem most promising.
Monomeric Binding of Designed CT32 Constructs
To verify the outcome of the Rosetta modeling on the predicted orthogonal asymmetric complex formation, we synthesized CT32 constructs with either an arginine or a glutamate on both the E928 and S938 position. The other E928 or S938 site was mutated to an alanine to analyze the contribution of each residue in isolation. CT32 constructs are indicated by their respective residues at the E928 and S938 positions. In other words, the construct E928R+S938A is abbreviated CT32‐RA. Following the above, four CT32 constructs were synthesized: CT32‐EA, CT32‐AE, CT32‐RA, and CT32‐AR. The affinity of the interaction between a single CT32 construct and the 14‐3‐3 scaffold in the presence of FC is important for determining the thermodynamic parameters of protein assembly on the scaffold. Since two CT32 constructs bind simultaneously to the dimeric 14‐3‐3 scaffold, the experimentally determined binding affinity represents a combined effect of the monomeric binding affinity and a cooperativity parameter.31 To eliminate this cooperative binding effect, we covalently linked two 14‐3‐3 monomers to form the 14‐3‐3 scaffold through intramolecular dimer formation. This strategy allows specific mutations to be introduced in only one 14‐3‐3 monomer. Two 14‐3‐3 monomers were covalently tethered using a flexible (Gly‐Gly‐Ser)10 linker, hereafter named 14‐3‐3_X1_X2, where X1 and X2 each represent a 14‐3‐3 monomer. The crystal structure (PDB 2O98) shows an essential interaction between arginine 136 (R136) in 14‐3‐3 and aspartate 955 of CT32. The introduction of a R136A mutation in one of the two 14‐3‐3 binding pockets disables this binding pocket (see Figure S8).30 Titration of all designed CT32 constructs with the single inactive site 14‐3‐3 dimer allows determination of the monomeric binding affinity of all constructs to the 14‐3‐3 protein. Fluorescence polarization assays were performed using FITC‐labeled CT32 constructs by titrating the 14‐3‐3_R136A_WT scaffold in the presence of 0, 10, and 100 μm FC (see Figures S9 and S11).
To quantify the specific binding affinities of the different CT32 constructs to the 14‐3‐3 scaffold as obtained from the experimental fluorescence polarization assay, we first derived a mass‐balance model describing the concentrations of all species at chemical equilibrium.21, 38 This model describes complexation of the 14‐3‐3_R136A_WT scaffold with FC and the CT32 construct into different molecular complexes with equilibrium reactions as shown in Figure 3 a. We compute the theoretical fluorescence polarization signal from the concentrations of bound and unbound labeled construct as described in SI3.1. In the model we assume that FC is required to bind to the 14‐3‐3 scaffold before CT32 is able to bind (Figure 3 a). This assumption was experimentally verified (see Figures S9 and S10). A complete description of the model, derivation of the mass‐balance equations, and computation of the polarization signal is reported in SI3.2.1. By nonlinear least‐squares optimization of the model to the fluorescence polarization data, we estimated the dissociation constants of CT32 binding to 14‐3‐3_R136A_WT (Figure 3 b).
Figure 3.

Mass‐balance analysis and the resulting fit of the fluorescence polarization data for binding of exemplary CT32 constructs to 14‐3‐3_R136A_WT. a) Schematic representation of the mass‐balance model. In grey is shown the 14‐3‐3 scaffold, red circles represent FC and rectangles C with yellow star represent FITC‐labeled CT32 construct. Red crosses indicate R136A mutation site, green lines indicate parameters estimated by fitting. K d,FC and K d describe dissociation constants of FC binding to 14‐3‐3_R136A_WT and CT32 binding to the 14‐3‐3_R136A_WT–FC complex, respectively. B) Fit of the mass‐balance model (lines) to the fluorescence polarization data (circles) of the 14‐3‐3_R136A_WT scaffold titrated to FC and fluorescently labeled CT32‐AE and CT32‐RA mutant constructs (5 nm in case of 10 μm FC, 15 nm in case of 100 μm FC) as examples (full data see Figure S11+S12 and Table 1). Error bars represent SD (n=3).
Since the dissociation constant of FC has been determined to be in the high‐micromolar range (approximately 300 μm),39 we used this estimated value for K d,FC as a fixed parameter in our analysis. The resulting fits for all assays are shown in Figure S12. The results show that the dissociation constants of CT32 constructs containing arginine (CT32‐RA and CT32‐AR) for 14‐3‐3_R136A_WT are approximately fourfold lower with respect to those containing glutamate (CT32‐EA and CT32‐AE) and the wild‐type CT32 (Table 1 a).
Table 1.
Key parameters relevant for formation of the complexes between the 14‐3‐3 scaffold and CT32 constructs, as found by nonlinear least squares optimization. a) Dissociation constants of single CT32 construct binding to 14‐3‐3_WT_R136A. b,c) Cooperativity constants of the symmetric (b) and asymmetric (c) intermolecular CT32–CT32 interactions on the 14‐3‐3_WT_WT scaffold.
|
|

Symmetric and Asymmetric Cooperativity
To characterize the formation of the ternary protein complex, we determined the binding cooperativity of the assembling CT32 constructs.21, 31 The symmetric assembly of two identical CT32 constructs on the 14‐3‐3 protein scaffold was measured by performing fluorescence polarization assays for all FITC‐labeled constructs by titrating the 14‐3‐3_WT_WT scaffold in the presence of 0, 10, and 100 μm FC (see Figures S9 and S13). Similar to our observations on the 14‐3‐3_R136A_WT scaffold, the CT32‐EA and CT32‐AE constructs show overall similar binding affinity to 14‐3‐3_WT_WT with respect to wild‐type CT32, while the CT32‐RA and CT32‐AR constructs show an overall increased binding affinity.
The assembly process of two distinct constructs on a 14‐3‐3_WT_WT scaffold was measured using fluorescence polarization assays in which one of the CT32 constructs was utilized each time as a stabilizer for its designed complementary CT32 construct. By performing assays with fluorescently (FITC‐) labeled CT32 constructs in the presence of increasing concentrations of the unlabeled, acetylated (Ac‐) counterpart CT32, either the stabilizing or destabilizing effect of the unlabeled CT32 construct on the labeled CT32 construct can be observed. This concept is widely applied in the screening for small‐molecule stabilizers of 14‐3‐3 protein–protein interactions.39 Fluorescence polarization assays were performed for all FITC‐labeled constructs by titrating the 14‐3‐3_WT_WT scaffold in the presence of 10 μm FC and increasing concentrations (15, 30, 75, 150, 300 nm, that is, 1×, 2×, 5×, 10×, 20× molar excess) of unlabeled construct (see Figure S15). Interestingly, all four combinations of FITC‐EA or FITC‐AE together with Ac‐RA or Ac‐AR resulted in increased binding affinity, hence stabilization, of the FITC‐EA or FITC‐AE. The counter combinations of FITC‐RA or FITC‐AR with Ac‐EA or Ac‐AE showed little to no increased 14‐3‐3 binding affinity of the FITC‐RA or FITC‐AR upon addition of the acetylated counterpart.
To obtain quantitative insight into the composition of the scaffold system with two CT32 constructs, we derived a mass‐balance model for the assembly of the CT32 constructs on the bivalent 14‐3‐3_WT_WT scaffold (see SI3.2.3). A schematic representation of the general two‐site binding model that describes formation of both symmetric and asymmetric bivalent CT32 binding is shown in Figure 4 a. To fit the symmetric (σCC and σDD) and asymmetric (σCD) cooperativity constants, nonlinear least squares optimization was performed, for which the experimentally determined dissociation constants K d,FC, K d,C, and K d,D (vide infra) were used as fixed parameters.
Figure 4.
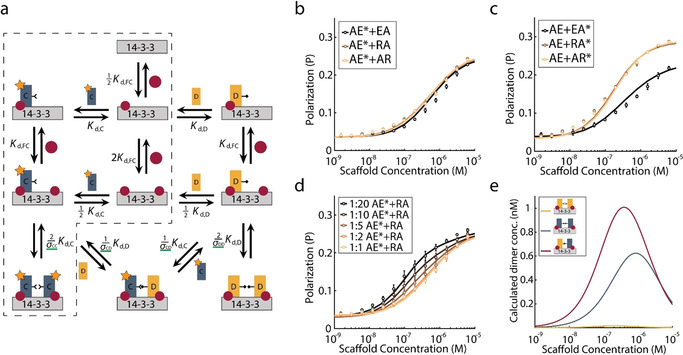
Mass‐balance analysis and fit of the fluorescence polarization data for binding of CT32 mutant constructs to 14‐3‐3_WT_WT. a) Schematic representation of the mass‐balance model. In grey is shown the 14‐3‐3 scaffold, red circles represent fusicoccin, and rectangles C and D represent different CT32 construct mutants. Green lines indicate parameters estimated by fitting. K d,FC, K d,C and K d,D describe dissociation constants of FC binding to 14‐3‐3_WT_WT and either distinct CT32 construct binding to 14‐3‐3_WT_WT with FC bound, respectively. Cooperativity constants σCC and σDD decrease the dissociation constant of the second identical CT32 construct that binds to 14‐3‐3_WT_WT. Cooperativity constant σCD decreases the dissociation constant of the second non‐identical CT32 construct that binds to 14‐3‐3_WT_WT. b–d) Fit of the mass‐balance model (lines) to the fluorescence polarization data (circles) of the asymmetric complex formation of b) fluorescently labeled CT32‐AE* (15 nm) with unlabeled CT32‐EA, CT32‐RA and CT32‐AR constructs (15 nm), c) unlabeled CT32‐AE (15 nm) with fluorescently labeled CT32‐EA*, CT32‐RA* or CT32‐AR* constructs (15 nm), and d) fluorescently labeled CT32‐AE* (15 nm) with varying concentrations of unlabeled CT32‐RA (15 nm, 30 nm, 75 nm, 150 nm and 300 nm) for varying 14‐3‐3_WT_WT scaffold concentrations. Error bars represent SD (n=3). e) Speciation plot of the concentrations of the CT32‐RA symmetric complex (yellow), CT32‐AE symmetric complex (grey) and CT32‐RA—CT32‐AE asymmetric complexes (red) computed using the mass‐balance model as a function of 14‐3‐3_WT_WT scaffold concentration, 15 nm of each CT32 construct and 10 μm FC.
All obtained values of σCC reveal a decrease in CT32–CT32 cooperativity with respect to the wild‐type ternary complex for most symmetric complexes with mutated 928 and 938 amino‐acid positions, except for the EA construct (Table 1 b). Most notably, the CT32 constructs with arginine mutations feature the lowest cooperativity for symmetric complex formation, thus contrasting with their higher intrinsic affinity (K d) for the 14‐3‐3 platform. Furthermore, S938X mutations have a larger effect on the cooperativity than E928X mutations (Table 1 b; see Figure S14). The reduced cooperativity constants of symmetric binding of CT32 constructs with arginine or glutamate mutations at the S938X position with respect to the E928X position can be explained by the fact that these mutations are more closely positioned with respect to each other, leading to stronger repulsive charges between the amino‐acid side chains of equal charge.
The asymmetric complexes were similarly analyzed with exemplary titrations and model analysis as shown in Figure 4 b–d and fits to all data from assays with two distinct constructs are reported in Figures S16–S21. The cooperativity constants, σCD, of the asymmetric complexes (Table 1 c) are between the extremes of the symmetric cooperativity constants σCC. Asymmetric complexes containing a glutamate at the 938 position, that is, pairs of CT32‐AE with either CT32‐AR or CT32‐RA, feature the highest asymmetric σCD values relative to the respective symmetric σCC values. These σCD values are higher than the σCC values of the corresponding symmetric complexes containing arginine, suggesting preferential formation of asymmetric complexes over the CT32‐AR or CT32‐RA symmetric assemblies. In contrast, the CT32 construct with a glutamic acid at the 928 position (CT32‐EA) preferably forms symmetric assemblies, mainly resulting from its high σCC value. From the mass‐balance model we computed the speciation plots which provide valuable insight into the composition of the system at equilibrium. In Figure 4 e, the concentrations of the resulting symmetric CT32‐RA and CT32‐AE complexes and the asymmetric CT32‐RA—CT32‐AE complex are shown as a function of the 14‐3‐3_WT_WT scaffold concentration. This speciation plot clearly reveals the preferential formation of the asymmetric assembly with respect to the symmetric assemblies (and the sum of both). If the binding affinities and cooperativity constants would be identical, the total concentration of both symmetric pairs would also be identical to that of the asymmetric pair. In this case, the different binding affinities and non‐identical cooperativity constants result in a shift towards higher concentrations of asymmetric over symmetric protein complex. A brief discussion on the sensitivity of the effect of model parameters on the quality of the fits can be found in SI5.2.
Together, these data show that CT32 binding partners containing arginine have a higher 14‐3‐3 binding affinity. However, the cooperativity that determines the overall ternary complex stability is significantly decreased with respect to the wild‐type CT32 construct, as corroborated by predictions made using Rosetta (see Figure S3). Combinations of constructs with opposite arginine and glutamate, especially those with crosswise E928X and S938X mutations, show an increased cooperativity with respect to symmetric constructs containing arginine. This results in significant orthogonality in ternary protein complex formation.
Enzyme Complementation
To highlight the potential of the designed asymmetric protein assembly, we show enzyme complementation through luciferase reconstitution (Figure 5 a). The CT32 constructs were fused to the C‐terminus of a large NanoBiT (LgNB‐CT32) and a small NanoBiT (SmNB‐CT32) fragment with low affinity for complementation (K d,FC=190 μm 36). CT32‐symmetric and CT32‐asymmetric split‐luciferase components were purified and their complementation on the 14‐3‐3 scaffold analyzed in vitro. Split‐luciferase complementation was carried out at 15 nm of either split component in the presence of 100 μm FC and 100 nm 14‐3‐3 scaffold, a scaffold concentration optimal for asymmetric complex formation (Figure 4 e). The bioluminescent signal generated by LgNB‐CT32‐EA (Figure 5 b, left/blue) is increased upon asymmetric complexation (+SmNB‐CT32‐AR) compared to symmetric complexation (+SmNB‐CT32‐EA). Omittance of either the SmNB‐CT32 or the 14‐3‐3 scaffold results in background luminescence (<1000 counts s−1), indicating that all protein components are crucial for the functional signaling complex assembly. The results for the LgNB‐CT32‐AR construct (Figure 5 b, right/yellow) show again an increase in bioluminescence for asymmetric over symmetric complexation. This increase is even enlarged compared to LgNB‐CT32‐EA. Taken together, the NanoBiT system shows an approximately twofold higher bioluminescence emission in the case of asymmetric CT32 constructs compared to symmetric CT32 constructs (Figure 5 b).
Figure 5.

Split‐luciferase complementation assay. a) Schematic representation of the NanoLuc reconstitution on the 14‐3‐3 scaffold by fusion of large and small NanoBiT to CT32 constructs. Shown in grey is the 14‐3‐3 scaffold, red circles represent FC, rectangles in blue or yellow indicate CT32 construct glutamate or arginine mutants, respectively. Bioluminescent read‐out at 458 nm for NB‐CT32 fusion constructs designed for b) enzyme regulation or c) enhanced enzyme regulation. LgNB‐CT32‐EA (b, left), LgNB‐CT32‐AR (b, right), LgNB‐CT32‐EE (c, left), or LgNB‐CT32‐RR (c, right) is complemented with or without SmNB‐CT32 (15 nm) in the presence of FC (100 μm) and with or without 14‐3‐3 (100 nm). The dotted line indicates bioluminescence resulting from 2 nm complemented luciferase; LgNB‐CT32 (2 nm) complemented with SmNB0.7 nm (100 nm) in the presence of FC (100 μm) and 14‐3‐3 (100 nm). Error bars represent SD (n=3). Full spectra can be found in Figure S24.
Enhanced Enzyme Complementation
The split‐luciferase complementation assay was used to analyze whether asymmetric protein complex assembly can be further enhanced. An additional Rosetta analysis of the X‐position of CT32‐EX and CT32‐XR constructs was performed. Of the 40 analyzed CT32‐pairs classified as orthogonal pairs and containing CT32‐EX and CT32‐XR mutations, 29 pairs showed either an aspartate or a glutamate at the X (938) position of the CT32‐EX construct. We therefore hypothesized that the CT32‐EE would result in enhanced asymmetric assembly. The variation in residues found at the 928 position for the complementary CT32‐XR showed no clear enrichment of a specific residue class, although both doubly charged peptides (EE+KR and EE+RR) show a high predicted orthogonality. Asymmetric assembly of LgNB‐CT32‐EE (Figure 5 c, left/blue) in the presence of SmNB‐CT32‐RR shows an approximately 12‐fold higher bioluminescence intensity as compared to symmetric assembly with SmNB‐CT32‐EE. Conversely, asymmetric assembly of LgNB‐CT32‐RR (Figure 5 c, right/yellow) in the presence of SmNB‐CT32‐EE shows an approximately twofold higher bioluminescence as compared to symmetric assembly with SmNB‐CT32‐RR, indicating a slight reduction of orthogonality compared to the twofold increase observed for the CT32‐AR split NanoLuc system (Figure 5 b, right/yellow). The bioluminescence intensity for LgNB‐CT32‐RR complemented with SmNB‐CT32‐EE is lower than the bioluminescence generated by the reference (2 nm complexed LgNB), implying a reduction in asymmetric complex formation. Mutation of charged residues in the CT32 construct affects the isoelectric point of this part of the protein, which might result in different interactions within the protein itself or with partner proteins, thereby influencing the bioluminescence. The enhanced enzyme regulation for LgNB‐CT32‐EE (ca. 12‐fold, Figure 5 c, left) over LgNB‐CT32‐EA (ca. 2‐fold, Figure 5 b, left) can mainly be attributed to a decrease in symmetric complex formation, as the relative bioluminescence of LgNB‐CT32‐EE in the presence of SmNB‐CT32‐EE is much lower compared to other symmetric complexes. The introduction of a second mutation in the CT32–CT32 interface thus leads to increased orthogonality, illustrating how cooperativity between interacting species can be modulated.
Conclusion
Signaling pathways within the complex and crowded environment of the cell are facilitated by orthogonal self‐assembly of proteins into functional complexes, thereby generating specificity and selectivity. Bottom‐up design of such assemblies remains challenging. Here we show how scaffolds can be used to elucidate key parameters of asymmetric ternary protein complexation. Starting from the natural symmetric 14‐3‐3–CT32 ternary protein complex, we rationally modulated the interface between the two CT32 constructs on this scaffold, which favored formation of an asymmetric ternary complex. Mass‐balance models gave insight into scaffold binding and heteropartner interactions driving asymmetric complex formation. By addressing the interface between identical peptides within a symmetric ternary complex, asymmetric complexes with new functions can be engineered, as shown in context of in vitro enzyme complementation. The designed asymmetric pairs showed more efficient complex formation on the 14‐3‐3 scaffold with concomitant superior enzymatic activity. The introduction of a second interface mutation in the CT32 pairs favored the asymmetric assembly even further, with improved enzyme reconstitution. The results highlight that both the binding affinities of individual interactions and the cooperativity between assembling components are crucial parameters for designing higher‐order protein complexes.
Advances in the structural elucidation of higher‐order protein structures8, 40, 41 provide mechanistic insight into the regulatory role of scaffold proteins in cellular signaling pathways. The design of synthetic equivalents of these higher‐order protein complexes, analogous to those developed by us, can aid fundamental analysis of underlying thermodynamics of the assembling components. Additionally, in vivo introduction of synthetic higher‐order protein complexes as modular synthetic elements can diversify existing pathways and introduce new functionalities, thereby greatly broadening the scope of bottom‐up synthetic biology of signaling complexes and beyond.
Conflict of interest
The authors declare no conflict of interest.
Supporting information
As a service to our authors and readers, this journal provides supporting information supplied by the authors. Such materials are peer reviewed and may be re‐organized for online delivery, but are not copy‐edited or typeset. Technical support issues arising from supporting information (other than missing files) should be addressed to the authors.
Supplementary
Acknowledgements
We thank Dr. Christian Ottmann for fruitful discussions and Dr. Stijn Aper for providing T14‐3‐3. This work was supported by The Netherlands Organization for Scientific Research (NWO) through the VICI grant 016.150.366 and VIDI grant 723.016.003, by the Ministry of Education, Culture and Science (Gravity program 024.001.035), and the European Research Council (project n. 677313 BioCircuit).
L. J. M. Lemmens, J. A. L. Roodhuizen, T. F. A. de Greef, A. J. Markvoort, L. Brunsveld, Angew. Chem. Int. Ed. 2020, 59, 12113.
Contributor Information
Dr. Tom F. A. de Greef, Email: t.f.a.d.greef@tue.nl.
Dr. Albert J. Markvoort, Email: a.j.markvoort@tue.nl.
Dr. Luc Brunsveld, Email: l.brunsveld@tue.nl.
References
- 1. Kagan J. C., Magupalli V. G., Wu H., Nat. Rev. Immunol. 2014, 14, 821–826. [DOI] [PMC free article] [PubMed] [Google Scholar]
- 2. Good M. C., Zalatan J. G., Lim W. A., Science 2011, 332, 680–686.21551057 [Google Scholar]
- 3. Langeberg L. K., Scott J. D., Nat. Rev. Mol. Cell Biol. 2015, 16, 232–244. [DOI] [PMC free article] [PubMed] [Google Scholar]
- 4. Lim W. A., Nat. Rev. Mol. Cell Biol. 2010, 11, 393–403. [DOI] [PMC free article] [PubMed] [Google Scholar]
- 5. Bradley D., Beltrao P., PLOS Biol. 2019, 17, e3000341. [DOI] [PMC free article] [PubMed] [Google Scholar]
- 6. Reebye V., Frilling A., Hajitou A., Nicholls J. P., Habib N. A., Mintz P. J., Cell. Signalling 2012, 24, 388–392. [DOI] [PubMed] [Google Scholar]
- 7. Good M., Tang G., Singleton J., Reményi A., Lim W. A., Cell 2009, 136, 1085–1097. [DOI] [PMC free article] [PubMed] [Google Scholar]
- 8. Li Y., Zhou M., Hu Q., Bai X. C., Huang W., Scheres S. H. W., Shi Y., Proc. Natl. Acad. Sci. USA 2017, 114, 1542–1547. [DOI] [PMC free article] [PubMed] [Google Scholar]
- 9. Manna A., Zhao H., Wada J., Balagopalan L., Tagad H. D., Appella E., Schuck P., Samelson L. E., Proc. Natl. Acad. Sci. USA 2018, 115, E11914–E11923. [DOI] [PMC free article] [PubMed] [Google Scholar]
- 10. Perry N. A., Kaoud T. S., Ortega O. O., Kaya A. I., Marcus D. J., Pleinis J. M., Berndt S., Chen Q., Zhan X., Dalby K. N., et al., Proc. Natl. Acad. Sci. USA 2019, 116, 810–815. [DOI] [PMC free article] [PubMed] [Google Scholar]
- 11. Park S. H., Zarrinpar A., Lim W. A., Science 2003, 299, 1061–1064. [DOI] [PubMed] [Google Scholar]
- 12. Dueber J. E., Wu G. C., Malmirchegini G. R., Moon T. S., Petzold C. J., Ullal A. V., Prather K. L. J., Keasling J. D., Nat. Biotechnol. 2009, 27, 753–759. [DOI] [PubMed] [Google Scholar]
- 13. Fletcher J. M., Harniman R. L., Barnes F. R. H., Boyle A. L., Collins A., Mantell J., Sharp T. H., Antognozzi M., Booth P. J., Linden N., et al., Science 2013, 340, 595–599. [DOI] [PMC free article] [PubMed] [Google Scholar]
- 14. Boyle A. L., Bromley E. H. C., Bartlett G. J., Sessions R. B., Sharp T. H., Williams C. L., Curmi P. M. G., Forde N. R., Linke H., Woolfson D. N., J. Am. Chem. Soc. 2012, 134, 15457–15467. [DOI] [PubMed] [Google Scholar]
- 15. Ljubetič A., Lapenta F., Gradišar H., Drobnak I., Aupič J., Strmšek Ž., Lainšček D., Hafner-Bratkovič I., Majerle A., Krivec N., et al., Nat. Biotechnol. 2017, 35, 1094–1101. [DOI] [PubMed] [Google Scholar]
- 16. Doyle L., Hallinan J., Bolduc J., Parmeggiani F., Baker D., Stoddard B. L., Bradley P., Nature 2015, 528, 585–588. [DOI] [PMC free article] [PubMed] [Google Scholar]
- 17. Brunette T. J., Parmeggiani F., Huang P. S., Bhabha G., Ekiert D. C., Tsutakawa S. E., Hura G. L., Tainer J. A., Baker D., Nature 2015, 528, 580–584. [DOI] [PMC free article] [PubMed] [Google Scholar]
- 18. Rurup W. F., Snijder J., Koay M. S. T., Heck A. J. R., Cornelissen J. J. L. M., J. Am. Chem. Soc. 2014, 136, 3828–3832. [DOI] [PubMed] [Google Scholar]
- 19. Lau Y. H., Giessen T. W., Altenburg W. J., Silver P. A., Nat. Commun. 2018, 9, 1311. [DOI] [PMC free article] [PubMed] [Google Scholar]
- 20. Thomson T. M., Benjamin K. R., Bush A., Love T., Pincus D., Resnekov O., Yu R. C., Gordon A., Colman-Lerner A., Endy D., et al., Proc. Natl. Acad. Sci. USA 2011, 108, 20265–20270. [DOI] [PMC free article] [PubMed] [Google Scholar]
- 21. Douglass E. F., Miller C. J., Sparer G., Shapiro H., Spiegel D. A., J. Am. Chem. Soc. 2013, 135, 6092–6099. [DOI] [PMC free article] [PubMed] [Google Scholar]
- 22. Hobert E. M., Schepartz A., J. Am. Chem. Soc. 2012, 134, 3976–3978. [DOI] [PMC free article] [PubMed] [Google Scholar]
- 23. Whitaker W. R., Davis S. A., Arkin A. P., Dueber J. E., Proc. Natl. Acad. Sci. USA 2012, 109, 18090–18095. [DOI] [PMC free article] [PubMed] [Google Scholar]
- 24. Ryu J., Park S.-H., Sci. Signaling 2015, 8, ra66. [DOI] [PubMed] [Google Scholar]
- 25. Obsil T., Obsilova V., Semin. Cell Dev. Biol. 2011, 22, 663–672. [DOI] [PubMed] [Google Scholar]
- 26. Kondo Y., Ognjenović J., Banerjee S., Karandur D., Merk A., Kulhanek K., Wong K., Roose J. P., Subramaniam S., Kuriyan J., Science 2019, 366, 109–115. [DOI] [PMC free article] [PubMed] [Google Scholar]
- 27. Aghazadeh Y., Papadopoulos V., Drug Discovery Today 2016, 21, 278–287. [DOI] [PubMed] [Google Scholar]
- 28. Kast D. J., Dominguez R., Nat. Commun. 2019, 10, 483. [DOI] [PMC free article] [PubMed] [Google Scholar]
- 29. Ottmann C., Marco S., Jaspert N., Marcon C., Schauer N., Weyand M., Vandermeeren C., Duby G., Boutry M., Wittinghofer A., et al., Mol. Cell 2007, 25, 427–440. [DOI] [PubMed] [Google Scholar]
- 30. Skwarczynska M., Molzan M., Ottmann C., Proc. Natl. Acad. Sci. USA 2013, 110, E377–E386. [DOI] [PMC free article] [PubMed] [Google Scholar]
- 31. den Hamer A., Lemmens L. J. M., Nijenhuis M. A. D., Ottmann C., Merkx M., de Greef T. F. A., Brunsveld L., ChemBioChem 2017, 18, 331–335. [DOI] [PMC free article] [PubMed] [Google Scholar]
- 32. Cornell B., Toyo-oka K., Front. Mol. Neurosci. 2017, 10, 318. [DOI] [PMC free article] [PubMed] [Google Scholar]
- 33. Leaver-Fay A., Tyka M., Lewis S. M., Lange O. F., Thompson J., Jacak R., Kaufman K., Renfrew P. D., Smith C. A., Sheffler W., Davis I. W., Cooper S., Treuille A., Mandell D. J., Richter F F., Ban Y. E., Fleishman S. J., Corn J. E., Kim D. E., Lyskov S., Berrondo M., Mentzer S., Popović Z., Havranek J. J., Karanicolas J., Das R., Meiler J., Kortemme T., Gray J. J., Kuhlman B., Baker D., Bradley P., Methods in Enzymology, Academic Press, New York, 2011, pp. 545–574. [DOI] [PMC free article] [PubMed] [Google Scholar]
- 34. Glasgow A. A., Huang Y.-M., Mandell D. J., Thompson M., Ritterson R., Loshbaugh A. L., Pellegrino J., Krivacic C., Pache R. A., Barlow K. A., et al., Science 2019, 366, 1024–1028. [DOI] [PMC free article] [PubMed] [Google Scholar]
- 35. Chen Z., Boyken S. E., Jia M., Busch F., Flores-Solis D., Bick M. J., Lu P., VanAernum Z. L., Sahasrabuddhe A., Langan R. A., et al., Nature 2019, 565, 106–111. [DOI] [PMC free article] [PubMed] [Google Scholar]
- 36. Dixon A. S., Schwinn M. K., Hall M. P., Zimmerman K., Otto P., Lubben T. H., Butler B. L., Binkowski B. F., Machleidt T., Kirkland T. A., et al., ACS Chem. Biol. 2016, 11, 400–408. [DOI] [PubMed] [Google Scholar]
- 37. Benjamin Stranges P., Kuhlman B., Protein Sci. 2013, 22, 74–82. [DOI] [PMC free article] [PubMed] [Google Scholar]
- 38. Yang J., Hlavacek W. S., Math. Biosci. 2011, 232, 164–173. [DOI] [PMC free article] [PubMed] [Google Scholar]
- 39. De Vink P. J., Andrei S. A., Higuchi Y., Ottmann C., Milroy L. G., Brunsveld L., Chem. Sci. 2019, 10, 2869–2874. [DOI] [PMC free article] [PubMed] [Google Scholar]
- 40. Park E., Rawson S., Li K., Kim B. W., Ficarro S. B., Del Pino G. G., Sharif H., Marto J. A., Jeon H., Eck M. J., Nature 2019, 575, 545–550. [DOI] [PMC free article] [PubMed] [Google Scholar]
- 41. Liau N. P. D., Wendorff T. J., Quinn J. G., Steffek M., Phung W., Liu P., Tang J., Irudayanathan F. J., Izadi S., Shaw A. S., et al., Nat. Struct. Mol. Biol. 2020, 27, 134–141. [DOI] [PubMed] [Google Scholar]
Associated Data
This section collects any data citations, data availability statements, or supplementary materials included in this article.
Supplementary Materials
As a service to our authors and readers, this journal provides supporting information supplied by the authors. Such materials are peer reviewed and may be re‐organized for online delivery, but are not copy‐edited or typeset. Technical support issues arising from supporting information (other than missing files) should be addressed to the authors.
Supplementary