

Abstract
The skin of the ear and the back are frequently selected sites in skin research using mouse models. However, distinct responses to treatment have been described between these two sites in several studies. Despite the crucial role of the stratum corneum (SC) in the skin barrier function of both dorsal back and ear skin, it remains unclear whether differences in lipid composition might underlie altered responses. Here, we compared the skin morphology and the barrier lipid composition of the ear with the back skin of wild‐type mice. The ear contained more corneocyte layers in the SC and its barrier lipid composition was enriched with sphingosine ceramide subclasses, especially the short ones with a total chain length of 33‐34 carbons. The free fatty acid (FFA) profile in the ear skin shifted towards shorter chains, significantly reducing the mean chain length to 23.3 vs 24.7 carbons in the back skin. In line, FFA species in the ear displayed a twofold increase in unsaturation index (P < .001). Gene expression in the ear skin revealed low expression of genes involved in lipid synthesis and uptake, indicating a reduced metabolic activity. Finally, the effects of hypercholesterolaemia on SC FFA composition was compared in ear and back skin of apolipoprotein E knockout (APOE−/−) mice. Interestingly, the FFA profile in APOE−/− ear skin was minimally affected, while the FFA composition in the back skin was markedly changed in response to hypercholesterolaemia. In conclusion, ear and back skin have distinct barrier lipids and respond differently to elevated plasma cholesterol.
Keywords: apolipoprotein E knockout mice, ceramides, fatty acids, wild‐type mice
Abbreviations
- (F)FA
(free) fatty acid
- APOE
apolipoprotein E
- CER
Ceramide
- FTIR
Fourier transform infrared spectroscopy
- LC/MS
liquid chromatography‐mass spectrometry
- SC
stratum corneum
- WT
wild‐type
1. INTRODUCTION
Our understanding of skin morphology and lipid composition has benefitted greatly from the use of in vivo animal models.[ 1 , 2 , 3 ] In particular, mouse models have been proven a valuable tool in skin research as it offers the possibility to genetically manipulate these animals to study the role of specific skin components (eg enzymes, proteins, receptors) and to generate in vivo diseased skin models.[ 1 , 2 ] In research, the back skin and the ear skin of mice are commonly used sites. However, previous studies reported differential effects/phenotypes on ear skin vs the back skin regarding, among others, drug treatment (eg imiquimod‐induced psoriasis, allergic contact dermatitis), melanocyte function and tissue regeneration.[ 4 , 5 , 6 ] The back skin comprises a relatively large area for performing experiments, but in hairy mice it contains a high density of hair follicles (fur) that can complicate the interpretation of the results.[ 5 ] In most studies, the fur is shaved to allow skin treatment and analysis. At the same time, the hair follicles may offer an alternative pathway for compound permeation.[ 7 , 8 ] In contrast, the ear represents an easily accessible, but small, skin area with a low density of hair follicles and centrally supported by a cartilaginous tissue framework.[ 5 ]
Regardless of the skin site, the stratum corneum (SC) has a critical role in skin barrier function protecting against body desiccation and harmful chemicals and pathogens.[ 9 ] The SC is a well‐organized structure of corneocytes (dead cornified keratinocytes) surrounded by an extracellular lipid matrix with free fatty acids (FFAs), ceramides (CERs) and cholesterol as major lipid classes.[ 10 ] Currently, however, there are no studies comparing SC lipids as the primary barrier components in the back vs ear skin. The lipids constituting the SC matrix are mostly synthesized by differentiating keratinocytes[ 10 ] or taken up from the plasma via lipoprotein receptors (eg low‐density lipoprotein receptor, scavenger receptor class B member I (SR‐BI) and cluster of differentiation 36 (CD36)).[ 11 , 12 , 13 ] For the skin barrier function, the only continuous pathway connecting the environment with the viable epidermis is the SC extracellular lipid matrix.[ 14 ] Alterations in the composition of these lipids have been described in various skin pathologies, and it has been demonstrated that the SC lipids are crucial for the primary barrier components in the skin.[ 15 , 16 , 17 , 18 , 19 , 20 ] Exogenous molecules can penetrate the skin via this SC lipid matrix, particularly when the SC lipid profile is modified in response to (environmental) stressors and inflammatory processes.
Recently, we showed that increased plasma lipoprotein levels as described for apolipoprotein E knockout (APOE−/−) and SR‐BI−/− mice are associated with an altered lipid profile in the back skin at young age, affecting mainly the FFA composition.[ 21 , 22 ] In the severely hypercholesterolaemic APOE−/− mice, these epidermal lipids changes led to functional differences in transepidermal water loss towards a less effective skin barrier. APOE−/− mice and other hypercholesterolaemic mouse models have recently been used to study the relation between psoriasis and the comorbidities dyslipidemia and atherosclerosis.[ 23 , 24 , 25 ] Differential effects on the aggravation of dyslipidemia in APOE−/− mice have been described in response to the induction of psoriasis‐like skin inflammation by topical application of compounds on ear vs back skin, with back skin being more effective.[ 6 , 26 ] As lipids play a major role in the skin barrier, it is crucial to know whether there are differences in lipid barrier in ear vs back skin of APOE−/− mice.
In this study, we used young adult wild‐type (WT) mice to compare the morphology, lipid composition and gene expression between dorsal and ear skin. In addition, the epidermal lipid composition of the well‐established hypercholesterolaemic APOE−/− mice was also analysed to assess whether the ear skin develops similar differences in lipid matrix composition in response to hypercholesterolaemia as previously described for the back skin of these mice.[ 22 ]
2. MATERIALS AND METHODS
Supplementary Material (Appendix S1) contains detailed information regarding the applied materials and methods.
2.1. Animals and samples
Sixteen‐ to eighteen‐week‐old female C57BL/6 WT mice and female APOE−/− mice (obtained from The Jackson Laboratory and bred at the Gorlaeus laboratories) were kept under standard laboratory conditions (20°C and light cycle of 12 hours light/12 hours dark) with water and standard low‐fat chow diet provided ad libitum (Rat and Mouse No.3 breeding diet). Prior killing, the mice were anesthetized with a mixture of xylazine, atropine and ketamine (70 mg/kg; 1.8 mg/kg; 350 mg/kg body weight, respectively) and perfused with phosphate‐buffered saline (PBS; 8.13 g/L NaCl, 2.87 g/L Na2HPO4, 0.2 g/L KH2PO4, 0.19 g/L KCl in milliQ water; pH 7.4). The ears (WT and APOE−/− mice) and the shaved back skin (WT mice) were processed for morphological stainings (haematoxylin and eosin, and safranin‐O), epidermal lipid composition analysis (liquid chromatography/mass spectrometry; LC/MS) and gene expression analysis (q‐PCR, detailed information on primers used is available in Table S3). For sebum lipids analysis, hairs were collected from the back skin of both WT and APOE−/− mice. The sebum lipid composition was analysed by LC/MS. Experiments were performed in agreement with National guidelines and approved Animal Experiments Ethics Committee of Leiden University.
2.2. Statistical analysis
Data are presented as mean ± SD and statistical significance was calculated using GraphPad Prism 8 (GraphPad Software Inc). P values below 0.05 were considered significant.
3. RESULTS
3.1. Thicker SC layer in the ear skin compared with the back skin
The general morphology of the ear skin and back skin of wild‐type C57BL/6 mice was assessed by haematoxylin and eosin (HE) and safranin‐O stainings (Figure 1). HE staining of the ear showed a central cartilaginous structure. The hypodermis was more pronounced in the back skin than in ear skin. The dermis and epidermis presented comparable morphology between the two different skin sites. Safranin‐O staining revealed a higher number of corneocyte layers in the ear SC compared ith the back skin. In the latter, corneocytes showed more expansion in response to the alkali environment during the safranin‐O staining.
FIGURE 1.

Epidermal and dermal morphology of back skin and ear skin. Back skin and ear cryostat sections (8 µm) stained with (A) haematoxylin and eosin (HE, scale bar: 50 µm) and (B) safranin‐O (scale bar: 20 µm). Micrographs representative of 3 WT mice
3.2. Epidermal CER composition strongly differs between dorsal and ear skin
For epidermal CER analysis, the epidermis was isolated from dermis in the back skin and used for lipid extraction (Figure 2A). For the ear skin, lipids were extracted from the most distal section of the ear (Figure 2B). Subsequently, the composition of CERs in the extracted lipids was analysed by LC/MS. CER subclasses nomenclature is a combined representation of the acyl chains (non‐hydroxy fatty acid [N]; α‐hydroxy fatty acid [A] or esterified ω‐hydroxy fatty acid [EO]) with the sphingoid base (dihydrosphingosine, [dS]; sphingosine [S] or phytosphingosine [P]) as reported by Motta et al.[ 27 ] The molar percentage distribution of the CER subclasses was strikingly different in the ear skin compared with the back skin (Figure 2C). The majority of the CERs are sphingosine based (CER[S]) on both skin sites (55% in the back skin vs 75% in the ear skin). Nonetheless, in the back skin CER NdS is most abundantly present (nearly 40%), while in ear skin NS and AS are present at higher concentrations (45% and 28%, respectively) than in back skin. The ω‐esterified CERs (CER[EO]), composed of CER EOS and EOdS, represented 7% of the CERs in the back skin. In the ear skin, CER EOS accounted for 14% of the CER content whereas CER EOdS was not detected. The CER[non‐EO] chain length distribution revealed higher abundance of long‐chain CERs (≥43 carbon atoms) in the back skin, while ear skin showed increased presence of short‐chain length CERs (≤42 carbon atoms). Among the short‐chain CERs, the C33 and C34 CERs were strongly present in ear skin (22%) compared with back skin (5%) (Figure 2D‐E). The mean chain length of CER[non‐EO] was shorter in the ear (39.5 carbon atoms vs. 41.8 carbon atoms in the back skin). When focusing on CER [EO], in the back skin, the mean chain length was 67.7 carbons while in the ear skin this average was 68.9 carbons (P < .0001) with marked detection of CERs with 62‐65 carbons, which were merely present in the ear skin (Figure 2D‐F).
FIGURE 2.

CER and FFA composition of the ear and back skin. CERs and FFAs were quantified by LC/MS. Representative images showing (A) epidermis isolation from back skin and (B) distal part of the ear (red circled area) used for lipid extraction. CERs are named according to nomenclature described by Motta et al (1993); (C) Distribution of CER subclasses (% molar); (D) CER mean chain length; total CER chain length distribution (E) CER[non‐EO] and (F) CER[EO]; (G) FFA chain length distribution (molar %); (H) mean FFA chain length; (I) molar ratio between mono‐unsaturated FAs (MUFA) and saturated FAs (SFA). Statistical significance was determined by two‐way ANOVA with Holm‐Sǐdak post hoc test and by two‐tailed unpaired Student's t test. Data presented as mean ± SD (molar); n = 3‐4 samples/group; **P < .01; ***P < .001; ****P < .0001
3.3. Skin lipids in the ear are enriched in short and unsaturated FFA species
The composition of the FFAs with a chain length between 20 and 30 carbons atoms in the ear and the back skin was determined by LC/MS. The FFA composition of the ear skin showed a shift towards shorter and more unsaturated FFA species (Figure 2G). In the back skin, FFA C24:0 and FFA C26:0 were most prevalent FFA, accounting for nearly 70% of the total amount of FFAs (Figure 2G). In the ear skin, FFA C20:1 and C24:0 were most abundant, comprising 43% of the FFAs with a striking fourfold reduction in the percentage of FFA C26:0 to only 10% (Figure 2G). These differences strongly contributed to a shorter mean FFA chain length of 23.3 carbons in the ear compared with an average FFA chain length of 24.5 carbons atoms in the back skin (P < .0001) (Figure 2H). The mol ratio between mono‐unsaturated FAs (MUFAs) and saturated FAs (SFAs) was twofold higher in the ear FFA species (0.36 ± 0.03) than in the dorsal FFAs (0.15 ± 0.02) (P < .001) (Figure 2I).
3.4. Lower basal mRNA levels of genes involved lipid synthesis in the ear skin
The expression of genes involved in lipid synthesis and keratinocyte proliferation and differentiation was assessed to determine the underlying factors responsible for the differences in lipid composition in the ear and in the back skin. Basal mRNA levels of genes involved in cholesterol synthesis (HMGCS1; twofold), esterification (ACAT1; threefold to fourfold) and uptake of lipoproteins (LDLR; twofold) were significantly lower in the ear compared with the back skin (Figure 3A). In addition, the ear also showed a nearly 70% reduction in the expression CERS3 and GBA (synthesis of esterified‐ω‐CERs and cleavage of glucosyl‐CERs, respectively) with no changes in the expression of DEGS1 (enzyme involved in synthesis step of CER[S] from CER[dS]) (Figure 3B). Expression of fatty acid synthase (FAS) was reduced by 30% in the ear while expression of SCD1, an enzyme involved in fatty acid chain desaturation, was comparable between groups (Figure 3C). The ear also showed reduced expression of genes involved in FFA chain elongation; ELOVL1 (twofold) and ELOVL4 (threefold) (Figure 3C). In line with the lower expression of genes related to lipid synthesis, mRNA levels of DGAT2 (triglyceride synthesis) and ABCA12 (lipid transport to lamellar bodies) were also decreased in the ear skin (Figure 3D). The back skin showed higher expression of genes involved in keratinocyte differentiation (IVL) and proliferation (K10) markers (P < .0001) (Figure 3D).
FIGURE 3.

Ear skin shows lower expression levels of several genes involved in skin lipid metabolism and keratinocyte markers. mRNA levels of genes related to the synthesis or uptake of (A) cholesterol; synthesis of (B) CERs; and (C) FFAs. Expression of genes linked to (D) lipid transport in lamellar bodies; triglyceride (TG) synthesis; and keratinocyte proliferation and differentiation. Statistical significance was determined by two‐tailed unpaired Student's t test; *P < .05; **P < .01; ****P < .0001. Data presented as mean ± SD; n = 5/group
3.5. Changes in plasma lipid composition differentially affect dorsal and ear skin
The back skin of hypercholesterolaemic APOE−/− mice shows an altered FFA profile in response to the massively increased levels of apolipoprotein B containing lipoprotein particles in the circulation at young age.[ 22 ] It remains unknown whether the skin in the ears is similarly affected by this hypercholesterolaemic profile. Thus, next, we analysed the FFA composition in the ear of APOE−/− mice and compared it with that described for WT ear skin in Figure 2G. The relative distribution of FFA (% total FFA) in the ear of APOE−/− mice was nearly comparable to the composition described for WT ear (Figure 4A). The FFA composition in the ear of APOE−/− mice showed a significant increase in the percentage of FFA C20:0 (P < .0001) accompanied by reduction in the percentage of FFA C24:0 (P < .0001). Consequently, a small shift towards a shorter chain length was observed in the ear of APOE−/− mice (Figure 4B). The molar ratio between mono‐unsaturated and saturated FFA species was not altered (Figure 4C). Sebum lipids, produced by sebaceous glands, contribute to the skin surface lipid pool, particularly in back skin with a high density of hair follicles, and hence, sebaceous glands.[ 28 ] Triglycerides, a component of sebum lipids, may undergo hydrolysis by microbial lipases generating FFAs.[ 29 , 30 , 31 ] Thus, next we compared the composition of the FFAs in the sebum surrounding back skin hairs of both WT and APOE−/− mice to assess whether the sebum of APOE−/− mice was affected by the hypercholesterolaemic profile of these mice. The sebum FFA composition of WT and APOE−/− mice was overall comparable (Figure 4D), indicating that the observed differential response to hypercholesterolaemia between back and ear skin cannot be explained by effects on the FFA content of sebum.
FIGURE 4.
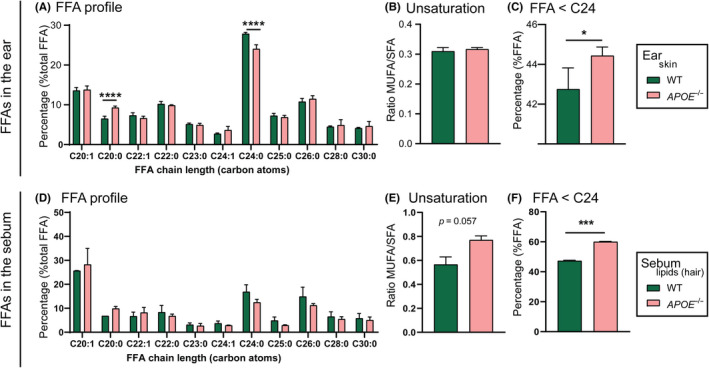
FFA composition of the ear and of sebum in normolipidemic WT and hypercholesterolaemic APOE−/− mice. FFA profile: (A) FFA chain length distribution profile in the ear skin; (B) molar ratio between mono‐unsaturated FFAs (MUFA) and saturated FFAs (SFA) in the ear skin; (C) percentage of short chain FFA (FFA chains containing less than 24 carbon atoms) in the ear skin; (D) FFA chain length distribution profile in the sebum lipids; (E) molar ratio between mono‐unsaturated FFAs (MUFA) and saturated FFAs (SFA) in the sebum lipids; (F) percentage of short‐chain FFA (FFA chains containing less than 24 carbon atoms) in the sebum lipids. Statistical significance was determined by one‐way ANOVA with Holm‐Sǐdak post hoc test and by two‐tailed unpaired Student's t test. Data presented as mean ± SD; n = 3‐4 samples/group; *P < .05; ****P < .0001
4. DISCUSSION
In mouse models, both ear and back skin have been proven valuable assets in a large range of skin studies.[ 1 , 2 , 3 ] However, similarities and differences between ear and back skin are not extensively examined. In the present study, we provide evidence that the lipid composition of the skin barrier is fundamentally different between the two sites, as is the expression of genes related to lipid synthesis and keratinocytes differentiation and proliferation. In addition, the skin of the ear showed only a minimal response to hypercholesterolaemic conditions as compared to the back skin.
The density of hair follicles and the number of corneocyte layers in the SC are important factors in skin research as they directly relate to skin permeability and, thus, barrier function. In hairy mice, the high density of hair follicles provides a smaller interfollicular area and comprises a permeation pathway into the skin. In the hairy C57Bl6 mouse strain, melanin production is restricted to the hair follicles and absent in the skin. Melanin is mostly produced during the anagen phase of the hair growth, giving the skin a dark pigmentation.[ 32 ] As hair growth in the murine skin occurs in waves, it leads to the formation of dark pigmented areas (dark patches) and non‐pigmented areas (“white” patches). The dark skin patches with synchronized hair cycles appear after the age of 10 weeks.[ 32 ] In this study, “white” skin patches at similar position in the back skin were used for analysis as different hair cycles can influence the skin response to compounds and even the development of inflammation.[ 25 , 33 ] The SC in these “white” back skin patches of hairy mice has fewer number of corneocyte layers as compared to ear skin. The back skin of nude mice with a larger interfollicular area displays a thicker SC with more corneocyte layers,[ 34 ] suggesting that the reduced number of corneocyte layers in hairy mice is a direct effect of the presence of dense hair follicles and/or fur. The reduced number of corneocyte layers in the back skin may require a faster turnover/replacement to preserve the barrier, while in the ear skin this turnover may take longer. Also, the ear skin has a lower density of blood vessels as well as lymphatic vessels than the back skin indicating a reduced metabolic activity and even drainage in the ear.[ 6 , 35 , 36 ] Accordingly, the basal expression of genes related to lipid synthesis/uptake and keratinocyte differentiation and proliferation was significantly higher in the back skin, likely reflecting the more active metabolic profile at this site.
The mRNA expression of the enzymes CERS3, ELOVL1 and ELOVL4 was lower in ear skin as compared to back skin. CERS3 encodes for the main ceramide synthase involved in the synthesis of CER[EO], and it regulates the elongation of FA chains by ELOVL1 and ELOVL4.[ 37 ] In vitro co‐expression of CERS3 with ELOVL1 leads to an augmented production of CERs with a C26:0 acyl chain which is also accompanied by an increase in CERs with a C24:0 acyl chain.[ 37 ] Further elongation of C26:0 FAs is continued by ELOVL4 to generate both CER[non‐EO] and CER[EO] with acyl chains containing more than 26 carbon atoms.[ 37 ] In vivo, ELOVL1−/− mice and ELOVL4−/− mice show a remarkable reduction in CER[EO] content and a shift towards CER containing acyl chains shorter than 24 carbons atoms.[ 37 , 38 ] Despite the low levels of CERS3 in the ear skin, CER[EO] accounted for a relatively high percentage of the CERs in the ear skin, which may be a result of the overall percentage distribution of each subclass. Surprisingly, the mean chain length of CER[EO] was higher in the ear skin where reduced expressions of ELOVL1 and ELOVL4 were observed. Remarkably, the skin of ELOVL4−/− mice also showed major increases in the prevalence of CER NS and CER AS, especially containing acyl chain C26:0.[ 39 ] In the present study, the ear skin showed high prevalence of CER[S], while the expression of DEGS1, encoding for the desaturase enzyme that converts CER[dS] into CER[S],[ 40 ] was comparable to the back skin, indicating that the absence of ELOVL4 can be related to the accumulation of CER NS and CER AS.[ 39 ] In line, the reduced expression of CERS3, ELOVL1 and ELOVL4 in the ear skin resulted in an increase in the fraction of sphingosine CERs with a total chain length of 33 and 34 carbon atoms, especially in CER NS and CER AS subclasses. Although CERs are essential components of the skin barrier, little information is available regarding the mechanism(s) involved in the regulation of ceramide synthesis.[ 41 ] Other factors, not included in the scope of this study (eg acyl‐coenzyme A‐binding protein), may also impact CER synthesis and contribute to the results described here.[ 41 ]
The changes in the FFA composition in the ear corroborate with the reduced expression of ELOVL1 and ELOVL4 in the ear skin, leading to a FFA profile enriched with shorter chains. The ear skin also showed a higher presence of unsaturated FFA species compared with the back skin, although no changes were observed in the basal expression of SCD1, an enzyme tightly regulated and subjected to fast turn on/off expression.[ 42 , 43 ] Altogether, our LC/MS and PCR data show that the skin lipid composition largely varies with the anatomical site even within young adult WT mice. Elucidation of the underlying causes for the reported differences between ear and back skin warrants further investigation.
As lipids are important components of the SC, variations in the skin lipid composition can affect the barrier function. In atopic dermatitis patients, the CER profile shows increased levels of CER NS and CER AS and a reduction of the average chain length linked to increased levels of C34 CERs in these subclasses.[ 44 ] These patients also have a higher percentage of short and unsaturated FFA species in their skin lipids.[ 44 ] Human skin equivalents, bioengineered in vitro models of human skin often containing activated keratinocytes, also show similar changes in lipid profile.[ 45 ] In both atopic dermatitis skin and in human skin equivalents samples, the altered lipid composition results in a reduced barrier function of the skin compared with native human skin.[ 44 , 45 ] In this view, it is likely that the changes in lipid composition described here for the ear skin is not favourable for an optimal lipid barrier, which may lead to higher number of corneocyte layers in order to compensate for this unfavourable lipid profile.
Lipids provided by plasma lipoproteins are also incorporated into the skin and hence an imbalance in lipoprotein profile may affect the composition of the barrier lipid pool.[ 21 , 22 , 35 , 46 ] Hypercholesterolaemic APOE−/− mice develop skin inflammation and lipid deposits in the dermal compartment upon ageing and when fed a high cholesterol/high fat diet.[ 47 , 48 ] Remarkably, already at young age, the back skin of these hypercholesterolaemic mice shows altered epidermal lipid composition prior to the development of inflammatory skin profiles.[ 22 ] The FFA composition is especially affected in the back skin showing enrichment in short and unsaturated chains. In contrast, in the current study we found that the ear skin of young APOE−/− mice is minimally affected with only a minor shift towards shorter FFA chains. Considering the faster turnover of corneocyte layers in the back skin in combination with higher density of lymphatic and blood vessels, this skin site can more readily reflect the changes in the plasma lipids. Our findings provide insight why, as previously described, the ear and the back skin react differently to specific treatments leading to distinct outcomes, for example, imiquimod‐induced psoriasis.[ 6 ]
In conclusion, the morphology and lipid composition of murine skin significantly vary depending on the body location, specifically in the ear and in the back skin. We suggest that the turnover rate of the corneocyte layer in combination with the level of metabolic activity of the skin site can be key players in the response to therapeutic intervention and to systemic lipid changes. Nonetheless, defining which skin site should be used in studies is not straightforward as the skin is a complex organ. It is important to further characterize the morphological, inflammatory and metabolic variations among skin sites in order to better match the skin site to the goal of the study.
CONFLICT OF INTEREST
The authors have declared no conflicting interests.
AUTHOR CONTRIBUTION
RMC, MVE and JAB designed the experiments; RMC and SA performed the research and analysed the data; RMC, MVE and JAB interpreted the data; RMC wrote the manuscript; RMC, MVE and JAB revised the manuscript. All authors have read and approved the content of this research article.
Supporting information
Table S1 . Solvents used for cholesterol and CER analysis by UPLC‐LC/MS.
Table S2 . Solvents used for FFA analysis by UPLC‐LC/MS.
Table S3 . Forward and reverse primer sequences.
ACKNOWLEDGEMENTS
This research was funded by the Leiden Academic Centre for Drug Research (Leiden, The Netherlands).
Martins Cardoso R, Absalah S, Van Eck M, Bouwstra JA. Barrier lipid composition and response to plasma lipids: A direct comparison of mouse dorsal back and ear skin. Exp Dermatol. 2020;29:548–555. 10.1111/exd.14106
Miranda Van Eck and Joke A. Bouwstra contributed equally.
REFERENCES
- 1. Avci P., Sadasivam M., Gupta A., De Melo W. C. M. A., Huang Y.‐Y., Yin R., Chandran R., Kumar R., Otufowora A., Nyame T., Hamblin M. R., Expert Opin. Drug Discov. 2013, 8, 331. [DOI] [PMC free article] [PubMed] [Google Scholar]
- 2. Abd E., Yousef S. A., Pastore M. N., Telaprolu K., Mohammed Y. H., Namjoshi S., Grice J. E., Roberts M. S., Clin. Pharmacol. Adv. Appl. 2016, 8, 163. [DOI] [PMC free article] [PubMed] [Google Scholar]
- 3. Todo H., Pharmaceutics 2017, 9(3), 1. [DOI] [PMC free article] [PubMed] [Google Scholar]
- 4. Nguyen T., Wei M. L., J. Invest. Dermatol. 2007, 127, 421. [DOI] [PubMed] [Google Scholar]
- 5. Metcalfe A. D., Willis H., Beare A., Ferguson M. W. J., J. Anat. 2006, 209, 439. [DOI] [PMC free article] [PubMed] [Google Scholar]
- 6. Madsen M., Pedersen T. X., Nielsen L. B., Johansen C., Hansen P. R., Ann. Dermatol. 2018, 30, 485. [DOI] [PMC free article] [PubMed] [Google Scholar]
- 7. Mohd F., Todo H., Yoshimoto M., Yusuf E., Sugibayashi K., Pharmaceutics 2016, 8, 32. [DOI] [PMC free article] [PubMed] [Google Scholar]
- 8. Blume‐Peytavi U., Massoudy L., Patzelt A., Lademann J., Dietz E., Rasulev U., Garcia Bartels N., Eur. J. Pharm. Biopharm. 2010, 76, 450. [DOI] [PubMed] [Google Scholar]
- 9. Elias P. M., J. Invest. Dermatol. 2005, 125, 183. [DOI] [PubMed] [Google Scholar]
- 10. Ponec M., Weerheim A., Lankhorst P., Wertz P., J. Invest. Dermatol. 2003, 120, 581. [DOI] [PubMed] [Google Scholar]
- 11. Lin M.‐H., Khnykin D., Biochim. Biophys. Acta 2014, 1841, 362. [DOI] [PMC free article] [PubMed] [Google Scholar]
- 12. Mommaas M., Tada J., Ponec M., J. Dermatol. Sci. 1991, 2, 97. [DOI] [PubMed] [Google Scholar]
- 13. Tsuruoka H., Khovidhunkit W., Brown B. E., Fluhr J. W., Elias P. M., Feingold K. R., J. Biol. Chem. 2002, 277, 2916. [DOI] [PubMed] [Google Scholar]
- 14. Sahle F. F., Gebre‐Mariam T., Dobner B., Wohlrab J., Neubert R. H. H., Skin Pharmacol. Physiol. 2015, 28(1), 42. [DOI] [PubMed] [Google Scholar]
- 15. Zheng Y., Micic M., Mello S. V., Mabrouki M., Andreopoulos F. M., Konka V., Pham S. M., Leblanc R. M., Macromolecules 2002, 35, 5228. [Google Scholar]
- 16. Zhang X., Chi Z., Zhang J., Li H., Xu B., Li X., Liu S., Zhang Y., Xu J., J. Phys. Chem. B 2011, 115, 7606. [DOI] [PubMed] [Google Scholar]
- 17. Zhang X.‐X., Wang Z., Yue X., Ma Y., Kiesewetter D. O., Chen X., Mol. Pharm. 2013, 10, 1910. [DOI] [PMC free article] [PubMed] [Google Scholar]
- 18. Janssens M., van Smeden J., Gooris G. S., Bras W., Portale G., Caspers P. J., Vreeken R. J., Hankemeier T., Kezic S., Wolterbeek R., Lavrijsen A. P., Bouwstra J. A., J. Lipid Res. 2012, 53(12), 2755‐2766. [DOI] [PMC free article] [PubMed] [Google Scholar]
- 19. Hoekstra M., Meurs I., Koenders M., Out R., Hildebrand R. B., Kruijt J. K., Van Eck M., Van Berkel T. J. C., J. Lipid Res. 2008, 49, 738. [DOI] [PubMed] [Google Scholar]
- 20. van Smeden J., Janssens M., Boiten W. A., van Drongelen V., Furio L., Vreeken R. J., Hovnanian A., Bouwstra J. A., J. Invest. Dermatol. 2014, 134, 1238. [DOI] [PubMed] [Google Scholar]
- 21. Martins Cardoso R., Creemers E., Absalah S., Hoekstra M., Gooris G. S., Bouwstra J. A., Van Eck M., Biochim. Biophys. Acta 2020, 1865, 158592. [DOI] [PubMed] [Google Scholar]
- 22. Martins Cardoso R., Creemers E., Absalah S., Gooris G. S., Hoekstra M., Van Eck M., Bouwstra J. A., Biochim. Biophys. Acta Mol. Cell Biol. Lipids, 2019, 1864, 976. [DOI] [PubMed] [Google Scholar]
- 23. Madsen M., Hansen P. R., Nielsen L. B., Cardoso R. M., van Eck M., Pedersen T. X., Am. J. Pathol. 2018, 188, 1486. [DOI] [PubMed] [Google Scholar]
- 24. Xie X., Zhang L., Lin Y., Wang Y., Liu W., Li X., Li P., J. Dermatol. Sci. 2017, 88(1), 20. [DOI] [PubMed] [Google Scholar]
- 25. Madsen M., Hansen P. R., Nielsen L. B., Hartvigsen K., Pedersen A. E., Christensen J. P., Aarup A., Pedersen T. X., BMC Dermatol. 2016, 16(1), 9. [DOI] [PMC free article] [PubMed] [Google Scholar]
- 26. Schaper K., Dickhaut J., Japtok L., Kietzmann M., Mischke R., Kleuser B., Bäumer W., J. Dermatol. Sci. 2013, 71(1), 29. [DOI] [PubMed] [Google Scholar]
- 27. Motta S., Monti M., Sesana S., Caputo R., Carelli S., Ghidoni R., Biochim. Biophys. Acta 1993, 1182, 147. [DOI] [PubMed] [Google Scholar]
- 28. Pappas A., Johnsen S., Liu J.‐C., Eisinger M., Dermatoendocrinology 2009, 1(3), 157. [DOI] [PMC free article] [PubMed] [Google Scholar]
- 29. Maier H., Meixner M., Hartmann D., Sandhoff R., Wang‐Eckhardt L., Zöller I., Gieselmann V., Eckhardt M., J. Biol. Chem. 2011, 286, 25922. [DOI] [PMC free article] [PubMed] [Google Scholar]
- 30. Feldman A., Mukha D., Maor I. I., Sedov E., Koren E., Yosefzon Y., Shlomi T., Fuchs Y., Nat. Commun. 2019, 10(1), 2348. [DOI] [PMC free article] [PubMed] [Google Scholar]
- 31. Dahlhoff M., Camera E., Schäfer M., Emrich D., Riethmacher D., Foster A., Paus R., Schneider M. R., Development 2016, 143, 1823. [DOI] [PubMed] [Google Scholar]
- 32. Plikus M. V., Chuong C.‐M., J. Invest. Dermatol 2008, 128(5), 1071. [DOI] [PMC free article] [PubMed] [Google Scholar]
- 33. Hofmann U., Tokura Y., Nishijima T., Takigawa M., Paus R., J. Invest. Dermatol. 1996, 106, 598. [DOI] [PubMed] [Google Scholar]
- 34. Rissmann R., Oudshoorn M. H. M., Hennink W. E., Ponec M., Bouwstra J. A., Arch. Dermatol. Res. 2009, 301, 609. [DOI] [PMC free article] [PubMed] [Google Scholar]
- 35. Liu F., Smith J., Zhang Z., Cole R., Herron B. J., Dev. Biol. 2010, 340, 480. [DOI] [PMC free article] [PubMed] [Google Scholar]
- 36. Huggenberger R., Siddiqui S. S., Brander D., Ullmann S., Zimmermann K., Antsiferova M., Werner S., Alitalo K., Detmar M., Blood 2011, 117, 4667. [DOI] [PMC free article] [PubMed] [Google Scholar]
- 37. Sassa T., Ohno Y., Suzuki S., Nomura T., Nishioka C., Kashiwagi T., Hirayama T., Akiyama M., Taguchi R., Shimizu H., Itohara S., Kihara A., Mol. Cell. Biol. 2013, 33, 2787. [DOI] [PMC free article] [PubMed] [Google Scholar]
- 38. Khnykin D., Miner J. H., Jahnsen F., Dermatoendocrinology 2011, 3, 53. [DOI] [PMC free article] [PubMed] [Google Scholar]
- 39. Li W., Sandhoff R., Kono M., Zerfas P., Hoffmann V., Ding B. C. H., Proia R. L., Deng C. X., Int. J. Biol. Sci. 2007, 3, 120. [DOI] [PMC free article] [PubMed] [Google Scholar]
- 40. Ternes P., Franke S., Zähringer U., Sperling P., Heinz E., J. Biol. Chem. 2002, 277, 25512. [DOI] [PubMed] [Google Scholar]
- 41. Ferreira N. S., Engelsby H., Neess D., Kelly S. L., Volpert G., Merrill A. H., Futerman A. H., Færgeman N. J., J. Biol. Chem. 2017, 292, 7588. [DOI] [PMC free article] [PubMed] [Google Scholar]
- 42. Sampath H., Ntambi J. M., J. Biol. Chem. 2014, 289, 2482. [DOI] [PMC free article] [PubMed] [Google Scholar]
- 43. Mauvoisin D., Mounier C., Biochimie 2011, 93(1), 78. [DOI] [PubMed] [Google Scholar]
- 44. van Smeden J., Janssens M., Kaye E. C. J., Caspers P. J., Lavrijsen A. P., Vreeken R. J., Bouwstra J. A., Exp. Dermatol. 2014, 23(1), 45. [DOI] [PubMed] [Google Scholar]
- 45. Helder R. W. J., Boiten W. A., van Dijk R., Gooris G. S., El Ghalbzouri A., Bouwstra J. A., Biochim. Biophys. Acta Mol. Cell Biol. Lipids 2020, 1865, 158546. [DOI] [PubMed] [Google Scholar]
- 46. Huang L.‐H., Zinselmeyer B. H., Chang C.‐H., Saunders B. T., Elvington A., Baba O., Broekelmann T. J., Qi L., Rueve J. S., Swartz M. A., Kim B. S., Mecham R. P., Wiig H., Thomas M. J., Sorci‐Thomas M. G., Randolph G. J., Cell Metab. 2019, 29, 475. [DOI] [PMC free article] [PubMed] [Google Scholar]
- 47. Feingold K. R., Elias P. M., Mao‐Qiang M., Fartasch M., Zhang S. H., Maeda N., J. Invest. Dermatol. 1995, 104, 246. [DOI] [PubMed] [Google Scholar]
- 48. Ang L. S., Cruz R. P., Hendel A., Granville D. J., Exp. Gerontol. 2008, 43, 615. [DOI] [PubMed] [Google Scholar]
Associated Data
This section collects any data citations, data availability statements, or supplementary materials included in this article.
Supplementary Materials
Table S1 . Solvents used for cholesterol and CER analysis by UPLC‐LC/MS.
Table S2 . Solvents used for FFA analysis by UPLC‐LC/MS.
Table S3 . Forward and reverse primer sequences.