

Abstract
Background
Prostate cancer exhibits severe clinical heterogeneity and there is a critical need for clinically implementable tools able to precisely and noninvasively identify patients that can either be safely removed from treatment pathways or those requiring further follow up. Our objectives were to develop a multivariable risk prediction model through the integration of clinical, urine‐derived cell‐free messenger RNA (cf‐RNA) and urine cell DNA methylation data capable of noninvasively detecting significant prostate cancer in biopsy naïve patients.
Methods
Post‐digital rectal examination urine samples previously analyzed separately for both cellular methylation and cf‐RNA expression within the Movember GAP1 urine biomarker cohort were selected for a fully integrated analysis (n = 207). A robust feature selection framework, based on bootstrap resampling and permutation, was utilized to find the optimal combination of clinical and urinary markers in a random forest model, deemed ExoMeth. Out‐of‐bag predictions from ExoMeth were used for diagnostic evaluation in men with a clinical suspicion of prostate cancer (PSA ≥ 4 ng/mL, adverse digital rectal examination, age, or lower urinary tract symptoms).
Results
As ExoMeth risk score (range, 0‐1) increased, the likelihood of high‐grade disease being detected on biopsy was significantly greater (odds ratio = 2.04 per 0.1 ExoMeth increase, 95% confidence interval [CI]: 1.78‐2.35). On an initial TRUS biopsy, ExoMeth accurately predicted the presence of Gleason score ≥3 + 4, area under the receiver‐operator characteristic curve (AUC) = 0.89 (95% CI: 0.84‐0.93) and was additionally capable of detecting any cancer on biopsy, AUC = 0.91 (95% CI: 0.87‐0.95). Application of ExoMeth provided a net benefit over current standards of care and has the potential to reduce unnecessary biopsies by 66% when a risk threshold of 0.25 is accepted.
Conclusion
Integration of urinary biomarkers across multiple assay methods has greater diagnostic ability than either method in isolation, providing superior predictive ability of biopsy outcomes. ExoMeth represents a more holistic view of urinary biomarkers and has the potential to result in substantial changes to how patients suspected of harboring prostate cancer are diagnosed.
Keywords: biomarkers, cell‐free, liquid biopsy, machine learning, methylation, prostate cancer
1. INTRODUCTION
Prostate cancer exhibits extreme clinical heterogeneity; 10‐year survival rates following diagnosis approach 84%, yet prostate cancer is still responsible for 13% of all cancer deaths in men in the United Kingdom. 1 Coupled with the high rates of diagnosis, prostate cancer is more often a disease that men die with rather than from. This illustrates the need for clinically implementable tools able to selectively identify those men that can be safely removed from treatment pathways without missing those men harboring a disease that requires intervention.
An opportune point to intervene or supplement current clinical practices would be before an initial biopsy in men suspected of having prostate cancer, reducing costs to men, health care systems and providers alike. In current clinical practice men are selected for further investigations for prostate cancer if they have an elevated prostate‐specific antigen (PSA) (≥4 ng/mL) and an adverse finding on digital rectal examination (DRE) or lower urinary tract symptoms; other factors such as age and ethnicity are also considered. 2 , 3 , 4 However, the rates of negative biopsies in men with a clinical suspicion of prostate cancer are overwhelming; a recent population‐level study of 419 582 men from Martin et al 5 observed that 60% of all biopsies in the control arm of the Cluster‐Randomised Trial of PSA Testing for Prostate Cancer (CAP) were negative for prostate cancer, similar to the rates observed by Donovan et al 6 as part of the ProtecT trial. 6 Needle biopsy is invasive, and not without complications: 44% of patients report pain, and detection of clinically insignificant disease can result in years of monitoring, causing patients undue stress. 4 Multiparametric magnetic resonance imaging (MP‐MRI) has been developed as a triage tool to reduce the rates of negative biopsy and its use has become increasingly widespread since its validation. 7 However, MP‐MRI is relatively expensive and has shown a high rate of interoperator and intermachine variability, leading to MP‐MRI missing up to 28% of clinically significant diseases in practice. 4 , 8 , 9 , 10
The interconnected nature of the male urological system makes it an ideal candidate for liquid biopsy and noninvasive biomarkers for prostate cancer. There is a sizeable interest in the development of such noninvasive tests and classifiers capable of reducing the rates of initial biopsy in men while retaining the sensitivity to detect aggressive disease. Single‐gene or expression panels of few genes, such as the PCA3, 11 SelectMDx, 12 ExoDx Prostate(IntelliScore) 13 tests have published promising results to date for the noninvasive detection of significant disease (Gleason score [Gs] ≥7). Similarly, several urine methylation panels have been developed; the ProCUrE assay from Zhao et al 14 quantifies the methylation of HOXD4 and GSTP1 for the detection of CAPRA score 3 to 10 disease, while Brikun et al 15 assessed the binary presence or absence of CpG island methylation associated with 18 genes to predict the presence of any prostate cancer on biopsy. However, these biomarker panels have yet to be widely implemented in clinical settings, and none are currently recommended within the NICE guidelines, 4 suggesting that improvements are required. Other studies have aimed to detect the most aggressive cancers by utilizing tissue samples taken at the time of biopsy, resulting in moderate success and wider clinical adoption. 16 , 17 , 18 However, due to their proposed implementation within current clinical pathways, these tests may not take into consideration the considerable economic, psychological, and societal costs of unnecessarily subjecting men with low volume, indolent disease to biopsy. 19 , 20 , 21
In 2012, the Movember Global Action Plan 1 (GAP1) initiative was launched, a collaborative effort between multiple institutes focusing on prostate cancer biomarkers in urine, plasma, serum, and extracellular vesicles. The prime aim of the GAP1 initiative was to develop a multimodal urine biomarker panel for the discrimination of disease state. The authors have previously published analyses from two of the GAP1 studies that measured differing molecular aspects within urine; epiCaPture assayed hypermethylation of urinary cell DNA, 22 and PUR assessed transcript levels in cell‐free extracellular vesicle messenger RNA (cf‐RNA) using NanoString. 23 Both of these tests were able to discriminate some level of clinically significant disease and exhibited differing characteristics; where epiCaPture was well suited to detecting the highest grade disease (Gs ≥8), PUR was better matched to the deconvolution of lower‐risk and indolent disease, as detailed by its prognostic ability in active surveillance use. With a suitable overlap in the numbers of patient samples analyzed by both methods, we hypothesized that these two methods could be complementary, and the integration of both data sets could result in a more holistic model with predictive ability greater than the sum of its parts, able to encapsulate the clinical heterogeneity of prostate cancer and reach the levels of accuracy and utility required for widespread adoption. In this study, we report the diagnostic accuracy of such an integrated model, determined by the ability to predict the presence of Gs ≥7 and Gs ≥4 + 3 disease on biopsy, both are critical distinctions, where patients with Gs ≥7 are recommended radical therapy, 4 while patients with Gs 4 + 3 have significantly worse outcomes than Gs 3 + 4 patients. 24 Mindful that many cancer biomarkers fail to translate to the clinic, the development of the presented model has been carried out adhering to the transparent reporting of a multivariable prediction model for individual prognosis or diagnosis (TRIPOD) guidelines. 25
2. MATERIALS AND METHODS
2.1. Patient population and characteristics
The full Movember GAP1 urine cohort comprises of 1 257 first‐catch post‐DRE, pre‐TRUS biopsy urine samples collected between 2009 and 2015 from urology clinics at multiple sites. Samples within the Movember cohort that were analyzed for both methylation and cf‐RNA were eligible for selection for model development in the current study (n = 207).
Exclusion criteria for model development included a recent prostate biopsy or transurethral resection of the prostate (<6 weeks) and metastatic disease (confirmed by a positive bone scan or PSA >100 ng/mL), resulting in a cohort of 197 samples, deemed the ExoMeth cohort. The samples analyzed in the ExoMeth cohort were collected from the Norfolk and Norwich University Hospital (NNUH, Norwich, UK, n = 181) and St James's Hospital (SJH; Dublin, Republic of Ireland, n = 16).
2.2. Sample processing and analysis
Urine samples were processed according to the Movember GAP1 standard operating procedure (Supporting Information Methods). Hypermethylation at the 5′‐regulatory regions of six genes (GSTP1, SFRP2, IGFBP3, IGFBP7, APC, and PTSG2) in urinary cell‐pellet DNA was assessed using a quantitative methylation‐specific polymerase chain reaction (qPCR) as described by O'Reilly et al. 22 cf‐RNA was isolated and quantified from urinary extracellular vesicles using NanoString technology, with 167 gene‐probes (Table S1), as described in Connell et al, 23 with the modification that NanoString data were normalized according to NanoString guidelines using NanoString internal positive controls, and log2 transformed. Clinical variables considered were serum PSA, age at sample collection, DRE impression, and urine volume collected.
2.3. Statistical analysis
All analyses, model construction and data preparation were undertaken in R version 3.5.3, 26 and unless otherwise stated, utilized base R and default parameters.
2.4. Feature selection
In total, 177 variables were available for prediction (cf‐RNA [n = 167], methylation [n = 6], and clinical variables [n = 4]; for full list see Supporting Information Data), making feature selection a key task for minimizing model overfitting and increasing the robustness of trained models. To avoid dataset‐specific features being positively selected, 27 we implemented a robust feature selection workflow utilizing the Boruta algorithm 28 and bootstrap resampling. Boruta is a random forest‐based algorithm that iteratively compares feature importance against random predictors, deemed “shadow features”. Features that perform significantly worse compared to the maximally performing shadow features, at each permutation (P ≤ .01, calculated by Z‐score difference in mean accuracy decrease), are consecutively dropped until only confirmed, stable features remain.
Boruta was applied on 1000 data sets generated by resampling with replacement. Features were only positively selected for model construction when confirmed as stable features in 90% of resampled Boruta runs or over.
Additional methylation information from four genes (HOXD3, TGFβ2, KLK10, and TBX15) was available for a subset of the ExoMeth cohort from previous analyses by Zhao et al (n = 144) 14 ; however, these genes did not add additional information in preliminary analysis and were not included in further analyses (data not shown).
2.5. Comparator models
To evaluate potential clinical utility, additional models were trained as comparators using subsets of the available variables across the patient population: a clinical standard of care (SoC) model was trained by incorporating age, PSA, T‐staging, and clinician DRE impression; a model using only the available DNA methylation probes (methylation, n = 6); and a model only using NanoString gene probe information (ExoRNA, n = 167). The fully integrated ExoMeth model was trained by incorporating information from all of the above variables (n = 177). Each set of variables for comparator models were independently selected via the bootstrapped Boruta feature selection process described above to select the most optimal subset of variables possible for each predictive model.
2.6. Model construction
All models were trained via the random forest algorithm, 29 using the randomForest package 30 with default parameters except for resampling without replacement and 401 trees being grown per model. Risk scores from trained models are presented as the out‐of‐bag predictions; the aggregated outputs from decision trees within the forest where the sample in question has not been included within the resampled data set. 29 Bootstrap resamples were identical for feature selection and model training for all models and used the same random seed.
Models were trained on a modified continuous label, based by binning samples on biopsy outcome and constructed as follows: samples were scored on a continuous scale (range, 0‐1) according to Gs: where no evidence of cancer on biopsy are scored 0, patients with predominantly Gleason pattern 3 disease are assigned 0.5, and predominantly Gleason 4 (or 5) are assigned to 1. Further, treating this label as a continuous variable, recognizes that two patients with the same Gleason pattern TRUS biopsy‐detected cancer may not share the exact same proportions of tumor pattern, or overall disease burden within their prostate. This scale is solely used for model training and is not represented in any clinical endpoint measurements, or for determining predictive ability and clinical utility.
2.7. Statistical evaluation of model predictivity
Area under the receiver‐operator characteristic curve (AUC) metrics were produced using the pROC package, 31 with confidence intervals calculated via 1000 stratified bootstrap resamples. Density plots of model risk scores and all other plots were created using the ggplot2 package. 32 Cumming estimation plots and calculations were produced using the dabestr package 33 and 1000 bootstrap resamples were used to visualize robust effect size estimates of model predictions.
Decision curve analysis (DCA) 34 examined the potential net benefit of using the developed comparator models in the clinic. Standardized net benefit (sNB) was calculated with the rmda package 35 and presented throughout our DCAs as it is a more directly interpretable metric compared to a net benefit. 36 To ensure DCA was representative of a more general population, the prevalence of Gs within the ExoMeth cohort were adjusted via stratified bootstrap resampling to match those observed in a population of 219 439 men that were in the control arm of the CAP Trial, 5 as described in Connell et al. 23 Briefly, of the biopsied men within this CAP cohort, 23.6% were Gs 6, 8.7% Gs 7, and 7.1% Gs ≥8, with 60.6% of biopsies showing no evidence of cancer. These ratios were used to perform stratified bootstrap sampling with replacement of the Movember cohort to produce a “new” data set of 197 samples with risk scores from each comparator model. sNB was then calculated for this resampled data set, and the process repeated for a total of 1000 resamples with replacement. The mean sNB for each risk score and the “treat‐all” options over all iterations were used to produce the presented figures to account for variance in resampling. The net reduction in biopsies, based on the adoption of models vs the default treatment option of undertaking biopsy in all men with PSA 4 ng/mL or above was calculated as:
where the decision threshold (Threshold) is determined by accepted patient/clinician risk. 34 For example, a clinician may accept up to a 25% perceived risk of cancer before recommending biopsy to a patient, equating to a decision threshold of 0.25.
3. RESULTS
3.1. The ExoMeth development cohort
Linked methylation and transcriptomic data were available for 197 patients within the Movember GAP1 cohort, with the majority originating from the NNUH and forming the ExoMeth development cohort (Table 1). The proportion of Gleason ≥7 disease in the ExoMeth cohort was 49%.
Table 1.
Characteristics of the ExoMeth development cohort
| Biopsy negative | Biopsy positive | |
|---|---|---|
| Collection center, n (%) | ||
| NNUH | 68 (88) | 113 (94) |
| SJH | 9 (12) | 7 (6) |
| Age, years | ||
| Minimum | 42.00 | 53.00 |
| Median (IQR) | 66.00 (59.00, 71.00) | 69.50 (65.00, 76.00) |
| Mean (SD) | 65.70 ± 8.53 | 69.97 ± 7.44 |
| Maximum | 82.00 | 86.00 |
| Serum PSA, ng/mL | ||
| Minimum | 0.20 | 3.60 |
| Median (IQR) | 6.70 (4.20, 8.80) | 10.05 (6.90, 18.20) |
| Mean (SD) | 7.44 ± 5.59 | 17.50 ± 18.82 |
| Maximum | 30.30 | 95.90 |
| Prostate size (DRE Estimate), n (%) | ||
| Small | 14 (18) | 12 (10) |
| Medium | 29 (38) | 56 (47) |
| Large | 22 (29) | 37 (31) |
| Unknown | 12 (16) | 15 (12) |
| Gleason score, n (%) | ||
| 0 | 77 (100) | N/A |
| 6 | N/A | 24 (20) |
| 3 + 4 | N/A | 42 (35) |
| 4 + 3 | N/A | 23 (19) |
| ≥8 | N/A | 31 (26) |
Abbreviations: IQR, interquartile range; NNUH, Norfolk and Norwich University Hospital; PSA, prostate‐specific antigen; SJH, St James's Hospital.
3.2. Feature selection and model development
Using a robust feature selection framework four models were produced in total; a clinical standard of care model using only clinical information (SoC, age and PSA), a model using only methylation data (Methylation, six genes), a model using only cf‐RNA information (ExoRNA, 12 gene probes) and the integrated model, deemed ExoMeth (16 variables) (Table 2). The ExoMeth model is a multivariable risk prediction model incorporating clinical, methylation and cf‐RNA variables. When the resampling strategy was applied for feature reduction using Boruta, 16 variables were selected for the ExoMeth model. Each of the retained variables was positively selected in every resample and notably included information from clinical, methylation, and cf‐RNA variables (Figure 1). Full resample‐derived Boruta variable importances for the SoC, Methylation, and ExoRNA comparator models can be seen in Figures S1 to S3, respectively.
Table 2.
Boruta‐derived features positively selected for each model
| Models | ||||
|---|---|---|---|---|
| SoC | Methylation | ExoRNA | ExoMeth | |
| Clinical parameters | Serum PSA | ⋯ | ⋯ | Serum PSA |
| Age | ⋯ | ⋯ | ⋯ | |
| Methylation targets | ⋯ | GSTP1 | ⋯ | GSTP1 |
| ⋯ | APC | ⋯ | APC | |
| ⋯ | SFRP2 | ⋯ | SFRP2 | |
| ⋯ | IGFBP3 | ⋯ | IGFBP3 | |
| ⋯ | IGFBP7 | ⋯ | IGFBP7 | |
| ⋯ | PTGS2 | ⋯ | PTGS2 | |
| Transcript targets | ⋯ | ⋯ | AMACR | ⋯ |
| ⋯ | ⋯ | ERG exons 4‐5 | ERG exons 4‐5 | |
| ⋯ | ⋯ | ERG exons 6‐7 | ERG exons 6‐7 | |
| ⋯ | ⋯ | GJB1 | GJB1 | |
| ⋯ | ⋯ | HOXC6 | HOXC6 | |
| ⋯ | ⋯ | HPN | HPN | |
| ⋯ | ⋯ | PCA3 | PCA3 | |
| ⋯ | ⋯ | PPFIA2 | ⋯ | |
| ⋯ | ⋯ | RPS10 | ⋯ | |
| ⋯ | ⋯ | SNORA20 | SNORA20 | |
| ⋯ | ⋯ | TIMP4 | TIMP4 | |
| ⋯ | ⋯ | TMPRSS2/ERG fusion | TMPRSS2/ERG fusion | |
Note: Features are selected for each model by being confirmed as important for predicting biopsy outcome, categorized as a modified ordinal variable (see Section 2) by Boruta in ≥90% of bootstrap resamples. Variables selected for the fully integrated model (ExoMeth) are in the highlighted column; for example, age is selected within the standard of care (SoC) model, but not in ExoMeth.
Figure 1.
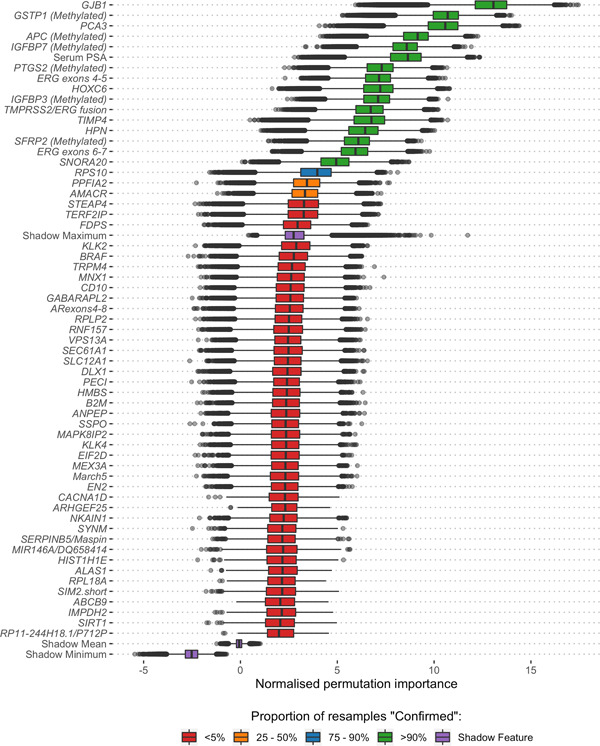
Boruta analysis of variables available for the training of the ExoMeth model. Variable importance was determined over 1000 bootstrap resamples of the available data and the decision reached recorded at each resample. Color indicates the proportion of the 1000 resamples a variable was confirmed to be important in. Variables confirmed in at least 90% of resamples were selected for predictive modeling. Those variables rejected in every single resample are not shown here, but the full list of inputs for all models can be seen in Table S1 [Color figure can be viewed at wileyonlinelibrary.com]
In the SoC comparator model, only PSA and age were selected as important predictors. All methylation probes were selected as important in both the independent Methylation model and the ExoMeth models (Table 2). Twelve NanoString gene‐probes were selected for the NanoString model, notably containing both variants of the ERG gene probe and TMPRSS2/ERG fusion gene probe, alongside PCA3. All features within the ExoMeth model were also selected in one of the comparator models.
3.3. ExoMeth predictive ability
As ExoMeth Risk Score (range, 0‐1) increased, the likelihood of the high‐grade disease being detected on biopsy was significantly greater (proportional odds ratio = 2.04 per 0.1 ExoMeth increase, 95% CI: 1.78‐2.35; ordinal logistic regression; Figure 2). The median ExoMeth risk score was 0.83 for metastatic patients (n = 10). These were excluded from model training and can be considered as a positive control. One metastatic sample had a lower than expected ExoMeth score of 0.55: where no methylation was quantified for this sample, which may reflect a technical failure of the sample.
Figure 2.
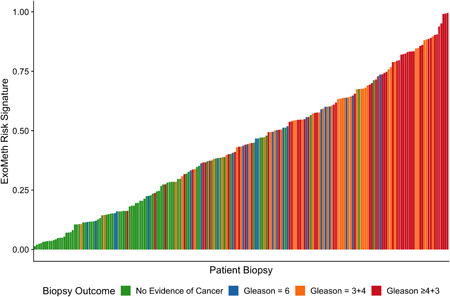
Waterfall plot of the ExoMeth risk score for each patient. Each colored bar represents an individual patient's calculated risk score and their true biopsy outcome, colored according to Gleason score (Gs). Green: No evidence of cancer, Blue: Gs 6, Orange: Gs 3 + 4, and Red: Gs ≥4 + 3 [Color figure can be viewed at wileyonlinelibrary.com]
ExoMeth was superior to all other models, returning an AUC of 0.89 (95% CI: 0.84‐0.93) for Gleason ≥3 + 4 and 0.81 (95% CI: 0.75‐0.87) for Gleason≥4 + 3 (Table 3). As revealed by the distributions of risk scores and AUC, ExoMeth achieved better discrimination of Gleason ≥3 + 4 disease from other outcomes when compared to any of the other models (ExoMeth all P < .01 bootstrap test, 1000 resamples; Figure 3). The SoC model, while returning respectable AUCs, would misclassify more men with the indolent disease as warranting further investigation than all other models (Figure 3A), for example, to classify 90% of Gleason 7 men correctly, an SoC risk score of 0.237 would also misclassify 65% of men with less significant disease. The Methylation comparator model improves upon SoC, by drawing the risk score distribution of Gs <7 men into a more pronounced peak but featured a bimodal risk score distribution extending to higher‐risk men; almost 50% of men with Gs ≥3 + 4 have risk scores equal to benign patients (Figure 3B). The opposite occurred in the NanoString comparator model exhibited a broad bimodal distribution for lower‐risk men (Figure 3C). This discriminatory ability of the ExoMeth model over all comparators was improved when biopsy outcomes are considered as biopsy negative, Gleason 6 or 3 + 4, or Gleason ≥4 + 3 (Figure S4).
Table 3.
AUC of all trained models for detecting outcomes of an initial biopsy for varying clinically significant thresholds
| Initial biopsy outcome | SoC | Methylation | ExoRNA | ExoMeth |
|---|---|---|---|---|
| Gleason ≥4+3 | 0.75 (0.67‐0.82) | 0.77 (0.68‐0.85) | 0.74 (0.66‐0.81) | 0.81 (0.75‐0.87) |
| Gleason ≥3+4 | 0.73 (0.65‐0.79) | 0.78 (0.71‐0.84) | 0.81 (0.75‐0.87) | 0.89 (0.84‐0.93) |
| Any cancer | 0.70 (0.62‐0.77) | 0.73 (0.66‐0.79) | 0.86 (0.81‐0.91) | 0.91 (0.87‐0.95) |
Note: Brackets show 95% confidence intervals of the AUC, calculated from 1000 stratified bootstrap resamples. Input variables for each model are detailed in Supporting information Table S1. The full list of variables in each model is available in Table 1. Bold values are the AUC.
Abbreviations: AUC, Area under the receiver‐operator characteristic curve; SoC, standard of care.
Figure 3.
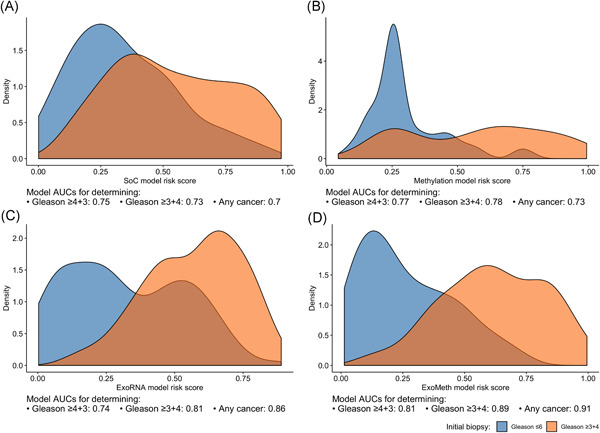
Density plots detailing risk score distributions generated from four trained models. Models A to D were trained with different input variables; A, SoC clinical risk model, including age and PSA; B, Methylation model; C, ExoRNA model; D, ExoMeth model, combining the predictors from all three previous models. The full list of variables in each model is available in Table 2. Fill color shows the risk score distribution of patients with a significant biopsy outcome of Gleason score (Gs) ≥3 + 4 (Orange) or Gs ≤ 6 (Blue). AUC, area under the receiver‐operator characteristic curve; PSA, prostate‐specific antigen; SoC, standard of care [Color figure can be viewed at wileyonlinelibrary.com]
Resampling of ExoMeth predictions via estimation plots allowed for comparisons of mean ExoMeth signatures between groups (1000 bias‐corrected and accelerated bootstrap resamples; Figure 4). The mean ExoMeth differences between patients with no evidence of cancer were: Gleason 6 = 0.22 (95% CI: 0.14‐0.30), Gleason 3 + 4 = 0.36 (95% CI: 0.28‐0.42), and Gleason ≥4 + 3 = 0.44 (95% CI: 0.37‐0.51). Notably, there were no differences in ExoMeth risk signatures of patients with a raised PSA but negative for cancer on biopsy and men with no evidence of cancer (mean difference = 0.03, 95% CI: 0.05‐0.10; Figures 4 and S5).
Figure 4.
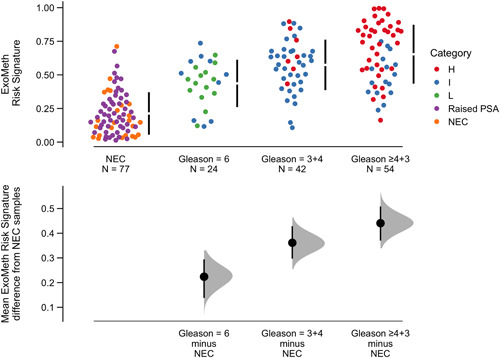
Cumming estimation plot of the ExoMeth risk signature. The top row details individual patients as points, separated according to the Gleason score on the x‐axis and risk score on the y‐axis. Points are colored according to D'Amico clinical risk category. Gapped vertical lines detail the mean and standard deviation of each group's risk scores. The lower panel shows the mean differences in risk score of each group, as compared to the NEC samples. Mean differences and 95% confidence interval are displayed as a point estimate and vertical bar respectively, using the sample density distributions calculated from a bias‐corrected and accelerated bootstrap analysis from 1000 resamples. H, D'Amico high risk; I, D'Amico intermediate‐risk; L, D'Amico low risk; NEC, no evidence of cancer; PSA, prostate‐specific antigen; raised PSA, raised PSA with negative biopsy [Color figure can be viewed at wileyonlinelibrary.com]
Decision curve analysis examined the net benefit of adopting ExoMeth in a population of patients suspected with prostate cancer and to have a PSA level suitable to trigger biopsy (≥4 ng/mL). The biopsy of men based upon their ExoMeth risk score consistently provided a net benefit over current standards of care across all decision thresholds examined and was the most consistent amongst all comparator models across a range of clinically relevant endpoints for biopsy (Figure 5). Of the patients with Gs ≥7 disease, 95% had an ExoMeth risk score of 0.283 or higher. At a decision threshold of 0.25, ExoMeth could result in up to 66% fewer unnecessary biopsies of men presenting with a suspicion of prostate cancer, without missing substantial numbers of men with aggressive disease, while if Gleason ≥4 + 3 were considered the threshold of clinical significance, the same decision threshold of 0.25 could save 79% of men from receiving an unnecessary biopsy (Figure 6).
Figure 5.
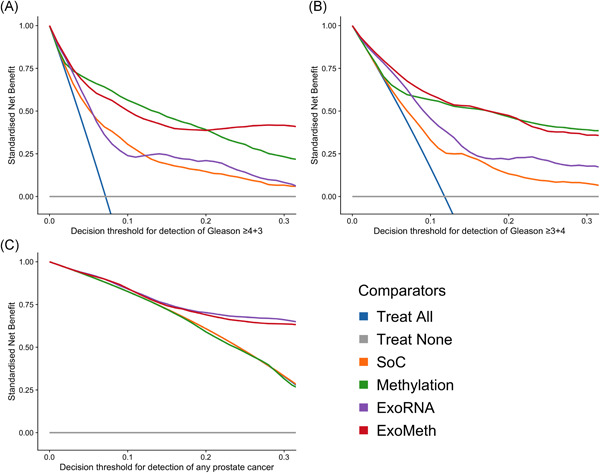
Decision curve analysis (DCA) plots detailing the standardized net benefit (sNB) of adopting different risk models for aiding the decision to biopsy patients who present with a PSA 4 ng/mL or more. The x‐axis details the range of risk a clinician or patient may accept before deciding to biopsy. Panels show the sNB based upon the detection of varying levels of disease severity: A, detection of Gleason ≥4 + 3; B, detection of Gleason ≥3 + 4; C, any cancer; Blue: biopsy all patients with a PSA greater than 4 ng/mL; Orange: biopsy patients according to the SoC model; Green: biopsy patients based on the Methylation model; Purple: biopsy patients based on the ExoRNA model; Red: biopsy patients based on a the ExoMeth model. To assess the benefit of adopting these risk models in a non‐PSA screened population we used data available from the control arm of the Cluster‐Randomised Trial of PSA Testing for Prostate Cancer (CAP) study. 5 DCA curves were calculated from 1000 bootstrap resamples of the available data to match the distribution of disease reported in the CAP trial population. Mean sNB from these resampled DCA results are plotted here. See Section 2 for full details [Color figure can be viewed at wileyonlinelibrary.com]
Figure 6.
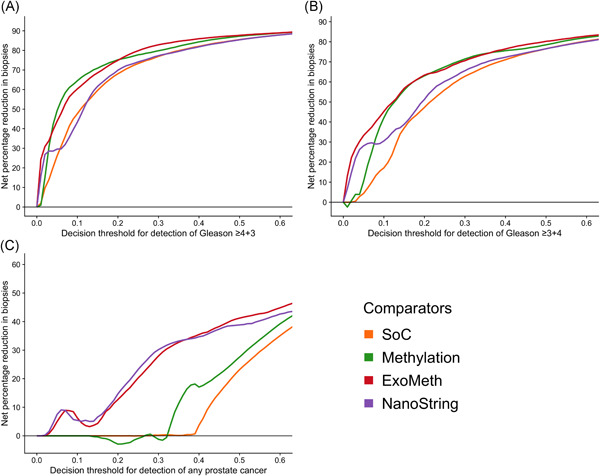
Net percentage reduction in biopsies, as calculated by decision curve analysis (DCA) measuring the benefit of adopting different risk models for aiding the decision to biopsy patients who would otherwise undergo biopsy by current clinical guidelines. The x‐axis details the range of accepted risk a clinician or patient may accept before deciding to biopsy. Panels show the percentage reduction in biopsies based upon the detection of varying levels of disease severity: A, detection of Gleason ≥4 + 3; B, detection of Gleason ≥3 + 4; C, any cancer. Colored lines show differing comparator models; Blue: biopsy all patients with a PSA greater than 3 ng/mL; Orange: biopsy patients by according the to the SoC model; Green: biopsy patients based on the Methylation model; Purple: biopsy patients based on the ExoRNA model; Red: biopsy patients based on a the ExoMeth model. To assess the benefit of adopting these risk models in a non‐PSA screened population we used data available from the control arm of the Cluster‐Randomised Trial of PSA Testing for Prostate Cancer (CAP) study. 5 DCA curves were calculated from 1000 bootstrap resamples of the available data to match the distribution of disease reported in the CAP trial population. Mean sNB from these resampled DCA results are used to calculate the potential reductions in biopsy rates shown here. See Section 2 for full details [Color figure can be viewed at wileyonlinelibrary.com]
4. DISCUSSION
The accurate discrimination of disease state in men before a confirmatory initial biopsy would mark a significant development and impact large numbers of men suspected of harboring prostate cancer. Up to 75% of men with a raised PSA (≥4 ng/mL) are negative for prostate cancer on biopsy. 4 , 5 , 37 This has resulted in concentrated research efforts to address this problem noninvasively and the development of several biomarker panels capable of detecting Gleason ≥3 + 4 disease with superior accuracy to current clinically implemented methods. 11 , 12 , 13 , 23 However, in each of these examples, only a single quantification method or biological process is assayed and with the molecular heterogeneity of prostate cancer considered, 38 a more holistic approach is necessary.
It is becoming apparent from published data that urine can contain a wealth of useful cancer biomarkers within RNA, DNA, cell‐free DNA, DNA methylation, and proteins. 14 , 22 , 23 , 39 , 40 However, the analyses presented here are, to the author's knowledge, the first attempt to integrate such biomarker information within the same samples for the detection of prostate cancer before biopsy. There has recently been reported that a combination of miRNA and methylation markers can be used to predict outcome following radical prostatectomy. 41 Our results show an improved diagnostic marker can be produced from the synergistic relationship of information derived from different urine fractions in men suspected to have prostate cancer. The methylation of six previously identified genes 22 was quantified via methylation‐specific qPCR, while the transcript levels of 167 cf‐RNAs were quantified using NanoString technology. The final model integrating this information with serum PSA levels was deemed ExoMeth. Markers selected for the model include well‐known genes associated with prostate cancer and proven in other diagnostic tests, such as HOXC6, 12 PCA3, 11 and the TMPRSS2/ERG gene fusion. 42 ExoMeth additionally incorporated GJB1 as the most important variable for predicting biopsy outcome. While GJB1 is known to be a prognostic marker for a favorable outcome in renal cancers, there is no current evidence of its use as a diagnostic biomarker in prostate cancer. 43 , 44
ExoMeth was able to correctly predict the presence of significant prostate cancer on biopsy with an AUC of 0.89, representing a significant uplift when compared to other published tests (AUCs for Gs ≥ 7: PUR = 0.77, 23 ProCUrE = 0.73, 14 ExoDX Prostate IntelliScore = 0.77, 13 SelectMDX = 0.78, 12 epiCaPture AUC = 0.73 [Gs ≥4 + 3] 22 ). Furthermore, ExoMeth resulted in accurate predictions even when serum PSA levels alone were inaccurate; where patients with a raised PSA but negative biopsy result possessed similar ExoMeth scores as clinically benign men, while still able to discriminate between Gleason grades (Figure 4). These are men that would be unnecessarily subjected to biopsy by current guidelines. Of the three patients with no evidence of cancer on biopsy with an ExoMeth risk score greater than 0.55, two were positive for the TMPRSS2/ERG fusion transcript in NanoString analyses (data not shown), implying that PCa may have been missed and re‐biopsy may be necessary. 45 Future prospective studies plan to utilize template biopsy and more detailed information about each biopsy core to account for the ambiguity in TRUS biopsy estimation of Gs.
While every step has been taken to robustly develop ExoMeth to minimize potential overfitting and bias through extensive bootstrap resampling and the use of out‐of‐bag predictions, ExoMeth nonetheless was developed on a small data set and requires validation in an independent cohort before its use a clinical marker can be considered. Additionally, as MP‐MRI can misrepresent disease state in patients, even when rigorous protocols are implemented 7 the clinical utility of supplementing MP‐MRI with ExoMeth needs to be assessed. For many men harboring indolent prostate cancer, ExoMeth could greatly impact their experience of prostate cancer care when compared to current clinical pathways.
THE MOVEMBER GAP1 URINE BIOMARKER CONSORTIUM
Bharati Bapat, Rob Bristow, Andreas Doll, Jeremy Clark, Colin Cooper, Hing Leung, Ian Mills, David Neal, Mireia Olivan, Hardev Pandha, Antoinette Perry, Chris Parker, Martin Sanda, Jack Schalken, and Hayley Whitaker.
CONFLICT OF INTERESTS
A patent application has been filed by the authors for the present work. The authors declare that there are no conflict of interests.
AUTHOR CONTRIBUTIONS
SPC drafted the manuscript and conceived, designed, and performed the statistical analyses. ER, AT, FZ, and BB were involved in sample collection and methylation analyses at their respective institutes. MW, RH, and RM were involved in sample collection and NanoString analyses as well as development of clinical methodologies. DSB, JC, ASP, and CSC had joint and equal contributions to senior authorship and were contributors in writing the manuscript. All authors read and approved the manuscript. All authors critiqued the manuscript for intellectual content.
ETHICAL STATEMENT
Sample collections and processing were ethically approved in their country of origin: Norfolk and Norwich University Hospital samples by the East of England Research Ethics Committee and Dublin samples by St James's Hospital.
Supporting information
Supporting information
Supporting information
ACKNOWLEDGMENTS
The research presented in this paper was carried out on the High‐Performance Computing Cluster supported by the Research and Specialist Computing Support service at the University of East Anglia. This study was possible, thanks to the Movember Foundation GAP1 Urine Biomarker project, The Masonic Charitable Foundation, The Bob Champion Cancer Trust, the King family, The Andy Ripley Memorial Fund, the Hargrave Foundation, US Prostate Cancer Foundation (Young Investigator Award, Antoinette S. Perry), Science Foundation Ireland (14/TIDA/2348), Royal Irish Academy (Cost‐sharing award, Antoinette S. Perry and Jeremy Clark), and the Irish Cancer Society (CRF09PER).
Connell SP, O'Reilly E, Tuzova A, et al. Development of a multivariable risk model integrating urinary cell DNA methylation and cell‐free RNA data for the detection of significant prostate cancer. The Prostate. 2020;80:547–558. 10.1002/pros.23968
Colin S. Cooper, Antoinette S. Perry, Jeremy Clark, and Daniel S. Brewer are joint senior authors.
Contributor Information
Shea P. Connell, Email: s.connell@uea.ac.uk.
Daniel S. Brewer, Email: d.brewer@uea.ac.uk.
DATA AVAILABILITY STATEMENT
All data and code required to quantitatively reproduce these analyses can be found at https://github.com/UEA‐Cancer‐Genetics‐Lab/ExoMeth. The repository has been set up with a binder instance for ease of use, requiring no local computation or installation of dependencies.
REFERENCES
- 1. Cancer Research UK. Prostate cancer incidence statistics. 2019. http://www.cancerresearchuk.org/health‐professional/cancer‐statistics/statistics‐by‐cancer‐type/prostate‐cancer/incidence. Accessed June 29, 2019.
- 2. Sanda MG, Cadeddu JA, Kirkby E, et al. Clinically localized prostate cancer: AUA/ASTRO/SUO Guideline. Part I: risk stratification, shared decision making, and care options. J Urol. 2018;199(3):683‐690. 10.1016/j.juro.2017.11.095 [DOI] [PubMed] [Google Scholar]
- 3. Cornford P, Bellmunt J, Bolla M, et al. EAU‐ESTRO‐SIOG Guidelines on Prostate Cancer. Part II: treatment of relapsing, metastatic, and castration‐resistant prostate cancer. Eur Urol. 2017;71(4):630‐642. 10.1016/j.eururo.2016.08.002 [DOI] [PubMed] [Google Scholar]
- 4.National Institute for Health and Care Excellence (NICE). Prostate cancer: diagnosis and management. 2019. https://www.nice.org.uk/guidance/indevelopment/gid‐ng10057. Accessed July 4, 2019. [PubMed]
- 5. Martin RM, Donovan JL, Turner EL, et al. Effect of a low‐intensity PSA‐based screening intervention on prostate cancer mortality: The CAP randomized clinical trial. JAMA. 2018;319(9):883‐895. 10.1001/jama.2018.0154 [DOI] [PMC free article] [PubMed] [Google Scholar]
- 6. Donovan JL, Hamdy FC, Lane JA, et al. Patient‐reported outcomes after monitoring, surgery, or radiotherapy for prostate cancer. N Engl J Med. 2016;375(15):1425‐1437. 10.1056/NEJMoa1606221 [DOI] [PMC free article] [PubMed] [Google Scholar]
- 7. Ahmed HU, El‐Shater Bosaily A, Brown LC, et al. Diagnostic accuracy of multi‐parametric MRI and TRUS biopsy in prostate cancer (PROMIS): a paired validating confirmatory study. The Lancet. 2017;389(10071):815‐822. 10.1016/S0140-6736(16)32401-1 [DOI] [PubMed] [Google Scholar]
- 8. Pepe P, Pennisi M. Gleason score stratification according to age at diagnosis in 1028 men. Wspolczesna Onkologia. 2015;19(6):471‐473. 10.5114/wo.2015.56654 [DOI] [PMC free article] [PubMed] [Google Scholar]
- 9. Sonn GA, Fan RE, Ghanouni P, et al. Prostate magnetic resonance imaging interpretation varies substantially across radiologists. Eur Urol Focus. 2019;5:592‐599. 10.1016/j.euf.2017.11.010 [DOI] [PubMed] [Google Scholar]
- 10. Walz J. The “PROMIS” of magnetic resonance imaging cost effectiveness in prostate cancer diagnosis? Eur Urol. 2018;73(1):31‐32. 10.1016/j.eururo.2017.09.015 [DOI] [PubMed] [Google Scholar]
- 11. Hessels D, Klein Gunnewiek JMT, van Oort I, et al. DD3PCA3‐based molecular urine analysis for the diagnosis of prostate cancer. Eur Urol. 2003;44(1):8‐16. 10.1016/S0302-2838(03)00201-X [DOI] [PubMed] [Google Scholar]
- 12. van Neste L, Hendriks RJ, Dijkstra S, et al. Detection of high‐grade prostate cancer using a urinary molecular biomarker–based risk score. Eur Urol. 2016;70(5):740‐748. 10.1016/j.eururo.2016.04.012 [DOI] [PubMed] [Google Scholar]
- 13. McKiernan J, Donovan MJ, O'Neill V, et al. A novel urine exosome gene expression assay to predict high‐grade prostate cancer at initial biopsy. JAMA Oncol. 2016;2(7):882‐889. 10.1001/jamaoncol.2016.0097 [DOI] [PubMed] [Google Scholar]
- 14. Zhao F, Olkhov‐Mitsel E, Kamdar S, et al. A urine‐based DNA methylation assay, ProCUrE, to identify clinically significant prostate cancer. Clin Epigenetics. 2018;10(1):147 10.1186/s13148-018-0575-z [DOI] [PMC free article] [PubMed] [Google Scholar]
- 15. Brikun I, Nusskern D, Decatus A, Harvey E, Li L, Freije D. A panel of DNA methylation markers for the detection of prostate cancer from FV and DRE urine DNA. Clin Epigenetics. 2018;10(1):91 10.1186/s13148-018-0524-x [DOI] [PMC free article] [PubMed] [Google Scholar]
- 16. Luca BA, Brewer DS, Edwards DR, et al. DESNT: a poor prognosis category of human prostate cancer. Eur Urol Focus. 2018;4:842‐850. 10.1016/j.euf.2017.01.016 [DOI] [PMC free article] [PubMed] [Google Scholar]
- 17. Knezevic D, Goddard AD, Natraj N, et al. Analytical validation of the oncotype DX prostate cancer assay—a clinical RT‐PCR assay optimized for prostate needle biopsies. BMC Genomics. 2013;14(1):690 10.1186/1471-2164-14-690 [DOI] [PMC free article] [PubMed] [Google Scholar]
- 18. Cuzick J, Berney DM, Fisher G, et al. Prognostic value of a cell cycle progression signature for prostate cancer death in a conservatively managed needle biopsy cohort. Br J Cancer. 2012;106(6):1095‐1099. 10.1038/bjc.2012.39 [DOI] [PMC free article] [PubMed] [Google Scholar]
- 19. Eklund M, Nordström T, Aly M, et al. The Stockholm‐3 (STHLM3) model can improve prostate cancer diagnostics in men aged 50‐69 yr compared with current prostate cancer testing. Eur Urol Focus. 2016;3:4‐7. 10.1016/j.euf.2016.10.009 [DOI] [PubMed] [Google Scholar]
- 20. Tosoian JJ, Carter HB, Lepor A, Loeb S. Active surveillance for prostate cancer: current evidence and contemporary state of practice. Nat Rev Urol. 2016;13:205‐215. 10.1038/nrurol.2016.45 [DOI] [PMC free article] [PubMed] [Google Scholar]
- 21. Loeb S, Bjurlin MA, Nicholson J, et al. Overdiagnosis and overtreatment of prostate cancer. Eur Urol. 2014;65:1046‐1055. 10.1016/j.eururo.2013.12.062 [DOI] [PMC free article] [PubMed] [Google Scholar]
- 22. O'Reilly E, Tuzova AV, Walsh AL, et al. epiCaPture: a urine DNA methylation test for early detection of aggressive prostate cancer. JCO Precision Oncology. 2019;3:1‐18. 10.1200/PO.18.00134 [DOI] [PMC free article] [PubMed] [Google Scholar]
- 23. Connell SP, Yazbek‐Hanna M, McCarthy F, et al. A four‐group urine risk classifier for predicting outcome in prostate cancer patients. BJU Int. 2019;124:609‐620. 10.1111/bju.14811 [DOI] [PMC free article] [PubMed] [Google Scholar]
- 24. Stark JR, Perner S, Stampfer MJ, et al. Gleason score and lethal prostate cancer: Does 3 + 4 = 4 + 3? J Clin Oncol. 2009;27(21):3459‐3464. 10.1200/JCO.2008.20.4669 [DOI] [PMC free article] [PubMed] [Google Scholar]
- 25. Collins GS, Reitsma JB, Altman DG, Moons KG. Transparent reporting of a multivariable prediction model for individual prognosis or diagnosis (TRIPOD): The TRIPOD statement. Eur Urol. 2015;67(6):1142‐1151. 10.1016/j.eururo.2014.11.025 [DOI] [PubMed] [Google Scholar]
- 26. R Core Team . R: A Language and Environment for Statistical Computing. 2019. https://www.r‐project.org/. Accessed November 12, 2019.
- 27. Guyon I, Elisseeff A. An introduction to variable and feature selection. J Mach Learn Res. 2003;3:1157‐1182. [Google Scholar]
- 28. Kursa MB, Rudnicki WR. Feature Selection with the Boruta Package. J Stat Softw. 2010;36(11):1‐13. [Google Scholar]
- 29. Breiman L. Random forests. Mach Learn. 2001;45(1):5‐32. 10.1023/A:1010933404324 [DOI] [Google Scholar]
- 30. Liaw A, Wiener M. Classification and regression by randomForest. R News. 2002;2(3):18‐22. https://CRAN.R‐project.org/doc/Rnews/ [Google Scholar]
- 31. Robin X, Turck N, Hainard A, et al. pROC: an open‐source package for R and S+ to analyze and compare ROC curves. BMC Bioinformatics. 2011;12:77. [DOI] [PMC free article] [PubMed] [Google Scholar]
- 32. Wickham H. Ggplot2: Elegant Graphics for Data Analysis. New York, NY: Springer‐Verlag; 2016. https://ggplot2.tidyverse.org [Google Scholar]
- 33. Ho J, Tumkaya T, Aryal S, Choi H, Claridge‐Chang A. Moving beyond P values: data analysis with estimation graphics. Nat Methods. 2019;16:565‐566. 10.1038/s41592-019-0470-3 [DOI] [PubMed] [Google Scholar]
- 34. Vickers AJ, Elkin EB. Decision curve analysis: a novel method for evaluating prediction models. Med Decis Making. 2006;26(6):565‐574. 10.1177/0272989X06295361 [DOI] [PMC free article] [PubMed] [Google Scholar]
- 35. Brown M rmda: risk model decision analysis. 2018. https://cran.r‐project.org/package=rmda. Accessed January 31, 2019.
- 36. Kerr KF, Brown MD, Zhu K, Janes H. Assessing the clinical impact of risk prediction models with decision curves: guidance for correct interpretation and appropriate use. J Clin Oncol. 2016;34(21):2534‐2540. 10.1200/JCO.2015.65.5654 [DOI] [PMC free article] [PubMed] [Google Scholar]
- 37. Lane JA, Donovan JL, Davis M, et al. Active monitoring, radical prostatectomy, or radiotherapy for localised prostate cancer: study design and diagnostic and baseline results of the ProtecT Randomised Phase 3 Trial. Lancet Oncol. 2014;15(10):1109‐1118. 10.1016/S1470-2045(14)70361-4 [DOI] [PubMed] [Google Scholar]
- 38. Ciccarese C, Massari F, Iacovelli R, et al. Prostate cancer heterogeneity: discovering novel molecular targets for therapy. Cancer Treat Rev. 2017;54:68‐73. 10.1016/j.ctrv.2017.02.001 [DOI] [PubMed] [Google Scholar]
- 39. Xia Y, Huang C‐C, Dittmar R, et al. Copy number variations in urine cell free DNA as biomarkers in advanced prostate cancer. Oncotarget. 2016;7(24):35818‐35831. 10.18632/oncotarget.9027 [DOI] [PMC free article] [PubMed] [Google Scholar]
- 40. Killick E, Morgan R, Launchbury F, et al. Role of engrailed‐2 (EN2) as a prostate cancer detection biomarker in genetically high risk men. Sci Rep. 2013;3:2059 10.1038/srep02059 [DOI] [PMC free article] [PubMed] [Google Scholar]
- 41. Strand SH, Bavafaye‐Haghighi E, Kristensen H, et al. A novel combined miRNA and methylation marker panel (miMe) for prediction of prostate cancer outcome after radical prostatectomy. Int J Cancer. 2019;145:32427‐33452. 10.1002/ijc.32427 [DOI] [PubMed] [Google Scholar]
- 42. Tomlins SA, Day JR, Lonigro RJ, et al. Urine TMPRSS2:ERG Plus PCA3 for individualized prostate cancer risk assessment. Eur Urol. 2016;70(1):45‐53. 10.1016/j.eururo.2015.04.039 [DOI] [PMC free article] [PubMed] [Google Scholar]
- 43. Ricketts CJ, de Cubas AA, Fan H, et al. The Cancer Genome Atlas comprehensive molecular characterization of renal cell carcinoma. Cell Rep. 2018;23(1):313‐326.e5. 10.1016/j.celrep.2018.03.075 [DOI] [PMC free article] [PubMed] [Google Scholar]
- 44.The Human Protein Atlas. Expression of GJB1 in cancer. https://www.proteinatlas.org/ENSG00000169562‐GJB1/pathology. Accessed May 24, 2019.
- 45. Tomlins SA, Laxman B, Varambally S, et al. Role of the TMPRSS2‐ERG gene fusion in prostate cancer. Neoplasia. 2008;10(2):177‐188. 10.1593/neo.07822 [DOI] [PMC free article] [PubMed] [Google Scholar]
Associated Data
This section collects any data citations, data availability statements, or supplementary materials included in this article.
Supplementary Materials
Supporting information
Supporting information
Data Availability Statement
All data and code required to quantitatively reproduce these analyses can be found at https://github.com/UEA‐Cancer‐Genetics‐Lab/ExoMeth. The repository has been set up with a binder instance for ease of use, requiring no local computation or installation of dependencies.