

Abstract
Of the four primary subgroups of medulloblastoma, the most frequent cytogenetic abnormality, i17q, distinguishes Groups 3 and 4 which carry the highest mortality; haploinsufficiency of 17p13.3 is a marker for particularly poor prognosis. At the terminal end of this locus lies miR‐1253, a brain‐enriched microRNA that regulates bone morphogenic proteins during cerebellar development. We hypothesized miR‐1253 confers novel tumor‐suppressive properties in medulloblastoma. Using two different cohorts of medulloblastoma samples, we first studied the expression and methylation profiles of miR‐1253. We then explored the anti‐tumorigenic properties of miR‐1253, in parallel with a biochemical analysis of apoptosis and proliferation, and isolated oncogenic targets using high‐throughput screening. Deregulation of miR‐1253 expression was noted, both in medulloblastoma clinical samples and cell lines, by epigenetic silencing via hypermethylation; specific de‐methylation of miR‐1253 not only resulted in rapid recovery of expression but also a sharp decline in tumor cell proliferation and target gene expression. Expression restoration also led to a reduction in tumor cell virulence, concomitant with activation of apoptotic pathways, cell cycle arrest and reduction of markers of proliferation. We identified two oncogenic targets of miR‐1253, CDK6 and CD276, whose silencing replicated the negative trophic effects of miR‐1253. These data reveal novel tumor‐suppressive properties for miR‐1253, i.e., (i) loss of expression via epigenetic silencing; (ii) negative trophic effects on tumor aggressiveness; and (iii) downregulation of oncogenic targets.
Keywords: CD276, CDK6, chromosome 17p13.3, group 3 medulloblastoma, miR‐1253
Abbreviations
- 3′UTR
3′ untranslated region
- 5‐AzaC
5‐Aza‐2′‐deoxycytidine
- ABC
ATP binding cassette
- AKT
protein kinase B
- ALX4
homeobox protein aristaless‐like 4
- ANOVA
analysis of variance
- Bcl‐2
B‐cell lymphoma 2
- BMP
bone morphogenic protein
- CAR(T)
chimeric antigen receptor T
- CB
cerebellum
- CCND1
cyclin D1
- CD276
cluster of differentiation 276 (B7‐H3)
- CDK4
cyclin‐dependent kinase 4
- CDK6
cyclin‐dependent kinase 6
- EGL
extracellular granule layer
- EMT
epithelial‐mesenchymal transition
- FACs
fluorescence‐activated cell sorting
- FISH
fluorescence in situ hybridization
- GCP
granule cell precursor
- IHC
immunohistochemistry
- i(17q)
isochromosome 17q
- JAK2
Janus kinase 2
- miR
microRNA
- miR‐1253
microRNA 1253
- MB
medulloblastoma
- MDR
multiple drug resistance
- MMP‐2
matrix metalloproteinase‐2
- MMP‐9
matrix metalloproteinase‐9
- Nl
normal
- Non‐SHH/WNT
non‐sonic hedgehog/non‐wingless
- NSCLC
non‐small cell lung cancer
- pAKT
phosphorylated protein kinase B
- PARP
poly ADP ribose polymerase
- PCR
polymerase chain reaction
- Ped
pediatric
- PI3K
phosphoinositide 3‐kinase
- RNA
ribonucleic acid
- si‐CD276
silencing‐CD276
- si‐CDK6
silencing‐CDK6
- SHH
sonic hedgehog
- SCP1
small C‐terminal domain phosphatase 1
- SD
standard deviation
- STAT3
signal transducer and activator of transcription 3
- TGIF2
TGFB induced factor homeobox 2
- VEGF
vascular endothelial growth factor
- WHO
World Health Organization
- WNT
wingless
INTRODUCTION
Medulloblastoma (MB), an embryonal neuroepithelial tumor, is the most common malignant brain tumor of childhood, accounting for 20% of all intracranial tumors and up to 40% of all posterior fossa tumors (43). International consensus recognizes four major molecular subgroups of medulloblastoma: WNT (wingless), SHH (sonic hedgehog), Group 3 and Group 4, each with distinct cytogenetics, mutational and transcriptomic signatures and clinical outcomes (38, 41). However, these primary subgroups can be further subdivided into at least 12 subtypes based on unique molecular and clinical features influencing overall risk and survivability (7).
Despite the molecular heterogeneity amongst subgroups, with WNT and SHH being discrete and groups 3 and 4 sharing molecular and biological similarities, the WHO currently classifies the latter two provisionally as non‐SHH/WNT medulloblastomas (27). These two subgroups not only share shorter 5‐year survival fueled by high rates of metastasis at diagnosis and recurrence but also characteristic aberrations of chromosome 17 (3, 10, 19, 35, 39, 41, 48). Haploinsufficiency of 17p13.3 has been reported in up to 50% of non‐SHH/WNT MB cases and has been correlated with poor prognosis (4, 9, 13, 31). Chromosomal mapping and microdeletion studies of 17p13.3 have revealed a number of putative tumor suppressor genes on this locus, including 3 micro RNAs (Supporting Information Figure S1A). However, their role in the pathogenesis of non‐SHH/WNT MB remains unstudied.
MicroRNAs (miRNAs) negatively regulate gene expression by binding to the 3′‐ untranslated region (3′‐UTR) of target mRNAs (1). Over 70% of documented miRNAs have been detected within the developing brain, possessing the dichotomous capabilities of triggering and suppressing growth in a development‐regulated fashion. For instance, let‐7, an important player in embryonic neurogenesis, exerts an anti‐proliferative effect on glioblastoma cell growth (22). Similarly, miR‐124, a neuronal fate‐determinant miRNA, can suppress the small C‐terminal domain phosphatase 1 (SCP1) pathway, allowing for neuronal differentiation (46). In astrocytes, however, it can suppress and prevent the proliferation of glioblastoma and medulloblastoma cells by inhibiting the expression of CDK6 (37). MiR‐1253, which is found on the terminal end of 17p13.3, is not only brain enriched but plays a critical role in cerebellar development by regulating the expression of bone morphogenic proteins (BMPs) whose secretion encourages the proliferation of granule cell precursors (GCPs) that populate the developing external granule layer (EGL) (49).
Given the intimate involvement of miRNAs in growth and development, aberrant expression of miRNA has been associated with neoplasia. In fact, over 50% of miRNAs have been discovered in cancer‐related hotspots (52). To date, significant deregulation of miR‐1253 has been reported in non‐small cell lung carcinoma (NSCLC), osteosarcoma, pancreatic cancer and male breast cancer (18, 25, 34, 51). In NSCLC, low miR‐1253 expression was linked with advanced clinical stage and metastasis. Aside from poorer prognosis, patients with lower miR‐1253 expression suffered higher mortality (25). In SHH subgroup MB, putative oncogenic targets for miR‐1253 have been isolated, including ALX4 and TGIF2, which are known activators of cyclin D1 and c‐myc expression, both mediators of cell proliferation and known negative prognostic markers in medulloblastoma (21). Moreover, miR‐1253 was shown to regulate multiple drug resistance (MDR) in breast cancer by targeting the ABC drug transporter family of genes (2).
Taken together, these studies implicate a tumor‐suppressive role for miR‐1253 in these various cancers. However, its role in medulloblastoma remains unstudied. Epigenetic silencing of this gene could result in unopposed proliferative action of BMP’s, subsequently triggering a phenotypic transformation into medulloblastoma. Based on its position on 17p13.3, we hypothesized that miR‐1253 possesses novel tumor suppressor qualities in medulloblastoma.
MATERIALS AND METHODS
Human tissue samples
Frozen and formalin‐fixed paraffin‐embedded (FFPE) samples of normal cerebellar (17) and tumor specimens (38) were collected from the Children’s Hospital and Medical Center, Omaha and the University of Nebraska Medical Center after Institutional Review Board approval. Because of the exempt status of study, informed consent was not needed. All tumor samples were obtained from patients in the pediatric age group (WNT–1, SHH–7, Grp 3–9, Grp 4–14, unknown–7). Normal cerebellum specimens were obtained from both pediatric (12) and adult (5) patients at autopsy.
Cell lines
Human medulloblastoma cell lines, DAOY, D283 and D341, were purchased from ATCC (Manassas, VA); D425 and D556 were kind gifts from Darell Bigner (Duke University Medical Centre, Durham, NC); D458 was a kind gift from Rajeev Vibhakar (Children's Hospital Colorado, Aurora, CO); HDMB03 was a kind gift from Till Milde (Hopp Children’s Tumor Center, Heidelberg, Germany). Cell line genotyping was verified by methylation profiling (New York University) and short tandem repeat (STR) DNA profiling (UNMC).
Cell culture
DAOY, D283, D341, D425, D458 and D556 cell lines were maintained in DMEM supplemented with 10%–20% FBS and 100 µg/mL penicillin/streptomycin; HDMB03 cells were cultured in RPMI containing 10% FBS and 100 µg/mL penicillin/streptomycin. Untransformed Normal Human Astrocytes (NHA) were purchased from Lonza Bioscience (Walkersville, MD) and grown in ABM basal medium supplemented with growth factors (Lonza Biosciences). Cells were maintained in 95% humidity, 37°C, 5% CO2.
Reagents
MiR‐1253 mimic, inhibitor, and scramble negative control were purchased from ThermoFisher Scientific (mirVana™ miRNA Mimic, mirVana™ miR‐1253 Inhibitor, Mimic Negative Control, respectively). The appropriate silencing RNA was obtained from ThermoFisher Scientific for CDK6 (CDK6 Silencer™ Pre‐Designed siRNA), CD276 (CD276 Silencer™ Pre‐Designed siRNA), and control (Silencer™ Negative Control).
MicroRNA quantification
Total RNA was reverse transcribed with stem‐loop primers specific for miR‐1253 (Applied Biosystem) and the internal control RNA U6B (Applied Biosystem) using the TaqMan™ microRNA Reverse Transcription Kit (Applied Biosystem) following the manufacturer’s protocol. All polymerase chain reaction (PCR) experiments were performed in a One‐step Real‐time PCR System (Applied Biosystems). The level of miR‐1253 was quantified and normalized to RNU6B using the delta‐delta Ct method.
Functional in vitro studies
Medulloblastoma cells were transfected using Lipofectamine 2000 (Invitrogen). Briefly, cells at a density of 1 × 10⁶ were seeded in 6‐well plates for 24 h and subsequently serum‐starved for 4 h prior to transfection. Cells were transfected with miR‐1253 mimic or inhibitor (50 vs. 100 nM) or scramble control (50 nM) with Lipofectamine for 24 h. Assays were performed after reseeding cells in complete media at 24–72 h. Hereafter, cell viability, wound healing, migration, proliferation and colony‐formation assays were performed based on manufacturer recommendations.
Cell proliferation assay
Cell proliferation was determined using MTT [3‐(4, 5‐dimethylthiazol‐2‐yl)‐2, 5‐diphenyl‐ 2H‐tetrazolium bromide] in DAOY, D283, D341 and HDMB03 and WST‐1 in D425. Assays were performed 24–72 h after transfection. Absorbance was measured using a microplate reader at 570 nm (MTT assay) and 440 nm (WST‐1 assay); data were analyzed using the SOFTMAX PRO software (Molecular Devices Corp., Sunnyvale, CA, USA). Assays were performed in triplicates.
Colony formation assay
Transfected cells were reseeded in triplicates at a density of 1000 cells/well in 6‐well plates. Cells were grown for 7–10 days in a humidified atmosphere (95% humidity) at 37°C and 5% CO2. Cells were washed, fixed with 2.5% methanol and stained with 0.5% crystal violet. Stain was extracted using 10% acetic acid and absorbance was quantified at 590 nm. Cell counts were measured from 2 wells per assay done in triplicates.
Cell migration and invasion
Transfected cells were reseeded at a density of 5 × 10⁵ cells in the upper chamber of an insert (8‐mm pore size; BD Bioscience) coated with either Fibronectin (BD Bioscience) or Matrigel (Invasion Chamber Matrigel Matrix); media containing 10% FBS (chemoattractant) was added to the lower chamber. After overnight incubation (16 hours), migrated/invaded cells in the lower chamber were stained (Diff‐Quik Stain Set, Siemens Healthcare Diagnostics, Inc., Newark, DE) and quantitated. Images were captured and counted using an EVOS FL Auto Imaging System at 10× magnification (EVOS FL Auto, Life Technologies). Cell counts were measured from 3 wells per assay done in triplicates.
Wound healing
Transfected cells were plated in triplicates in a 6‐well plate at a density of 1 × 10⁶ cells/well. Cells were grown to 80% confluency and a vertical scratch was made using a 200 µL pipette tip. Cells were incubated in a growth medium containing 5% serum. The wound area was quantified at 24 and 48 h after transfection, using an EVOS FL Auto Imaging System at 10× magnification (EVOS FL Auto, Life Technologies). Percent wound closure was determined by taking 3 measurements per scratch in assays done in triplicates.
Annexin V‐FITC/PI analysis
Apoptosis and cell cycle were measured by Annexin‐V/Cy™5 (BD Biosciences) and propidium iodide (Roche Diagnostics) staining as per manufacturer’s protocol. Briefly, cells were transfected with miR‐1253 mimic or scramble control for 96 h. Cells were then harvested, washed, resuspended in calcium‐binding buffer and double‐stained with Annexin‐V/Cy™5 and propidium iodide (for apoptosis) or fixed with 70% ethanol and single stained with propidium iodide (for cell cycle analysis). Cells were analyzed using a FACS Canto™ flow cytometer (BD Bioscience).
Western blotting
For apoptosis, the following 1° antibodies were used: PARP, Cleaved PARP, Cleaved Caspase‐3, Caspase‐3, and Bcl‐2 (Cell Signaling Technologies); for proliferation: cyclin D1, CDK4, CDK6, pAkt‐ser473 (Cell Signaling Technologies) and total Akt (Santa Cruz Biotechnology). Membranes were incubated with corresponding anti‐rabbit or anti‐mouse IgG conjugated with horseradish peroxidase (HRP) secondary antibody (1:5000; Invitrogen). Proteins were visualized using ECL reagents (Thermofisher).
Dual‐luciferase reporter assay
Primers for wild‐type 3′UTR CDK6 (forward: 5′‐TCTTCATTCACACCGAGTAGTGC‐3′ and reverse: 5′‐TGAGGTTAGAGCCATCTGGAAA‐3′) and CD276 (forward: 5′‐CTGGCTTTCGTGTGCTGGAGAA‐3′ and reverse: 5′‐GCTGTCAGAGTGTTTCAGAGGC‐3′) were designed (https://www.ncbi.nlm.nih.gov/tools/primer-blast/) and purchased (Eurofins); β‐actin served as the internal control (forward: 5′‐CACCATTGGCAATGAGCGGTTC‐3′ and reverse: 5′‐AGGTCTTTGCGGATGTCCACGT‐3′). Mutations were created within the seed sequence of CDK6 and CD276. Wildtype and mutant 3′UTR genes were PCR‐amplified and inserted into the XbaI restriction site of pGL3‐control vector (Promega). A reporter assay was performed using HDMB03 cells seeded at a density of 3 × 10⁵ cells/well in 12‐well plates. Cells were co‐transfected with pRL‐TK plasmid (Promega), as the internal control, and miR‐1253 mimic or scramble control for 48 h. Luciferase activity was then measured using the Dual‐Luciferase Reporter Assay System with a Luminometer (Biotek). Firefly luciferase activity was normalized to Renilla luciferase activity for each transfected‐cell sample.
Target prediction
In silico analysis of putative miR‐1253 targets employed miRNA target databases, i.e., Targetscan (http://www.targetscan.org), miRDB (http://www.mirdb.org) and miRanda (https://omictools.com/miranda-tool). Common targets were subsequently compared to genes downregulated upon miR‐1253 transfection of HDMB03 cells at a concentration of 100 nM. This comparison yielded a set of putative targets for miR‐1253.
In situ hybridization & immunohistochemistry
Under RNase‐free conditions, in situ hybridization was carried out in pediatric control cerebellum and tumor samples using locked nucleic acid miRNA detection probes for miR‐1253 (5′‐AGAGAAGAAGAUCAGCCUGCA‐3′), scramble negative control and U6 snRNA‐positive control (QIAGEN) following manufacturer’s recommendations. For IHC, deparaffinization was first performed followed by peroxidase quenching and overnight incubation with respective primary antibodies viz. CDK6, rabbit monoclonal antibody (1:100) and CD276 rabbit monoclonal antibody (1:100). Detection was performed with DAB Peroxidase Substrate Kit (Vector Labs) followed by counterstaining with hematoxylin (Fisher Scientific). Sections were visualized under EVOS FL Auto Imaging System (EVOS FL Auto, Life Technologies). Staining for miR‐1253 (nuclear, blue), CDK6 (nuclear, brown) and CD276 (cytoplasmic, brown) were scored by a blinded pathologist. Staining intensity for ISH was designated positive for signal visible at 10×, weakly positive for signal visible at 20–40×, or negative for no visible signal at 10×. For IHC, staining intensity was scored from 0 to 3, where signal detected at 10× was 3+, at 20× was 2+, at 40× was 1+, and no detection was 0. The percentage positive cells was scored from 1 to 4, where <25% scored 1, 25%–50% scored 2, 50%–75% scored 3; and >75 scored 4. Composite score was derived from the product of staining intensity and % positive cells (0–12).
DNA methylation profiling and tumor classification
Genome‐wide DNA methylome analysis was carried out on each DNA sample using the Illumina MethylationEPIC 850K bead arrays (36). Areas with the highest available tumor content were selected. DNA extraction was carried out using the automated Maxwell system (Promega, Madison, USA). DNA methylation was performed according to the manufacturer’s instructions at the NYU Molecular Pathology laboratory as described previously (45). Molecular subclassification was performed utilizing a cloud‐based DNA methylation classifier as described previously (6). From the raw array intensities, methylation beta values at each CpG were determined using the RnBeads software platform (http://rnbeads.mpi-inf.mpg.de/) including steps for quality control and normalization. The resulting beta values were multiplied by 100, as an estimate of percent methylation at each CpG measured. These values were aligned with the Illumina EPIC‐methylation annotation.
De‐methylation Studies (in vitro)
HDMB03 and D425 cells were seeded at a density of 1 × 10⁶ in 6‐well plates. Cells were treated with varying concentrations (1–5 μM) of the global de‐methylating agent, 5‐Aza‐2′‐deoxycytidine (Sigma). HDMB03 and D425 cells were treated with 5‐Azac (5 µM). Following 96 h of incubation, miR‐1253 expression was analyzed. Separately, HDMB03 and D425 cells were first transfected with a specific miR‐1253 inhibitor or scramble control for 24 h and then treated with 5 μM 5‐AzaC for up to 96 h. Inhibition of proliferation was measured by the MTT (HDMB03) or WST‐1 (D425) assays.
Statistical analysis
All in vitro experiments were performed in triplicates and repeated at least once. Data are displayed as mean ± SD unless otherwise specified. Statistical analyses were performed using Prism 7.0b (GraphPad Software). For multiple comparisons, a one‐way analysis of variance was used. For two‐group comparisons, depending on data distribution, a two‐tailed, unpaired Student’s t‐test or Mann‐Whitney U test was used. Statistical significance was established at P < 0.05. For normalization of data, the control was set at “1” and experimental groups were compared to control with error bars reflecting deviation from mean triplicate measurements; statistical analyses were conducted prior to normalization.
RESULTS
MiR‐1253 expression is deregulated in medulloblastoma
MiR‐1253 is located on chromosome 17p13.3, a locus sustaining cytogenetic mutations in over 50% of group 3 and 4 MB. (4, 9, 13, 31) Known to be enriched in the cerebellum (http://genome.ucsc.edu/human_miR_1253_expression), an observation that would align with its purported role in cerebellar development (49), we first compared miR‐1253 expression in total medulloblastoma (MB) and normal cerebellum using online databases and a local cohort of samples. We noted that miR‐1253 expression was downregulated significantly in medulloblastoma samples and across subgroups (Figure 1A–C). We further confirmed this expression deregulation in both SHH‐type (DAOY) and non‐SHH/WNT type (Grp3‐D341, D425, D458, D556, HDMB03; Grp3/4 D283) cell lines; the latter were chosen because of the presence of the i17q mutational signature and high myc‐producing phenotype characteristic of Groups 3 and 4 MB (Figure 1D). We concluded our expression analysis by demonstrating that medulloblastoma samples expressed a much lower signal of ISH probe to miR‐1253 as compared with normal cerebellum samples (Figure 1E, Supporting Information Figure S1B).
Figure 1.

MiR‐1253 expression deregulation in medulloblastoma. A. MiR‐1253 expression analysis by Nanostring applied to CSF from normal cerebellum (CB n = 14) and medulloblastoma (MB n = 15) patients (Alessandra et al, gse62381). B. Relative expression of miR‐1253 by real‐time reverse transcriptase PCR normalized to U6b expression in total medulloblastoma specimens (MB n = 28) compared to normal cerebellum (CB n = 16). C. Subgroup‐specific comparison (SHH n = 5, Grp3 n = 9, Grp4 n = 14) to normal cerebellum (ped CB n = 11, adult CB n = 5). D. Similar comparison in 7 well‐studied medulloblastoma cell lines compared to normal human astrocytes (NHA). E. In situ hybridization analysis of normal cerebellum (n = 13) vs. medulloblastoma (n = 21). Representative micrographs at 10× magnification; scale bars 400 μm. Data presented as mean ± SD and analyzed using (A) Mann‐Whitney U, (B) Student’s t‐test, (C and D) One‐way ANOVA and (E) Chi‐square test for contingency analysis; *P < 0.05, **P < 0.005 and ***P < 0.001 compared to control.
MiR‐1253 expression is silenced via hypermethylation in non‐SHH/WNT medulloblastomas
Epigenetic mechanisms, like hypermethylation and acetylation, have been shown to underlie miRNA de‐regulation in cancer biology. (15, 24, 26) In studying the normal methylation pattern of miR‐1253, we first learned that pediatric cerebella sustained a substantially higher level of methylation than adult samples, providing preliminary insight into possible developmental regulation of miR‐1253 (Figure 2Ai). Second, when comparing overall methylation, the miR‐1253‐containing loci were hypermethylated in medulloblastoma compared to normal cerebella (Figure 2Aii, Supporting Information Figure S2Ai). Examining subgroup‐specific methylation patterns, we found that locus 4 was hypermethylated in both Groups 3 and 4 MB as compared to normal cerebellum and SHH MB (Figure 2Aiii, Supporting Information Figure S2Aii).
Figure 2.

Epigenetic silencing of miR‐1253 by hypermethylation. A i‐iii. Subgroup‐specific miR‐1253 methylation (SHH n = 5, Grp3 n = 8, Grp4 n = 13) compared to normal cerebellum (Ped CB n = 10, Adult CB n = 5). miR‐1253 chr17 location: 2,651,372‐2,651,476. Relative expression of miR‐1253 (B) and its targets (C) in HDMB03 and D425 cells treated with 5‐AzaC (5 µM) for 96 h. D. Analysis of proliferation after pre‐treatment with miR‐1253 inhibitor for 24 h followed by demethylation with 5‐AzaC (5 µM) over a 96‐h period. Data presented as mean ± SD and analyzed using Student’s t‐test (or One‐way ANOVA for Aiii); *P < 0.05, **P < 0.005, and ***P < 0.001.
We then studied the effect of de‐methylation on tumor cell proliferation in HDMB03 and D425 cells to determine if hypermethylation truly silenced miR‐1253 function. Treating cells with 5‐Aza‐2′‐deoxycytidine (5‐AzaC), a demethylating agent, resulted in the rapid recovery of miR‐1253 expression (with a subsequent downregulation of its targets) up to 96 h (Figure 2B and 2C); and demethylated tumor cells demonstrated significant growth retardation over timeframe (Supporting Information Figure S2B). Since 5‐AzaC functions as a global demethylating agent, we wanted to demonstrate that specific demethylation of miR‐1253 was responsible for the anti‐proliferative effects observed. Hence, we treated HDMB03 and D425 cells with miR‐1253 inhibitor 24 h prior to de‐methylation with 5‐AzaC and performed a subsequent analysis of cell viability using the MTT and WST‐1 assays, respectively. Noting rapid recovery in proliferation (Figure 2D), we confirmed a specific anti‐proliferative role for the de‐methylated “active” form of miR‐1253.
Restoration of miR‐1253 expression inhibits the growth of medulloblastoma cells
Having demonstrated expression deregulation in MB cells via hypermethylation, we now wanted to study tumor cell behavior upon miR‐1253 expression restoration via ectopic expression in DAOY and HDMB03 cells, chosen for their adherent growth properties. Upon transient transfection with miR‐1253, expression was confirmed to be substantially higher in each cell line compared to scramble negative control at 72–96 h (Figure 3A, Supporting Information Figure S3A). A subsequent assessment of cell proliferation during this time frame showed a significant growth inhibitory effect of miR‐1253 expression in 5 different medulloblastoma cell lines, most pronounced at 100 nM concentration of miR‐1253 mimic after 48 h (Figure 3B, Supporting Information Figures S1C–D, S3B–C, and S4D). To further evaluate miR‐1253’s growth inhibitory effects, cell lines were pre‐treated with a miR‐1253 inhibitor prior to transfection with mimic. Pre‐treated cells returned to their wild‐type proliferative state, thus confirming miR‐1253’s anti‐proliferative properties in medulloblastoma cells (Figure 3C). Moreover, in miR‐1253‐transfected HDMB03 and DAOY cells, the number of tumor cell colonies was substantially reduced (Figure 3D, Supporting Information Figure S3D).
Figure 3.

Negative trophic effects of miR‐1253 expression restoration in medulloblastoma tumor cells. Adherent medulloblastoma cell lines, DAOY and HDMB03, were transiently transfected with miR‐1253 mimic (50 or 100 nM) for up to 72 h and subsequent functional studies performed. A. Expression restoration of miR‐1253 at 72 h after transient transfection. B. Tumor cell proliferation examined over a 48‐h time frame with mimic alone and (C) with inhibitor + mimic (100 nM). D. Assessment of colony formation in transfected HDMB03 cells seeded in six‐well plates for nine days followed by methanol fixation and crystal violet staining. Representative images of cancer cell colonies presented at 10× magnification. E. Wound healing “scratch” assay with cell migration‐to‐wound closure monitored up to 48 h. For migration/invasion assays, transfected cells were reseeded in transwells coated with or without matrigel. Total number of migrating cells (F) or those invading through the matrigel layer (G) were quantified after overnight incubation. Data presented as mean ± SD from experiments done in triplicates and analyzed using One‐way ANOVA; *P < 0.05, **P < 0.005 and ***P < 0.001.
To examine the effect of miR‐1253 overexpression on cell motility, we studied wound healing, tumor cell migration, and invasion. Delayed wound closure was observed at 48 h in miR‐1253‐transfected HDMB03 and DAOY cells at both mimic concentrations (Figure 3E, Supporting Information Figure S3E). Similarly, for migration and invasion assays, a significantly lower number of miR‐1253‐transfected tumor cells were present in the lower chamber as compared with scramble‐negative controls for both cell lines at both mimic concentrations (Figure 3F–G, Supporting Information Figure S3F–G). These results signify that miR‐1253 possesses tumor‐suppressive properties by diminishing the migratory and invasive properties of cancer cells in vitro.
MiR‐1253 inhibits mediators of cellular proliferation and promotes tumor cell apoptosis
Aberrant regulation of the CDK 4/6/cyclin D pathway can lead to unchecked progression of cells through the cell cycle and is linked to medulloblastoma pathophysiology (8). In fact, this pathway has shown promise as a target for inhibition in xenograft models of SHH and Group 3 medulloblastomas (8). In DAOY and HDMB03 cells, a substantial reduction in CDK4, CDK6 and cyclin‐D1 (no change in CDK2) were noted in the presence of miR‐1253 overexpression (Figure 4A). As specific mediators of the G0/G1 phase of the cell cycle, we confirmed cell cycle arrest at G0/G1 phase in HDMB03 cells by FACS (Figure 4B). Conversely, in miR‐1253 inhibitor‐transfected tumor cells, expression levels of CDK4/6 surpassed control (Supporting Information Figure S4B). Similarly, phosphorylated AKT plays a critical regulatory role not only in cellular proliferation, but also in differentiation and apoptosis, and has been shown to be activated in common malignancies (12). MiR‐1253 transfection reduced the ratio of phosphorylated AKT to total AKT by nearly 50% (Figure 4A). Taken together, these data provide biochemical corroboration of the inhibitory effects of miR‐1253 on proliferation shown in our functional assays.
Figure 4.
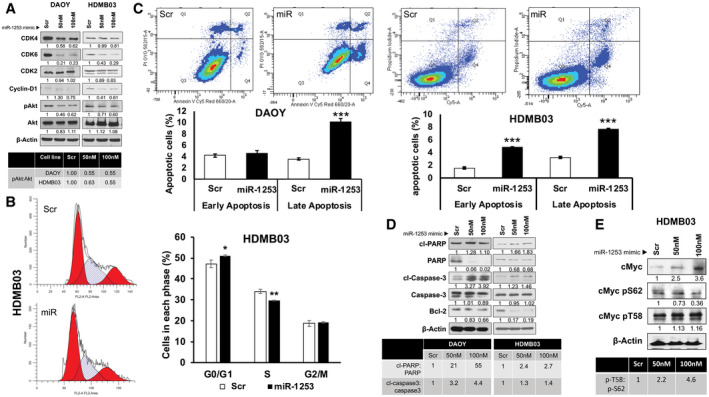
Effect of miR‐1253 expression restoration on cell cycle and apoptosis. DAOY and HDMB03 cells were transiently transfected with miR‐1253 mimic or scramble as described previously; biochemical analyses were conducted at 72 h. A. Western blotting expression analysis of markers of tumor cell proliferation with incremental changes in the ratio of phospho‐AKT to total AKT tabulated. B. Cell cycle analysis in HDMB03 cells by flow cytometry. C. Assessment of early vs. late apoptosis by flow cytometry, and (D) Western blotting analysis of standard makers of apoptosis with tabulated ratios between cleaved and total proteins in both cell lines. E. Given the high myc expression in HDMB03 cells, the ratio of phospho‐c‐Myc‐T58 vs. phospho‐c‐Myc‐S62 was further studied in HDMB03 cells. Data presented as mean ± SD from experiments done in triplicates and analyzed using Student’s t‐test; *P < 0.05, **P < 0.005 and ***P < 0.001.
We then explored the role of apoptosis in the anti‐proliferative function of miR‐1253. Based on Annexin‐V/Cy™5 staining, we found an elevation in late apoptosis in DAOY and HDMB03 cells transfected with miR‐1253 (Figure 4C). Common markers for apoptosis experienced a rise, specifically in the ratio of cleaved PARP:PARP and cleaved caspase‐3:caspase‐3, with a concomitant decrease in the anti‐apoptotic marker, Bcl‐2, in DAOY and HDMB03 cells transfected with miR‐1253 (Figure 4D); these results were recapitulated in D341 and D425 cells (Supporting Information Figure S4A).
Of note, miR‐1253‐transfected HDMB03 cells showed differential expression of c‐myc phosphorylation states. C‐myc phosphorylated at serine 62 leads to increased c‐myc stability, a hallmark of tumor aggressiveness; conversely, c‐myc phosphorylated at threonine 58 destabilizes the pro‐oncogenic protein, leading to its ubiquitin‐mediated degradation, with subsequent cellular apoptosis (16). MiR‐1253 transfection led to a sharp rise in phosp‐c‐myc‐T58 vs. phospho‐c‐myc‐S62 in HDMB03 cells, further corroborating the elevated apoptosis seen with miR‐1253 expression in this cell line (Figure 4E). Collectively, these results indicate that the anti‐tumorigenic effects of miR‐1253 involve cell cycle arrest and apoptosis.
CDK6 and CD276 (B7‐H3) are oncogenic targets of miR‐1253
MicroRNAs typically exert an inhibitory effect on protein expression. A better understanding of the anti‐tumorigenic properties of miR‐1253 may be garnered by isolating and studying its putative oncogenic targets. Using online computational prediction tools, we identified 433 common targets for miR‐1253. Comparing these targets to genes sustaining significant downregulation in miR‐1253‐transfected HDMB03 cells narrowed the list to 47 candidates (Figure 5A, Supporting Information Figure S5A). Hierarchical clustering and pathways analysis revealed that the differentially expressed genes were mostly involved with cell growth, division, and motility (Supporting Information Figure S5B). Among the relevant targets, CDK6 and CD276 were of particular interest given their established role as poor prognostic markers in medulloblastoma (11, 33, 40, 50). Both proteins were noted to be highly upregulated across medulloblastoma subgroups (Supporting Information Figure S5C–D). Moreover, both proteins have shown promise in pre‐clinical studies (CART cell therapy targeting CD276) and clinical trials (palbociclib as a CDK4/6 inhibitor) in high‐risk MB (8, 28).
Figure 5.

Isolation of oncogenic targets of miR‐1253. A. Common miR‐1253 target genes (47) that sustain significant expression reduction (P < 0.05) with miR‐1253 treatment (in HDMB03 cells) when compared with three online miR target databases with heatmap expression patterns included (adult normal n = 4, pediatric normal n = 7, SHH n = 5, Grp3 n = 9, Grp4 n = 13). B. Survival (Cavali et al., gse85217) and expression analysis for CDK6 and CD276 using the R2 platform (https://hgserver1.amc.nl/cgi-bin/r2/main.cgi). Nl CB, Roth et al 2008 (n = 9, gse3526); MB 1, Gilbertson et al. 2012 (n = 76, gse37418); MB 2, Pfister et al 2017 (n = 223); MB 3, Kool et al 2009 (n = 62, gse10327); MB4, Delattre et al 2012 (n = 57). C. mRNA transcript and protein levels for CDK6 and CD276 with miR‐1253 transfection in HDMB03 cells. D. Dual‐luciferase reporter assays confirming direct binding of miR‐1253 to 3′ UTR region of CDK6 and CD276 in HDMB03 cells. E, F. Subgroup‐specific comparison of CDK6 and CD276 expression between normal cerebellum (pedi CB n = 10, adult CB n = 5) and medulloblastoma (SHH n = 3, Grp3 n = 6, Grp4 n = 10) by immunohistochemistry. Representative micrographs at 10× magnification; scale bars 400 μm. Data presented as mean ± SD from experiments done in triplicates and analyzed using one‐way ANOVA; *P < 0.05, **P < 0.005, and ***P < 0.001.
Using an online genomics analysis and visualization platform (R2), we confirmed that high expression of CDK6 and CD276 negatively impacted overall survival (Figure 5B). MiR‐1253 transfection downregulated expression of CDK6 and CD276 (Figure 5C), which both directly bind to miR‐1253 as observed using the luciferase reporter assay (Figure 5D). Immunohistochemistry in tumor samples revealed a high expression of CDK6 (Figure 5E) and CD276 (Figure 5F) in medulloblastoma tissues compared to normal cerebellum. Together, these data confirm CDK6 and CD276 as targets of miR‐1253 and implicate them in medulloblastoma pathophysiology.
Silencing miR‐1253 targets, CDK6 and CD276, inhibits the growth of medulloblastoma cells
To further evaluate the pro‐tumorigenic properties of CDK6 and CD276, in vitro assays were conducted in the presence of siRNA targeting each protein (Figure 6A). Given the role of CDK6 as a terminal component of the cell cycle, colony formation was studied in the presence of si‐CDK6. Similarly, given the role of CD276 as a mediator of metastasis, tumor cell migration and invasion were studied in the presence of si‐CD276. Si‐CDK6 reduced colony formation by ~50% in HDMB03 cells (Figure 6B). Similarly, in the presence of si‐CD276, wound healing (Figure 6C), migration and invasion (Figure 6D) were substantially reduced in tumor cells. These studies purport pro‐oncogenic roles for CDK6 and CD276 in medulloblastoma, supporting similar findings from prior studies (50).
Figure 6.

Silencing CDK6 and CD276 and medulloblastoma tumor cell behavior. A. Effect of transfection of HDMB03 cells with si‐CDK6 or si‐CD276 (50 and 100 nM) on target gene expression at 72 h. B. Colony formation assessment in HDMB03 cells transfected with si‐CDK6 (50 and 100 nm). Transfected cells were reseeded in six‐well plates 24 h after transfection for nine days followed by methanol fixation and crystal violet staining. Stain was extracted and quantified at 590 nm. Representative images of cancer cell colonies presented at 10× magnification. To examine migratory potential, HDMB03 cells transfected with si‐CD276 (50 and 100 nM) were studied using the (C) wound healing “scratch” assay and the (D) trans‐well migration and invasion assays. Data presented as mean ± SD from experiments done in triplicate and analyzed using one‐way ANOVA; *P < 0.05, **P < 0.005 and ***P < 0.001.
DISCUSSION
MiR genes located in regions of genomic instability have been implicated in various cancers (5, 42). Locus 17p13.3 is a site of haploinsufficiency in Groups 3 and 4 tumors and harbors a number of important tumor suppressor genes (4, 9, 13, 31). Two recent reports provided strong support for such a role for miR‐1253, found on the terminal end of 17p13.3 (14, 25). MiR‐1253 is predominantly found in the cerebellum (32). Its putative targets are the bone morphogenic proteins that encourage the proliferation of granule cell precursors culminating in the development of the external granule layer (49). With epigenetic silencing of miR‐1253, the proliferative effects of BMPs could go unopposed, subverting normal cerebellar development and facilitating phenotypic transformation into medulloblastoma.
Here, we have presented a systematic study of the tumor‐suppressive properties of miR‐1253 using a combination of in silico, in vitro and ex vivo analyses in medulloblastoma. Our initial expression analysis of normal and medulloblastoma‐afflicted cerebella revealed significantly lower levels of miR‐1253 in all pathologic tissues, regardless of subgroup, a finding recapitulated in vitro and confirmed using in situ hybridization. Epigenetic changes commonly contribute to the deregulation of miR expression, most commonly via acetylation or hypermethylation (5, 44). Our methylation studies uncovered an interesting pattern of hypermethylation unique to Group 3 and 4 MB, particularly along locus 4. While de‐methylation led to reduced tumor cell growth, rescue of tumor cell proliferation in the presence of a specific miR‐1253 inhibitor confirmed hypermethylation as an epigenetic silencing mechanism for miR‐1253 in Group 3 and 4 MB.
That SHH MB, which does not sustain any chromosomal 17 aberrations or hypermethylation at the miR‐1253 locus, also demonstrates miR‐1253 silencing warrants further study, especially since all functional and biochemical studies in an SHH‐type cell line (DAOY) recapitulated findings in Group 3 and 4 cell lines. Corroborating our findings of miR‐1253 expression dysregulation in SHH MB, purported targets of miR‐1253 (ALX4, TGIF) possessing oncogenic properties have been found to be overexpressed in this subgroup (21).
Regarding tumor virulence, transient transfection with miR‐1253 reduced tumor cell aggressiveness as evidenced by lower proliferative, migratory, and invasive properties, akin to miR‐1253 de‐regulation in NSCLC (25). Delving into the biochemical basis for these phenotypic changes revealed elevated apoptosis and dysregulation of G0/G1 cell cycle checkpoint regulatory kinases, i.e., CDK4, CDK6, cyclin D1, along with pAKT. Previous studies have highlighted the PI3K/AKT pathway in cell cycle progression through G1 and described dysregulation of checkpoint kinases underlying aberrant cell proliferation (23, 30). Ectopic miR‐1253 expression increased the proportion of late apoptotic cells, reduced bcl2 levels, and increased cleaved PARP, cleaved caspase‐3, and p‐T58‐c‐myc species, consistent with higher apoptosis. Taken together, miR‐1253 expression dramatically reduced tumor cell aggressiveness while potentiating cellular turnover by arresting cells at the G0/G1 phase of the cell cycle.
We then identified 2 critical miR‐1253 targets with cell proliferative properties: CDK6 and CD276. Aside from demonstrating direct binding to miR‐1253, we also showed a reduction in expression of both targets via miR‐1253 overexpression and de‐methylation. Cyclin D‐dependent kinases 4 and 6 play an important role in mammalian cell proliferation by driving the progression of cells through S phase via interaction with the D‐type cyclins (D1, D2, and D3) in G1 (47). High expression of CDK6 is a confirmed poor prognostic marker in medulloblastoma (33, 50). Tumor tissues with low miR‐1253 expressed high levels of CDK6; restoring miR‐1253 expression reduced CDK4/6 and cyclinD1, further providing support that miR‐1253 expression restoration inhibits cell growth, potentially via direct inhibition of CDK6.
CD276/B7‐H3 is an immune checkpoint receptor, highly expressed in solid tumors, and contributes to immune evasion and metastasis (11, 40). In NSCLC, its high expression has been correlated with high metastatic potential and worse prognosis (29). A growing body of evidence suggests that CD276 plays an important role in migration, invasion, angiogenesis and the epithelial‐mesenchymal transition (EMT) by deregulation of MMP‐2, MMP‐9 and VEGF expression (20). In hepatocellular carcinoma, the JAK2/STAT3/SLUG axis has been implicated in CD276‐mediated invasiveness (17). We have shown that both miR‐1253 restoration and CD276 silencing reduce the migratory and invasive potential of medulloblastoma cells.
Not only have both miR‐1253 targets been implicated in medulloblastoma tumor aggressiveness, but they are also the basis for new targeted therapies. For example, the CDK4/6 inhibitor, palbociclib, has demonstrated therapeutic efficacy in SHH and Group 3 pre‐clinical mouse models, with a current clinical trial underway combining it with chemotherapy in pediatric recurrent/refractory medulloblastoma (NCT03709680) (8). Similarly, chimeric antigen receptor (CAR) T‐cell therapy targeting CD276 has most recently shown favorable outcomes against pediatric medulloblastoma in xenograft models, though clinical trials are pending (28).
In conclusion, our studies have not only uncovered the tumor‐suppressive role of miR‐1253 in MB, but also an epigenetic silencing mechanism in Groups 3 and 4 MB, and two deregulated oncogenic targets; both targets have been confirmed as markers of poor prognosis in medulloblastoma and are currently being used to develop molecularly targeted therapies. These promising therapies provide proof‐of‐principle that targeting the upstream miR that controls their expression could hold potential for high therapeutic benefit. Together, our data and the work of others strengthen our initial proposition for the use of miR‐based therapies in the treatment of medulloblastoma.
ETHICS APPROVAL AND CONSENT TO PARTICIPATE
Tumor samples were collected from the Children’s Hospital and Medical Center, Omaha and the University of Nebraska Medical Center after Institutional Review Board approval. Because of the exempt status of the study, informed consent was not needed.
CONFLICT OF INTEREST
The authors declare that they have no competing interests.
AUTHOR CONTRIBUTIONS
RKK, MWN, SKB, RV and SM designed the study. RKK and NKP performed the experiments and analyzed the data. PA, RCV and IT contributed to the generation of data and figures for the in silico part of the study. DP and MP identified and provided tissue samples for the study while DRB, GT and MS performed analyses for tumor sample characterization. DK and AMD performed and analyzed epigenetic silencing presented in Figure 2. DP, MP, DRB, MS, DK, DC, MWN, SKB, RV and SM contributed significantly to the interpretation of the data. RKK and SM wrote the manuscript. All authors read and approved the final manuscript.
Supporting information
Figure S1. MiR‐1253, a putative tumor suppressor gene in medulloblastoma. A. Relative base‐pair positions of candidate tumor suppressor genes on chromosome 17p13.3. ABR, activated BCR‐related; HIC1, hypermethylated in cancer 1; MNT, Max‐binding protein; OVCA1/2, ovarian carcinoma 1 and 2; PAFAH1B1, platelet activating factor acetyl‐hydrolase 1b regulatory subunit 1; RPA1, replication protein A1; SMYD4, SET and MYND domain containing 4; TUSC5, tumor suppressor candidate 5; VPS53, vacuolar protein sorting‐associated protein 53 homolog; YWHAE, 14‐3‐3 protein epsilon; miR, microRNA. B. MiR‐1253 expression assessment by in situ hybridization in normal cerebellum, SHH, group 3 and 4 medulloblastomas. Micrographs from Figure 1E presented here at 40x magnification, scale bars 100 um. C. Growth curves from plotted raw O.D. values for MB cell lines transfected with miR‐1253. D. Analysis of scramble miR transfection on cell viability in HDMB03 cells. Cell viability of untransfected HDMB03 cells (NC) compared with scramble‐transfected (Scr, 100 nM), and cells transfected with 100 nM miR‐153 mimic demonstrating lack of toxicity with scramble transfections.
Figure S2. Epigenetic silencing of miR‐1253. A. Subgroup‐specific miR‐1253 methylation patterns (SHH n = 10, Grp3 n = 7, Grp4 n = 12) in a second cohort of patients (procured from collaborators at University of Colorado Anschutz Medical Campus). Analyses carried out in comparison to normal pediatric cerebellum (n = 10) presented in Figure 2. miR‐1253 chr17 location: 2,651,372‐2,651,476. B. Assessment of growth in HDMB03 and D425 cells treated with varying concentrations of 5‐AzaC (1–5.0 μM) over a 96‐h period. Data presented as mean ± S.D from experiments done in triplicates and analyzed using One‐way ANOVA (or Student’s t‐test for Ai); *P < 0.05, **P < 0.005, and ***P < 0.001.
Figure S3. Additional analyses of the negative trophic effects of miR‐1253 in medulloblastoma cells. A. MiR‐1253 expression assessed by RT‐PCR 96 hours after transfection. B, C. Tumor cell proliferation examined over a 72‐hour time frame in (B) DAOY, HDMB03 and (c) D341, D425 cells. Assessment of (D) colony formation, (E) wound healing, (F) migration and (G) invasion in scramble vs miR‐1253‐transfected DAOY cells. Data presented as mean ± SD from experiments done in triplicates and analyzed using One‐way ANOVA with *P < 0.05, **P < 0.005 and ***P < 0.001.
Figure S4. Further biochemical analysis of the effects of miR‐1253 expression restoration in MB tumor cells. A. Western blotting analysis of markers of apoptosis in transiently transfected D341 and D425 cells with tabulated ratios between cleaved and total proteins. B. DAOY and HDMB03 cells transfected with miR‐1253 mimic and inhibitor separately to study the effect on expression of cell cycle markers, CDK4 and CDK6. C–E. D283 cell were transfected with miR‐1253 mimic (100 nM); cell proliferation assay and expression of miR‐1253 targets, CDK6 and CD276 (Western blot), evaluated thereafter.
Figure S5. Putative oncogenic targets and deregulated pathways associated with miR‐1253 silencing. A. Expression analysis by RNA Sequencing of the 47 putative miR‐1253 targets isolated using 3 online miR databases compared to miR‐1253‐transfected HDMB03 cells. Of those observed to be significantly elevated in medulloblastoma are CDK6, CD276, BAZ2A, UHRF1BP1, AGPAT5, TOP2A, PRKAA1, AMOTL1, BML4, MLEC, ECT2, KPNA1, MED13, POLDIP3, NFE2L1, TSG101, PYCR1 and PHB. B. Enriched cellular/biological pathways associated with the 47 unique miR‐1253 targets identified using gene ontology category from consensus path DB (http://cpdb.molgen.mpg.de/). Pathways represented as an inverted bar graph based on the −log P values with threshold P < 0.05. C, D. Specific expression of CDK6 and CD276 in our medulloblastoma patient cohort (adult normal n = 4, pediatric normal n = 7, SHH n = 5, Grp3 n = 9, Grp4 n = 13).
ACKNOWLEDGMENTS
Thanking Dr. Amar Singh’s Lab for the provision of supplies to conduct luciferase assay; the assistance of University of Nebraska Core Facilities for RNA Sequencing, methylation profiling, tissue sectioning and FACS. Funding support for this project was provided in part by the Department of Pediatrics at UNMC; by the Edna Ittner Pediatric Research Support Fund; by the Fred & Pamela Buffett Cancer Center, which is funded by a National Cancer Institute Cancer Center Support Grant (P30 CA036727), in conjunction with the UNMC Pediatric Cancer Research Group; and by the State of Nebraska through the UNMC Pediatric Cancer Research Center (to S.M.). Methylation profiling at NYU was supported in part by a grant from the Friedberg Charitable Foundation (to M.S.).
DATA AVAILABILITY STATEMENT
The datasets used and/or analyzed during the current study are available from the corresponding author on reasonable request.
REFERENCES
- 1. Ameres SL, Zamore PD (2013) Diversifying microRNA sequence and function. Nat Rev Mol Cell Biol 14:475–488. [DOI] [PubMed] [Google Scholar]
- 2. Bao L, Hazari S, Mehra S, Kaushal D, Moroz K, Dash S (2012) Increased expression of P‐glycoprotein and doxorubicin chemoresistance of metastatic breast cancer is regulated by miR‐298. Am J Pathol 180:2490–2503. [DOI] [PMC free article] [PubMed] [Google Scholar]
- 3. Biegel JA, Rorke LB, Packer RJ, Sutton LN, Schut L, Bonner K, Emanuel BS (1989) Isochromosome 17q in primitive neuroectodermal tumors of the central nervous system. Genes Chromosom Cancer 1:139–147. [DOI] [PubMed] [Google Scholar]
- 4. Briggs KJ, Corcoran‐Schwartz IM, Zhang W, Harcke T, Devereux WL, Baylin SB et al (2008) Cooperation between the Hic1 and Ptch1 tumor suppressors in medulloblastoma. Genes Dev 22:770–785. [DOI] [PMC free article] [PubMed] [Google Scholar]
- 5. Calin GA, Sevignani C, Dumitru CD, Hyslop T, Noch E, Yendamuri S et al (2004) Human microRNA genes are frequently located at fragile sites and genomic regions involved in cancers. Proc Natl Acad Sci U S A 101:2999–3004. [DOI] [PMC free article] [PubMed] [Google Scholar]
- 6. Capper D, Jones DTW, Sill M, Hovestadt V, Schrimpf D, Sturm D et al (2018) DNA methylation‐based classification of central nervous system tumours. Nature 555:469–474. [DOI] [PMC free article] [PubMed] [Google Scholar]
- 7. Cavalli FMG, Remke M, Rampasek L, Peacock J, Shih DJH, Luu B et al (2017) Intertumoral heterogeneity within medulloblastoma subgroups. Cancer Cell 31:737–754.e6. [DOI] [PMC free article] [PubMed] [Google Scholar]
- 8. Cook Sangar ML, Genovesi LA, Nakamoto MW, Davis MJ, Knobluagh SE, Ji P et al (2017) Inhibition of CDK4/6 by palbociclib significantly extends survival in medulloblastoma patient‐derived xenograft mouse models. Clin Cancer Res 23:5802–5813. [DOI] [PMC free article] [PubMed] [Google Scholar]
- 9. Cvekl A Jr, Zavadil J, Birshtein BK, Grotzer MA, Cvekl A (2004) Analysis of transcripts from 17p13.3 in medulloblastoma suggests ROX/MNT as a potential tumour suppressor gene. Eur J Cancer 40:2525–2532. [DOI] [PubMed] [Google Scholar]
- 10. Ellison DW, Dalton J, Kocak M, Nicholson SL, Fraga C, Neale G et al (2011) Medulloblastoma: clinicopathological correlates of SHH, WNT, and non‐SHH/WNT molecular subgroups. Acta Neuropathol 121:381–396. [DOI] [PMC free article] [PubMed] [Google Scholar]
- 11. Gregorio A, Corrias MV, Castriconi R, Dondero A, Mosconi M, Gambini C et al (2008) Small round blue cell tumours: diagnostic and prognostic usefulness of the expression of B7–H3 surface molecule. Histopathology 53:73–80. [DOI] [PMC free article] [PubMed] [Google Scholar]
- 12. Hart JR, Vogt PK (2011) Phosphorylation of AKT: a mutational analysis. Oncotarget 2:467–476. [DOI] [PMC free article] [PubMed] [Google Scholar]
- 13. Hoff C, Seranski P, Mollenhauer J, Korn B, Detzel T, Reinhardt R et al (2000) Physical and transcriptional mapping of the 17p13.3 region that is frequently deleted in human cancer. Genomics 70:26–33. [DOI] [PubMed] [Google Scholar]
- 14. Huang L, Chen M, Pan J,Yu W (2018) Circular RNA circNASP modulates the malignant behaviors in osteosarcoma via miR‐1253/FOXF1 pathway. Biochem Biophys Res Commun 500:511–517. [DOI] [PubMed] [Google Scholar]
- 15. Incoronato M, Urso L, Portela A, Laukkanen MO, Soini Y, Quintavalle C et al (2011) Epigenetic regulation of miR‐212 expression in lung cancer. PLoS ONE 6:e27722. [DOI] [PMC free article] [PubMed] [Google Scholar]
- 16. Junttila MR, Westermarck J (2008) Mechanisms of MYC stabilization in human malignancies. Cell cycle 7:592–596. [DOI] [PubMed] [Google Scholar]
- 17. Kang FB, Wang L, Jia HC, Li D, Li HJ, Zhang YG, Sun DX (2015) B7–H3 promotes aggression and invasion of hepatocellular carcinoma by targeting epithelial‐to‐mesenchymal transition via JAK2/STAT3/Slug signaling pathway. Cancer Cell Int 15:45. [DOI] [PMC free article] [PubMed] [Google Scholar]
- 18. Keller A, Leidinger P, Borries A, Wendschlag A, Wucherpfennig F, Scheffler M et al (2009) miRNAs in lung cancer – studying complex fingerprints in patient's blood cells by microarray experiments. BMC Cancer 9:353. [DOI] [PMC free article] [PubMed] [Google Scholar]
- 19. Kool M, Korshunov A, Remke M, Jones DT, Schlanstein M, Northcott PA et al (2012) Molecular subgroups of medulloblastoma: an international meta‐analysis of transcriptome, genetic aberrations, and clinical data of WNT, SHH, Group 3, and Group 4 medulloblastomas. Acta Neuropathol 123:473–484. [DOI] [PMC free article] [PubMed] [Google Scholar]
- 20. Kortylewski M, Jove R, Yu H (2005) Targeting STAT3 affects melanoma on multiple fronts. Cancer Metastasis Rev 24:315–327. [DOI] [PubMed] [Google Scholar]
- 21. Koso H, Tsuhako A, Lyons E, Ward JM, Rust AG, Adams DJ et al (2014) Identification of FoxR2 as an oncogene in medulloblastoma. Can Res 74:2351–2361. [DOI] [PubMed] [Google Scholar]
- 22. Kucherenko MM, Barth J, Fiala A, Shcherbata HR (2012) Steroid‐induced microRNA let‐7 acts as a spatio‐temporal code for neuronal cell fate in the developing Drosophila brain. EMBO J 31:4511–4523. [DOI] [PMC free article] [PubMed] [Google Scholar]
- 23. Lapenna S, Giordano A (2009) Cell cycle kinases as therapeutic targets for cancer. Nat Rev Drug Discov 8:547–566. [DOI] [PubMed] [Google Scholar]
- 24. Li D, Li Z, Xiong J, Gong B, Zhang G, Cao C et al (2015) MicroRNA‐212 functions as an epigenetic‐silenced tumor suppressor involving in tumor metastasis and invasion of gastric cancer through down‐regulating PXN expression. Am J Cancer Res 5:2980–2997. [PMC free article] [PubMed] [Google Scholar]
- 25. Liu M, Zhang Y, Zhang J, Cai H, Zhang C, Yang Z et al (2018) MicroRNA‐1253 suppresses cell proliferation and invasion of non‐small‐cell lung carcinoma by targeting WNT5A. Cell Death Dis 9:189. [DOI] [PMC free article] [PubMed] [Google Scholar]
- 26. Lopez‐Bertoni H, Lal B, Li A, Caplan M, Guerrero‐Cazares H, Eberhart CG et al (2015) DNMT‐dependent suppression of microRNA regulates the induction of GBM tumor‐propagating phenotype by Oct4 and Sox2. Oncogene 34:3994–4004. [DOI] [PMC free article] [PubMed] [Google Scholar]
- 27. Louis DN, Perry A, Reifenberger G, von Deimling A, Figarella‐Branger D, Cavenee WK et al (2016) The 2016 World Health Organization classification of tumors of the central nervous system: a summary. Acta Neuropathol 131:803–820. [DOI] [PubMed] [Google Scholar]
- 28. Majzner RG, Theruvath JL, Nellan A, Heitzeneder S, Cui Y, Mount CW et al (2019) CAR T cells targeting B7–H3, a pan‐cancer antigen, demonstrate potent preclinical activity against pediatric solid tumors and brain tumors. Clin Cancer Res 25:2560–2574. [DOI] [PMC free article] [PubMed] [Google Scholar]
- 29. Mao Y, Li W, Chen K, Xie Y, Liu Q, Yao M et al (2015) B7–H1 and B7–H3 are independent predictors of poor prognosis in patients with non‐small cell lung cancer. Oncotarget 6:3452–3461. [DOI] [PMC free article] [PubMed] [Google Scholar]
- 30. Massague J (2004) G1 cell‐cycle control and cancer. Nature 432:298–306. [DOI] [PubMed] [Google Scholar]
- 31. McDonald JD, Daneshvar L, Willert JR, Matsumura K, Waldman F, Cogen PH (1994) Physical mapping of chromosome 17p13.3 in the region of a putative tumor suppressor gene important in medulloblastoma. Genomics 23:229–232. [DOI] [PubMed] [Google Scholar]
- 32. Mele M, Ferreira PG, Reverter F, DeLuca DS, Monlong J, Sammeth M et al (2015) Human genomics. The human transcriptome across tissues and individuals. Science 348:660–665. [DOI] [PMC free article] [PubMed] [Google Scholar]
- 33. Mendrzyk F, Radlwimmer B, Joos S, Kokocinski F, Benner A, Stange DE et al (2005) Genomic and protein expression profiling identifies CDK6 as novel independent prognostic marker in medulloblastoma. J Clin Oncol 23:8853–8862. [DOI] [PubMed] [Google Scholar]
- 34. Merino MJ, Gil S, Macias CG, Lara K (2018) The unknown microRNA expression of male breast cancer. Similarities and differences with female ductal carcinoma. Their role as tumor biomarker. J Cancer 9:450–459. [DOI] [PMC free article] [PubMed] [Google Scholar]
- 35. Min HS, Lee JY, Kim SK, Park SH (2013) Genetic grouping of medulloblastomas by representative markers in pathologic diagnosis. Transl Oncol 6:265–272. [DOI] [PMC free article] [PubMed] [Google Scholar]
- 36. Moran S, Arribas C, Esteller M (2016) Validation of a DNA methylation microarray for 850,000 CpG sites of the human genome enriched in enhancer sequences. Epigenomics 8:389–399. [DOI] [PMC free article] [PubMed] [Google Scholar]
- 37. Neo WH, Yap K, Lee SH, Looi LS, Khandelia P, Neo SX et al (2014) MicroRNA miR‐124 controls the choice between neuronal and astrocyte differentiation by fine‐tuning Ezh2 expression. J Biol Chem 289:20788–20801. [DOI] [PMC free article] [PubMed] [Google Scholar]
- 38. Northcott PA, Korshunov A, Witt H, Hielscher T, Eberhart CG, Mack S et al (2011) Medulloblastoma comprises four distinct molecular variants. J Clin Oncol 29:1408–1414. [DOI] [PMC free article] [PubMed] [Google Scholar]
- 39. Northcott PA, Shih DJ, Peacock J, Garzia L, Morrissy AS, Zichner T et al (2012) Subgroup‐specific structural variation across 1,000 medulloblastoma genomes. Nature 488:49–56. [DOI] [PMC free article] [PubMed] [Google Scholar]
- 40. Picarda E, Ohaegbulam KC, Zang X (2016) Molecular pathways: targeting B7–H3 (CD276) for human cancer immunotherapy. Clin Cancer Res 22:3425–3431. [DOI] [PMC free article] [PubMed] [Google Scholar]
- 41. Ramaswamy V, Remke M, Bouffet E, Bailey S, Clifford SC, Doz F et al (2016) Risk stratification of childhood medulloblastoma in the molecular era: the current consensus. Acta Neuropathol 131:821–831. [DOI] [PMC free article] [PubMed] [Google Scholar]
- 42. Reshmi G, Chandra SS, Babu VJ, Babu PS, Santhi WS, Ramachandran S et al (2011) Identification and analysis of novel microRNAs from fragile sites of human cervical cancer: computational and experimental approach. Genomics 97:333–340. [DOI] [PubMed] [Google Scholar]
- 43. Rossi A, Caracciolo V, Russo G, Reiss K, Giordano A (2008) Medulloblastoma: from molecular pathology to therapy. Clin Cancer Res 14:971–976. [DOI] [PMC free article] [PubMed] [Google Scholar]
- 44. Ryan BM, Robles AI, Harris CC (2010) Genetic variation in microRNA networks: the implications for cancer research. Nat Rev Cancer 10:389–402. [DOI] [PMC free article] [PubMed] [Google Scholar]
- 45. Serrano J, Snuderl M (2018) Whole genome DNA methylation analysis of human glioblastoma using illumina beadarrays. Methods Mol Biol 1741:31–51. [DOI] [PubMed] [Google Scholar]
- 46. Shenoy A, Blelloch RH (2014) Regulation of microRNA function in somatic stem cell proliferation and differentiation. Nat Rev Mol Cell Biol 15:565–576. [DOI] [PMC free article] [PubMed] [Google Scholar]
- 47. Sherr CJ, Beach D, Shapiro GI (2016) Targeting CDK4 and CDK6: from discovery to therapy. Cancer Discov 6:353–367. [DOI] [PMC free article] [PubMed] [Google Scholar]
- 48. Steichen‐Gersdorf E, Baumgartner M, Kreczy A, Maier H, Fink FM (1997) Deletion mapping on chromosome 17p in medulloblastoma. Br J Cancer 76:1284–1287. [DOI] [PMC free article] [PubMed] [Google Scholar]
- 49. Wechsler‐Reya R, Scott MP (2001) The developmental biology of brain tumors. Annu Rev Neurosci 24:385–428. [DOI] [PubMed] [Google Scholar]
- 50. Whiteway SL, Harris PS, Venkataraman S, Alimova I, Birks DK, Donson AM et al (2013) Inhibition of cyclin‐dependent kinase 6 suppresses cell proliferation and enhances radiation sensitivity in medulloblastoma cells. J Neurooncol 111:113–121. [DOI] [PMC free article] [PubMed] [Google Scholar]
- 51. Xu Y, Yao Y, Gao P, Cui Y (2019) Upregulated circular RNA circ_0030235 predicts unfavorable prognosis in pancreatic ductal adenocarcinoma and facilitates cell progression by sponging miR‐1253 and miR‐1294. Biochem Biophys Res Commun 509:138–142. [DOI] [PubMed] [Google Scholar]
- 52. Zhang B, Pan X, Cobb GP, Anderson TA (2007) microRNAs as oncogenes and tumor suppressors. Dev Biol 302:1–12. [DOI] [PubMed] [Google Scholar]
Associated Data
This section collects any data citations, data availability statements, or supplementary materials included in this article.
Supplementary Materials
Figure S1. MiR‐1253, a putative tumor suppressor gene in medulloblastoma. A. Relative base‐pair positions of candidate tumor suppressor genes on chromosome 17p13.3. ABR, activated BCR‐related; HIC1, hypermethylated in cancer 1; MNT, Max‐binding protein; OVCA1/2, ovarian carcinoma 1 and 2; PAFAH1B1, platelet activating factor acetyl‐hydrolase 1b regulatory subunit 1; RPA1, replication protein A1; SMYD4, SET and MYND domain containing 4; TUSC5, tumor suppressor candidate 5; VPS53, vacuolar protein sorting‐associated protein 53 homolog; YWHAE, 14‐3‐3 protein epsilon; miR, microRNA. B. MiR‐1253 expression assessment by in situ hybridization in normal cerebellum, SHH, group 3 and 4 medulloblastomas. Micrographs from Figure 1E presented here at 40x magnification, scale bars 100 um. C. Growth curves from plotted raw O.D. values for MB cell lines transfected with miR‐1253. D. Analysis of scramble miR transfection on cell viability in HDMB03 cells. Cell viability of untransfected HDMB03 cells (NC) compared with scramble‐transfected (Scr, 100 nM), and cells transfected with 100 nM miR‐153 mimic demonstrating lack of toxicity with scramble transfections.
Figure S2. Epigenetic silencing of miR‐1253. A. Subgroup‐specific miR‐1253 methylation patterns (SHH n = 10, Grp3 n = 7, Grp4 n = 12) in a second cohort of patients (procured from collaborators at University of Colorado Anschutz Medical Campus). Analyses carried out in comparison to normal pediatric cerebellum (n = 10) presented in Figure 2. miR‐1253 chr17 location: 2,651,372‐2,651,476. B. Assessment of growth in HDMB03 and D425 cells treated with varying concentrations of 5‐AzaC (1–5.0 μM) over a 96‐h period. Data presented as mean ± S.D from experiments done in triplicates and analyzed using One‐way ANOVA (or Student’s t‐test for Ai); *P < 0.05, **P < 0.005, and ***P < 0.001.
Figure S3. Additional analyses of the negative trophic effects of miR‐1253 in medulloblastoma cells. A. MiR‐1253 expression assessed by RT‐PCR 96 hours after transfection. B, C. Tumor cell proliferation examined over a 72‐hour time frame in (B) DAOY, HDMB03 and (c) D341, D425 cells. Assessment of (D) colony formation, (E) wound healing, (F) migration and (G) invasion in scramble vs miR‐1253‐transfected DAOY cells. Data presented as mean ± SD from experiments done in triplicates and analyzed using One‐way ANOVA with *P < 0.05, **P < 0.005 and ***P < 0.001.
Figure S4. Further biochemical analysis of the effects of miR‐1253 expression restoration in MB tumor cells. A. Western blotting analysis of markers of apoptosis in transiently transfected D341 and D425 cells with tabulated ratios between cleaved and total proteins. B. DAOY and HDMB03 cells transfected with miR‐1253 mimic and inhibitor separately to study the effect on expression of cell cycle markers, CDK4 and CDK6. C–E. D283 cell were transfected with miR‐1253 mimic (100 nM); cell proliferation assay and expression of miR‐1253 targets, CDK6 and CD276 (Western blot), evaluated thereafter.
Figure S5. Putative oncogenic targets and deregulated pathways associated with miR‐1253 silencing. A. Expression analysis by RNA Sequencing of the 47 putative miR‐1253 targets isolated using 3 online miR databases compared to miR‐1253‐transfected HDMB03 cells. Of those observed to be significantly elevated in medulloblastoma are CDK6, CD276, BAZ2A, UHRF1BP1, AGPAT5, TOP2A, PRKAA1, AMOTL1, BML4, MLEC, ECT2, KPNA1, MED13, POLDIP3, NFE2L1, TSG101, PYCR1 and PHB. B. Enriched cellular/biological pathways associated with the 47 unique miR‐1253 targets identified using gene ontology category from consensus path DB (http://cpdb.molgen.mpg.de/). Pathways represented as an inverted bar graph based on the −log P values with threshold P < 0.05. C, D. Specific expression of CDK6 and CD276 in our medulloblastoma patient cohort (adult normal n = 4, pediatric normal n = 7, SHH n = 5, Grp3 n = 9, Grp4 n = 13).
Data Availability Statement
The datasets used and/or analyzed during the current study are available from the corresponding author on reasonable request.