Abstract
Background:
EPIC1 is an oncogenic long non-coding ribonucleic acid (RNA) that promotes cell growth and cell-cycle progression and inhibits apoptosis in several cancer cell lines. However, clinical studies on EPIC1 in breast cancer, specifically in the neoadjuvant setting, are relatively few.
Methods:
Patients treated with weekly paclitaxel–cisplatin-based neoadjuvant chemotherapy after core-needle biopsy were included in the study. Real-time quantitative polymerase chain reaction assays were performed to detect EPIC1 expression.
Results:
Among all patients included in this study (n = 111), higher EPIC1 expression was associated with estrogen receptor negativity, human epidermal growth factor receptor 2 positivity, higher Ki67 index, and higher histologic grade. Multivariate analysis suggested that EPIC1 expression was an independent predictive factor for pathological complete response, with a significant interaction between EPIC1 expression and age. The Kaplan–Meier Plotter dataset suggested that the EPIC1 high-expression group showed a worse 10-year distant metastasis-free survival and post-progression survival when compared with the EPIC1 low-expression group. The Cancer Genome Atlas dataset suggested that the overall survival in the EPIC1 high-expression group was inferior to that in the EPIC1 low-expression group, specifically in hormone receptor (HorR)-positive patients and patients aged <50 years. Pathway analysis revealed the top pathways that indicated the potential mechanisms of EPIC1 in chemoresistance, including the daunorubicin and doxorubicin metabolic processes.
Conclusions:
Our study suggests that EPIC1 may be a promising biomarker for both neoadjuvant chemosensitivity and long-term clinical outcomes in breast cancer, specifically in the HorR-positive premenopausal subgroup. It may also help identify candidate responders and determine treatment strategies.
Keywords: biomarker, breast cancer, EPIC1, long non-coding RNA, neoadjuvant chemotherapy
Introduction
Breast cancer is the leading cause of cancer deaths among women, and newly diagnosed cases of this cancer have been increasing significantly worldwide over the last few decades. Among them, approximately 8–10% of American women are diagnosed with locally advanced breast cancer (LABC) at first visit, while this number approaches 60% in countries with limited resources.1,2 In recent years, neoadjuvant chemotherapy has been the standard treatment for LABC to effectively downstage tumors, and subsequently facilitating surgical treatment. Reportedly, patients who achieved pathological complete response (pCR) following neoadjuvant chemotherapy had significantly improved disease-free survival and overall survival (OS).3–5 To date, there have been several successful neoadjuvant treatment regimens, one of which includes the dual blockade of human epidermal growth factor receptor 2 (HER2). The NeoSphere study demonstrated that the combination of chemotherapy with trastuzumab and pertuzumab favored a higher pCR rate of 45.8%, when compared with chemotherapy with trastuzumab for HER2-positive breast cancer.6 The NeoALTTO trial showed an even more promising pCR rate of 51.3% with trastuzumab and lapatinib combined with chemotherapy.7 However, almost half of the patients failed to achieve pCR. Patients with other breast cancer subtypes were faced with more discouraging therapeutic scenarios. Therefore, distinguishing patients who experience the clinical benefits of neoadjuvant chemotherapy from those who do not is considered necessary before the initiation of chemotherapy. This suggests a need to identify biomarkers to evaluate individual chemosensitivity and even survival outcomes.
Long non-coding ribonucleic acids (lncRNAs) are RNA transcripts longer than 200 nucleotides and are not translated into proteins. Emerging data on lncRNAs suggest that these are important players in gene expression, epigenetic regulation, maintenance of genome stability, aging, and disease development.8–10 The dysregulation of lncRNAs is a recently discovered mechanism of chemoresistance.11 Epigenetically induced lncRNA 1 (EPIC1, also identified as ENSG00000224271) is an intergenic lncRNA located on chr22:q13.31. Data from the University of California Santa Cruz (UCSC) Genome Browser revealed that EPIC1 displays a relatively high level of sequence conservation throughout 30 mammalian species (Supplemental Figure 1).12 Wang et al. demonstrated that EPIC1 is epigenetically activated in breast cancer and is associated with poor survival.13 This oncogenic nuclear lncRNA directly interacts with MYC proto-oncogene (MYC) and subsequently promotes cell-cycle progression in breast cancer.13 Known as a family of regulator genes and proto-oncogenes, MYC is associated with various biological processes, including cell proliferation, differentiation, apoptosis, and stem-cell self-renewal.14 Amplification of MYC was found in the breast tissues after neoadjuvant chemotherapy in patients with triple-negative breast cancer (TNBC), which indicates that MYC may contribute to chemotherapy resistance in TNBC.15 However, it remains unclear whether EPIC1 expression level influences individual clinical benefit from neoadjuvant chemotherapy.
In the light of the above background, we aimed to investigate the predictive and prognostic value of EPIC1 in the neoadjuvant setting for breast cancer. We proposed that the overexpression of EPIC1 might be associated with reduced sensitivity to neoadjuvant chemotherapy, leading to worse survival. This was validated by our prospective data.
Materials and methods
Patients and study design
We conducted a retrospective study of patients enrolled between April 2014 and October 2018 in two prospective neoadjuvant clinical trials, which were separately registered in the ClinicalTrials.gov website as SHPD001 [ClinicalTrials.gov identifier: NCT02199418] and SHPD002 [ClinicalTrials.gov identifier: NCT02221999]. The study protocols of both trials were approved by the Ethics Committee of Renji Hospital, School of Medicine, Shanghai Jiaotong University [SHPD001, approval ID (2014)14K; SHPD002, approval ID (2017)088]. All participants involved in this study provided written informed consents covering biomarker research. A total of 111 patients from these two trials, with adequate and qualified tissue samples for the detection of EPIC1 expression, were enrolled in this study.
Details of the treatment protocols have been reported previously.16 For all patients, paclitaxel at 80 mg/m² was intravenously administered weekly starting on days 1, 8, 15, and 22, and cisplatin at 25 mg/m² was administered on days 1, 8, and 15, every 28 days for four cycles. HER2-positive patients were allowed treatment with trastuzumab concomitantly, at a loading dose of 4 mg/kg, followed by a maintenance dose of 2 mg/kg on day 1, weekly, for 16 weeks. For hormone receptor (HorR)-positive patients in SHPD002, endocrine therapy with an aromatase inhibitor or a gonadotropin-releasing hormone agonist was randomized together with chemotherapy according to the patients’ menopausal status. The patients underwent surgery sequentially after receiving neoadjuvant chemotherapy.
Tissue samples and clinical data collection
All clinical data were prospectively collected upon enrollment of patients (Table 1). Fresh cancer tissue samples were collected from the patients using core-needle biopsy before they underwent neoadjuvant treatment at the Department of Breast Surgery, Renji Hospital, School of Medicine, Shanghai Jiaotong University. The samples were obtained immediately after biopsy, frozen in liquid nitrogen, and stored at −80°C until RNA extraction. All tissues were histologically diagnosed as invasive breast cancer by the Department of Pathology, Renji Hospital. Estrogen receptor (ER) and progesterone receptor (PR) status was considered positive if 1% or more of tumor cells exhibited positive nuclear staining by immunohistochemistry (IHC). HER2 positivity was defined as 3+ by IHC or amplification by fluorescence in situ hybridization according to the recommendations of the American Society of Clinical Oncology/College of American Pathologists in 2013.17 We used a Ki67 index value of 20% to separate the groups. The molecular subtype was categorized into luminal-A like (ER or PR positive, HER2 negative, and Ki67 index <20%), luminal-B like (ER or PR positive; HER2 negative, and Ki67 index ⩾20% or HER2 positive and any Ki67 index), HER2 positive (ER and PR negative, and HER2 positive), and basal like (ER, PR, and HER2 negative), according to the St Gallen International Expert Consensus.18
Table 1.
Associations between EPIC1 expression level and baseline clinicopathological characteristics.
| Characteristics | EPIC1 low (n = 27) | EPIC1 high (n = 84) | p value |
|---|---|---|---|
| Age (years) | 0.299 | ||
| ⩾50 | 14 (51.9%) | 53 (63.1%) | |
| <50 | 13 (48.1%) | 31 (36.9%) | |
| Median (range) | 50 (26–70) | 53 (31–69) | |
| Menopausal status | 0.207 | ||
| Premenopausal | 15 (55.6%) | 35 (41.7%) | |
| Postmenopausal | 12 (44.4%) | 49 (58.3%) | |
| T stage | 0.792 | ||
| T2 | 6 (22.2%) | 14 (16.7%) | |
| T3 | 13 (48.2%) | 45 (53.5%) | |
| T4 | 8 (29.6%) | 25 (29.8%) | |
| N stage | 0.268 | ||
| N0 | 1 (3.7%) | 9 (10.7%) | |
| N1–N3 | 26 (96.3%) | 75 (89.3%) | |
| ER status | 0.381 | ||
| ER positive | 18 (66.7%) | 48 (57.1%) | |
| ER negative | 9 (33.3%) | 36 (42.9%) | |
| PR status | 0.822 | ||
| PR positive | 18 (66.7%) | 54 (64.3%) | |
| PR negative | 9 (33.3%) | 30 (35.7%) | |
| HER2 status | 0.001 | ||
| HER2 positive | 4 (14.8%) | 42 (50.0%) | |
| HER2 negative | 23 (85.2%) | 42 (50.0%) | |
| Ki67 index | 0.226 | ||
| ⩾20% | 24 (88.9%) | 78 (92.9%) | |
| <20% | 3 (11.1%) | 6 (7.1%) | |
| Histologic grade | 0.034 | ||
| G2 | 13 (48.1%) | 21 (25.0%) | |
| G3 | 14 (51.9%) | 55 (65.5) | |
| Unevaluable | 0 (0%) | 8 (9.5%) | |
| Molecular subtype | 0.149 | ||
| Luminal-A like | 3 (11.1%) | 3 (3.6%) | |
| Luminal-B like | 17 (63.0%) | 58 (69.0%) | |
| HER2 positive | 1 (3.7%) | 12 (14.3%) | |
| Basal like | 6 (22.2%) | 11 (13.1%) |
The p values are calculated using the chi-squared test.
ER, estrogen receptor; HER2, human epidermal growth factor receptor 2; N stage, nodal stage; PR, progesterone receptor; T stage, tumor stage.
Ribonucleic acid extraction and reverse transcription quantitative polymerase chain reaction assays
Total RNA was extracted from tissues using TRIzol reagent (Molecular Research Center, Ohio, USA) and subsequently reverse transcribed to complementary deoxyribonucleic acid (cDNA) using PrimerScript™ RT Master Mix (Takara, Shiga, Japan) on a SimpliAmp™ Thermal Cycler (Applied Biosystems, Massachusetts, USA) following the manufacturer’s instructions. Obtained cDNAs were quantified with a reverse transcription quantitative polymerase chain reaction (RT-qPCR) test labeled with SYBR® green (Invitrogen, California, USA) on LightCycler® 96 (Roche, Mannheim, Germany). The gene-specific primers used were as follows: glyceraldehyde-3-phosphate dehydrogenase (GAPDH) forward, GGTGAAGGTCGGAGTCAACG; GAPDH reverse, TGGGTGGAATCATATTGGAACA; EPIC1 forward, TATCCCTCAGAGCTCCTGCT; and EPIC1 reverse, AGGCTGGCAAGTGTGAATCT. Gene expression levels were normalized to GAPDH expression19 using the 2−△CT method. Each cDNA sample was triplicated in 96-microwell plates.
Gene ontology, Kyoto encyclopedia of genes and genomes pathway, and protein–protein interaction network analyses
The RNA-binding proteins (RBPs) were predicted from starBase (http://starbase.sysu.edu.cn/) and subsequently used to perform Kyoto Encyclopedia of Genes and Genomes (KEGG) pathways using DAVID (https://david.ncifcrf.gov/), gene ontology (GO) categories, and protein–protein interaction (PPI) network by STRING (https://string-db.org/). The RNA-Seq data (GSE98538) of MCF-7 cells after EPIC1 knockdown were downloaded from the Gene Expression Omnibus (GEO), and the downregulated genes with a fold change (FC) ⩾2.0 were used to analyze GO categories and KEGG pathways.
Statistical analyses
The expression of EPIC1 was calculated as log(EPIC1 × 105). High EPIC1 expression was defined as its relative expression ⩾2.3, which was the lower quartile of all expression data. The associations between all the baseline clinicopathological characteristics [age, ⩾50 versus <50 years; premenopausal versus postmenopausal; tumor (T) stage, 3–4 versus 2; nodal (N) stage, 1–3 versus 0; ER positive versus negative; PR positive versus negative; HER2 positive versus negative; Ki67 index ⩾20% versus <20%; histologic grade, 3 versus 2 versus unevaluable; and molecular subtype, luminal-A like versus luminal-B like versus HER2 positive versus basal like] and EPIC1 expression levels (high versus low) were calculated using the chi-squared test, and EPIC1 expression value as a continuous variable was further compared by subgroups (T stage, 2 versus 3 versus 4; N stage, 0 versus 1 versus 2 versus 3; molecular subtype, luminal-A like versus luminal-B like versus HER2 positive versus basal like; ER positive versus negative; PR positive versus negative; and Ki67 index ⩾20% versus <20%) using the Mann–Whitney U test.
The endpoint of this study was pCR, which was defined as the absence of invasive cancer in the breast and no residual cancer cells in lymph node samples obtained at the time of surgery. Univariate and multivariate logistic regression models were used to evaluate the associations between EPIC1 expression levels (high versus low) and pCR, and to investigate the potential interactions between EPIC1 expression and clinicopathological characteristics (age, menopausal status, T stage, N stage, ER status, PR status, HER2 status, Ki67 index, histologic grade, and molecular subtype) for pCR.
The receiver operating characteristic (ROC) curves were generated to identify whether EPIC1 combined with important clinicopathological characteristics or American Joint Committee on Cancer (AJCC) stage (8th edition)20 could better predict the patients’ responses to therapy. The following four models were used through logistic regression: model 1, incorporating EPIC1 expression, age, T stage, N stage, ER status, PR status, HER2 status, and Ki67 index; model 2, including all the factors in model 1 except EPIC1 expression; model 3, integrating EPIC1 expression and AJCC stage; and model 4, AJCC stage alone. The areas under the curve (AUCs) were compared using the z-test.
The estimated median follow-up time was calculated using the reverse Kaplan–Meier method. The Kaplan–Meier Plotter website (http://kmplot.com/analysis/) was used to verify the prognostic value of EPIC1 expression in distant metastasis-free survival (DMFS), post-progression survival (PPS), and OS. The Cancer Genome Atlas (TCGA) dataset was downloaded (https://portal.gdc.cancer.gov/) and normalized to estimate OS by EPIC1 expression levels using the Kaplan–Meier survival curves examined by the stratified log-rank test, where median EPIC1 expression was used to separate groups. Further, patients were stratified according to HorR status (positive versus negative), HER2 status (positive versus negative), and pathological T stage (pT3–pT4 versus pT1–pT2).
All statistical analyses were performed using GraphPad 8.0 (GraphPad Software LLC, California, USA) or R language version 3.5.1 (www.r-project.org). The results were considered significant when the p value was <0.05.
Results
Baseline characteristics
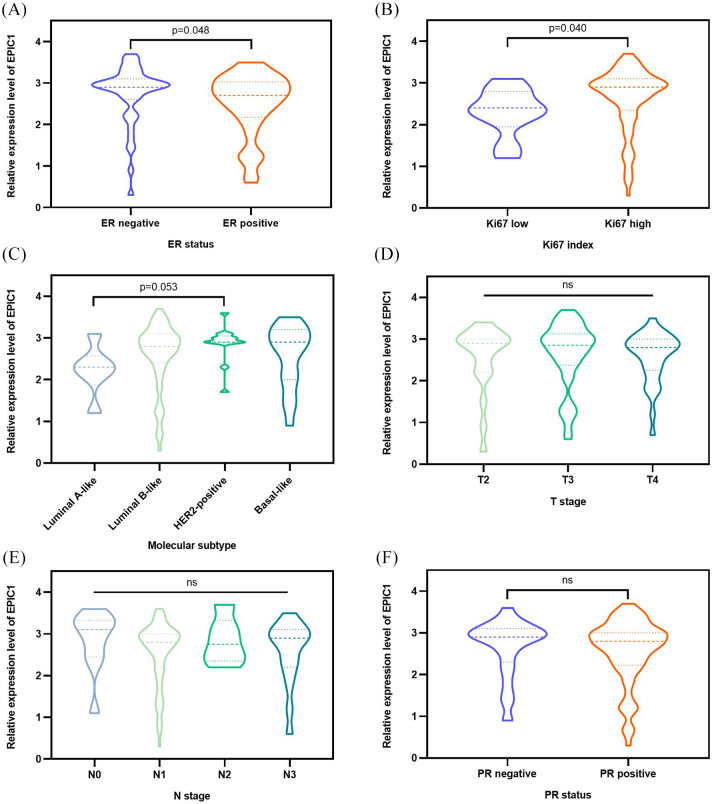
Of the 111 patients, 84 (75%) were classified into the high-expression group and 27 (25%) into the low-expression group. Above all, we investigated the associations between baseline clinicopathological characteristics and EPIC1 expression as categorical variables. Patients with high EPIC1 expression were more likely to be HER2 positive (p = 0.001) with higher histologic grade (p = 0.034), when compared with patients with low EPIC1 expression (Table 1). To further determine the associations between EPIC1 expression and other clinicopathological features, we compared the EPIC1 expression value as a continuous variable according to different subgroups. Higher EPIC1 expression was associated with ER negativity [p = 0.048; Figure 1(a)] and higher Ki67 index [p = 0.040; Figure 1(b)]. Additionally, HER2-positive patients exhibited higher EPIC1 expression with marginal significance, compared with that of luminal A-like patients [p = 0.053; Figure 1(c)]. However, significant differences regarding T stage [Figure 1(d)], N stage [Figure 1(e)], or PR status [Figure 1(f)] were not observed between groups.
Figure 1.
Associations between EPIC1 expression and clinicopathological characteristics of all patients.
Associations between EPIC1 expression and ER (a), Ki67 (b), molecular subtype (c), T stage (d), N stage (e), and PR (f). The p values are calculated using the Mann–Whitney U test.
ER, estrogen receptor; N stage, nodal stage; ns, not significant; PR, progesterone receptor; T stage, tumor stage.
EPIC1 expression and pCR outcomes
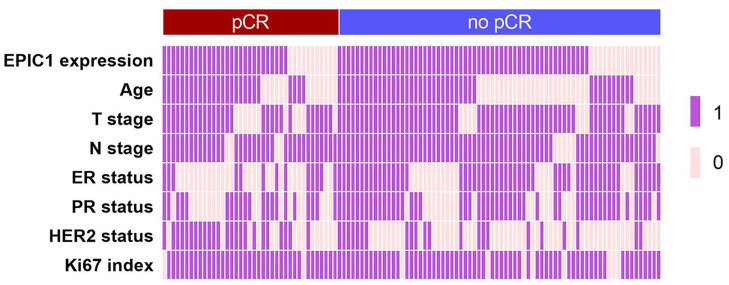
Patients with high EPIC1 expression achieved a lower pCR rate (33.3%) compared with patients with low EPIC1 expression (40.7%; Figure 2), although the difference was not significant [odds ratio (OR) = 0.727; 95% confidence interval (CI) 0.298–1.774; p = 0.484; Table 2]. Multivariate analysis suggested that EPIC1 expression was an independent predictive factor for pCR (OR = 0.278; 95% CI 0.082–0.935; p = 0.039; Table 2). Additionally, T stage (OR = 0.241; 95% CI 0.071–0.814; p = 0.022), ER status (OR = 0.132; 95% CI 0.039–0.446; p = 0.001), and HER2 status (OR = 6.482; 95% CI 2.254–18.639; p = 0.001) were also independent predictive factors for pCR (Table 2). No significant association was observed between pCR and any other potential factors including age, N stage, PR status, or Ki67 index.
Figure 2.
Clinicopathological features of pathological complete response (pCR; n = 39) and no-pCR (n = 72) patients.
Two-category data (EPIC1 expression high versus low, age ⩾50 versus <50 years, T stage 3–4 versus 2, N stage 1–3 versus 0, ER positive versus negative, PR positive versus negative, HER2 positive versus negative, and Ki67 index ⩾20% versus <20%) are shown with values 1 and 0, respectively.
ER, estrogen receptor; HER2, human epidermal growth factor receptor 2; N stage, nodal stage; PR, progesterone receptor; T stage, tumor stage.
Table 2.
Univariate and multivariate analyses for the predictive factors of pathological complete response.
| Variables | Comparison for OR | Univariate analysis (n = 111) |
Multivariate analysis (n = 111) |
||||||
|---|---|---|---|---|---|---|---|---|---|
| OR | 95% CI | p value | OR | 95% CI | p value | ||||
| EPIC1 | High versus low expression | 0.727 | 0.298 | 1.774 | 0.484 | 0.278 | 0.082 | 0.935 | 0.039 |
| Age | ⩾50 versus <50 years | 1.512 | 0.671 | 3.410 | 0.319 | 0.679 | 0.227 | 2.031 | 0.489 |
| T stage | T3–T4 versus T2 | 0.364 | 0.136 | 0.976 | 0.045 | 0.241 | 0.071 | 0.814 | 0.022 |
| N stage | N1–N3 versus N0 | 0.795 | 0.210 | 3.007 | 0.736 | 0.495 | 0.085 | 2.896 | 0.435 |
| ER status | Positive versus negative | 0.179 | 0.077 | 0.418 | <0.001 | 0.132 | 0.039 | 0.446 | 0.001 |
| PR status | Positive versus negative | 0.480 | 0.214 | 1.079 | 0.076 | 1.088 | 0.345 | 3.431 | 0.886 |
| HER2 status | Positive versus negative | 3.636 | 1.606 | 8.232 | 0.002 | 6.482 | 2.254 | 18.639 | 0.001 |
| Ki67 index | ⩾20% versus <20% | 2.313 | 0.466 | 11.471 | 0.305 | 1.230 | 0.171 | 8.833 | 0.837 |
Bold numerals indicate statistical significance.
CI, confidence interval; ER, estrogen receptor; HER2, human epidermal growth factor receptor 2; N stage, nodal stage; OR, odds ratio; PR, progesterone receptor; T stage, tumor stage.
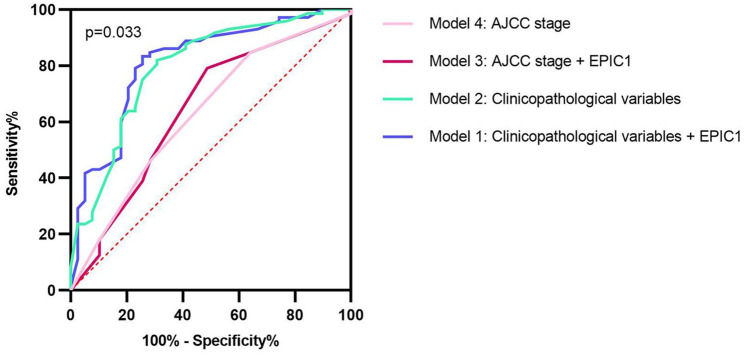
Furthermore, we compared the accuracy of different models using the ROC curves to evaluate the predictive value of EPIC1 for pCR. The largest AUC was 0.812 when combining EPIC1 expression with clinicopathological variables. Moreover, the AUCs of the considered clinicopathological variables, EPIC1 expression combined with AJCC stage, and AJCC stage alone were 0.795, 0.644, and 0.630, respectively (p = 0.033; Figure 3).
Figure 3.
Receiver operating characteristic curves of different predictive models for pathological complete response.
The blue line exhibits model 1 (AUC 0.812, incorporating EPIC1 expression, age, T stage, N stage, ER status, PR status, HER2 status, and Ki67 index). The green line shows model 2 (AUC 0.795, including all the factors in model 1 except EPIC1 expression). The red line represents model 3 (AUC 0.644, integrating EPIC1 expression and AJCC stage). The pink line is presented with model 4 (AUC 0.630, AJCC stage alone). The AUC values are compared using the z-test.
AJCC, American Joint Committee on Cancer; AUC, area under the curve; ER, estrogen receptor; HER2, human epidermal growth factor receptor 2; N stage, nodal stage; PR, progesterone receptor; T stage, tumor stage.
Subgroup analysis of the pCR outcome
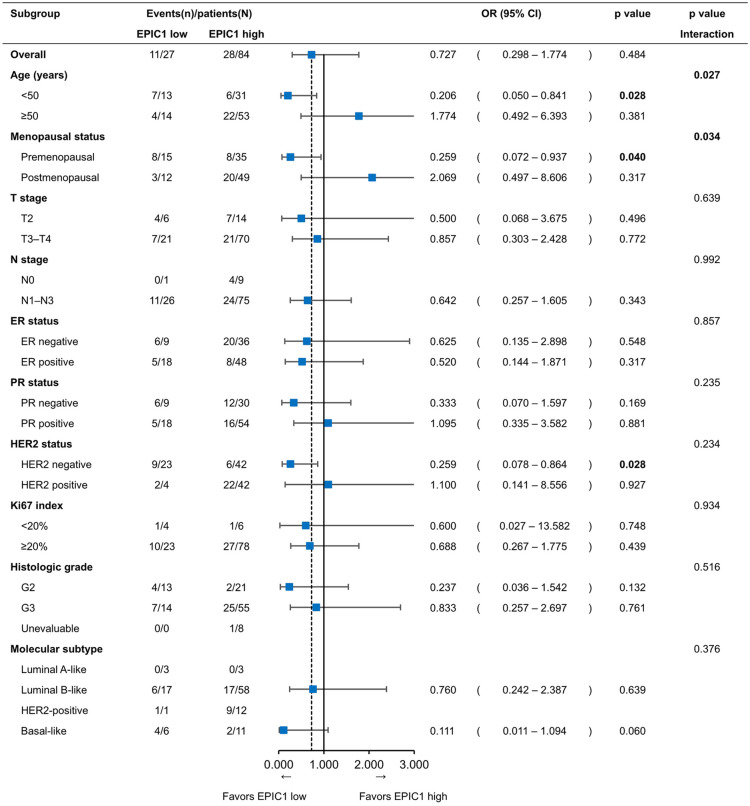
According to age, the subgroup analysis showed that the pCR rate was significantly lower (19.4%) with high EPIC1 levels than that with low EPIC1 levels (53.8%) in patients aged <50 years (OR = 0.206; 95% CI 0.050–0.841; p = 0.028; Figure 4), whereas the pCR rates for high and low EPIC1 levels were 41.5% and 28.6%, respectively, in patients aged ⩾50 years (OR = 1.774; 95% CI 0.492–6.393; p = 0.381; Figure 4). A significant interaction between EPIC1 expression and age was observed (p = 0.027; Figure 4), which remained significant after adjustment (adjusted p = 0.008). Similarly, subgroup analysis by menopausal status showed that the pCR rates were 22.9% with high EPIC1 levels and 53.3% with low EPIC1 levels in premenopausal patients (OR = 0.259; 95% CI 0.072–0.937; p = 0.040; Figure 4), whereas the corresponding rates were 40.8% and 25%, respectively, in postmenopausal patients (OR = 2.069; 95% CI 0.497–8.606; p = 0.317; Figure 4). A significant interaction between EPIC1 expression and menopausal status was observed (p = 0.034; Figure 4), which was marginally significant after adjustment (adjusted p = 0.091).
Figure 4.
Subgroup analysis for pathological complete response according to EPIC1 expression levels.
ORs are derived from the logistic regression model. Interaction p values are presented between different subgroups and the expression level of EPIC1.
CI, confidence interval; ER, estrogen receptor; HER2, human epidermal growth factor receptor 2; OR, odds ratio; PR, progesterone receptor.
To further investigate this phenomenon, we calculated the interaction in the HorR-positive and HorR-negative subgroups separately. The results showed that the interaction between age and EPIC1 expression was observed in the HorR-positive subgroup (adjusted p = 0.036) rather than in the HorR-negative subgroup (adjusted p = 0.996).
Moreover, the pCR rate of HER2-negative patients was 14.3% in the EPIC1 high-expression group, which was significantly lower than that in the EPIC1 low-expression group (39.1%) (OR = 0.259; 95% CI 0.078–0.864; p = 0.028; Figure 4). This remained significant after adjustment (OR = 0.225; 95% CI 0.056–0.909; p = 0.036; Table 3).
Table 3.
Univariate and multivariate analyses for the predictive factors of pathological complete response in human epidermal growth factor receptor 2-negative patients.
| Variables | Comparison for OR | Univariate analysis (n = 65) |
Multivariate analysis (n = 65) |
||||||
|---|---|---|---|---|---|---|---|---|---|
| OR | 95% CI | p value | OR | 95% CI | p value | ||||
| EPIC1 | High versus low expression | 0.259 | 0.078 | 0.864 | 0.028 | 0.225 | 0.056 | 0.909 | 0.036 |
| Age | ⩾50 versus <50 years | 0.688 | 0.216 | 2.189 | 0.526 | 0.257 | 0.051 | 1.292 | 0.099 |
| T stage | T3–T4 versus T2 | 0.244 | 0.066 | 0.901 | 0.034 | 0.238 | 0.047 | 1.215 | 0.084 |
| N stage | N1–N3 versus N0 | 1.556 | 0.167 | 14.455 | 0.698 | 1.109 | 0.093 | 13.256 | 0.935 |
| ER status | Positive versus negative | 0.259 | 0.078 | 0.864 | 0.028 | 0.177 | 0.029 | 1.066 | 0.059 |
| PR status | Positive versus negative | 0.490 | 0.150 | 1.596 | 0.236 | 1.161 | 0.213 | 6.326 | 0.863 |
| Ki67 index | ⩾20% versus <20% | 1.909 | 0.211 | 17.243 | 0.565 | 1.563 | 0.097 | 25.113 | 0.753 |
Bold numerals indicate statistical significance.
CI, confidence interval; ER, estrogen receptor; N stage, nodal stage; OR, odds ratio; PR, progesterone receptor; T stage, tumor stage.
EPIC1 expression and survival
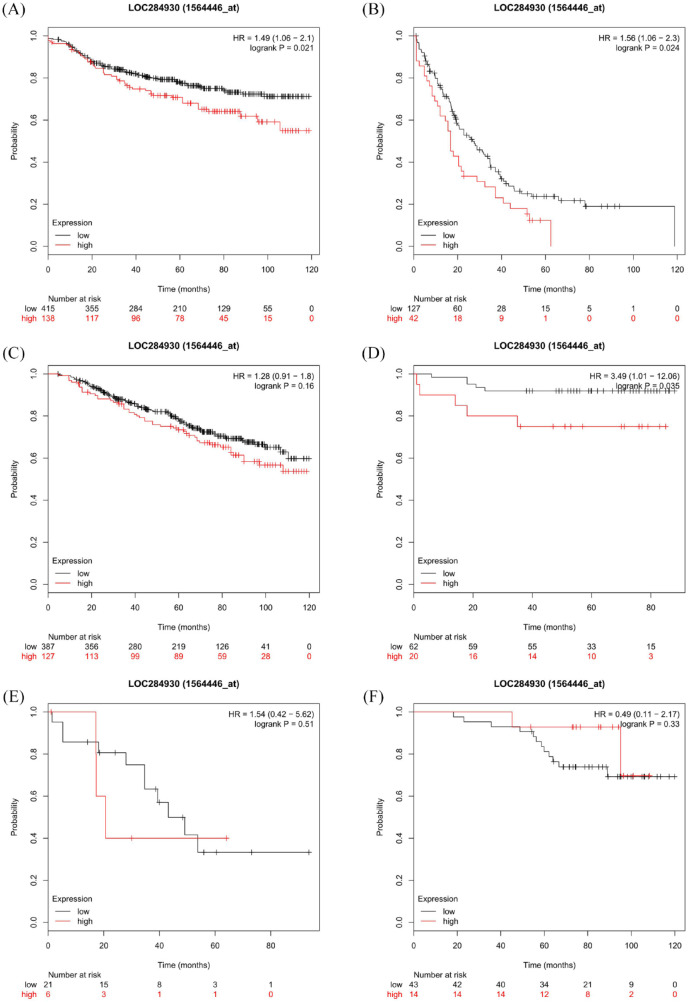
The median follow-up time of all patients (n = 111) was 16.4 months. Since the follow-up time was considered insufficient to perform survival analysis, we performed Kaplan–Meier estimates of survival according to EPIC1 expression level using the Kaplan–Meier Plotter website, in all available breast cancer patients.21 Compared with the EPIC1 low-expression group, the overexpression group showed a significantly worse 10-year DMFS [n = 553; log-rank p = 0.021; hazard ratio (HR) = 1.49; 95% CI 1.06–2.1; Figure 5(a)] and 10-year PPS [n = 169; log-rank p = 0.024; HR = 1.56; 95% CI 1.06–2.3; Figure 5(b)]. However, a significant difference in 10-year OS was not observed between the two groups [n = 514; log-rank p = 0.16; HR = 1.28; 95% CI 0.91–1.8; Figure 5(c)]. Additionally, in the group of HER2-negative patients, EPIC1 high-expression patients had a worse 10-year DMFS than EPIC1 low-expression patients [n = 82; log-rank p = 0.035; HR = 3.49; 95% CI 1.01–12.06; Figure 5(d)]. However, significant differences in PPS [n = 27; log-rank p = 0.51; HR = 1.54; 95% CI 0.42–5.62; Figure 5(e)] or OS [n = 57; log-rank p = 0.33; HR = 0.49; 95% CI 0.11–2.17; Figure 5(f)] were not observed between the two groups.
Figure 5.
Kaplan–Meier survival curves according to EPIC1 expression in Kaplan-Meier Plotter datasets.
Kaplan–Meier estimates of distant metastasis-free survival (DMFS) (a); post-progression survival (PPS) (b); and overall survival (OS) (c) for all patients; and DMFS (d); PPS (e); and OS (f) for human epidermal growth factor receptor 2-negative patients.
The p values are calculated using the log-rank test. Hazard ratios are derived from the Cox proportional hazards regression model.
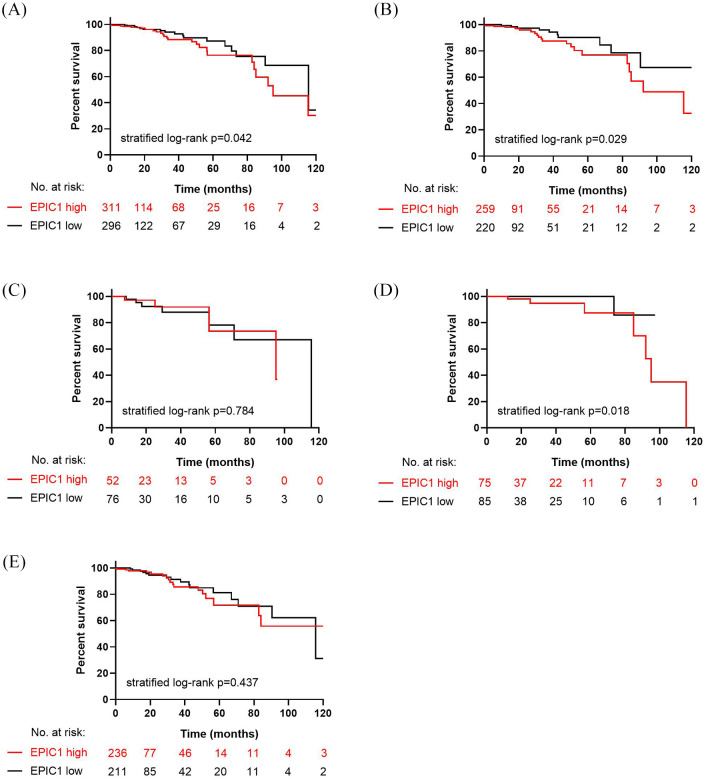
Among the 607 patients with breast cancer in the TCGA cohorts, we observed that the OS in the EPIC1 high-expression group was significantly inferior to that in the EPIC1 low-expression group [stratified log-rank p = 0.042; Figure 6(a)]. In HorR-positive patients, a significantly worse OS was observed in the EPIC1 high-expression group compared with that in the EPIC1 low-expression group [n = 479; stratified log-rank p = 0.029; Figure 6(b)], whereas a significant difference was not observed between the two groups in HorR-negative patients [n = 128; stratified log-rank p = 0.784; Figure 6(c)]. Moreover, for patients aged <50 years, the EPIC1 high-expression group derived a significantly poorer OS [n = 160; stratified log-rank p = 0.018; Figure 6(d)], while no difference was detected between EPIC1 high- and low-expression groups for patients aged ⩾50 years [n = 447; stratified log-rank p = 0.437; Figure 6(e)].
Figure 6.
Kaplan–Meier estimates of overall survival according to EPIC1 expression in The Cancer Genome Atlas cohorts.
Kaplan–Meier estimates of overall survival for all patients (a); hormone receptor (HorR)-positive patients (b); HorR-negative patients (c); patients aged < 50 years (d); and patients aged ⩾50 years (e).
The p values are calculated using the stratified log-rank test.
GO, KEGG, and PPI network analyses
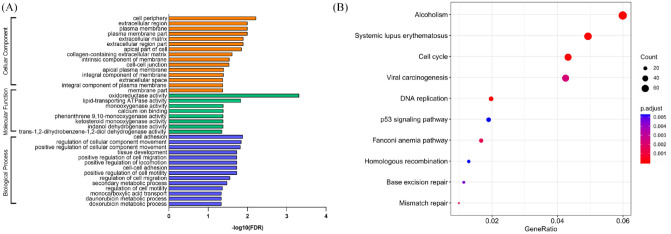
To investigate the potential mechanism of action of EPIC1 in response to neoadjuvant chemotherapy, we downloaded RNA-Seq data GSE98538 in MCF-7 cells after EPIC1 knockdown from GEO and analyzed the downregulated genes with an FC ⩾2.0 using GO categories22 and KEGG pathways.23,24 The enriched GO terms were related to cellular component (CC), molecular function (MF), and biological process (BP) [Figure 7(a)]. The BP of EPIC1 in daunorubicin and doxorubicin metabolism highlighted its potential effects on chemotherapy resistance. Here, we identified the top 10 KEGG pathways, including cell cycle, DNA replication, p53 signaling, homologous recombination, base excision repair, and mismatch repair [Figure 7(b)].
Figure 7.
Gene ontology categories and Kyoto Encyclopedia of Genes and Genomes pathways associated with genes downregulated by EPIC1 siRNA knockdown.
Gene ontology categories (a); and Kyoto Encyclopedia of Genes and Genomes pathways (b) associated with genes downregulated by EPIC1 siRNA knockdown.
DNA, deoxyribonucleic acid; FDR, false discovery rate; siRNA, short interfering ribonucleic acid.
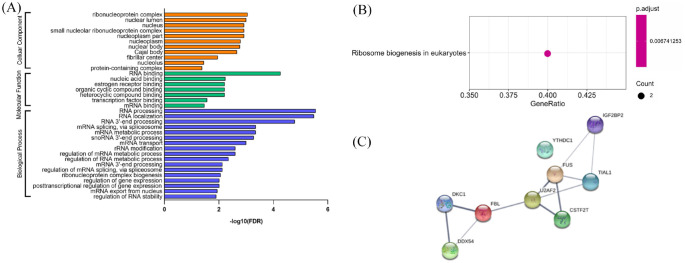
To further determine the potential role of EPIC1, we also predicted its RBPs25 and subsequently performed GO analysis and KEGG pathway analysis to annotate the function of RBPs. The significant GO terms related to BP were RNA processing, RNA localization, messenger RNA (mRNA) metabolic process, and mRNA splicing via spliceosome. The significant terms related to CC were ribonucleoprotein complex, nuclear lumen, nucleoplasm part, small nucleolar ribonucleoprotein complex, and nucleus. Additionally, the significant terms of MF were RNA binding, nucleic acid binding, heterocyclic compound binding, organic cyclic compound binding, and ER binding [Figure 8(a)]. The key KEGG pathway of RBPs was ribosome biogenesis in eukaryotes [Figure 8(b)]. We also identified PPIs between the RBPs of EPIC1 based on STRING22 [Figure 8(c)].
Figure 8.
Gene ontology categories, Kyoto Encyclopedia of Genes and Genomes pathways, and protein–protein interaction network associated with RNA-binding proteins of EPIC1.
Gene ontology categories (a); Kyoto Encyclopedia of Genes and Genomes pathways (b); and protein–protein interaction network (c) associated with RNA-binding proteins of EPIC1.
FDR, false discovery rate; RNA, ribonucleic acid.
Discussion
To the best of our knowledge, our study is the first to identify EPIC1 as a predictive biomarker of the efficacy of neoadjuvant chemotherapy for LABC, specifically in HorR-positive premenopausal and HER2-negative patients. Additionally, we first demonstrated the associations between EPIC1 expression and aggressive baseline tumor features. Moreover, we revealed, for the first time, the prognostic value of EPIC1 for long-term outcomes in premenopausal, HorR-positive, and HER2-negative breast cancer patients.
We observed that EPIC1 expression was positively associated with baseline HER2 expression, Ki67 index, and histologic grade, but negatively associated with ER expression in breast cancer patients. The malignant biological behavior of EPIC1-overexpressed tumors is supported by previous basic studies to a certain extent. Wang et al. revealed that EPIC1 knockdown resulted in a decrease in cell proliferation, and G0/G1 arrest in MCF-7 and ZR-75-1 breast cancer cells.13 The same phenomenon was observed in other tumors. Zhang et al. reported that silencing EPIC1 in the lung-cancer cell line A549 inhibited cell growth and proliferation and induced G1/S cell-cycle arrest and apoptosis in these cells.26 Li et al. confirmed that EPIC1 knockdown in cholangiocarcinoma KKU-214 cells suppressed cell growth and colony formation and elicited cell apoptosis.27 To further investigate the association between tumor characteristics and EPIC1, we performed GO analysis and KEGG pathway analysis of its RBPs. This suggests that two of the RBPs, DEAD-box helicase 54 (DDX54) and FUS RBP (FUS), could function in the process of ER binding. While DDX54 binds to ERα and represses its stimulation,28 the inability to transactivate estrogen response element because of the β-catenin-induced change in the splicing of ERβ can be repressed by FUS.29 This implied potential pathways between EPIC1 and ER. Additionally, the PPI network may offer potential associations between RBPs of EPIC1 in carcinogenesis, which requires further validation.
In parallel, our clinical data revealed for the first time that EPIC1 is an independent predictive factor for pCR, with its low expression contributing to a significantly higher pCR rate. To date, few clinical studies have focused on the predictive value of EPIC1 for neoadjuvant chemotherapy in breast cancer. However, several basic studies theoretically support our study. We know that in breast cancer, EPIC1 directly interacts with MYC through the 129–283 nt region.13 Sun et al. indicated that c-Myc was activated in cisplatin-resistant ovarian cancer patients and was associated with poor prognosis.30 Moreover, Wang et al. demonstrated that the overexpression of EPIC1 led to resistance to targeted therapy with bromodomain and extra-terminal motif inhibitors iBET762 and JQ-1 in the breast cancer cell lines MCF-7 and A549 through increased transcriptional activity of MYC.31 On the other hand, GO categories indicated that the aldo-keto reductase (AKR) family, a protein family downregulated after silencing EPIC1, participates in the cellular metabolism of daunorubicin and doxorubicin. Zhong et al. reported that the overexpression of AKR1B10, a member of the AKR family, caused resistance to daunorubicin in the lung-cancer cell line, NCI-H460,32 and Matsunaga et al. found that colorectal cancer (LoVo) cells and gastric cancer (MKN45) cells developed resistance to doxorubicin because of the autophagy suppressed by AKR1B10 upregulation.33 Thus, the potential pathway between EPIC1 and the AKR family might be crucial in the development of resistance to chemotherapeutic drugs. Furthermore, the RBP DDX54 exerted a significant impact on DNA damage response-related pathologies through the regulation of transcriptome dynamics,34 which may also be the potential mechanism by which EPIC1 weakens individual responses to chemotherapy. It may be important to determine the mechanism of EPIC1 in chemoresistance in future studies. Therefore, in vivo and in vitro experiments are required to validate these hypotheses.
Additionally, the current study identified a significant interaction between age, as well as menopausal status of patients, and EPIC1 expression for pCR. We postulated that this phenomenon might be associated with the different estrogen levels between younger and older individuals. To investigate this phenomenon, we further calculated the interaction in the HorR-positive and HorR-negative subgroups. The results showed that the interaction between age and EPIC1 expression was also observed in the HorR-positive subgroup, but not in the HorR-negative subgroup. Therefore, the improved efficacy of chemotherapy for EPIC1 low-expression patients is probably associated with estrogen levels, the HorR pathway, or both.
Although our neoadjuvant trials have an insufficient follow-up period to perform survival analysis, the results from the Kaplan–Meier Plotter analyses indicated a significantly better DMFS and PPS, with decreased expression of EPIC1, and the analyses of TCGA dataset demonstrated a significantly better OS with low EPIC1 expression, which may provide some clinical significance. These findings are supported by those of Wang et al., where hypomethylation induced by the increased EPIC1 expression was consistently associated with poor survivals, in six independent cohorts of 905 patients with breast tumors.13 Notably, we first demonstrated the prognostic value of EPIC1 in premenopausal breast cancer patients, since the TCGA dataset suggested that patients aged <50 years achieved a better OS with low EPIC1 expression than did patients with high EPIC1 expression. We also first identified its prognostic value in both HorR-positive and HER2-negative breast cancer patients, since the results of the TCGA dataset suggested that HorR-positive patients had better OS and the Kaplan–Meier Plotter showed that HER2-negative patients had higher DMFS, for those with low EPIC1 expression. All survival results were consistent with the pCR rates in our study. Longer follow-up periods are required in future studies.
Our study has several limitations. First, the sample size was relatively small. Nevertheless, our study performed a retrospective analysis based on prospective trials, providing a hint for the underlying rules. Validation in independent cohorts and functional analyses will be necessary to provide insight into the biomarker potential of EPIC1 in breast cancer in future research. Second, the follow-up time was not mature to perform survival analysis for our patients. However, we obtained a supportive result for survival using public databases with a 10-year follow-up time, though it may not completely represent the prognosis of patients treated with neoadjuvant therapy. Thus, prolonged follow-up periods in the future may help to achieve long-term clinical outcomes.
Conclusion
In summary, our study revealed that EPIC1 is not only a novel biomarker for predicting pCR in patients receiving neoadjuvant chemotherapy, but also a prognostic indicator for breast cancer, specifically in HorR-positive premenopausal patients. The potential pathways of chemoresistance between EPIC1 and ER, DDX54, or AKR family are indicated. Our results may help to further identify candidate responders and guide treatment strategies. The mechanisms of EPIC1 in chemoresistance need to be elucidated by further studies.
Supplemental Material
Supplemental material, Supplementary_Figure_1 for Predictive and prognostic value of EPIC1 in patients with breast cancer receiving neoadjuvant chemotherapy by Yaqian Xu, Yan Wang, Chenwei Yuan, Xiaonan Sheng, Rui Sha, Huijuan Dai, Shan Zhang, Yaohui Wang, Yanping Lin, Liheng Zhou, Shuguang Xu, Jie Zhang, Wenjin Yin and Jinsong Lu in Therapeutic Advances in Medical Oncology
Supplemental material, Supplementary_Materials_-_description for Predictive and prognostic value of EPIC1 in patients with breast cancer receiving neoadjuvant chemotherapy by Yaqian Xu, Yan Wang, Chenwei Yuan, Xiaonan Sheng, Rui Sha, Huijuan Dai, Shan Zhang, Yaohui Wang, Yanping Lin, Liheng Zhou, Shuguang Xu, Jie Zhang, Wenjin Yin and Jinsong Lu in Therapeutic Advances in Medical Oncology
Acknowledgments
Yaqian Xu and Yan Wang contributed equally to this work. We would like to thank all the investigators for participating in the present study.
Footnotes
Author contributions: JS Lu, WJ Yin, YQ Xu, and Y Wang designed and conducted the study. YQ Xu and Y Wang drafted the manuscript. WJ Yin and JS Lu revised the manuscript. YQ Xu and XN Sheng performed the data analysis. YH Wang, YP Lin, SG Xu, J Zhang, and WJ Yin collected clinical data and tissue samples. CW Yuan, R Sha, XN Sheng, HJ Dai, and S Zhang performed the RNA extraction. YQ Xu performed the RT-qPCR assay. All authors have read and approved the final manuscript.
Conflict of interest statement: The authors declare that there is no conflict of interest.
Ethical disclosure: The study protocols of both trials were approved by the Ethics Committee of Renji Hospital, School of Medicine, Shanghai Jiaotong University [SHPD001, approval ID (2014)14K; SHPD002, approval ID (2017)088]. All participants involved in this study provided written informed consents covering biomarker research.
Funding: The authors disclosed receipt of the following financial support for the research, authorship, and/or publication of this article: this work was supported by the National Natural Science Foundation of China (grant numbers 81172505 and 81302302), Doctoral Programs Foundation of the Ministry of Education of China (grant number 20120071120105), Shanghai Natural Science Foundation (grant numbers 13ZR1452800 and 19ZR1431100), Shanghai Municipal Commission of Health and Family Planning (grant numbers 20144Y0218 and 201640006), Clinical Research Plan of Shanghai Hospital Development Center (grant numbers 16CR3065B and 12016231), Shanghai ‘Rising Stars of Medical Talent’ Youth Development Program for Outstanding Youth Medical Talents (grant number 2018-16), Shanghai Collaborative Innovation Center for Translational Medicine (grant number TM201908), Multidisciplinary Cross Research Foundation of Shanghai Jiaotong University (grant numbers YG2017QN49 and ZH2018QNA42), Nurturing Fund of Renji Hospital (grant number PYMDT-002), Science and Technology Commission of Shanghai Municipality (grant number 15JC1402700), and Shanghai Municipal Key Clinical Specialty.
ORCID iD: Yaqian Xu  https://orcid.org/0000-0003-1247-7239
Supplemental material: Supplemental material for this article is available online.
Contributor Information
Yaqian Xu, Department of Breast Surgery, Renji Hospital, School of Medicine, Shanghai Jiaotong University, Shanghai, People’s Republic of China.
Yan Wang, Department of Breast Surgery, Renji Hospital, School of Medicine, Shanghai Jiaotong University, Shanghai, People’s Republic of China.
Chenwei Yuan, Department of Breast Surgery, Renji Hospital, School of Medicine, Shanghai Jiaotong University, Shanghai, People’s Republic of China.
Xiaonan Sheng, Department of Breast Surgery, Renji Hospital, School of Medicine, Shanghai Jiaotong University, Shanghai, People’s Republic of China.
Rui Sha, Department of Breast Surgery, Renji Hospital, School of Medicine, Shanghai Jiaotong University, Shanghai, People’s Republic of China.
Huijuan Dai, Department of Breast Surgery, Renji Hospital, School of Medicine, Shanghai Jiaotong University, Shanghai, People’s Republic of China.
Shan Zhang, Department of Breast Surgery, Renji Hospital, School of Medicine, Shanghai Jiaotong University, Shanghai, People’s Republic of China.
Yaohui Wang, Department of Breast Surgery, Renji Hospital, School of Medicine, Shanghai Jiaotong University, Shanghai, People’s Republic of China.
Yanping Lin, Department of Breast Surgery, Renji Hospital, School of Medicine, Shanghai Jiaotong University, Shanghai, People’s Republic of China.
Liheng Zhou, Department of Breast Surgery, Renji Hospital, School of Medicine, Shanghai Jiaotong University, Shanghai, People’s Republic of China.
Shuguang Xu, Department of Breast Surgery, Renji Hospital, School of Medicine, Shanghai Jiaotong University, Shanghai, People’s Republic of China.
Jie Zhang, Department of Breast Surgery, Renji Hospital, School of Medicine, Shanghai Jiaotong University, Shanghai, People’s Republic of China.
Wenjin Yin, Department of Breast Surgery, Renji Hospital, School of Medicine, Shanghai Jiaotong University, No. 160 Pujian Road, Shanghai 200127, People’s Republic of China.
Jinsong Lu, Department of Breast Surgery, Renji Hospital, School of Medicine, Shanghai Jiaotong University, No. 160 Pujian Road, Shanghai 200127, People’s Republic of China.
References
- 1. Lee MC, Newman LA. Management of patients with locally advanced breast cancer. Surg Clin North Am 2007; 87: 379–398, ix. [DOI] [PubMed] [Google Scholar]
- 2. Eniu A, Carlson RW, Aziz Z, et al. Breast cancer in limited-resource countries: treatment and allocation of resources. Breast J 2006; 12(Suppl. 1): S38–S53. [DOI] [PubMed] [Google Scholar]
- 3. Kuerer HM, Newman LA, Smith TL, et al. Clinical course of breast cancer patients with complete pathologic primary tumor and axillary lymph node response to doxorubicin-based neoadjuvant chemotherapy. J Clin Oncol 1999; 17: 460–469. [DOI] [PubMed] [Google Scholar]
- 4. Fisher B, Bryant J, Wolmark N, et al. Effect of preoperative chemotherapy on the outcome of women with operable breast cancer. J Clin Oncol 1998; 16: 2672–2685. [DOI] [PubMed] [Google Scholar]
- 5. Bonadonna G, Valagussa P, Brambilla C, et al. Primary chemotherapy in operable breast cancer: eight-year experience at the Milan Cancer Institute. J Clin Oncol 1998; 16: 93–100. [DOI] [PubMed] [Google Scholar]
- 6. Gianni L, Pienkowski T, Im YH, et al. Efficacy and safety of neoadjuvant pertuzumab and trastuzumab in women with locally advanced, inflammatory, or early HER2-positive breast cancer (NeoSphere): a randomised multicentre, open-label, phase 2 trial. Lancet Oncol 2012; 13: 25–32. [DOI] [PubMed] [Google Scholar]
- 7. Baselga J, Bradbury I, Eidtmann H, et al. Lapatinib with trastuzumab for HER2-positive early breast cancer (NeoALTTO): a randomised, open-label, multicentre, phase 3 trial. Lancet 2012; 379: 633–640. [DOI] [PMC free article] [PubMed] [Google Scholar]
- 8. Mercer TR, Dinger ME, Mattick JS. Long non-coding RNAs: insights into functions. Nat Rev Genet 2009; 10: 155–159. [DOI] [PubMed] [Google Scholar]
- 9. Munschauer M, Nguyen CT, Sirokman K, et al. The NORAD lncRNA assembles a topoisomerase complex critical for genome stability. Nature 2018; 561: 132–136. [DOI] [PubMed] [Google Scholar]
- 10. Yang Z, Jiang S, Shang J, et al. LncRNA: shedding light on mechanisms and opportunities in fibrosis and aging. Ageing Res Rev 2019; 52: 17–31. [DOI] [PubMed] [Google Scholar]
- 11. Hu Y, Zhu QN, Deng JL, et al. Emerging role of long non-coding RNAs in cisplatin resistance. Onco Targets Ther 2018; 11: 3185–3194. [DOI] [PMC free article] [PubMed] [Google Scholar]
- 12. Kent WJ, Sugnet CW, Furey TS, et al. The human genome browser at UCSC. Genome Res 2002; 12: 996–1006. [DOI] [PMC free article] [PubMed] [Google Scholar]
- 13. Wang Z, Yang B, Zhang M, et al. lncRNA epigenetic landscape analysis identifies EPIC1 as an oncogenic lncRNA that Interacts with MYC and promotes cell-cycle progression in cancer. Cancer Cell 2018; 33: 706–720.e709. [DOI] [PMC free article] [PubMed] [Google Scholar]
- 14. Meyer N, Penn LZ. Reflecting on 25 years with MYC. Nat Rev Cancer 2008; 8: 976–990. [DOI] [PubMed] [Google Scholar]
- 15. Lee KM, Giltnane JM, Balko JM, et al. MYC and MCL1 cooperatively promote chemotherapy-resistant breast cancer stem cells via regulation of mitochondrial oxidative phosphorylation. Cell Metab 2017; 26: 633–647.e637. [DOI] [PMC free article] [PubMed] [Google Scholar]
- 16. Zhou L, Xu S, Yin W, et al. Weekly paclitaxel and cisplatin as neoadjuvant chemotherapy with locally advanced breast cancer: a prospective, single arm, phase II study. Oncotarget 2017; 8: 79305–79314. [DOI] [PMC free article] [PubMed] [Google Scholar]
- 17. Wolff AC, Hammond ME, Hicks DG, et al. Recommendations for human epidermal growth factor receptor 2 testing in breast cancer: American Society of Clinical Oncology/College of American Pathologists clinical practice guideline update. J Clin Oncol 2013; 31: 3997–4013. [DOI] [PubMed] [Google Scholar]
- 18. Coates AS, Winer EP, Goldhirsch A, et al. Tailoring therapies–improving the management of early breast cancer: St Gallen International Expert Consensus on the primary therapy of early breast cancer 2015. Ann Oncol 2015; 26: 1533–1546. [DOI] [PMC free article] [PubMed] [Google Scholar]
- 19. Zhu Y, Mao D, Gao W, et al. Analysis of lncRNA expression in patients with eosinophilic and neutrophilic asthma focusing on LNC_000127. Front Genet 2019; 10: 141. [DOI] [PMC free article] [PubMed] [Google Scholar]
- 20. American Joint Committee on Cancer, https://cancerstaging.org/references-tools/deskreferences/Pages/Breast-Cancer-Staging.aspx (accessed on 24 February 2020).
- 21. Gyorffy B, Lanczky A, Eklund AC, et al. An online survival analysis tool to rapidly assess the effect of 22,277 genes on breast cancer prognosis using microarray data of 1,809 patients. Breast Cancer Res Treat 2010; 123: 725–731. [DOI] [PubMed] [Google Scholar]
- 22. Szklarczyk D, Gable AL, Lyon D, et al. STRING v11: protein-protein association networks with increased coverage, supporting functional discovery in genome-wide experimental datasets. Nucleic Acids Res 2019; 47: D607–D613. [DOI] [PMC free article] [PubMed] [Google Scholar]
- 23. Huang D-W, Sherman BT, Lempicki RA. Systematic and integrative analysis of large gene lists using DAVID bioinformatics resources. Nat Protoc 2009; 4: 44–57. [DOI] [PubMed] [Google Scholar]
- 24. Huang D-W, Sherman BT, Lempicki RA. Bioinformatics enrichment tools: paths toward the comprehensive functional analysis of large gene lists. Nucleic Acids Res 2009; 37: 1–13. [DOI] [PMC free article] [PubMed] [Google Scholar]
- 25. Li JH, Liu S, Zhou H, et al. starBase v2.0: decoding miRNA-ceRNA, miRNA-ncRNA and protein-RNA interaction networks from large-scale CLIP-Seq data. Nucleic Acids Res 2014; 42: D92–D97. [DOI] [PMC free article] [PubMed] [Google Scholar]
- 26. Zhang B, Lu HY, Xia YH, et al. Long non-coding RNA EPIC1 promotes human lung cancer cell growth. Biochem Biophys Res Commun 2018; 503: 1342–1348. [DOI] [PubMed] [Google Scholar]
- 27. Li Y, Cai Q, Li W, et al. Long non-coding RNA EPIC1 promotes cholangiocarcinoma cell growth. Biochem Biophys Res Commun 2018; 504: 654–659. [DOI] [PubMed] [Google Scholar]
- 28. Rajendran RR, Nye AC, Frasor J, et al. Regulation of nuclear receptor transcriptional activity by a novel DEAD box RNA helicase (DP97). J Biol Chem 2003; 278: 4628–4638. [DOI] [PubMed] [Google Scholar]
- 29. Sato S, Idogawa M, Honda K, et al. Beta-catenin interacts with the FUS proto-oncogene product and regulates pre-mRNA splicing. Gastroenterology 2005; 129: 1225–1236. [DOI] [PubMed] [Google Scholar]
- 30. Sun J, Cai X, Yung MM, et al. miR-137 mediates the functional link between c-Myc and EZH2 that regulates cisplatin resistance in ovarian cancer. Oncogene 2019; 38: 564–580. [DOI] [PMC free article] [PubMed] [Google Scholar]
- 31. Wang Y, Wang Z, Xu J, et al. Systematic identification of non-coding pharmacogenomic landscape in cancer. Nat Commun 2018; 9: 3192. [DOI] [PMC free article] [PubMed] [Google Scholar]
- 32. Zhong L, Shen H, Huang C, et al. AKR1B10 induces cell resistance to daunorubicin and idarubicin by reducing C13 ketonic group. Toxicol Appl Pharmacol 2011; 255: 40–47. [DOI] [PMC free article] [PubMed] [Google Scholar]
- 33. Matsunaga T, Kawabata S, Yanagihara Y, et al. Pathophysiological roles of autophagy and aldo-keto reductases in development of doxorubicin resistance in gastrointestinal cancer cells. Chem Biol Interact 2019; 314: 108839. [DOI] [PubMed] [Google Scholar]
- 34. Milek M, Imami K, Mukherjee N, et al. DDX54 regulates transcriptome dynamics during DNA damage response. Genome Res 2017; 27: 1344–1359. [DOI] [PMC free article] [PubMed] [Google Scholar]
Associated Data
This section collects any data citations, data availability statements, or supplementary materials included in this article.
Supplementary Materials
Supplemental material, Supplementary_Figure_1 for Predictive and prognostic value of EPIC1 in patients with breast cancer receiving neoadjuvant chemotherapy by Yaqian Xu, Yan Wang, Chenwei Yuan, Xiaonan Sheng, Rui Sha, Huijuan Dai, Shan Zhang, Yaohui Wang, Yanping Lin, Liheng Zhou, Shuguang Xu, Jie Zhang, Wenjin Yin and Jinsong Lu in Therapeutic Advances in Medical Oncology
Supplemental material, Supplementary_Materials_-_description for Predictive and prognostic value of EPIC1 in patients with breast cancer receiving neoadjuvant chemotherapy by Yaqian Xu, Yan Wang, Chenwei Yuan, Xiaonan Sheng, Rui Sha, Huijuan Dai, Shan Zhang, Yaohui Wang, Yanping Lin, Liheng Zhou, Shuguang Xu, Jie Zhang, Wenjin Yin and Jinsong Lu in Therapeutic Advances in Medical Oncology


