Abstract
The dye rhodamine 6G can act as a photocatalyst through photoinduced electron transfer. After electronic excitation with green light, rhodamine 6G takes an electron from an electron donor, such as N,N‐diisopropylethylamine, and forms the rhodamine 6G radical. This radical has a reduction potential of around −0.90 V and can split phenyl iodide into iodine anions and phenyl radicals. Recently, it has been reported that photoexcitation of the radical at 420 nm splits aryl bromides into bromide anions and aryl radicals. This requires an increase in reduction potential, hence the electronically excited rhodamine 6G radical was proposed as the reducing agent. Here, we present a study of the mechanism of the formation and photoreactions of the rhodamine 6G radical by transient absorption spectroscopy in the time range from femtoseconds to minutes in combination with quantum chemical calculations. We conclude that one photon of 540 nm light produces two rhodamine 6G radicals. The lifetime of the photoexcited radicals of around 350 fs is too short to allow diffusion‐controlled interaction with a substrate. A fraction of the excited radicals ionize spontaneously, presumably producing solvated electrons. This decay produces hot rhodamine 6G and hot rhodamine 6G radicals, which cool with a time constant of around 10 ps. In the absence of a substrate, the ejected electrons recombine with rhodamine 6G and recover the radical on a timescale of nanoseconds. Photocatalytic reactions occur only upon excitation of the rhodamine 6G radical, and due to its short excited‐state lifetime, the electron transfer to the substrate probably takes place through the generation of solvated electrons as an additional step in the proposed photochemical mechanism.
Keywords: density functional calculations, electron transfer, photocatalysis, reaction mechanisms, time-resolved spectroscopy
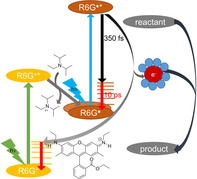
Consecutive PET. The excitation of rhodamine 6G (R6G+) with green light (540 nm) in the presence of N,N‐diisopropylethylamine generates two rhodamine radicals. Excitation of these radicals with blue light (420 nm) enables reduction of aromatic bromides. Femtosecond spectroscopy reveals that the lifetime of the excited state (350 fs) is too short for diffusion‐controlled electron transfer, pointing to solvated electrons as intermediates.
Introduction
The concept of consecutive photoinduced electron transfer (conPET), recently demonstrated by König and co‐workers,1 aims to use the combined energy of two photons in the visible spectral region for a photocatalytic reduction. As shown in Scheme 1, the first photon promotes a photocatalyst (PC) to an electronically excited state (PC*), which subsequently extracts an electron from an electron donor.2, 3 In a normal photocatalytic reaction, the resulting radical anion (PC‐R) transfers this electron to a substrate molecule (S1a), which is thus reduced (S2a) while the photocatalyst returns to the initial state (yellow arrows in Scheme 1). In a conPET process, the radical anion (PC‐R) is excited by a second photon so that the electronically excited state (PC‐R*) becomes the photoreducing species. Hence the reduction potential is increased by the electronic energy stored in the electronically excited radical. This permits electron transfer to other substrate molecules (S1b) that cannot be reduced by PC‐R, leading to new products (S2b; red arrows in Scheme 1).
Scheme 1.
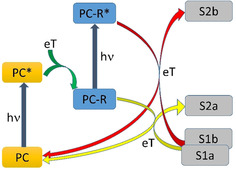
Normal photocatalytic reaction (yellow arrows) compared with the conPET process (red arrows). Adapted from reference 1 (eT=electron transfer).
The conPET concept was first illustrated with perylene bisimide as photocatalyst,1 which reduces aryl chlorides with blue‐light excitation. The perylene bisimide radical anion has many low‐lying electronic states with absorption down to 950 nm so that the additional energy available for photoreduction is less than 1.3 eV. Later, the same group successfully used rhodamine 6G (R6G+) as photocatalyst.4, 5 After excitation with light of 540 nm, R6G+ is reduced by N,N‐diisopropylethylamine (DIPEA) and forms the rhodamine 6G radical (R6G.). The reported absorption spectrum of the reduced catalyst radical has a single band in the near‐UV spectral region, with a peak at 420 nm,3, 6 which suggests an additional energy of around 3.0 eV if used in a conPET process. An absorption band in this spectral region has also been observed for the radical of another xanthene dye, eosin Y.7 Indeed, excitation of R6G. at 420 nm resulted in reactions that were not observed with 540 nm light only, which suggests that conPET occurs.2, 8, 9, 10
Scheme 1 should be considered more as a cartoon than a mechanism, that is, electron transfer from PC‐R* to the substrate might involve further intermediates. The simplest mechanism that can be imagined is direct eT from PC‐R* to the substrate upon diffusion‐controlled encounter of these species. Although Scheme 1 might suggest such a mechanism, previous studies of conPET did not address the specific path of eT. Indeed, several observations seem to be at odds with such a simple proposal: For an efficient bimolecular reaction, the lifetime of the excited radical state must be longer than typical diffusion times, that is, at least several nanoseconds, unless one assumes the formation of aggregates between the catalyst and the substrate in their electronic ground states.11 An excited state with large oscillator strength for the transition to the ground state should show fluorescence with a radiative lifetime of around 1–10 ns, and hence with a substantial quantum yield. However, no fluorescence of R6G.* could be observed. A very fast process must compete with the fluorescence that deactivates the electronic state excited at 420 nm. The reducing species in this conPET process might hence be the product of this fast deactivation reaction and not the radical state excited at 420 nm. This reactive state might be a lower excited state of the radical corresponding to an absorption band in the visible or near‐IR, as is common for almost all radicals of organic dyes. This question motivated us to study the mechanism of formation of the radical as well as the photocatalytic properties. Here we present convincing evidence that excitation of R6G+ by a single photon in the presence of the electron donor DIPEA produces not only one, but two R6G. radicals. The electronic state of R6G. excited at 420 nm has a very short lifetime of around 350 fs. Some of the excited radicals decay back to the ground state, and some are ionized leading to R6G+ and an electron. We propose that the electron transfer to a substrate probably takes place via the generation of solvated electrons as an additional step in the proposed photochemical mechanism. In the absence of a substrate, R6G+ and the electron recombine on a timescale of several nanoseconds.
Results and analysis
Long‐time kinetics
Excitation of R6G+ with green light of 540 nm wavelength in the presence of DIPEA and in the absence of oxygen produces the R6G. radical in a clean and mostly reversible reaction. Figure 1 a shows a sequence of spectra recorded during irradiation and following recovery in the dark. Figure 2 a shows the concentration profiles of the two species, R6G+ and R6G., obtained by deconvolution of these time‐spectral data using the self‐modeling method.12 The spectrum of the first species was constrained to that of R6G+, and the sum of all concentrations was constrained by Equation (1):
| (1) |
Figure 1.
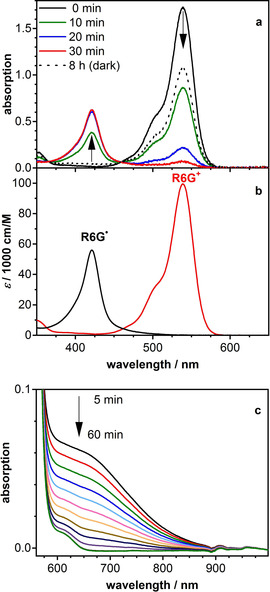
a) Absorption spectra of rhodamine 6G in DMSO (c=1.7×10⁻⁵ m) with DIPEA (c=0.2 m) at different times during illumination with a green LED. The dotted line is the spectrum recorded after 8 h of recovery in the dark in the absence of oxygen. b) Spectra of rhodamine 6G (R6G+) and its radical (R6G.) obtained by deconvolution of the time‐spectral data by using the self‐modelling method. c) Sequence of absorption spectra recorded during back‐oxidation of the radical (c(R6G)=3.0×10⁻⁴ m).
Figure 2.
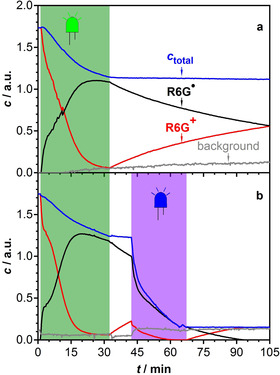
Time profiles of R6G+ and R6G. in a solution of R6G+ and DIPEA in DMSO obtained by deconvolution of the time‐spectral data by using the self‐modelling method. The sum of the concentrations is denoted by c total. A third component denoted as background was included in the model to account for instrumental drifts and other generated species. a) Excitation with a green LED for 30 min (green‐shaded area) and subsequent dark reaction. b) As for panel a) with an additional phase of irradiation with a violet LED (420 nm) during the time highlighted by the violet shaded area.
in which c(R+) and c(R.) are the time dependent concentrations of rhodamine and the radical, respectively, and c 0(R+) is the initial concentration of R6G+. Figure 1 b shows the spectra obtained by this deconvolution. After sufficiently long irradiation, R6G+ is quantitatively transformed into the radical, accompanied by some loss of total concentration. In the dark, the radical is slowly oxidized back to R6G+ with the total concentration remaining constant. Examination of the absorption spectrum in the range 550–750 nm revealed a weak absorption band (ϵ≈500 m −1 cm−1) that decayed during back‐oxidation of the radical with the same kinetics. Figure 1 c shows a sequence of spectra measured at higher concentration (c≈10−4 m). Due to the same kinetics, we assign these bands to the radical and not to dimers; R6G+ forms dimers in water solution at concentrations above 10−4 m, but only at high ionic strength (10 m of LiCl).13 In ethanol, dimer formation sets in at a concentration of around 0.01 m.14
The behavior changes dramatically when, after forming the radical, the sample is irradiated by light of 420 nm wavelength. The concentration time profiles displayed in Figure 2 b show that excitation of the radical inhibits recovery of the R6G+ ground state and leads to rapid loss of the total concentration of both rhodamine species. Apparently, excitation at 420 nm into the absorption band of the radical results in much faster destruction than excitation into the parent rhodamine 6G band at 540 nm.
One photon produces two rhodamine radicals
Flash photolysis of a solution of R6G+ (A(532 nm)=0.5; c=5.5 μm) and DIPEA (c=0.1 m) at 532 nm revealed interesting behavior. Figure 3 shows two time traces extracted from the streak image in the time range 0–1 ms. The black trace, which corresponds to the wavelength range 400–450 nm, probes the absorption band of the radical. After an instantaneous rise (i.e., unresolved on this timescale), the absorption continues to rise on a timescale of 100 μs to about double the amplitude. The red trace, which monitors the ground state bleach of R6G+ in the range 520–560 nm, continues to drop while the radical absorption is rising. The sharp negative signal in this trace close to t=0 is due to scattered laser light. Apparently, R6G+ is consumed and radical R6G. is produced in the dark, long after the excitation has finished.
Figure 3.
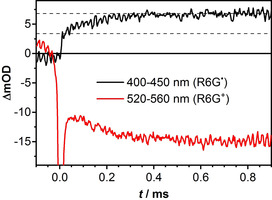
Time traces of the transient absorption of rhodamine 6G in a solution of DMSO and DIPEA obtained by flash photolysis. Immediately after excitation the radical absorption averaged over the range 400–450 nm (black line) is about 3.4 mOD. It subsequently increases to about 6.8 mOD with a time constant of around 100 μs. The trace at 520–560 nm (red curve) shows the corresponding loss of rhodamine (the sharp negative spike near = 0 is scattered laser light).
The transient absorption matrix measured by the streak camera was fitted with the model function given by Equation (2)
| (2) |
in which represent the decay‐associated difference spectra (DADS) associated with rate constants kj, is the spectral profile of the excitation laser, is the Dirac function, is the instrument response function modeled by a Gaussian, and ⊗ indicates convolution.
Global lifetime analysis resulted in the rate constants k 1=1.0×10⁴ s−1 and k 2=0. Figure 4 shows the corresponding DADS. The red curve shows again, but multiplied by a factor of −2.0. With this scaling, the shapes of the two DADS are identical. The positive peak at 420 nm belongs to the radical R6G., the negative peak at 540 nm is the ground state bleach of R6G+.
Figure 4.
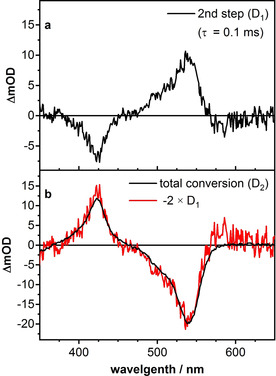
DADS from the global lifetime analysis of the transient absorption measurements of rhodamine 6G in a solution of DMSO and DIPEA. a) D1 describes the slower generation process (τ=0.1 ms). b) D2 corresponds to the total generated radical. The red curve represents D1 multiplied by a factor of −2.0, to show that half of the total generated radicals stem from the slower process.
We can model this behavior by assuming that a certain amount c 0 of the radical is created instantaneously, a second amount c 1 grows with a rate constant k 1, and the radical does not react further during the time window observed. This leads to the Equation (3)
| (3) |
in which is the difference spectrum of radical R6G. minus R6G+. Comparison of this model with the result of the global fit leads to Equation (4).
| (4) |
We obtain the best agreement with the experiment for . Apparently, for every radical created during the excitation laser pulse, a second radical is produced in a dark reaction. We will propose a mechanism for this process in the Discussion section.
The fate of the excited radical state
The processes following photoexcitation of the radical were studied by femtosecond transient absorption spectroscopy. A solution of the radical was produced in a flask under oxygen‐free conditions and pumped through the sample cell of the femtosecond apparatus. In most experiments, the radicals were generated photochemically by irradiation of a solution of R6G+ and DIPEA with a green light‐emitting diode (LED) until all R6G+ had transformed into the radical. To exclude any detrimental effect of DIPEA or its decomposition products on the results, in some experiments, R6G+ was reduced by zinc powder or by electrolysis.
Transient spectra were recorded in the time range 0–2000 ps. An example of such a data set is shown in Figure 5 a. After correction for the group velocity dispersion, the data were subjected to a global lifetime analysis. Four lifetimes were identified, and the corresponding DADS for a typical experiment in DMSO solvent are displayed in Figure 5 b. These were analyzed as outlined in the following paragraphs.
Figure 5.
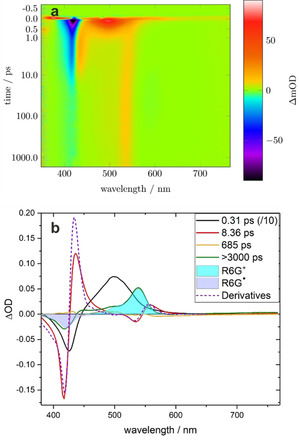
a) Example data set from fs transient absorption measurements following excitation of R6G. in DMSO. Red indicates absorption and blue corresponds to bleaching or emission. b) DADS from the global lifetime analysis of the fs transient absorption measurements. The DADS of the fastest decay (black, scaled by 0.1) corresponds to the decay of the excited radical to the hot ground state radical and hot R6G+. The second DADS (red) is assigned to cooling of the two hot species. The derivatives of the corresponding ground state spectra are shown as dotted lines for comparison. The third DADS (yellow) fits the stimulated emission of the R6G+ ground state. The very long‐lived (green) component corresponds to the products at the end of the time window, that is, cold R6G+ and the loss of radical R6G..
The DADS of the fastest component with a lifetime of 0.31 ps consists of a negative band at 420 nm and a very broad positive band at 500 nm. We assign the former to bleaching of the radical ground state. This DADS therefore corresponds to the very fast decay of the excited radical back to the ground state. The broad band is thus the excited state absorption of the radical.
The slowest component has a lifetime greater than 3 ns, that is, longer than our time window. It corresponds to the species present at the end of the experiment. It shows a negative band at 420 nm and a positive band at 540 nm, with a sideband at around 510 nm. As indicated by the shaded areas, these two bands correspond very well to the bleach of the ground state radical and the positive spectrum of R6G+, respectively.
A further DADS with a time constant of 8.4 ps is shown in red in Figure 5b. It displays two dispersion‐like shapes, each with a positive and a negative contribution with a similar area. This shape does not look like an absorption band but rather like the first derivative of such a band. We assign these to vibrational cooling of the bands of hot R6G+ and hot radical R6G..15 This results in a blueshift of the absorption bands. Global lifetime analysis assumes that the weights of fixed spectra are exponential functions of time. It can hence not account for a continuous shift of a band position. However, in a first approximation, such a shift can be modeled by the superposition of the band shape with its first derivative.
We assume that the band only shifts its position with time but does not change its shape, that is, , in which is the peak position at infinite time and is the time‐dependent shift. The first two terms of a Tayler expansion with respect to λ S are given by Equation (5).
| (5) |
The DADS corresponding to this shift is the second term, that is, the derivative of the spectrum scaled with the size of the shift. An overlay of the experimental data with the properly scaled first derivatives of the species spectra is in very good agreement with this model (see the dotted lines in Figure 5b).
Finally, a DADS with low amplitude and a decay time of 685 ps is found. This DADS shows a negative amplitude above 550 nm, that is, in the region of R6G+ fluorescence. This DADS is hence assigned to residual R6G+ in the sample that is excited by the 100 fs pump pulse and yields stimulated emission. The decay time is shorter than the fluorescence lifetime of R6G+ because the sample contains a high concentration of DIPEA that acts as a quencher. Stimulated emission from residual R6G+ is not quenched when the radical is produced by reduction with zinc powder (see below). In this case the global lifetime analysis cannot separate this decay from the slow recovery of the radical with time constant >3 ns.
Based on these data we propose the following mechanism. The electronic state of the radical excited at 420 nm decays within 310 fs. A certain fraction returns directly to the ground state and forms hot radicals, the other fraction undergoes a reaction that produces hot R6G+. Both hot species undergo vibrational cooling. Because the vibrational manifolds of the two species are similar, both cooling processes occur on the same timescale of 8.4 ps. The fraction of excited radicals that were transformed into R6G+ have transferred their extra electron to some other species. This is most likely the reducing agent of the conPET process. Unfortunately, the transient spectra provide no hint of that other species.
We repeated the experiments with other solvents (acetonitrile and dichloromethane) and other ways of preparing the R6G. radical by reduction with zinc powder. The lifetimes determined from the global analysis of the productive channel are collected in Table 1. The corresponding DADS are shown in the Supporting Information. In all cases we find a very fast decay of the excited radical (200–480 fs), vibrational cooling of both hot R6G+ and hot R6G. (8.4–10.9 ps), and a long‐lived (>3 ns) R6G+ product. We conclude that DIPEA or the decomposition products of DIPEA as a result of the long irradiation for radical production are not involved in the productive channel.
Table 1.
Decay times of DADS obtained by global analysis for different solvents and means of radical generation.
|
Radical generation |
Solvent |
Polarity[a] |
DADS decay times |
|||
|---|---|---|---|---|---|---|
|
method |
|
[kcal mol−1] |
[ps] |
[ps] |
[ps] |
[ps] |
|
green LED+DIPEA |
MeCN |
45.6 |
0.2 |
10.1 |
>3000 |
– |
|
green LED+DIPEA |
DMSO |
45.1 |
0.31 |
8.4 |
>3000 |
685 |
|
green LED+DIPEA |
CH2Cl2 |
40.7 |
0.48 |
10.9 |
>3000 |
433 |
|
activated Zn |
DMSO |
45.1 |
0.33 |
8.8 |
>3000 |
|
[a] Based on the E T(30) scale of polarity (see ref. 16).
The quantum yield of the productive channel was estimated in the following way. The sum of all DADS is the transient absorption at time zero, that is, it is the excited state absorption spectrum of the radical R6G.* minus the bleach of the radical ground state R6G.. Because the spectrum of the latter is known from steady‐state experiments, the amount of excited radicals can be estimated by adding a fraction x of the ground state spectrum to the sum of the DADS until the result is positive and does not show the characteristic maximum of the ground state spectrum.
The DADS with the longest lifetime is the difference of the spectrum of R6G+ (i.e., the byproduct of long‐lived species that capture the electron) and the fraction y of excited radicals that have not yet returned to the ground state. This fraction y can be determined by fitting the difference of the corresponding ground state spectra to this DADS. The ratio y/x is equivalent to the photocatalytic quantum yield ( ) shown in Table 2. Knowing this quantum yield it is possible to separate the observed decay rate of the excited radical into a contribution from internal conversion ( ) and production of the active reducing species [ ; Equations (6), (7), (8), τ obs = the observed decay time, i.e., the inverse of the observed decay rate)]. The results are summarized in Table 2 for various solvents.
| (6) |
| (7) |
| (8) |
Table 2.
Quantum yields ( ) for the decay of the excited radical to the photoactive species, decay times ( ), and rate constants for the internal conversion ( ) and productive reaction ( ) for different solvents and means of radical generation.
|
Radical generation method |
Solvent |
[%] |
[ps] |
[ps−1] |
[ps−1] |
|---|---|---|---|---|---|
|
green LED+DIPEA |
MeCN |
0.8 |
0.2 |
0.04 |
5.0 |
|
green LED+DIPEA |
DMSO |
3 |
0.31 |
0.10 |
3.1 |
|
green LED+DIPEA |
CH2Cl2 |
11 |
0.48 |
0.23 |
1.9 |
|
activated Zn |
DMSO |
3 |
0.33 |
0.09 |
2.9 |
We observe that the two rate constants do not depend on the way the radicals were generated, photochemically with DIPEA or by reduction with elemental zinc. However, the solvent seems to influence the two rate constants. The PC quantum yield is largest in dichloromethane, smaller in DMSO, and smallest in MeCN. In the same sequence, the rate constant for IC increases, and the rate constant for photoionization in the excited state decreases. Because, according to the E T(30) values, DMSO and MeCN have quite similar polarities, polarity does not seem to be the decisive factor.
Discussion
Photochemical radical production
The observation that absorption of a single photon by a R6G+ cation produces two R6G. radicals can be rationalized by the mechanism illustrated in Schemes 2 and 3. In a first step, DIPEA (D1) is oxidized by the excited R6G+ leading to the DIPEA radical cation (D2). Because DIPEA is a base, it can take a proton from the DIPEA radical cation (D2). This results in protonated DIPEA (D5) and a neutral DIPEA radical localized either on an ethyl carbon center (D4a) or on a propyl carbon center (D4b; Scheme 2). According to DFT calculations, both reactions are slightly endothermic in vacuo. The products are stabilized in DMSO solvent (free‐energy changes in parentheses), and the preferred product should be the ethyl‐localized radical D4a. Deprotonation of the original radical cation D2 might also be responsible for the long lifetime of the R6G. radical: Both the neutral radicals D4a and D4b as well as the protonated base D5 are poor electron acceptors, thus back‐electron transfer from R6G. to a DIPEA species is inhibited.
Scheme 2.

DIPEA (D1) can react as a base and deprotonate oxidized DIPEA (D2) leading to protonated DIPEA (D5) and neutral DIPEA radicals (D4a and D4b). The preferred product is the ethyl‐localized radical (D4a) as DFT calculations in vacuo (and in DMSO) show.
Scheme 3.

Electron transfer from the DIPEA radicals (D4) to R6G+ is clearly exothermic as the energies determined in DFT calculations in vacuo and (free‐energy differences in DMSO) show.
Alternative resonance structures for the radicals D4a and D4b can be considered that have the radical center on the nitrogen atom and a C=N double bond. In this resonance structure the extra electron on the nitrogen center exceeds the octet rule, that is, it is a quasi‐Rydberg electron. By donating this extra electron to another R6G+ cation, these DIPEA radicals will become stable iminium cations, as shown in Scheme 3.
According to the DFT calculations, this reaction is exothermic, in particular in DMSO solvent, with D3b the preferred product. Subsequently, the DIPEA radical cation in cooperation with a further DIPEA as base produces a second R6G. radical in a dark reaction on a timescale of 100 μs. All the reaction energies changed by less than 1 kcal mol−1 when the smaller cc‐pVTZ basis was used in the calculations. We therefore conclude that the results of our calculations are close to the basis set limit of DFT.
The excitation energy of the rhodamine radical
The electronic excitation spectra of rhodamine and the radical were calculated by different methods, including CIS (configuration interaction with singly excited configurations), TDDFT (time‐dependent DFT), CASSCF (complete active space self‐consistent field), and CASSCF combined with SC‐NEVPT2 (strongly contracted N‐electron valence state perturbation theory). The basis sets cc‐pVDZ, cc‐pVTZ, aug‐cc‐pVDZ, and aug‐cc‐pVTZ were used, and solvent effects were treated by using C‐PCM (conductor‐like polarizable continuum model).
For rhodamine in vacuo, all the methods yielded a large oscillator strength (f≈1) for the transition to the first excited singlet state. However, the excitation energy was overestimated and was still much higher than the experimental value even when the largest atomic basis set was used. The C‐PCM method revealed a redshift for this transition of around 500 cm−1 in DMSO. However, for other states with very small oscillator strengths, unreasonably large redshifts of more than 8000 cm−1 were found, especially with TDDFT. This is apparently an artifact of the C‐PCM method. Within each method, excitation energies varied by only around 1 % when the atomic basis set was increased from cc‐pVDZ to aug‐cc‐pVDZ, cc‐pVTZ, or aug‐cc‐pVTZ. Hence, we focus our further discussion on the calculations in vacuo with the largest of these basis sets, aug‐cc‐pVTZ. The calculated excitation energies ( , in wavenumbers) and oscillator strengths for the lowest nine excited states of the cation and the radical, obtained by the CASSCF‐NEVPT2/aug‐cc‐pVTZ method, are presented in Table 3. The active space considered 10 orbitals with 10 electrons for the cation and 11 electrons for the radical.
Table 3.
Excitation energies in wavenumber units ( ) and oscillator strengths (f) calculated using CASSCF‐NEVPT2/aug‐cc‐pVTZ for excitation to states Sn and Dn of the rhodamine cation and radical, respectively. The excitation wavelengths (λ) have been scaled by a factor of 1.3 for better comparison with experiment.
|
|
Rhodamine cation |
Rhodamine radical |
||||
|---|---|---|---|---|---|---|
|
n |
[cm−1] |
λ [nm] |
f |
[cm−1] |
λ [nm] |
f |
|
1 |
23 953.2 |
542.75 |
1.01954 |
18 033.8 |
720.85 |
0.00013 |
|
2 |
28 954.9 |
449.02 |
0.00965 |
22 509.4 |
577.59 |
0.00598 |
|
3 |
34 826.7 |
373.23 |
0.00025 |
23 316.2 |
557.57 |
0.00051 |
|
4 |
36 041.4 |
360.75 |
0.05518 |
24 365.7 |
533.52 |
0.00162 |
|
5 |
38 191.6 |
340.34 |
0.00477 |
28 023.2 |
463.84 |
0.52697 |
|
6 |
42 200.2 |
308.10 |
0.01817 |
31 800.6 |
408.85 |
0.03232 |
|
7 |
42 241.7 |
307.71 |
0.14985 |
33 908.9 |
383.37 |
0.00000 |
|
8 |
43 602.2 |
298.09 |
0.21865 |
38 320.7 |
339.3 |
0.00005 |
|
9 |
45 407.5 |
286.26 |
0.02931 |
40 806.5 |
318.63 |
0.00009 |
For the rhodamine cation, the CASSCF(10|10)‐NEVPT2 method gave the best agreement with experiment, yielding an excitation wavenumber of around 23 950 cm−1 for the S0→S1 transition with oscillator strength f≈1.02. TDDFT (27 010 cm−1), CASSCF (30 242 cm−1), and CIS (32 171 cm−1) yielded considerably higher excitation energies. Compared with the experimental value (ca. 18 500 cm−1), the result obtained with NEVPT2 is still too high by 30 %. Apparently, a large dynamic correlation is still missing at this level of theory. For the following discussion we scale the transition wavelengths in Table 3 by a factor of 1.30 so that the S0→S1 transition of the cation agrees with experiment. If we assume a similar error in the corresponding calculation for the radical, the first intense transition is D0→D5 at around 28 020 cm−1 with an oscillator strength of f≈0.53 and should occur at the scaled wavelength of around 464 nm. Both the position of this transition and the intensity are thus in agreement with observation. Evidently, this transition does not lead to the first excited state. In fact, four very weak transitions are expected in the range 720–530 nm. This is also in good agreement with our experimental findings (see Figure 1 c). We note that although the TDDFT, CIS, and CASSCF calculations for the radical yielded still higher excitation energies, they all agree in that the first intense transition (f>0.3) is to a higher state Dn with n between 5 and 8. Thus, all the calculations predict that the radical has several electronic states with small oscillator strength below the strong transition at 420 nm. These states might be responsible for the very fast internal conversion of the 420 nm excited radical.
What is the conPET catalyst?
Our experimental findings on the fate of the excited radical are summarized in the energy level diagram of Figure 6. Whereas the largest fraction of excited radicals returns very quickly (ca. 350 fs) to the ground state, a smaller fraction loses the unpaired electron to an acceptor S and forms R6G+ (green arrows).
Figure 6.
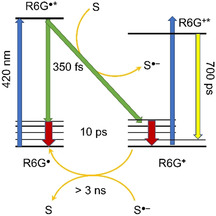
Proposed mechanism for conPET in rhodamine 6G. After excitation of the radical R6G. with light of 420 nm, the excited state decays very quickly (0.35 ps) back to the ground state of the radical or transfers an electron to the solvent. R6G+ and R6G. are produced with some thermal energy and cool on a timescale of 10 ps. R6G+ recaptures the electron on a timescale of several nanoseconds.
Both products are hot and cool on a timescale of 8–10 ps (red arrows). The electron returns to the R6G+ on a timescale >3 ns. Residual R6G+ in the sample is also excited by the 420 nm light (blue arrows) and results in fluorescence and stimulated emission (yellow arrow). Because diffusion‐controlled energy transfer to a substrate molecule cannot compete with the fast 350 fs decay, the reducing agent of conPET must be the acceptor of the electron, which is most likely the solvent itself. However, the reduction potentials of the solvents DMSO, acetonitrile, and dichloromethane are too high, so that formation of the corresponding radical anion can be excluded. Because the process does not depend on the presence of DIPEA, the DIPEA radical anion can also be ruled out.
We conclude that during a time span of several nanoseconds after excitation of the R6G. radical, an ejected electron is available that can return to the R6G+, but it could also reduce a substrate in a diffusion‐controlled reaction. Solvated electrons have been proposed as active reducing species in photocatalytic reactions before.17, 18, 19, 20 In these studies, molecular anions were excited by a two‐photon process, and the solvent was water. Solvation enthalpies of electrons have been calculated recently by Markovic et al. using DFT methods:21 Solvation was found to be exergonic in water (ca. −101 kJ mol−1) as well as in DMSO (ca. −53 kJ mol−1).
The transient absorption spectra of solvated electrons in several solvents have been published.22, 23 The absorption band of the solvated electron has a very low oscillator strength and extends over several hundred nanometers, usually in the far‐red region (>700 nm) of the spectrum. We tested known methods of producing solvated electrons to estimate the sensitivity of our apparatus.24 Unfortunately, we were not able to obtain signals significantly above the noise. Attempts to shift the spectrum towards the blue region by adding some water to the DMSO solvent were also not successful. Up to around 30 % water in DMSO, the absorption band is expected to be still too far in the red region for our apparatus, and experiments at higher water concentrations were hampered by the low solubility of DIPEA.
Although photoexcited R6G. can eject an electron into a reservoir for several nanoseconds, electron transfer to the substrate could alternatively occur directly if the substrate and the R6G. radical form an aggregate in the ground state. Such aggregates have been postulated in the interpretation of single‐molecule fluorescence data to explain the increased ON time of R6G+ in the presence of a substrate.2 This ON time is the time during which R6G+ is in the fluorescing state. This time increases when the ejected electron is captured by the substrate and hence does not return to form the nonfluorescent R6G. radical. We note that the hypothesis of a solvated electron explains this experimental observation as well.
If the substrate forms a complex with the R6G. radical, direct electron transfer will compete with the other decay routes of the excited radical and should hence shorten its lifetime. We also performed femtosecond transient absorption experiments in the presence of a large excess of the substrate 2‐bromobenzonitrile (c=8.6×10⁻² m), and observed the same lifetime of 350 fs as in the absence of the substrate (see Figure S3 in the Supporting Information). Because the cross correlation of our pump‐probe setup has a width of 70 fs, these 350 fs are well beyond our time resolution. We therefore conclude that at a substrate concentration of c=8.6×10⁻² m in DMSO aggregates play a minor role in conPET with rhodamine.
We believe that the hypothesis of a solvated electron gives the best agreement with our experimental observations. We also note that solvated electrons have been proposed before by Slanina and Oberschmid6 to explain their observation of an increased photocurrent in the steady‐state excitation of R6G. radicals.
Conclusions
Excitation of R6G+ by a single photon in the presence of the electron donor DIPEA produces not only one but two R6G. radicals. One R6G. radical is produced by electron transfer from DIPEA to the electronically excited state of R6G+. Deprotonation of the resulting DIPEA radical cation by another DIPEA molecule yields a species that can be considered a reduced iminium compound. Apparently, the reduction potential of this species is higher than that of the R6G. radical. Hence it reduces another R6G+. The driving force might be the delocalization of the unpaired electron in the R6G. radical.
The absorption band of the R6G. radical observed at 420 nm most probably does not correspond to the lowest excited state of this species. This is not surprising because as a general rule the radical cations or radical anions of large conjugated π systems have absorption bands in the near‐IR region. Although these states might contribute to the very fast deactivation of the state excited at 420 nm, the transient absorption data do not indicate that any of the lower‐lying states of the radical have any long‐lived population that could be involved in the photocatalysis.
The electronic state of the R6G. radical excited at 420 nm has a very short lifetime of around 0.35 ps. It decays partly back to the ground state, and partly dissociates into R6G+ and an electron. The resulting hot radical and hot R6G+ electronic ground states equilibrate with the solvent on a timescale of 10 ps. In the absence of a substrate, the electron and the R6G. recombine on a timescale of 3 ns. We propose that in the presence of a substrate, this solvated electron is transferred to the substrate in the conPET process.
Methods
Materials: Rhodamine 6G (>98.5 %) was purchased as laser dye from Lambda Physik or Radiant Dyes and used without further purification. Dichloromethane (DCM) and MeCN were Rotisolv UV/IR‐grade from Roth. DMSO was either SeccoSolv (Merck) or analytical reagent‐grade (Fisher Chemicals). DIPEA (ReagentPlus) and granular zinc (20–30 mesh) were purchased from Sigma–Aldrich.
Slow kinetics (minutes to hours): A sequence of absorption spectra were recorded at intervals of about 15 s, using a fiber‐coupled CCD spectrometer (UV1800, Ocean Optics) equipped with a halogen lamp (64250 HLX, Osram) as light source. The solutions for these irradiation experiments and microsecond transient absorption spectroscopy were degassed at least three times by freeze–pump–thaw cycles in a 10‐mm‐wide cuvette. The solutions were stirred during measurement. Two green (λ max=522 nm, P o≈14 mW, ALUSTAR 350 mA 3°, ledxon) or blue (λ max=420 nm, P o≈195 mW, H2A1‐H420, Roithner LaserTechnik) LEDs orthogonal to the probe beam were used for irradiation.
Microsecond transient absorption spectroscopy: Transient absorption spectra in the nanosecond to microsecond time range were recorded with a streak camera. The apparatus was almost identical to that described previously.25, 26 Samples in 10‐mm‐wide cuvettes were excited with the second harmonic of a Nd:YAG laser (Surelite II, Continuum, repetition rate 10 Hz, 10 mJ pulses of 8 ns duration) through a cylindrical lens. The excited volume was probed by white light from a pulsed xenon flash lamp (03‐102 arc lamp pulser, Applied Photophysics, 150 W, 2 ms pulse duration). Toroidal mirrors (aluminum‐coated substrates from Rodenstock) guided the probe light from the flash lamp to the sample cuvette and from there to an imaging spectrograph (Bruker 200is, grating 100 grooves mm−1). The spectrally dispersed probe light was imaged onto the entrance slit of a streak camera (C7700, Hamamatsu) fitted to a CCD camera (ORCA‐CR, Hamamatsu). Sequences of four streak images (with probe light and excitation laser, only probe light, each alternating with a dark image) were acquired on a personal computer and processed into time‐ and wavelength‐resolved absorption spectra. The data were subjected to global lifetime analysis using home‐written software.
Femtosecond transient absorption spectroscopy: The femtosecond transient absorption apparatus was based on the design published in ref. 27. A Ti:sapphire oscillator/regenerative amplifier laser system (Coherent Libra) generated 100 fs pulses with 1.2 mJ energy at a repetition rate of 1 kHz. A collinear parametric amplifier (TOPAS‐C, Light Conversion) was pumped with 0.8 mJ of these pulses. The output of the TOPAS was compressed with a pair of quartz prisms and used to pump the sample at its absorption maximum at 410–420 nm, depending on the solvent, with pulse energies of around 300 nJ focused to around 100 μm.
The remaining 0.4 mJ of the Ti:sapphire output was used to drive a two‐stage noncollinear optical parametric amplifier (NOPA).28 that produces 20 μJ pulses at 510 nm. These were compressed with a quartz prism pair and focused onto a 1‐mm‐thick CaF2 plate to generate a white‐light continuum for the probe beam. The plate was mounted on an XY stage and moved continuously. The white‐light continuum was spectrally filtered and split into a reference and a measurement beam. The transmitted and reference beams were imaged onto entrance slits of two home‐built grating spectrographs and recorded with photodiode arrays (Hamamatsu, S3901‐512Q, 512 pixels) at 1.5 nm resolution. The time delay between probe and pump was controlled by a triple mirror mounted on a delay stage (Physik Instrumente M‐531.2S) placed in the probe beam.
The sample solution was pumped continuously through a self‐made quartz cell. Each scan was performed from −0.36 to 1.0 ps in steps of 6 fs, and from there to 2 ns in around 1000 steps on a logarithmic timescale. At each step of this scan, transient spectra and the corresponding reference spectra were recorded for 100 pump pulses with two spectrographs. The resulting in 100 transient absorption spectra which were then averaged, each calculated for a baseline‐corrected single shot. Averaging of at least eight independent scans resulted in the final spectra for parallel and perpendicular polarization. Magic angle spectra were obtained by reconstruction.
Calculations: Ground state geometries were optimized by the DFT method employing the B3LYP functional. For the calculation of the excitation energies, TDDFT as well as CIS and CASSCF wave functions were used. For CASSCF, state‐averaging over 10 electronic states was used, followed by second‐order many‐body perturbation theory (NEVPT2). The basis sets cc‐pVDZ, cc‐pVTZ, aug‐cc‐pVDZ, and aug‐cc‐pVTZ were used to check the convergence of the results towards the basis set limit. To reduce computational effort, the ethyl groups of rhodamine were replaced with hydrogen atoms. Solvent effects were included by the C‐PCM method. All DFT calculations were performed using the Firefly (formerly PCGAMESS) program.29, 30 The TDDFT, CIS, and CASSCF‐NEVPT2 calculations were performed using the ORCA31, 32 programs.
Conflict of interest
The authors declare no conflict of interest.
Supporting information
As a service to our authors and readers, this journal provides supporting information supplied by the authors. Such materials are peer reviewed and may be re‐organized for online delivery, but are not copy‐edited or typeset. Technical support issues arising from supporting information (other than missing files) should be addressed to the authors.
Supplementary
Acknowledgements
Financial support was provided by the Graduiertenkolleg (Research Training Group) 1626 of the German Science Foundation. We enjoyed valuable discussions with Prof. König, Prof. Lupton, and their co‐workers.
F. Brandl, S. Bergwinkl, C. Allacher, B. Dick, Chem. Eur. J. 2020, 26, 7946.
References
- 1. Ghosh I., Ghosh T., Bardagi J. I., König B., Science 2014, 346, 725–728. [DOI] [PubMed] [Google Scholar]
- 2. Haimerl J. M., Ghosh I., König B., Lupton J. M., Vogelsang J., J. Phys. Chem. B 2018, 122, 10728–10735. [DOI] [PubMed] [Google Scholar]
- 3. van de Linde S., Krstic I., Prisner T., Doose S., Heilemann M., Sauer M., Photochem. Photobiol. Sci. 2011, 10, 499–506. [DOI] [PubMed] [Google Scholar]
- 4. Das A., Ghosh I., König B., Chem. Commun. 2016, 52, 8695–8698. [DOI] [PubMed] [Google Scholar]
- 5. Ghosh I., König B., Angew. Chem. Int. Ed. 2016, 55, 7676–7679; [DOI] [PubMed] [Google Scholar]; Angew. Chem. 2016, 128, 7806–7810. [Google Scholar]
- 6. Slanina T. E., Oberschmid T., ChemCatChem 2018, 10, 4182–4190. [Google Scholar]
- 7. Aguirre-Soto A., Kaastrup K., Kim S., Ugo-Beke K., Sikes H. D., ACS Catal. 2018, 8, 6394–6400. [Google Scholar]
- 8. Ghosh I., Marzo L., Das A., Shaikh R., König B., Acc. Chem. Res. 2016, 49, 1566–1577. [DOI] [PubMed] [Google Scholar]
- 9. Shaikh R. S., Dusel S. J. S., König B., ACS Catal. 2016, 6, 8410–8414. [Google Scholar]
- 10. Graml A., Ghosh I., König B., J. Org. Chem. 2017, 82, 3552–3560. [DOI] [PubMed] [Google Scholar]
- 11. Haimerl J., Ghosh I., König B., Vogelsang J., Lupton J. M., Chem. Sci. 2019, 10, 681–687. [DOI] [PMC free article] [PubMed] [Google Scholar]
- 12. Ruckebusch C., Resolving Spectral Mixtures: With Applications from Ultrafast Time-Resolved Spectroscopy to Super-Resolution Imaging, Elsevier Science ; 2016. [Google Scholar]
- 13. Chambers R. W., Kajiwara T., Kearns D. R., J. Phys. Chem. 1974, 78, 380–387. [Google Scholar]
- 14. Lutz D. R., Nelson K. A., Gochanour C. R., Fayer M. D., Chem. Phys. 1981, 58, 325–334. [Google Scholar]
- 15. Ricard D., Lowdermilk W. H., Ducuing J., Chem. Phys. Lett. 1972, 16, 617–621. [Google Scholar]
- 16. Reichardt C., Chem. Rev. 1994, 94, 2319–2358. [Google Scholar]
- 17. Goez M., Kerzig C., Naumann R., Angew. Chem. Int. Ed. 2014, 53, 9914–9916; [DOI] [PubMed] [Google Scholar]; Angew. Chem. 2014, 126, 10072–10074. [Google Scholar]
- 18. Kerzig C., Goez M., Phys. Chem. Chem. Phys. 2014, 16, 25342–25349. [DOI] [PubMed] [Google Scholar]
- 19. Naumann R., Lehmann F., Goez M., Angew. Chem. Int. Ed. 2018, 57, 1078–1081; [DOI] [PubMed] [Google Scholar]; Angew. Chem. 2018, 130, 1090–1093. [Google Scholar]
- 20. Naumann R., Goez M., Chem. Eur. J. 2018, 24, 9833–9840. [DOI] [PubMed] [Google Scholar]
- 21. Marković Z., Tosovic J., Milenkovic D., Markovic S., Comput. Theor. Chem. 2016, 1077, 11–17. [Google Scholar]
- 22. Cooper T. K., Walker D. C., Gillis H. A., Klassen N. V., Can. J. Chem. 1973, 51, 2195–2206. [Google Scholar]
- 23. Shreve A. T., Elkins M. H., Neumark D. M., Chem. Sci. 2013, 4, 1633–1633. [Google Scholar]
- 24. Kimura Y., Alfano J. C., Walhout P. K., Barbara P. F., J. Phys. Chem. 1994, 98, 3450–3458. [Google Scholar]
- 25. Kutta R. J., Langenbacher T., Kensy U., Dick B., Appl. Phys. B 2013, 111, 203–216. [Google Scholar]
- 26. Kutta R. J., Magerl K., Kensy U., Dick B., Photochem. Photobiol. Sci. 2015, 14, 288–299. [DOI] [PubMed] [Google Scholar]
- 27. Dobryakov A. L., Kovalenko S. A., Weigel A., Perez-Lustres J. L., Lange J., Müller A., Ernsting N. P., Rev. Sci. Instrum. 2010, 81. [DOI] [PubMed] [Google Scholar]
- 28. Wilhelm T., Piel J., Riedle E., Opt. Lett. 1997, 22, 1494–1496. [DOI] [PubMed] [Google Scholar]
- 29.A. Granovsky in Firefly, version 8.0.0, http://classic.chem.msu.su/gran/firefly/index.html (accessed Aug 16, 2019).
- 30. Schmidt M. W., Baldridge K. K., Boatz J. A., Elbert S. T., Gordon M. S., Jensen J. H., Koseki S., Matsunaga N., Nguyen K. A., Su S. J., Windus T. L., Dupuis M., Montgomery J. A., J. Comput. Chem. 1993, 14, 1347–1363. [Google Scholar]
- 31. Neese F., WIREs Comput Mol Sci 2018, e1327. [Google Scholar]
- 32. Neese F., Wiley Interdiscip. Rev.: Comput. Mol. Sci. 2012, 2, 73–78. [Google Scholar]
Associated Data
This section collects any data citations, data availability statements, or supplementary materials included in this article.
Supplementary Materials
As a service to our authors and readers, this journal provides supporting information supplied by the authors. Such materials are peer reviewed and may be re‐organized for online delivery, but are not copy‐edited or typeset. Technical support issues arising from supporting information (other than missing files) should be addressed to the authors.
Supplementary


