Abstract
In view of the continuous resistance to antibacterial agents by bacteria and the existing problems of silver nanoparticles as an antibacterial agent, this study reports on the synthesis of pure zirconium oxide, silver oxide, and ZrO2-Ag2O nanoparticles by sol-gel method. The nanoparticles were analyzed and tested for their antibacterial activity against gram-positive bacteria of Bacillus subtilis, Streptococcus mutans, Staphylococcus aureus, and gram-negative of Escherichia coli, Pseudomonas aeruginosa, and Klebsiella oxytoca. X-ray diffraction showed the monoclinic ZrO2, cubic Ag2O, and peaks corresponding to ZrO2 and Ag2O in their mixed samples. Scanning electron microscopy showed spherically shaped nanoparticles while dynamic light scattering analysis showed ZrO2 (76 nm), Ag2O (50 nm), and ZrO2-Ag2O samples between 14 and 42 nm. The Fourier Transformed Infrared spectroscopy spectra of ZrO2 gave bands at 480 cm−1 to 750 cm−1 (M-O stretching) with Ag2O at 580 cm−1, while ZrO2-Ag2O samples showed bands at 760 cm−1. The screening by agar diffusion assay revealed a pronounced increase in the antibacterial activity of ZrO2-Ag2O against all the tested bacteria when compared with the pure ZrO2 and Ag2O. The improved antibacterial activity of ZrO2-Ag2O largely results from the chemical stability conferred on it by the ZrO2 as observed from the zeta potential measurement.
Keywords: antibacterial activities, ZrO2-Ag2O nanoparticles, sol-gel, metal oxides, nanomaterial
Introduction
The resistance to antibiotics by some bacteria strains has necessitated the need to find ways to overcome this problem and the progress that has been recorded in nanotechnology overtime has provided the basis for the use of nanoparticles to counter the threat of multidrug resistant bacteria. With such basis being in the use of mixed metal oxide nanoparticles, metal oxide nanoparticles is commanding huge attention worldwide for its various applications, and as recently reported by Sun et al, metal-based nanoparticles have been found useful in photodynamic therapy.1 Different metal and metal oxide can be mixed to obtain mixed metal oxide nanoparticles with unique properties that can have applications in various fields.2 Nanomaterials are particles with diameter size in the range of 1 to 100 nm where the infinitesimal size of the nanoparticles plays a big role in its unique properties.3 The peculiar morphology of nanoparticles has made it to exhibit unique properties that are adopted for various applications that are being utilized in recent time.4 Sol-gel is a sequential method that involves hydrolysis, condensation, and polymerization reaction taking place in other to form nanoparticles.5
There has been an increase in the use of zirconia as a result of its strength, toughness, and stability. Pure zirconia has 3 crystal phases depending on the temperature—monoclinic, tetragonal, and cubic. Different methods have been used to synthesize zirconia.6 However, most of this zirconia nanoparticles have been reported to be less efficient due to agglomeration and poor crystallinity. To eliminate the problem that has been reported in pure metal oxide nanoparticles,6 zirconia mixed metal oxide nanoparticles are synthesized.7 The disinfectant ability of silver has encouraged its use in many disciplines. Therefore, silver nanoparticles have been used for different purposes in medical field.8 In addition to its disinfectant ability, silver nanoparticles are economical and hence are used as a common antimicrobial agent.9 For this reason, there is a continuous research on the antibacterial property of silver nanoparticles. Many methods have been used to synthesize silver and silver oxide nanoparticles, but the concerns remain their instability which leads to agglomeration.10 All these setbacks are hindering the potency and efficacy of Ag and Ag2O nanoparticles to tackle the problem posed by bacterial resistance.
With regard to the challenges that have been reported in Ag and Ag2O nanoparticles, we aimed to synthesize ZrO2-Ag2O nanoparticles where the nanoparticles’ morphology will confer a greater surface area to volume ratio for Ag2O, thus enhancing its potency. Mixing with ZrO2 can enhance the chemical stability of Ag and lower its toxicity and in the process, increase the antibacterial activity of Ag2O nanomaterial. Finally, despite many researches that have been reported on the antibacterial activity study of Ag2O nanoparticles, we have not found studies concerning the antibacterial activity of the nanoparticles of ZrO2-Ag2O. The formation of zirconium oxide, silver oxide, and zirconia-silver oxide (ZrO2-Ag2O) nanoparticles is shown with this research work. The antibacterial activity of the nanoparticles was tested on Bacillus subtilis, Streptococcus mutans, Staphylococcus aureus, Escherichia coli, Pseudomonas aeruginosa, and Klebsiella oxytoca. It can be said that the synthesized zirconia-silver oxide nanoparticles will be useful to treat and curtail multidrug resistant bacteria strains as confirmed from our result.
Experimental Methods
Materials
Solvents used in the experiment were acetic acid and deionized water. Zirconium butoxide, ethylene glycol, silver nitrate, and citric acid were purchased from Aldrich. Antibacterial test was done using Muüller-Hinton agar plates. All reactants used were of analytical grade and were used as received. Bacillus subtilis (ATCC 19163), S mutans (ATCC 25175), S aureus (ATCC 25923), E coli (ATCC 25922), P aeruginosa (ATCC 27853), and K oxytoca (13182) were obtained from American Type Culture Collection.
Synthesis of Zirconia Nanoparticles
Zirconium butoxide (3.658 mL) was added to acetic acid (10 mL) with the addition of water (20 mL) dropwise.11 The product gives a sol in 15 minutes; this was accompanied with stirring for 5 hours. The obtained sol was placed in an oven at 80 °C for gelation which was dried at 100 °C to get a powder. The ZrO2 nanoparticles were obtained through processing and calcination of the obtained powders at 500 °C for 4 hours.
Synthesis of Ag2O Nanoparticles
Ag2O nanoparticles were prepared by sol-gel method according to past literature12 with some modifications; 3.398 g of AgNO3 was dissolved in 20 mL of deionized water. In another beaker 1.92 g of citric acid solution was prepared in 10 mL of deionized water and then, the 2 solutions prepared separately were mixed and continuously stirred for 15 minutes. Ethylene glycol was then added dropwise with continuous stirring for 3 hours with ethylene glycol acting as a sol stabilizer. The resultant precipitate obtained was washed with distilled water and then dried at 100 °C in an oven for 2 hours. Finally, the nanoparticles were put into the muffle furnace maintained at a constant temperature of 200 °C for 3 hours. Ag2O nanoparticles were thus obtained.
Synthesis of ZrO2-Ag2O Nanoparticles
ZrO2-Ag2O nanoparticles were made using sol-gel method as described by literature.11 Zirconium butoxide (3.658 mL) was mixed with acetic acid (10 mL) and was later hydrolysed with water (20 mL) dropwise. Within 15 minutes, a sol was formed. Followed by the addition of an aqueous solution of AgNO3 at different concentrations (Table 1) to the above sol with nonstop stirring. Powder was obtained when the sol was placed in an oven at 80 °C for gelation and then dried at 100 °C. ZrO2-Ag2O nanoparticles were obtained when the powders were processed and calcinated at 500 °C for 4 hours.
Table 1.
Molarity Concentration of Reagents for the Synthesis of Nanoparticles of ZrO2-Ag2O.
| Samples | Zr(OC4H9)4 (mol/dm3) | Ag (NO3)2 (mol/dm3) |
|---|---|---|
| Z-A0.1 | 1 | 0.10 |
| Z-A0.25 | 1 | 0.25 |
| Z-A0.5 | 1 | 0.50 |
| Z-A1.0 | 1 | 1.00 |
| Z-A2.0 | 1 | 2.00 |
Methods of Characterization
The characterization of the synthesized nanoparticles was carried out using different characterization techniques. The crystalline phases of the nanoparticles obtained after calcination were analyzed by X-ray diffraction (XRD), using an X’Pert PRO PANalytical instrument with Cu kα = 1.54056, 20 kV, that scanned from 5° to 80° at 2°/min scanning speed. The functional groups and the vibrational band of bonds were determined by Fourier Transformed Infrared spectroscopy (FTIR) using a Bruker Alpha-Platinum ATR instrument with 40 scans and resolution of 4 cm−1 measured between a wavelength of 4000 to 400 cm−1. Scanning electron microscopy (SEM; HITACHI S-3000) was used to determine the microstructure and morphology of the nanoparticles with an energy-dispersive X-ray spectrometer (EDX) used to analyze the component and sample purity of the nanoparticles. The mean particle size and zeta potential of the nanoparticles were measured using Horiba Scientific, SZ 100 instrument.
Determination Antibacterial Activity
Disk diffusion method was used to study the antibacterial activity of the synthesized nanoparticles. At 37 °C and a time of 20 hours, 6 different bacteria species of B subtilis, S aureus, S mutans, E coli, P aeruginosa, and K oxytoca were grown in Muller-Hinton broth. Standardized suspensions of 100 µL of each bacterium were spread on Muller-Hinton agar plates. Each nanoparticle was prepared and measured (0.2 mg) before the inhibition zone tests. The nanoparticles were subsequently placed on the bacteria culture plates. Incubation of the agar plates was done at 37 °C for 24 hours. The antibacterial tests for each of the bacteria were made in triplicate and the antibacterial effect was determined by measuring the inhibition formed (clear zone) around the nanoparticles using a Vernier calliper Instrument.13
Determination of Growth Curve
Multiskan EX (Thermo Fisher Scientific) was used to evaluate the effect of the different Z-A samples based on their interaction with the bacterial culture with the results interpreted in graphical form to give the growth kinetics. The bacteria that were cultured overnight were diluted with soy medium to an absorbance of 0.1 at a wavelength of 540 nm with measurement taken using a Perkin Elmer Lambda spectrophotometer 35. The diluted culture was pipetted into a microplate (total volume of 100 µL) alone as the control then, followed with the different nanoparticles weighed at 0.2 mg each. Readings were taken at time 0, then at each half-hour for 24 hours at 37 °C. Thereafter, the measured absorbance interpreted for the growth kinetics of each bacteria were then represented graphically.11
Results and Discussion
At the completion of the synthetic sol-gel process, the procedure was followed by the drying and calcination of the obtained ZrO2, Ag2O, and Z-A nanoparticles. The interaction between zirconium butoxide and silver nitrate represents a typical sol-gel reaction that highlights the hydrolysis and condensation reaction. Hydrolysis of zirconium butoxide was shown in Equation (1) accompanied by condensation reaction and this leads to the appearance of Zr-O-Zr bonds as shown in Equation (2). The complete process that takes place in the production of ZrO2, and Z-A nanoparticles by sol-gel method using a metal-organic precursor were shown below:
| 1 |
| 2 |
The addition of varying concentration of aqueous silver nitrate to zirconium butoxide maintained at a constant concentration dictates the relative rate of hydrolysis and condensation, as the rate of hydrolysis and condensation is dependent on the kind of the inorganic metal.14 The properties of Z-A nanoparticles and the subsequent reaction processes were determined by the chemistry that occurs in the early stage of the reaction.15 Therefore, the outcome of the processes of these reactions plays a major role in determining the structure and morphology of the resulting Z-A nanoparticles. As the outcome depends on the synthesis conditions that are relative to various parameters.16,17 In this work, we only vary the concentration of one of the starting materials while keeping all other conditions constant. The size and size distribution of the nanoparticles were found to depend on the relative concentration of silver nitrate. Thus, Z-A samples have been prepared using fixed concentration of zirconium butoxide against varying concentration of AgNO3.
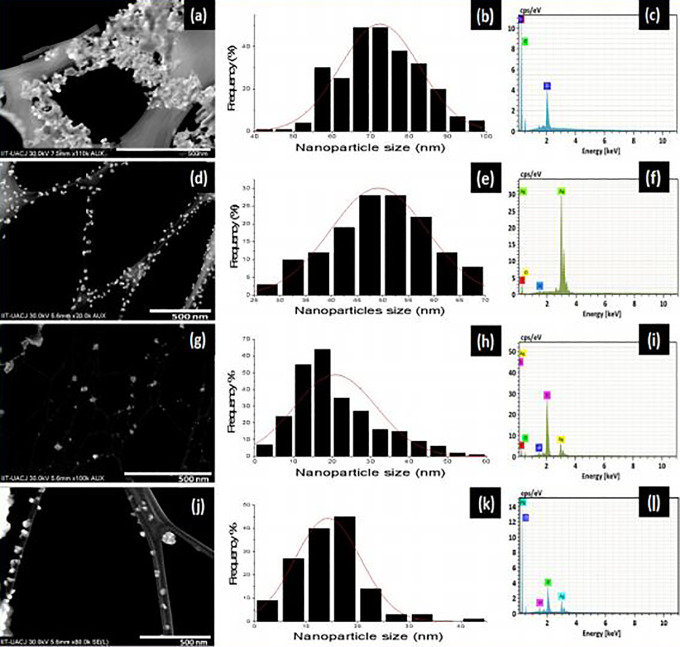
Scanning electron microscopy studies were done to study the morphology of ZrO2, Ag2O, and representatives of Z-A samples (Z-A0.5 and Z-A2.0 nanoparticles). The scanning transmission electron microscopy (STEM) micrographs, particle size distribution, and EDX images of ZrO2, Ag2O, Z-A0.5, and Z-A2.0 nanoparticles are shown in Figure 1, respectively. The SEM micrographs for all the samples reveal the morphology as spherically shaped nanoparticles. Although the sizes of the nanoparticles are not homogeneous. ZrO2 and Ag2O nanoparticles were densely packed and randomly oriented. The particle size distribution as shown in Figure 1(B, E, H, and K) was determined by measurement with STEM to show the distribution with a mean particle size. ZrO2 and Ag2O have nanoparticles sizes of 72 and 49 nm, respectively, while the representative samples of the mixed metal oxide of Z-A0.5 and Z-A2.0 have sizes of 20 and 14 nm, respectively. A thorough look at the STEM images reveals that for pure ZrO2 and Ag2O samples the nanoparticles were nonuniformly distributed, but in the Z-A samples, there was a difference in the distribution. ZrO2 nanoparticles and Ag2O nanoparticles were aggregated without clarity of the dispersity of the nanoparticles with Z-A0.5 appearing to be more disperse than ZrO2 and Ag2O, while Z-A2.0 are highly monodispersed and uniform in sizes with 1 or 2 aggregated nanoparticles.
Figure 1.
Scanning transmission electron microscopy (STEM) micrographs, particle size distribution, and X-ray spectrometer (EDX) images, respectively, of ZrO2 (a, b, c), Ag2O (d, e, f), Z-A0.5 (g, h, i), and Z-A2.0 (j, k, l).
To have a better estimation of the size distribution of ZrO2 and Ag2O nanoparticles, the agglomerated particles were sonicated for few seconds. As the amount of Ag2O on the surface of ZrO2 increases, the specific surface area of the nanoparticles becomes larger. It could be explained in terms of decreasing the growth rate of the nanoparticles by increasing the amount of Ag2O on the surface of the ZrO2 which leads to the decrease of particle size and subsequently a larger surface area to volume ratio of the Z-A nanoparticles.
The elemental composition of the samples such as Zr, Ag, and O were examined using energy dispersive X-ray analysis (EDX) and the EDX images of pure ZrO2, Ag2O, Z-A0.5, and Z-A2.0 are shown in Figure 1(C, F, I, and L). The presence of carbon in the EDX images was due to the carbon grid and aluminium was as a result of the support base for the nanoparticles. The EDX image showed the presence of zirconium and oxygen in image (Figure 1C), silver and oxygen in Figure 1F, zirconium, silver, and oxygen in Figure 1I and L to validate the element that constitutes each sample. The nonreflection of any other peak apart from those that constitutes the samples is the evidence for the purity of the samples. Particle size analysis was done to estimate the particle size distribution of the synthesized samples of ZrO2, Ag2O, Z-A0.1, Z-A0.25, Z-A0.50, Z-A1.0, and Z-A2.0 nanoparticles in deionized water. The mean diameter sizes were recorded as 76 ± 2.4, 50 ± 3.2, 42 ± 2.2, 35 ± 1.8, 21 ± 1.0, 15 ± 1.5, and 14 ± 1.7 nm, respectively.
X-ray diffraction was measured on 7 samples in total. All the samples were in the form of thin powder placed on a clear amorphous glass substrate. Figure 2 shows the phases in crystalline form of zirconia-silver oxide nanoparticles. The XRD patterns of the nanoparticles give the major 2θ peak values at 24.6°, 28.6°, 31.9°, 35.4°, 50.6°, 55.8°, and 60.3° in accordance with monoclinic zirconia; the peak values matched with the international standard file (JCPDS file no. 37-1484). In addition, all the reflections for Ag2O nanoparticles could be indexed based on pure silver oxide having the symmetry of face center cubic. The peaks designated to the planes with the hkl values of 38.08° (111), 44.26° (200), 64.39° (220), and 77.36° (311), respectively, are the same with the XRD pattern of the cubic silver oxide JCPDS No: 04 -0783 (110). From the diffractogram of Z-A samples, peaks at 50.6° (311) and 60.3° (222) match with the diffractogram peak of ZrO2 while peaks at 38.08° (111), 44.26° (200), 64.39° (220), and 77.36° (311) match with the diffractogram peaks of Ag2O and the peaks become more pronounced as the Ag2O concentration on ZrO2 increases.
Figure 2.
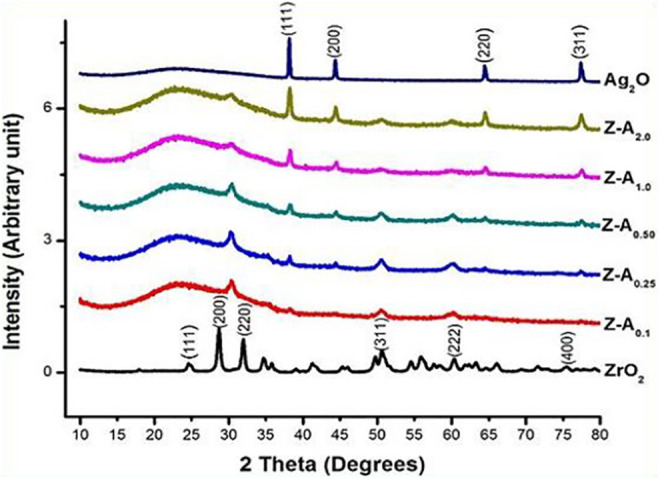
X-ray diffraction (XRD) patterns of ZrO2, Ag2O, and Z-A samples.
The XRD of Z-A0.1, Z-A0.25, and Z-A0.50 which are the samples containing high concentration of zirconium butoxide when compared with the silver nitrate content have shorter and more broaden peaks when compared with Z-A1.0 and Z-A2.0 samples which have equal and higher concentration of zirconium butoxide to silver nitrate ratio, respectively. The difference in the peak pattern can be said to be because of the difference in the amount of Ag2O dispersed on the surface of the ZrO2 nanoparticles. Apart from these peaks, there are extra notable characteristics of the diffractogram which is a big signal that spread between 20° and 30° and the high background due to the amorphous glass substrate used that is seen at low angles which is absent from the diffractogram of ZrO2 and Ag2O due to the large samples used for these analyses that prevent the reflection of the amorphous glass substrate in the diffractogram pattern. The mean crystallite size of the nanoparticles was estimated by X-ray line-broadening technique employing the Scherrer formula. Increasing the weight of silver against a fixed weight of zirconium leads to a change in the diffractogram for silver in the mixed samples which resulted in a change in peak intensity and diffraction angle which determines the crystallite size.
Table 2 shows the crystallite size of the samples at their various crystalline orientations at different concentration of AgNO3. The size of the crystallite was calculated from the broadening of XRD peaks by Scherrer’s formula18
Table 2.
The Crystallite Size of the Synthesized Samples.
| Samples | Crystallite size (nm) |
|---|---|
| ZrO2 | 61 |
| Ag2O | 49 |
| Z-A0.1 | 41 |
| Z-A0.25 | 35 |
| Z-A0.5 | 18 |
| Z-A1.0 | 13 |
| Z-A2.0 | 10 |
| 3 |
With θ being the Bragg angle of diffraction lines, K as the shape factor represented as 0.9, λ standing for the wavelength of incident X rays (λ = 0.154056 nm), and β as the full width at half maximum. From the calculation of the crystallite size, as the AgNO3 concentration increases, the crystallite size decreases, and this shows agreement to the STEM result. The difference between the crystallite size and the size obtain from the STEM analysis is that the crystallite size gives the size of the crystal structure, while STEM analysis gives the nanoparticles size.
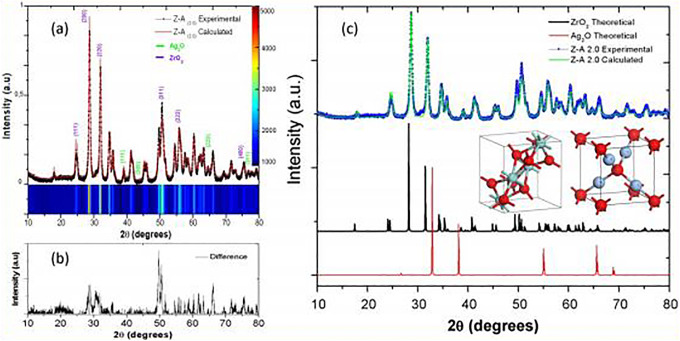
To establish the quantity of phase present in the composite, Rietveld refinement was carried out to determine the ZrO2 and Ag2O phases. Rietveld refinement gives the total number of crystalline phases present in the composite. Figure 3A shows the experimental XRD pattern of Z-A2.0 sample (normalized) and their respective refined pattern. Also, a 2-D mapping of the XRD pattern intensities is shown in Figure 3. The difference between the experimental and calculated XRD pattern is shown in Figure 3B and C. This graph shows a close approximation during the Refinement process. In this sense, Table 3 indicates the percentage by weight of the phases present in the Z-A samples. The residual parameters of the refinement are also indicated in Table 3. In all cases, the value of the residual parameter is less than 1.5.
Figure 3.
X-ray diffraction (XRD) pattern derived from the Rietveld refinement of Z-A2.0 sample.
Table 3.
Quantitative Phase Analysis of the ZrO2, Ag2O, and Z-A Samples.
| Sample | Composition | ZrO2 (%), JCPDS No: 37-1484 | Ag2O (%), JCPDS No: 04 -0783 | Residual parameter |
|---|---|---|---|---|
| ZrO2 | ZrO2 | 100 | 0 | 1.32 |
| Z-A0.1 | Z-A0.1 | 100 | 0 | 1.24 |
| Z-A0.25 | ZrO2-Ag2O (0.25) | 100 | 0 | 1.22 |
| Z-A0.5 | ZrO2 -Ag2O (0.5) | 100 | 0 | 1.21 |
| Z-A1.0 | ZrO2 -Ag2O (1.0) | 89.7 | 10.3 | 1.12 |
| Z-A2.0 | ZrO2 -Ag2O (2.0) | 80.9 | 19.1 | 1.48 |
In this case, it is important to note that the samples of Z-A0.1, Z-A0.25, and Z-A0.5 show a 100% wt of the ZrO2 phase, due to the minimal quantity of Ag2O phase present in these samples. However, in the samples of Z-A1.0 and Z-A2.0, it is easy to recognize both phases (ZrO2 and Ag2O). Consequently, it is possible to affirm that at concentration ratio (Zr (OC4H9)4/AgNO3) of 1:1 and 1:2, it is possible to identify both phases, and the ZrO2-Ag2O composite formation is confirmed by the XRD technique.
Fourier transformed infrared spectroscopy
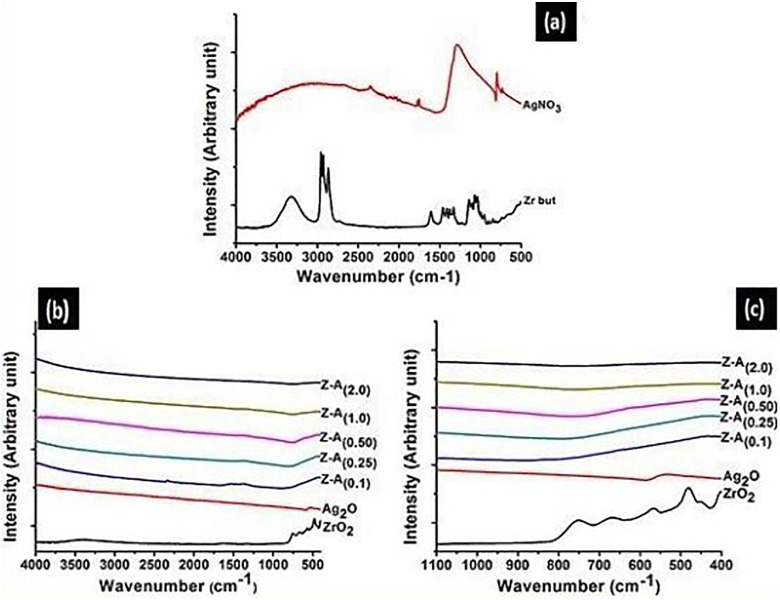
The 7 samples were further examined by FTIR and the analytical results were reported. The Ft-Ir of pure zirconium butoxide, AgNO3, ZrO2, Ag2O, and Z-A samples, within the span of 4000 to 400 cm−1, are shown in Figure 4A-C, respectively. The infrared spectra of silver nitrate and zirconium butoxide are shown in Figure 5A. By comparing the infrared spectra of the precursor to the infrared spectra of the products (Figure 4B), it was observed that some bands have vanished due to the calcination of the products, and this leads to the appearance of new bands which ascertain that a new product was gotten. The absorption bands of zirconium butoxide are illustrated in Table 4, and the bands were allocated to their corresponding vibrations.11
Figure 4.
Fourier Transformed Infrared spectroscopy (FTIR) spectra of (A) Zirconium butoxide and AgNO3 (B) ZrO2, Ag2O, and Z-A samples (C) fingerprint region of ZrO2, Ag2O, and Z-A samples.
Figure 5.
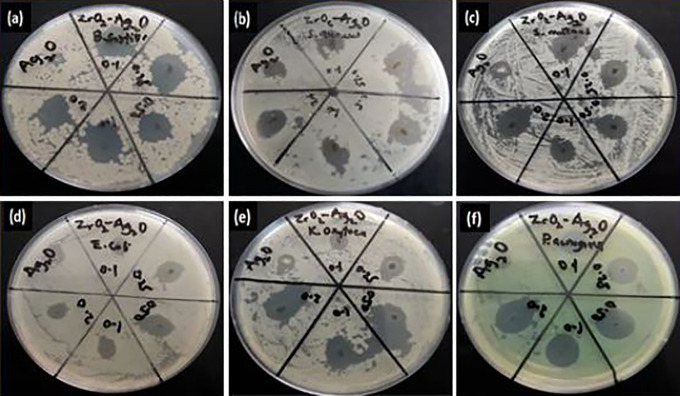
Disk diffusion measurement of Ag2O and Z-A nanoparticles against (A) Bacillus subtilis (B) Staphylococcus aureus (C) Streptococcus mutans (D) Escherichia coli (E) Klebsiella oxytoca (F) Pseudomonas aeruginosa.
Table 4.
FTIR bands of Zirconium Butoxide.11
| Bands (cm−1) | Functional group |
|---|---|
| 2975 | vas CH3 |
| 2946 | vas CH3 |
| 2934 | vas CH3 |
| 2907 | vas CH3 |
| 2875 | vs CH2 |
| 2861 | vas CH3 |
| 1564 | vas CO |
| 1365 | CH3 |
| 1193 | Tert-butyl stretching |
| 786 | Sym skeletal vibration of tert-butyl group |
Abbreviation: FTIR, Fourier Transformed Infrared spectroscopy.
The infrared spectrum of ZrO2, Ag2O, and Z-A samples is shown in Figure 4B, while Figure 4C reveals that the absorption bands (M-O) are located within the fingerprint region. The bands that showed up within 560 to 750 cm−1 were allocated to the metal-oxygen stretching mode due to interatomic vibration.18 The characteristic absorption bands at 580 cm−1 shows Ag–O bond, which confirms Ag2O presence and the characteristic absorption bands at 750, 680, and 480 cm−1 confirm Zr–O bonds and it gave a clear evidence about the presence of ZrO. The Fourier transform infrared spectra of Z-A samples illustrate the appearance of new peaks at 760 cm−1 when a comparison is made with the spectra of the precursors (zirconium butoxide and silver nitrate). This is because of the symmetric and asymmetric stretching bands of butoxide that was used as one of the precursors.11
Determination of the zeta potential of ZrO2-Ag2O nanoparticles
Zeta potential is characterized by the net surface charge of the nanoparticles. It is the estimation of the difference in potential between the static layer of the fluid connected to the dispersed particle and the dispersion medium. The surface charges present within the nanoparticles determine its ability to repulse or attract one another. Hence, the values obtained from the zeta potential measurement can be used to explain if the nanoparticles will agglomerate or disperse. In Table 5, Z-A2.0 with a mean nanoparticles size of 14 nm has the biggest value of zeta potential to be −62.73 mV and for that reason, it is excellently stable while nanoparticles of ZrO2 having a mean size of 76 nm possess a zeta potential of −17.27 mV and for that reason, it is incipiently instable. It was observed that the higher the concentration of AgNO3 against zirconium butoxide, the higher the nanoparticles’ stability.
Table 5.
pH, Mean Zeta Potential Data With the Stability Behavior of ZrO2, Ag2O, and Z-A Samples.
| Samples | pH | Average zeta potential (mV) | Mean zeta potential (mV) literature | Stability behavior of the nanoparticle21 |
|---|---|---|---|---|
| ZrO2 | 9.38 | −17.27 ± 2.2 | −17.4019 pH = 9.4 | Incipient instability |
| Ag2O | 6.60 | −41.61 ± 1.8 | 16.7120 pH = NS | Moderate stability |
| Z-A0.1 | 8.60 | −43.79 ± 1.6 | NA | Moderate stability |
| Z-A0.25 | 8.50 | −53.84 ± 1.1 | NA | Moderate stability |
| Z-A0.50 | 7.92 | −55.22 ± 1.7 | NA | Moderate stability |
| Z-A1.0 | 7.86 | −60.60 ± 1.0 | NA | Excellent stability |
| Z-A2.0 | 7.62 | −62.73 ± 1.9 | NA | Excellent stability |
Abbreviations: NA, information not available; NS, not stated.
Determination of Antibacterial Activity of Ag2O and Z-A Nanoparticles
The antibacterial test was conducted using the method of disk diffusion (Figure 5) and the antibacterial activity of ZrO2, Ag2O, and Z-A nanoparticles showing the zone of inhibition in (mm) against the different bacteria are illustrated in Table 6.
Table 6.
Antibacterial Activity of ZrO2, Ag2O, and Z-A Nanoparticles.
| Samples | Bacillus subtilis (mm) | Streptococcus mutans (mm) | Staphylococcus aureus (mm) | Escherichia coli (mm) | Pseudomonas aeruginosa (mm) | Klebsiella oxytoca (mm) |
|---|---|---|---|---|---|---|
| ZrO2 | 0 | 0 | 0 | 0 | 0 | 0 |
| Ag2O | 7 ± 0.6 | 8 ± 1.2 | 9 ± 1.5 | 11 ± 1.4 | 6 ± 0.9 | 7 ± 0.9 |
| Z-A0.1 | 12 ± 1.9 | 11 ± 1.1 | 10 ± 0.7 | 11 ± 1.6 | 11 ± 1.1 | 8 ± 1.4 |
| Z-A0.25 | 13 ± 0.5 | 11 ± 0.5 | 11 ± 1.2 | 12 ± 0.9 | 13 ± 2.0 | 11 ± 1.4 |
| Z-A0.50 | 13 ± 0.7 | 13 ± 1.3 | 14 ± 2.7 | 13 ± 0.6 | 14 ± 0.5 | 13 ± 1.0 |
| Z-A1.0 | 14 ± 0.8 | 14 ± 1.4 | 15 ± 1.1 | 15 ± 1.5 | 16 ± 1.9 | 13 ± 1.2 |
| Z-A2.0 | 17 ± 1.4 | 14 ± 2.5 | 16 ± 0.3 | 15 ± 1.6 | 16 ± 0.8 | 14 ± 1.9 |
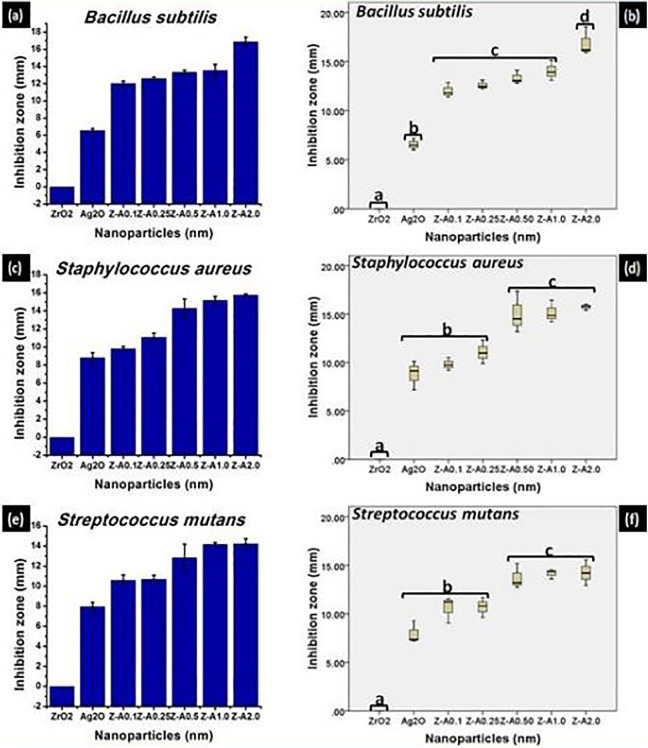
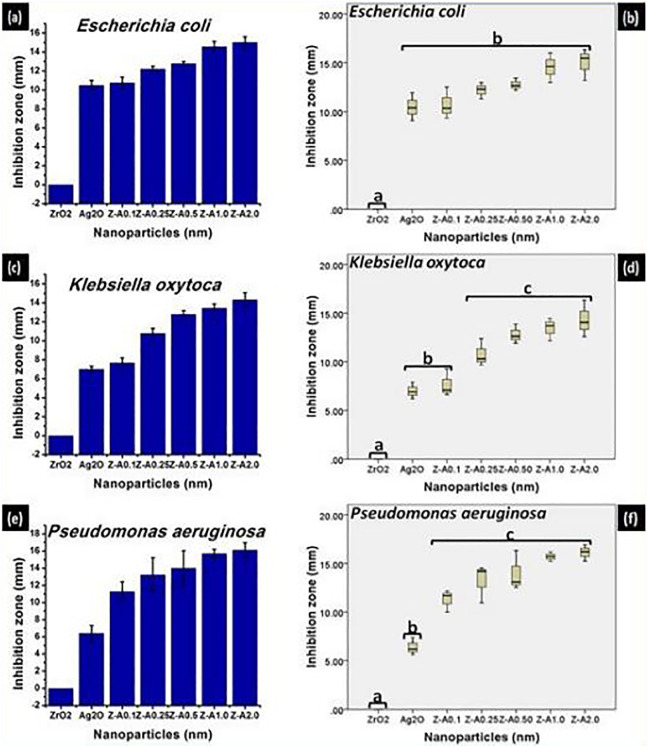
The antibacterial activity of the nanoparticles was estimated based on the average size of the zone of inhibition formed around the nanoparticles on the seeded agar plate. From Figure 6(A, C, E), Z-A samples give higher inhibition zone against gram-positive bacteria when compared with Ag2O, while ZrO2 nanoparticles did not record any inhibition. Figure 7(A, C, and E) shows the inhibition zones recorded against the gram-negative bacteria by the different samples. Pronounced increase in inhibition zone was recorded for Z-A samples when compared with Ag2O, while ZrO2 has no inhibition in relation to any of the gram-negative bacteria. The inhibition zone for the different bacteria across the Z-A samples increases as the amount of Ag2O to ZrO2 increases with Z-A2.0 recording the biggest zone of inhibition against all the tested bacteria.
Figure 6.
The inhibition zone and the statistical evaluation of the inhibition zone, respectively, formed on (A, B) Bacillus subtilis (C, D) Staphylococcus aureus (E, F) Streptococcus mutans by the nanoparticles.
Figure 7.
Inhibition zone and the statistical evaluation of the inhibition zone, respectively, formed on (A, B) Escherichia coli (C, D) Klebsiella oxytoca (E, F) Pseudomonas aeruginosa by the nanoparticles.
The synthesized nanoparticles except ZrO2 exhibited toxicity against all the tested bacteria at different rates with the difference in the extent of toxicity between gram-positive and gram-negative bacteria already explained in previous literature.22 The highest antimicrobial effect was recorded with Z-A2.0 nanoparticles against all the tested bacteria. The enhanced antibacterial activity of the synthesized Z-A samples may be because of their excellent stability, tiny size, and their exceptionally large surface area to volume ratio. Increase in the specific surface area of the nanoparticles, increases their antibacterial effectiveness.23
The excellent stability of the Z-A samples is responsible for their improved antimicrobial activity. The toxicity to bacteria viewed in terms of inhibition zone significantly varied with the tested bacteria and the type of Z-A samples used. This differential toxicity effect of the Z-A samples can be attributed to their different sizes as the toxicity impact on the bacteria increases with decreasing size of the Z-A nanoparticles.23–25 The main mechanism of the synthesized Z-A nanoparticles’ toxicity is connected to the bonding of Z-A nanoparticles to the negatively charged cell wall of the bacteria from where they are able to penetrate the cell membrane as a result of their small size to disrupt its form and the permeability of their plasma membrane. In addition, it has been reported that silver ions that are freed from the surface of the nanoparticles add to their toxicity. The liberated silver ions enter the bacterial cells and stop a lot of enzymatic cellular activity that eventually results to death.24–30 Although, there have been reports that shows that there is high possibility that Z-A samples not only interact with the surface of the membrane but also penetrate inside the bacteria. This leads to silver ions interacting with the DNA of bacteria, thereby hindering cell reproduction. The synthesized Z-A nanoparticles show sufficient toxicity when compared with other compounds because of their huge surface area to volume ratio that gives better connection with the bacteria.
Growth Characteristics
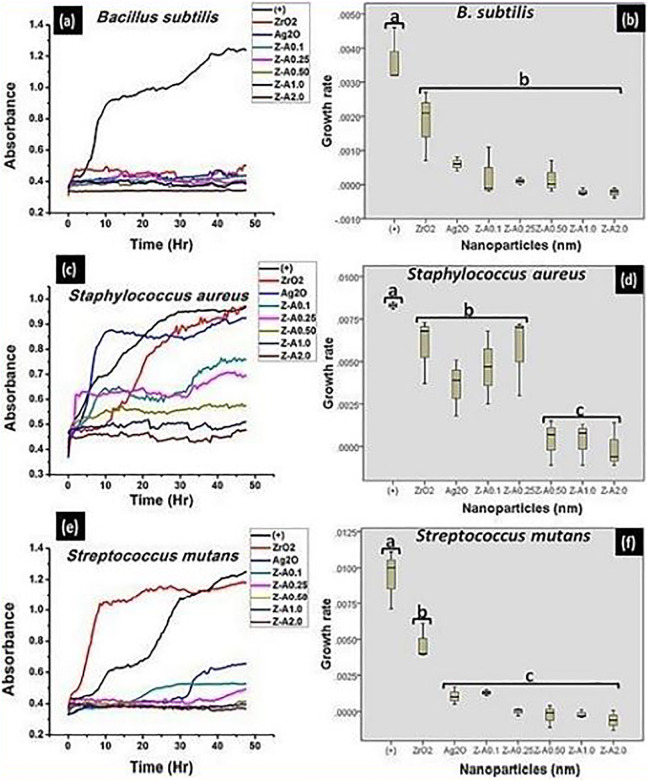
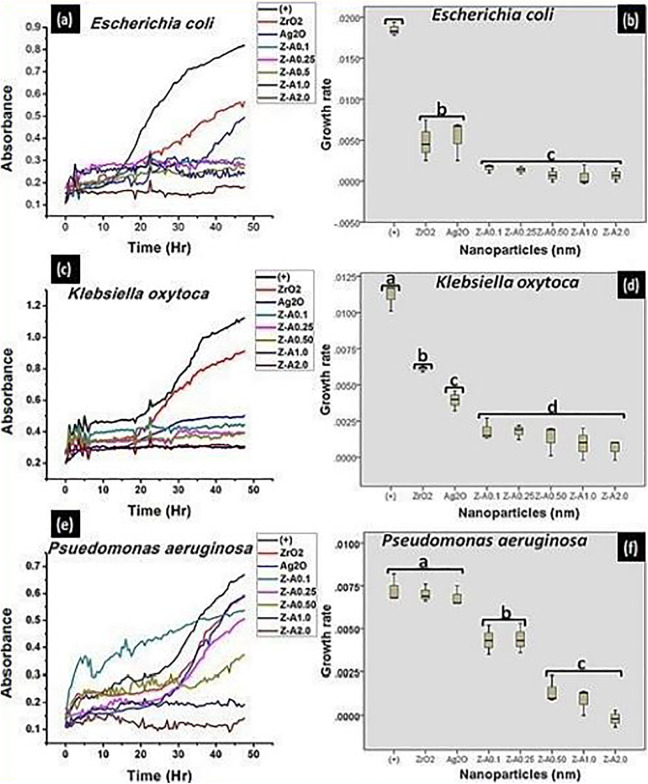
The wavelength of 540 nm was used to assess the different bacterial growth with time, and the results were plotted using Origin 8.5 Analysis Software (Figures 8 and 9 [A, C, E]). Readings were taken for each well at 96 counts for 24 hours at an interval of 30 minutes. The samples show resistance to the bacterial growth, so that the turbidity formed by the increase in bacteria growth is inversely proportional to the concentration of each of the sample. The tested bacteria were responsive to the nanoparticles and they grew in the culture medium relative to the concentration of each of the nanoparticles.11 The bacterial growth kinetics of solutions containing different samples in soy broth inoculated with 3 gram-positive and 3 gram-negative bacteria are displayed in Figure 8 and Figure 9, respectively. The bacterial growth was observed to be faster for the control and for ZrO2 and Ag2O nanoparticles than for the Z-A nanoparticles. Zirconia nanoparticles which recorded no inhibition against any of the tested bacteria in the disk diffusion method was seen to record some percentage of inhibition in the microdilution analysis which shows that zirconia nanoparticles was able to generate some amount of ROS in the soy broth that leads to bacteria growth inhibition. Given that the generation time and the lag phase duration of the tested bacteria are functions of the concentration of each of the nanoparticles and the conditions necessary for bacterial increase and development are the same in each of the wells, bacterial growth occurs differently for each of the samples.11
Figure 8.
The growth kinetics and the evaluation of the statistical data obtained from the growth kinetics, respectively, formed on (A, B) Bacillus subtilis (C, D) Staphylococcus aureus (E, F) Streptococcus mutans by the nanoparticles.
Figure 9.
The growth kinetics and the evaluation of the statistical data obtained from the growth kinetics, respectively, formed on (A, B) Escherichia coli (C, D) Klebsiella oxytoca (E, F) Pseudomonas aeruginosa by the nanoparticles.
Statistical Analysis
Figures 6, 7, 8, and 9 (B, D, F) present the information from the statistical analyses gotten from the antibacterial activity study of ZrO2, Ag2O, and Z-A nanoparticles by utilizing SPSS 16.0. The calculations were done in 3-fold and the products were given as mean ± standard deviation. Antibacterial assay was done with the best form of dilutions for each of the samples. Analysis of variance of the 1-way concept was utilized to analyze the obtained data from the different samples. This is followed by Tukey multiple comparison test. The P values ≤.05 were taken as indicative of statistical significance.
Table 7 provides the comparison in the inhibition zone (mm) formed on some of the tested bacteria by the synthesized Z-A nanoparticles from this present study with those of the previously reported material. From the comparison, Z-A nanoparticles show superior antibacterial activity when compared with other previously reported materials.
Table 7.
Comparison of the Zone of Inhibition (mm) Formed by Different Reported Materials Against Some Gram-Positive and Gram-Negative Bacteria With the Synthesized Z-A2.0 Nanoparticles.
| Bacteria | Material | Concentration (M) | Inhibition zone (mm) | References |
|---|---|---|---|---|
| Bacillus subtilis | Ag | 3 mM | 6-7 | 25 |
| Bacillus subtilis | Ag | 6 mM | 12 | 26 |
| Bacillus subtilis | MgO-ZrO2 | 2:1 | 9 | 27 |
| Bacillus subtilis | MoO3-ZrO2 | 1:1 | 0 | 28 |
| Bacillus subtilis | ZrO2-Ag2O | 1:2 | 17 | Present work |
| Staphylococcus aureus | MgO-ZrO2 | 2:1 | 10 | 27 |
| Staphylococcus aureus | ZnO-ZrO2 NCs | 1:1 | 17 | 29 |
| Staphylococcus aureus | ZrO2-ZnO | 1:8 | 8 | 30 |
| Staphylococcus aureus | MoO3-ZrO2 | 1:1 | 0 | 28 |
| Staphylococcus aureus | ZrO2-Ag2O | 1:2 | 16 | Present work |
| Escherichia coli | MgO-ZrO2 | 2:1 | 12 | 27 |
| Escherichia coli | ZnO-ZrO2 NCs | 1:1 | 17 | 29 |
| Escherichia coli | MoO3-ZrO2 | 1:1 | 14 | 28 |
| Escherichia coli | ZrO2-Ag2O | 1:2 | 15 | Present work |
| Pseudomonas aeruginosa | Ag | 6 mM | 6 | 26 |
| Pseudomonas aeruginosa | ZnO-ZrO2 NCs | 1:1 | 12 | 29 |
| Pseudomonas aeruginosa | ZrO2-Ag2O | 1:2 | 16 | Present work |
Conclusion
Sol-gel method has been used to successfully prepare ZrO2, Ag2O, and Z-A nanoparticles. The XRD analysis showed monoclinic ZrO2, cubic Ag2O, and the presence of peaks corresponding to ZrO2 and Ag2O in Z-A samples. The SEM analysis showed that Z-A2.0 have the smallest evidence of agglomeration. Dynamic light scattering analysis revealed that Z-A2.0 is the smallest with a mean size of 14 nm, while ZrO2 nanoparticles have the largest mean size of 76 nm. Due to their excellent stability as confirmed from the zeta potential measurement, Z-A2.0 nanoparticles have the highest toxicity against all the tested bacteria as shown from the result of the antibacterial activity study, while ZrO2 nanoparticles did not show any toxicity to any of the tested bacteria due to their high agglomeration, high size of nanoparticles and their incipient instability.
Acknowledgments
The authors thank PRODEP, Universidad Autónoma de Ciudad Juárez, and CONACYT.
Footnotes
Declaration of Conflicting Interests: The author(s) declared no potential conflicts of interest with respect to the research, authorship, and/or publication of this article.
Funding: The author(s) received no financial support for the research, authorship, and/or publication of this article.
ORCID iD: Simón Yobanny Reyes-López  https://orcid.org/0000-0002-9017-3233
References
- 1. Sun J, Kormakov S, Liu Y, Huang Y, Wu D, Yang Z. Recent progress in metal-based nanoparticles mediated photodynamic therapy. Molecules. 2018;23(7):1704. [DOI] [PMC free article] [PubMed] [Google Scholar]
- 2. Pramesh NK, Ajay KB, Ravichandra SM, Kenneth JK. Mixed metal oxide nanoparticles Dekker Encyclopedia of Nanosciences and Nanotechnology. Marcel Dekker Inc; 2004. doi:10.1201/NOE0849396397.ch197 [Google Scholar]
- 3. Hanemann T, Szabó DV. Polymer-nanoparticle composites: from synthesis to modern applications. Materials. 2010;3(6):3468–3517. [Google Scholar]
- 4. Cao D, Gong S, Shu X, Zhu D, Liang S. Preparation of zinc oxide nanoparticles with high dispersity based on oriented attachment (OA) process. Nanoscale Res. 2019;14:210. [DOI] [PMC free article] [PubMed] [Google Scholar]
- 5. Hasnidawani JN, Azlina HN, Norita H, Bonnia NN, Ratim S, Ali ES. Synthesis of ZnO nanostructures using sol-gel method. Procedia Chem. 2016;19:211–216. doi:10.1016/j.proche.2016.03.095 [Google Scholar]
- 6. Nimare P, Koser AA. Biological synthesis of ZrO2 nanoparticle using azadirachta indica leaf extract. IRJET. 2016;3(7):1910–1912. Issue: P-ISSN: 2395-0072, e-ISSN: 2395-0056. [Google Scholar]
- 7. Bashir M, Ashraf A, Imtiaz M, Riaz S, Naseem S. Synthesis and characterization of ZrO2-ZnO nanoparticles. Proc. World Congress on Advances in Nano, Biomechanics, Robotics and Energy Research (ANBRE); COEX Seoul, Korea; 2013. [Google Scholar]
- 8. Lee SH, Jun BH. Silver nanoparticles: synthesis and application for nanomedicine. Int J Mol. 2019;20(4):865 doi:10.3390/ijms20040865 [DOI] [PMC free article] [PubMed] [Google Scholar]
- 9. Lamsal K, Kim SW, Jung JH, Kim YS, Kim KS, Lee YS. Application of silver nanoparticles for the control of colletotrichum species in vitro and pepper anthracnose disease in field. Mycobiology. 2011;39(3):194–199. [DOI] [PMC free article] [PubMed] [Google Scholar]
- 10. Meruvu H, Vangalapati M, Chippada SC, Bammidi SR. Synthesis and characterization of zinc oxide nanoparticles and its antimicrobial activity against Bacillus subtilis and Escherichia coli. Rasayan J Chem. 2011;4(1):217–222. ISSN: 0974-1496. [Google Scholar]
- 11. Ayanwale AP, López SYR. ZrO2-ZnO nanoparticles as antibacterial agents. ACS Omega. 2019;4(21):19216–19224. [DOI] [PMC free article] [PubMed] [Google Scholar]
- 12. Harish K, Manisha K. . Synthesis and characterization of silver-oxide nanoparticles by sol-gel method. Int J of Adv Res in Sci and Eng 2018;7(3):632–637. [Google Scholar]
- 13. Chudobova D, Nejdl L, Gumulec J, et al. Complexes of silver (i) ions and silver phosphate nanoparticles with hyaluronic acid and/or chitosan as promising antimicrobial agents for vascular grafts. Int J Mol Sci. 2013;14(7):13592–13614. [DOI] [PMC free article] [PubMed] [Google Scholar]
- 14. Rolison DR, Dunn B. Electrically conductive oxide aerogels: new materials in electrochemistry. J Mater Chem Royal Chem Soc. 2001;11(4):963–980. [Google Scholar]
- 15. Nataliya YA, Turova EPT, Kessler VG, Yanovskaya MI. The Chemistry of Metal Alkoxides. Kluwer Academic Publishers; 2002. [Google Scholar]
- 16. Yoldas BE. Zirconium oxides formed by hydrolytic condensation of alkoxides and parameters that affect their morphology. J Mater Sci. 1986;21(3):1080–1086. [Google Scholar]
- 17. Marikkannan M, Vishnukanthan V, Vijayshankar A, Mayandi J, Pearce JM. A novel synthesis of tin oxide thin films by the sol-gel process for optoelectronic applications. AIP Adv. 2015;5(2):027122–027130. 10.1063/1.4909542 [DOI] [Google Scholar]
- 18. Muthuchudarkodi RR, Vedhi C. Synthesis and characterization of nano CuO-ZrO2 mixed oxide. Adv Mater Res. 2013;678:50–55. doi:10.4028/www.scientific.net/AMR.678.50 [Google Scholar]
- 19. Idzkowskan A, Wiecinska P, Szafran M. Acryloyl derivative of glycerol in fabrication of zirconia ceramics by polymerization in situ. Ceramics Int. 2014;40(8):13289–13298. doi:10.1016/j.ceramint.2014.05.039 [Google Scholar]
- 20. Rokade AA, Patil MP, Yoo SI, Lee WK, Park SS. Pure green chemical approach for synthesis of Ag2O nanoparticles. Green Chem Lett Rev. 2016;9(4):216–222. doi:10.1080/17518253.2016.1234005 [Google Scholar]
- 21. Greenwood R, Kendall K. Electroacoustic studies of moderately concentrated colloidal suspensions. J Eur Ceramic Soc. 1999;19(4):479–488. [Google Scholar]
- 22. Amornpitoksuk P, Suwanboon S, Sangkanu S, Sukhoom A, Wudtipan J, Srijan K, Kaewtaro S. Synthesis, characterization, photocatalytic and antibacterial activities of Ag-doped ZnO powders modified with a diblock copolymer. Powder Technol. 2012;219:158–164. [Google Scholar]
- 23. Stankic S, Suman S, Haque F, Vidic J. Pure and multi metal oxide nanoparticles: synthesis, antibacterial and cytotoxicity properties. J Nanobiotechnol. 2016;14(1):73 doi:10.1186/s12951-016-0225-6 [DOI] [PMC free article] [PubMed] [Google Scholar]
- 24. Salar RK, Sharma P, Kumar N. Enhanced antibacterial activity of streptomycin against some human pathogens using green synthesized silver nanoparticles. Resour Effic Technol. 2015;1(2):106–115. [Google Scholar]
- 25. Khurana C, Sharma P, Pandey OP, Chudasama B. Synergistic effect of metal nanoparticles on the antimicrobial activities of antibiotics against biorecycling microbes. J Mater Sci Technol. 2016;32(6):524–532. [Google Scholar]
- 26. Jagtap UB, Bapat VA. Green synthesis of silver nanoparticles using Artocarpus heterophyllus Lam. seed extract and its antibacterial activity. Ind Crops Prod. 2013;46:132–137. [Google Scholar]
- 27. Kumar PR, Muthuchudarkodi RR. Preparation, characterization and antibacterial applications of MgO-Zro2 mixed oxide nanoparticles. IJSEM. 2017;2(12):113–116. [Google Scholar]
- 28. Kalaiarasi S, Sankaravadivu S. Chemical synthesis, thermochemical, electrochemical and biological behaviour of MoO3-ZrO2 mixed oxide nanoparticles. Int J Adv Sci Res Manage. 2019;(4):116–121. ICAMA-18. [Google Scholar]
- 29. Sultana S, Rafiuddin MZ, Khan K, Umar M, Muneer J. Electrical, thermal, photocatalytic and antibacterial studies of metallic oxide nanocomposite doped polyaniline. Mater Sci Technol. 2013;29(9):795–800. [Google Scholar]
- 30. El Hakam SA, El-Dafrawy SM, Fawzy S, Hassan MS. Structural, photocatalytic and antibacterial activity of ZnO and ZrO2 doped ZnO nanoparticles. Int J Sci Res. 2014;3:779–789. [Google Scholar]


