

Abstract
Cellular mechanotransduction plays an essential role in the development and differentiation of many cell types, but if and how mechanical cues from the extracellular matrix (ECM) influence the fate determination of inner ear progenitor cells (IEPCs) remains largely unknown. In the current study, we compared the biological behavior of IEPCs in Matrigel‐based suspension and encapsulated culture systems, and we found that the mechanical cues from the ECM promote the survival and expansion of IEPCs. Furthermore, we found that the mechanical cues from the ECM induced the accumulation of Ras homolog family member A (RhoA) and caused the polymerization of actin cytoskeleton in IEPCs. These changes in turn resulted in increased Yes‐associated protein (YAP) nuclear localization and enhanced expansion of IEPCs, at least partially through upregulating the canonical Wnt signaling pathway. We therefore provide the first demonstration that the RhoA‐YAP‐β‐catenin signaling axis senses and transduces mechanical cues from the ECM and plays crucial roles in promoting the expansion of IEPCs.
The study demonstrates that the essential role of RhoA–YAP–β‐catenin signaling axis on inner ear progenitor cells expansion. The response of inner ear progenitor cells to mechanical cues from their microenvironment via RhoA‐mediated actin cytoskeleton contraction, which lead to nuclear Yes‐associated protein (YAP) accumulation. YAP as a mediator of mechanotransduction signaling to promote the expansion of inner ear progenitor cells through regulating β‐catenin activity.

Significance statement.
The impact of extracellular matrix (ECM) mechanical cues and mechanotransduction signaling upon inner ear progenitor cells (IEPCs) fate has not been described. The authors provide the first demonstration that RHOA‐mediated actin cytoskeletal contractility plays a critical role in regulating the response of IEPCs to their microenvironment mechanical cues, using suspension and encapsulated culture systems. More specifically, the authors first characterized the action of YAP as mediators of mechanotransduction signaling to promote the expansion of IEPCs, partly through regulating ß‐catenin activity. This study reveals the role and mechanism of YAP dependent mechanotransduction signaling in IEPCs proliferation.
1. INTRODUCTION
The organ of Corti is the sensory receptor for hearing in mammals, and it is composed of mechanosensory hair cells and surrounding supporting cells. Different from other vertebrates, hair cells in mammals do not automatically regenerate after injury to the cochlea, and this results in permanent hearing loss,1, 2, 3, 4 especially after the neonatal period. Because supporting cells share the same precursor cells with hair cells in the prosensory domain during inner ear development, supporting cells are regarded as the ideal source for hair cell regeneration. It has been reported that a subtype of supporting cells can reenter the cell cycle and transdifferentiate into hair cells under certain conditions, and these progenitor cells of the inner ear are marked by the expression of Lgr5, one of the Wnt‐responsive molecules.5, 6, 7 However, the numbers of these progenitors as well as their regenerative capacity decreases significantly along with aging, and nearly no hair cell regeneration has been identified in the organ of Corti in adult mammals.8, 9, 10 Thus, investigations into the regulation of the proliferation, differentiation, and survival of progenitor cells in the inner ear will be beneficial for developing strategies for hair cell regeneration and the restoration of hearing.
Isolated Lgr5+ cells can proliferate to form spheroids and differentiate into multiple cell types of the inner ear in intro, and these cells provide an ideal research model for studying development in the inner ear.11 In early studies, inner ear progenitor cells (IEPCs) were suspended in the culture medium on low‐adherence plates for proliferating and for forming spheres.9 However, because cells reside in vivo surrounded by the extracellular matrix (ECM), which serves as a natural scaffold providing both structural integrity and biological cues, such suspension culture systems could not completely mimic the in vivo physiological environment. Recently, three‐dimensional (3D) cell cultures with animal‐derived and synthetic ECM have been used to optimize in vitro systems for culturing stem cells,12 and such systems provide more cues from the natural microenvironment that play important roles in the survival, proliferation, differentiation, and migration of the stem cells.13, 14
It has been shown that cells cultured in 3D systems sense and adapt to external forces as well as to the mechanical constraints of the ECM through mechanotransduction signaling, especially through integrin‐based adhesion and its connections with the intracellular actin cytoskeleton.15, 16 Ras homolog family member A (RhoA) acts as a mechanotransducer of mechanical cues by promoting actin polymerization,17 and RhoA‐mediated cytoskeletal contractility has been shown to play important roles in stem cell maintenance and differentiation.18, 19, 20 In addition, the transcriptional effector of the Hippo pathway—the Yes‐associated protein (YAP)/transcriptional coactivator with PDZ‐binding motif (TAZ)—has been found to serve as another sensor and mediator of mechanical signals in response to ECM cues.21, 22 The Hippo pathway comprises two core kinases (MST1/2 and LATS1/2), YAP/TAZ, and other adaptor ligands, and activation by upstream signals causes MST1/2 to phosphorylate and activate LATS1/2, which in turn directly phosphorylates and inhibits YAP activity.23, 24 Nuclear YAP protein is enriched in multiple mouse stem and progenitor cells,25 and the overexpression of YAP maintains the pluripotency of human embryonic stem cells (ESCs) and induced pluripotent stem cells (iPSCs).26 Activation of YAP has also been shown to induce primary dedifferentiated cells to convert into a tissue‐specific progenitor and stem cell state,27 and thus activation of YAP serves as a major regulator of stem/progenitor cell proliferation and plays crucial roles in organ development and regeneration.28, 29, 30 However, the roles of RhoA and YAP, the two signaling pathways most closely associated with the mediation of mechanical signals in response to the ECM, on the biological characteristics of IEPCs remain to be investigated. Such research will provide a better understanding of the mechanisms involved in the regulation of IEPCs and a better understanding of the interactions between these two important pathways, and this will ultimately lead to new methods for rebuilding the integrity of the hearing sensory epithelium by activating the remaining IEPCs.
In the current study, we first compared the biological behaviors of IEPCs in a traditional suspension culture system and in a Matrigel‐encapsulated 3D culture system to explore the effects of the external forces as well as the mechanical constraints induced by the ECM on the IEPCs in vitro. We then supplied the culture medium with multiple small molecules for interfering with the RhoA and YAP signals, and this allowed us to identify the downstream targets of the mechanical force induced by the ECM as well as the mechanism behind the proliferation and differentiation of IEPCs in the 3D culture system. We conclude that the mechanical cues from the ECM that are transduced via RhoA signaling and the actin cytoskeleton are essential for the survival and expansion of IEPCs and that YAP serves as a downstream nuclear mediator and effector of actin cytoskeletal contraction through β‐catenin in order to promote IEPC expansion.
2. MATERIALS AND METHODS
2.1. Animal model
Lgr5‐EGFP‐IRES‐creERT2 mice were purchased from the Jackson Laboratory (Stock #008875). β‐cateninflox(exon3) mice were generously provided by Mark Taketo (Kyoto University). All animal experiments were approved by the Institutional Animal Care and Use Committee of Fudan University.
2.2. Culture of the IEPCs from the organ of Corti
The cochleae from postnatal day (P) 0–2 mice were dissected in phosphate buffered saline (Hyclone) on ice, and the sensory epithelium was separated along with the modiolus and the stria vascularis. For the preparation of single cell suspensions, the isolated cochlear sensory epithelium was treated with 0.125% trypsin (Thermo Fisher Scientific) for 12 to 15 minutes at 37°C, followed by an equal volume of trypsin neutralizer solution (Thermo Fisher Scientific) to stop the enzymatic reaction. The samples were triturated with a plastic pipette, and dissociated cells were passed through a cell strainer with a pore size of 40 μm. For traditional culture, the single cell suspension was maintained with the culture medium in low‐attachment 24‐well plates (Corning), and a droplet of 40 μL Matrigel (Corning) was placed at the bottom of each plate in order to account for any possible influence of water‐soluble factors in the Matrigel. For the encapsulated culture, the single cell suspension was embedded in 40 μL Matrigel and dropped to the bottom of each plate at room temperature to solidify the Matrigel, and then supplied with culture medium. The culture medium was composed of the basic culture medium (advanced Dulbecco's modified Eagle's medium/F12 supplemented with penicillin/streptomycin, N2, and B27), EGF (20 ng/mL), bFGF (10 ng/mL), and IGF (50 ng/mL), all from Thermo Fisher Scientific. In general, the culture medium was changed every 2 days. As indicated, the following small molecules and proteins were supplied to the culture media at the specified concentrations: Y‐27632 (25 μM, Selleck), ML‐7 (10 μM, Selleck), Blebbistatin (10 μM, Sigma), Cytochalasin D (10 μM, Sigma), Oleoyl‐L‐α‐lysophosphatidic acid sodium salt (LPA) (2.5 μM, Sigma), Verteporfin (0.5 μM and 1 μM, Sigma), CHIR99021 (3 μM, Sigma), IWP‐2 (2 μM, Sigma), CT04 (0.2 μg/mL and 0.5 μg/mL, Cytoskeleton), and CN03 (0.1 μg/mL and 0.2 μg/mL, Cytoskeleton). For the cell proliferation assay, EdU was supplied at a concentration of 5 μM for 4 hours prefixation. (Additional materials and methods are described in the Supplementary Materials and Methods.)
3. RESULTS
3.1. The viability of IEPCs is enhanced in the encapsulated 3D culture
We compared the viability of IEPCs in the suspension culture system and in the Matrigel‐encapsulated 3D culture system (Figure 1A). After being cultured for 3 days, IEPCs formed spheroids (Figure 1B) in both culture systems. As time progressed, however, more dead cells were seen in the spheroids cultured in suspension. At day 7, there were more dead cells in the suspension culture group than in the 3D‐encapsulated culture group (Figure 1B‐D), and the differences were even more pronounced at day 12. Furthermore, we performed a 3D Cell Titre Glo assay to detect the viability of cultured IEPCs, and after 5 days of culture, the viability of IEPCs was significantly lower in the suspension culture system than in the encapsulated cultured system. As time progressed, greater viability of IEPCs was detected in the spheroids cultured in the encapsulated system, and the differences were even more pronounced at day 12. These results indicate that the viability of IEPCs was well preserved in the 3D‐encapsulated culture system.
Figure 1.

IEPCs grown in encapsulated culture retain high viability. A, Schematic showing that IEPCs from Lgr5‐EGFP mice grow into spheroids in suspension and 3D‐encapsulated culture systems. B, Transmitted light and fluorescence microscopy images of spheroids from suspension culture stained for dead cells after 3, 5, 7, and 12 days. Scale bar = 100 μm. C, Transmitted light and fluorescence microscopy images of spheroids from the 3D‐encapsulated culture system stained for dead cells after 3, 5, 7, and 12 days. Scale bar = 100 μm. D, The number of dead cells per spheroid. The data are presented as mean ± SEM (n = 30 spheroids for each group), *P < .05; **P < .01 vs suspension culture on the same day (two‐way ANOVA followed by Sidak's multiple comparisons test). E, Luminescent cell viability assay comparing two independent culture system‐generated spheroids at 3, 5, 7, and 12 days. The data are presented as mean ± SEM (n = 6), **P < .01 vs suspension culture on the same day (two‐way ANOVA followed by Sidak's multiple comparisons test)
3.2. Encapsulated 3D culture promotes the expansion of IEPCs
In order to compare the proliferative capacity of IEPCs in the two culture systems, we evaluated their proliferative ability by counting the number of EdU+ cells in cultured spheroids and by labeling them with the proliferative marker Ki67. After culture for 7 days, the percentage of EdU+ cells in the individual spheroids was higher in the 3D‐encapsulated culture system compared with the suspension culture system (40.76 ± 1.26% vs 20.37 ± 0.87%, P < .01) (Figure 2A). In accordance with the results of EdU labeling, the percentage of Ki67+ cells in individual spheroids was also higher in the 3D‐encapsulated culture system than in the suspension culture system (37.75 ± 1.25% vs 16.98 ± 1.43%, P < .01). The spheroids were also larger in the 3D‐encapsulated system than in the suspension culture system (diameter: 80.58 ± 5.40 μm vs 41.28 ± 3.17 μm) (Figure 2B).
Figure 2.

Encapsulated culture promotes IEPC expansion. A, Confocal images of suspended and encapsulated spheroids showing EdU and Ki67 staining. Proliferating cells were quantified as the percentage of EdU+ or Ki67+ cells. Scale bar = 15 μm. n = 11 suspended spheroids, and n = 10 encapsulated spheroids. B, Bright‐field and fluorescence microscopy images of spheroids formed from suspended and encapsulated cells and expressing Lgr5‐EGFP. Scale bar = 500 μm. Quantification of the diameter of spheroids from (B); n = 22 suspended spheroids, and n = 18 encapsulated spheroids. Quantification of the percentage of Lgr5‐EGFP positive spheroids from (B) (n = 3); C, qRT‐PCR analysis showing the relative expression of cell cycle genes and markers of IEPCs, supporting cells, and hair cells. Results were normalized to GAPDH in the same sample and then normalized to the suspension group (n = 3). D, Confocal images showing Myosin7a and Sox2 immunofluorescent staining. Scale bar = 15 μm. Quantification of the percentage of Myosin7a/Sox2 double‐positive spheroids from (D) (n = 6), and quantification of the percentage of Myosin7a/Sox2 double‐positive cells per spheroid from (D) (n = 10 spheroids for each group). The data are presented as mean ± SEM; *P < .05; **P < .01 (unpaired two‐tailed Student's t test)
Lgr5+ is a marker of progenitor cells in the inner ear, and after 7 days of culture the percentage of Lgr5+ cells in the suspended spheroids decreased significantly compared to the 3D‐encapsulated spheroids (9.35 ± 1.44% vs 45.19 ± 3.85%, respectively, P < .01), and this provided further evidence for the sustained proliferative ability of IEPCs in the 3D‐encapsulated culture system (Figure 2B). Furthermore, we compared the gene expression profiles of spheroids cultured in the suspension system and the Matrigel‐encapsulated system, and we identified increased expression of Lgr5 and reduced expression of P27Kip1, an indicator of cell cycle exit, in the encapsulated culture system (Figure 2C). In order to further identify the possible differentiation process during the expansion of IEPCs in vitro, we investigated the expression of the genes involved in differentiation in the inner ear, and we found that there was no significant difference on the expression of supporting cell markers, including Sox2 and Jagged1, although the expression of Prox1 was much higher in the suspended spheroids. Meanwhile, the expression of hair cell markers, including Atoh1, Pou4f3, Prestin, and Vglut3, was also higher in the suspended spheroids (Figure 2C). We further labeled the spheroids with Myosin7a and Sox2 after 10 days in culture, and we identified several Myosin7a+ cells in the spheroids from the suspension culture system, but not in the spheroids from the 3D‐encapsulated culture system (Figure 2D), and these Myosin7a+ cells were also labeled with Sox2 indicating that they were newly generated hair cells. These results suggested that the proliferative capacity of IEPCs decreased during their expansion in the suspension culture system, and this was subsequently accompanied by the unavoidable differentiation process, while, in the 3D‐encapsulated culture system, the expansion capacity of IEPCs were significantly enhanced along with the reduced cell differentiation.
3.3. Mechanotransduction signaling modulates the expansion of IEPCs in the 3D culture system
In order to further dissect the mechanism behind the enhanced survival and proliferative capacity of the IEPCs in the 3D‐encapsulated culture system, we investigated the possible roles of mechanotransduction signaling on the Matrigel‐encapsulated spheroids. It has been reported that the intracellular actin cytoskeleton senses and transmits mechanical changes in the microenvironment and that this activity is regulated by RhoA.31 The accumulation of RhoA was observed in the encapsulated spheroids compared to the suspension spheroids (Figure 3A,C), especially at the edges of the spheroids. Similar to the distribution of RhoA, intensive F‐actin cytoskeleton polymerization was observed close to the cell‐ECM interface of the encapsulated spheroids, while only a scattered and loosely formed F‐actin cytoskeleton was identified in the suspended spheroids, which suggested that cell‐ECM interactions might contribute to the cytoskeletal organization.
Figure 3.
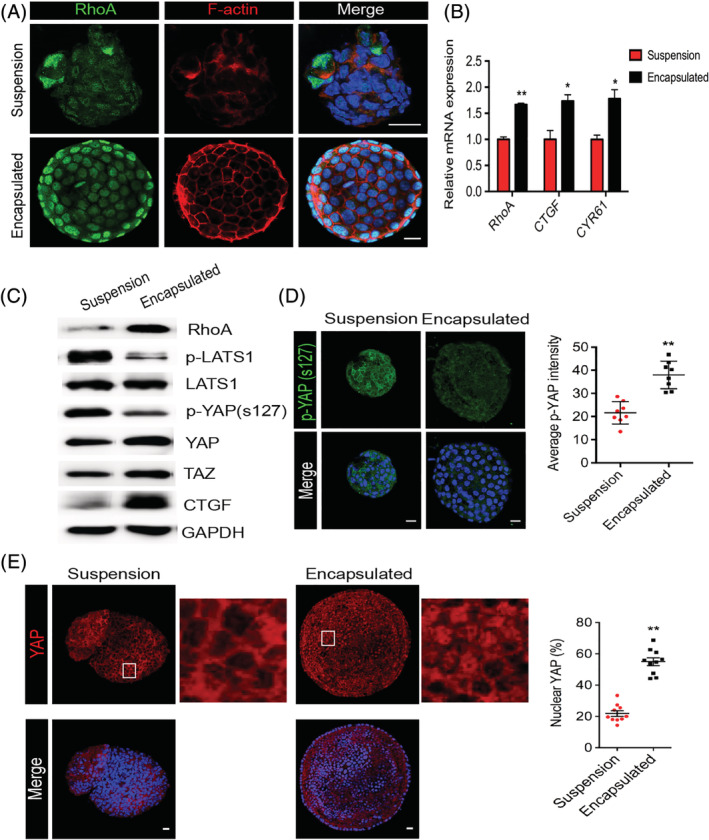
Upregulated RhoA enhances cytoskeleton polymerization and activates YAP in encapsulated culture. A, Confocal images of suspended and encapsulated spheroids showing RhoA and F‐actin staining. Scale bar = 15 μm. B, Gene expression of RhoA, CTGF, and CYR61 by qRT‐PCR analysis. Results were normalized to GAPDH in the same sample and then normalized to the suspended group (n = 3). C, Western blot analysis is shown for the indicated proteins in spheroids from two independent culture systems. GAPDH was used as the loading control. D, Immunofluorescent staining of p‐YAP (s127) in IEPC spheroids. Scale bar = 15 μm. Quantification of the mean fluorescence intensity of antibody labeling for p‐YAP (s‐127) from (D) (n = 8 spheroids for each group). E, Immunofluorescent staining of YAP in IEPC spheroids and the percentage of YAP located in the nucleus. Scale bar, 15 μm. n = 10 spheroids for each group. The data are presented as mean ± SEM; *P < .05; **P < 0.01 (unpaired two‐tailed Student's t test)
In order to investigate the signal transduction from the external ECM mechanical cues to gene transcription in the Matrigel‐encapsulated IEPCs, we used qPCR to measure the expression of RhoA and the downstream targets of YAP/TAZ—CTGF and CYR6. The expression of RhoA, CTGF, and CYR61 was significantly upregulated in the encapsulated spheroids compared to the suspended spheroids (Figure 3B). In addition, by Western blotting we found repressed LATS1 and enhanced YAP activity in IEPCs in the encapsulated culture system, as shown by lower phosphorylation levels of LATS1 and YAP at Ser127 in the encapsulated spheroids compared to the suspended spheroids (Figure 3C). The encapsulated IEPCs also had elevated levels of TAZ and CTGF. We also confirmed that the expression of p‐YAP (s127) protein was downregulated in the encapsulated spheroids compared to the suspended spheroids (intensity: 21.61 ± 1.70 vs 37.94 ± 2.12, P < .01) (Figure 3D) and that the nuclear distribution of YAP, which is the functional form of the YAP protein, was much higher in the encapsulated spheroids compared to the suspended spheroids (54.93 ± 2.50% vs 21.82 ± 1.79%, P < .01) (Figure 3E). Our results showed that YAP signaling was strongly activated during the culture of IEPCs in the Matrigel‐encapsulated 3D culture system.
To further explore the role of RhoA on the expansion of IEPCs, we treated IEPCs with the Rho GTPase inhibitor CT04 in the encapsulated culture for 3 days, and this led to decreased cell viability in a dose‐dependent manner (Figure S1A). Treatment with CT04 also caused a decreased number of spheroids in both the suspension and encapsulated culture systems (Figure S1B). Moreover, we observed weak F‐actin cytoskeleton polymerization and reduced distribution of YAP in the nucleus of encapsulated spheroids after treatment with CT04 (42.45 ± 2.20% and 14.37 ± 1.01% in the control and the CT04‐treated group, respectively, P < .01) (Figure S1C). Furthermore, we treated IEPCs with the Rho GTPase activator CN03 for 7 days, and supplementation with CN03 improved the viability of IEPCs in suspension culture (Figure S2A). We also found an increased spheroid number in the presence of CN03 in both culture systems (Figure S2B). In addition, an increased percentage of nuclear localization of YAP was found in the presence of CN03 in the two culture systems (suspension: 18.50 ± 1.95% and 36.97 ± 2.72% in the control and CN03‐treated groups, respectively, P < .01; encapsulated: 42.27 ± 1.98% and 63.87 ± 2.30% in the control and CN03‐treated groups, respectively, P < .01) (Figure S2C).
Actin cytoskeletal integrity has been reported to sustain YAP nuclear localization.32, 33, 34 To get a deeper insight into the role of RhoA/ROCK and the structure of the actin cytoskeleton on the expansion of IEPCs, we inhibited ROCK by supplying Y‐27632, and we blocked the polymerization of the cytoskeleton by supplying the myosin light chain kinase (MLCK) inhibitor ML‐7, the myosin II inhibitor Blebbistatin, or the F‐actin polymerization inhibitor Cytochalasin D in the Matrigel‐encapsulated 3D culture system. The accumulation of F‐actin was reduced by all four inhibitors, especially at the edges of the spheroids, which resulted in the scattered distribution of the cytoskeleton (Figure 4A). We also found that inhibition of ROCK as well as blocking cytoskeleton polymerization led to a decreased number of spheroids and to smaller spheroids in the single‐cell suspension (Figure 4B). According to the cell proliferation assay, the percentages of EdU+ cells in each cultured spheroid were also decreased by the RhoA and cytoskeleton polymerization inhibitors compared to dimethyl sulfoxide (DMSO) treatment (Figure 4D), and this was accompanied by the downregulation of Lgr5 mRNA expression (Figure 4C).
Figure 4.

Inhibition of Rho kinases and F‐actin cytoskeleton polymerization leads to reduced expansion capacity and reduced YAP nuclear localization in IEPCs. A, Confocal images showing F‐actin staining in spheroids treated with DMSO or different inhibitors. B, Spheroid formation in 3D‐encapsulated culture treated with DMSO or different inhibitors by transmitted light microscopy. The scale bar on the left is 500 μm and the scale bar on the right is 50 μm. Quantification of the number of spheroids from (B); n = 3. C, RT‐PCR analysis showing the mRNA expression of Lgr5 in IEPCs treated with DMSO or different inhibitors. Results were normalized to GAPDH in the same sample and then normalized to the Control group (n = 3). D, Confocal images showing EdU and YAP staining in IEPCs treated with DMSO or different inhibitors. Scale bar = 15 μm. n = 8 spheroids for each group. The data are presented as mean ± SEM; *P < .05; **P < .01 vs DMSO control (one‐way ANOVA followed by Dunnett's multiple comparison test)
Furthermore, we observed reduced distribution of YAP in the nucleus after treatment with the ROCK and cytoskeleton polymerization inhibitors mentioned above compared to DMSO‐treated controls (Figure 4D). In the current study, we found a correlation between the polymerization of the actin cytoskeleton induced by the cell‐ECM interaction and the activation of YAP, which showed that RhoA/ROCK and the actin cytoskeleton regulate the behavior of the cultured IEPCs and are required to maintain YAP activity in IEPCs.
3.4. YAP maintains the proliferative capacity of the encapsulated IEPCs
Because the activation of YAP mediated by the mechanical cues from the cell‐ECM interaction was observed in the Matrigel‐encapsulated 3D culture system, we performed further experiments to dissect the role of YAP, one of the effectors of Hippo signaling, on the expansion of IEPCs. LPA acts as a Hippo signaling agonist by inhibiting LAST1/2 and by increasing the nuclear localization of YAP,35 and we found that the expression of YAP‐targeted genes, including CTGF and CYR61, was significantly upregulated in the encapsulated spheroids after LPA treatment (Figure 5A). LPA‐induced dephosphorylation of LATS1 and YAP at Ser127, and LPA also caused increased TAZ expression. The LPA‐induced activation of the Hippo pathway was blocked by the RhoA inhibitor CT04 (Figure 5B), which indicated that RhoA might mediate the activation of YAP by LPA. Supplementation with LPA also increased the number of spheroids that formed from the single cell suspension (Figure 5D) and upregulated the expression of Lgr5 (Figure 5A), a marker of IEPCs. Moreover, the addition of LPA to the 3D‐encapsulated culture system led to an increase in the nuclear localization of YAP protein, as indicated by Western blot (Figure 5C) and by immunostaining (55.83% ± 2.18% and 77.19% ± 2.29% of nuclear YAP+ cells in the DMSO and LPA‐treated groups, respectively, P < .05) (Figure 5E,F), and this was associated with an increased percentage of EdU+ cells in each spheroid (43.00% ± 1.32% and 56.51% ± 1.726% EdU+ cells in the DMSO‐ and LPA‐treated groups).
Figure 5.

Activation of YAP enhances the expansion of IEPCs. A, RT‐PCR analysis showing mRNA expression of YAP target genes and Lgr5 in spheroids from controls or spheroids treated with LPA. Results were normalized to GAPDH in the same sample and then normalized to the control group (n = 3). B, Western blot analysis for the indicated proteins in spheroids from different treated groups. GAPDH was used as the loading control. C, Western blot analysis of nuclear YAP protein from IEPC spheroids in 3D‐encapsulated culture. Lamin B1 was used as the nuclear loading control. D, Transmitted light microscopy images of spheroid formation after treatment with vehicle or LPA. Scale bar = 500 μm. Quantification of the number of spheroids from (D) (n = 3). E, Confocal images showing YAP and EdU staining in control IEPCs and IEPCs treated with LPA in 3D‐encapsulated culture at day 7. Scale bar = 15 μm. F, Quantification of the percentage of nuclear YAP or EdU positive cells per sphere from (E); n = 15 spheroids (Control), n = 12 spheroids (LPA). G, Confocal images showing YAP and EdU staining in IEPCs cultured in the presence or absence of growth factors (EGF, bFGF, and IGF) at day 14. Cultured IEPCs in 3D‐encapsulated culture in the presence of growth factors for 7 days (Control) are compared to those in which the growth factors were withdrawn (Withdrawn GFs). Scale bar = 15 μm. H, Quantification of the percentage of nuclear YAP+ or EdU+ cells per sphere from (E). n = 12 spheroids for each group. The data are presented as mean ± SEM; *P < .05; **P < .01 (unpaired two‐tailed Student's t test)
We next sought to further verify the roles of YAP on the expansion of IEPCs. After growing IEPCs in the 3D‐encapsulated culture system in the classical expansion culture medium containing growth factors (EGF, bFGF, and IGF) for 7 days, the cells were divided into two groups—those cultured in the continued presence of growth factors (controls) and those in which the growth factors were withdrawn. Compared with the spheroids cultured in growth factor medium for another 7 days, the spheroids in the growth factor withdrawal group showed a concomitant decrease in the percentage of nuclear localization of YAP (35.73% ± 3.54% vs 14.15% ± 1.99%, P < .01) and in the percentage of EdU+ cells (17.89% ± 1.67% vs 0.67% ± 0.28%, P < .01) in each cultured spheroid in the 3D‐encapsulated system (Figure 5G,H). These results further confirm that YAP activity is closely related to the proliferative capacity of IEPCs.
To investigate whether disruption of YAP alters IEPC growth, we used lentiviral delivery of short hairpin RNA (shRNA) to deplete YAP. Depletion of YAP lead to decreased CTGF and CYR61 mRNA and decreased Lgr5 expression (Figure 6A,B). Compared to shControl, shYAP significantly decreased the number of spheroids in the encapsulated culture (Figure 6C). It has been reported that Verteporfin (VP) is a potent inhibitor of YAP, and we observed attenuated proliferation of IEPCs in a dose‐dependent manner after exposure to VP (Figure 6D). The expression of the target genes of YAP, including CTGF and CYR61, was also downregulated and served as further evidence for the inactivation of YAP induced by VP (Figure 6E). As expected, compared with DMSO‐treated controls, we found a decreased percentage of nuclear localization of YAP, a reduced percentage of EdU+ cells in each spheroid (Figure 6F), mitigated expression of Lgr5 expression (Figure 6E), and reduced capacity of the IEPCs to form spheroids after treatment with VP in the 3D‐encapsulated culture system (Figure 6G). Combined with previous findings, our results highlight the crucial role of YAP in promoting the expansion of IEPCs.
Figure 6.

Inhibition of YAP attenuates the expansion of IEPCs. A, Western blot analysis of YAP protein in shControl or shYAP IEPCs in 3D‐encapsulated culture. B, RT‐PCR analysis showing mRNA expression of YAP target genes and Lgr5 in shControl and shYAP IEPCs in 3D‐encapsulated culture. Results were normalized to GAPDH in the same sample and then normalized to the shControl group (n = 3). C, Transmitted light and fluorescence microscopy images of spheroids from 3D‐encapsulated cultured shControl or shYAP IEPCs. Scale bar = 200 μm. Quantification of the number of spheroids from C (n = 5). The data are presented as mean ± SEM; **P < .01 vs shControl (one‐way ANOVA followed by Dunnett's multiple comparison test). D, The impact of Verteporfin (VP) on IEPC growth in 3D‐encapsulated culture was assessed with the CCK8 assay (n = 3). E, RT‐PCR analysis showing mRNA expression of YAP target genes and Lgr5 in spheroids treated with DMSO or VP. Results were normalized to GAPDH in the same sample and then normalized to the Control group (n = 3). F, Confocal images showing YAP and EdU staining in IEPCs treated with DMSO or VP. Scale bar = 15 μm. Quantification of the percentage of nuclear YAP+ or EdU+ cells per sphere from (E) (n = 8 spheroids for each group). G, Transmitted light microscopy images of spheroids treated with DMSO or VP. Scale bar = 500 μm. Quantification of the number of spheroids from (G) (n = 3). The data are presented as mean ± SEM; *P < .05; **P < .01 vs Control (one‐way ANOVA followed by Dunnett's multiple comparison test)
3.5. YAP enhances the expansion of IEPCs through activation of Wnt signaling
It has been established that activation of the canonical Wnt signaling pathway by overexpressing β‐catenin in the inner ear forces progenitors to reenter the cell cycle and thus facilitates progenitor cell proliferation and subsequent differentiation into hair cells.36, 37 Considering the important roles of β‐catenin on cell proliferation in the inner ear, we hypothesized that β‐catenin might be a critical downstream target of YAP for promoting the expansion capacity of IEPCs.
We crossed β‐cateninflox(exon3) mice with Lgr5‐EGFP‐IRES‐creERT2 mice to induce the overexpression of β‐catenin (β‐catenin‐OE) in the Lgr5+ cells. Tamoxifen induction was performed at P0 and P1, and we harvested the organ of Corti at P7. We found that overexpression of β‐catenin caused elevated Lgr5 expression in vivo (Figure S3A). Moreover, β‐catenin‐OE led to an increase in the capacity of IEPCs to form spheroids (Figure S3B). To further investigate the effects of β‐catenin on the proliferation of IEPCs in the Matrigel‐encapsulated 3D system, we added CHIR99021 (CHIR) to the culture medium to activate Wnt signaling. We observed more EdU+ and Ki67+ cells in the spheroids after treatment with CHIR, and these effects could be attenuated by IWP‐2, an inhibitor of Wnt signaling (Figure 7A), which further verified the role of Wnt signaling on the proliferation of IEPCs in the Matrigel‐encapsulated 3D culture system.
Figure 7.

YAP enhances the expansion of IEPCs through β‐catenin. A, Confocal images showing β‐catenin, EdU, and Ki67 staining in spheroids treated with CHIR, IWP‐2, or CHIR+IWP2. Scale bar = 15 μm. Quantification of the percentage of nuclear β‐catenin+, EdU+, and Ki67+ cells per sphere from A (n = 8 spheroids for each group). B, Confocal images showing β‐catenin and EdU staining in spheroids treated with DMSO, LPA, LPA+IWP‐2, VP, or VP+CHIR. Scale bar = 15 μm. Quantification of the percentage of nuclear β‐catenin+ or EdU+ cells per sphere from B (n = 8 spheroids for each group). C, Transmitted light microscopy images of spheroid formation from cells treated with DMSO, LPA, LPA+IWP‐2, VP, or VP+CHIR. Scale bar = 500 μm. Quantification of the number of spheroids from C (n = 4). D, RT‐PCR analysis showing mRNA expression of β‐catenin target genes Cyclin D1 and Axin2 and Lgr5 in IEPC spheroids treated with DMSO, LPA, LPA+VP, or LPA+shYAP. Results were normalized to GAPDH in the same sample and then normalized to the Control group (n = 3). E, Western blot analysis of nuclear YAP and β‐catenin protein from IEPC spheroids in 3D‐encapsulated culture treated with DMSO, LPA, LPA+VP, or LPA+shYAP. Lamin B1 was used as the nuclear loading control. The data are presented as mean ± SEM; *P < .05; **P < .01 (one‐way ANOVA followed by Tukey's multiple comparisons test)
We further dissected the interaction between Hippo and Wnt signaling on the expansion of IEPCs in our system. We observed increased nuclear localization of β‐catenin and more EdU+ progenitors in the cultured spheroids after treatment with LPA, and these effects could be attenuated by IWP‐2 (Figure 7B). We observed fewer EdU+ progenitors in the cultured spheroids after treatment with VP, and this could be rescued by the addition of CHIR. LPA treatment promoted the ability of single cells to form spheroids, and this effect could be attenuated by IWP‐2, whereas the sphere‐forming ability was inhibited by VP treatment and could be rescued by CHIR in the Matrigel‐encapsulated 3D culture system (Figure 7C). In addition, the expression of Lgr5 and the target genes of Wnt signaling, including Cyclin D1 and Axin2, was also upregulated at the mRNA level after treatment with LPA, while the LPA‐induced Wnt downstream gene expression was abated by inhibition of YAP using VP or shYAP (Figure 7D). Moreover, LPA‐induced nuclear‐localized β‐catenin was clearly reversed by VP and by shYAP (Figure 7E). Taken together, these results indicate that the enhanced expansion of IEPCs in the 3D system was modulated by sensing the mechanical cues from the ECM and that β‐catenin served as the downstream nuclear effector for promoting the expansion of IEPCs.
3.6. Spheroids from encapsulated IEPCs partially resemble transcriptome signatures of cochlear epithelium in vivo
We observed the expression of Sox2 and E‐caderin in the spheroids from encapsulated IEPCs by immunostaining, which confirmed that the expanded IEPCs preserved the characteristics of epithelial tissue in vitro (Figure S4A). In order to further investigate the transcriptomics of spheroids from encapsulated IEPCs, we performed RNA‐seq to compare the transcriptional profiles between the IEPCs formed spheroids in 3D‐encapsulted culture in vitro and the fresh dissected cochlear epithelium, the source of IEPCs in vivo.
Our results show that there are 1432 differentially expressed genes (P‐adj < .05, |log2Foldchange| > 1) between the IEPCs formed spheroids in vitro and the fresh dissected cochlear epithelium (Figure S4B). Compared to the fresh dissected cochlear epithelium, the genes related to terminal differentiation were significant lower in the IEPCs formed spheroids in vitro, such as Myo7a, Pou4f3, Espn, Tmc1, and Gfi1 (Figure S4C). While there is no difference on the genes involved in the mechanotransduction signaling between those two groups, such as Itgb4, Itgb8, Fbln2, Rhoa, and Rock1 (Figure S4d). In addition, the comparable expression profiles were identified in the genes involved in apoptosis (such as Bad, Bax, Casp3, Casp7, Casp9, and Fasn), genes related to cell cycle (such as Cdkn1a, Cdk2, Cdk4, and Mik67) and canonical Wnt signaling targets (such as Ctnnb1, Dkk1, Fzd2, Lrp5, and Tcf3) (Figure S4E‐G) between the IEPCs formed spheroids in vitro and the fresh dissected cochlear epithelium. Most importantly, there is no prominent difference in the IEPCs marker genes between the spheroids cultured in vitro and fresh dissected sensory epithelium, such as, Sox9 and Epcam (Figure S4H). These results suggested that IEPCs cultured in 3D‐encapsulated system partially resemble transcriptome signatures of the source of IEPCs in vivo.
4. DISCUSSION
In an earlier work, IEPCs were maintained in a suspension culture system without ECM,9, 38, 39 but recent evidence suggests that mechanical cues from the ECM have significant impacts on cell fate decisions comparable to the biochemical cues induced by growth factors.40, 41 The mechanical properties of the ECM have been shown to have a great influence on cells’ biological functions, and during mechanotransduction ECM mechanical stimuli such as stretching, elasticity, and matrix rigidity are converted into chemical signals that control cell fate.12, 42 The mechanical constraints from the ECM have also been shown to regulate the growth of murine inner ear cells during the developmental process,43 and thus we used a Matrigel‐encapsulated 3D culture system to induce similar mechanical cues in the IEPC culture system that might better mimic the in vivo microenvironment.
In the current study, we found that mechanical cell‐matrix interactions increased the viability and expansion of IEPCs in the Matrigel‐encapsulated IEPC culture system, which has been widely used in organoid cultures.44, 45 It has been reported that cell‐ECM interactions regulate the fate of many different kinds of cells in 3D culture, including embryonic stem cells, mesenchymal stem cells, and so on.42, 46, 47 Cells change their fate in response to integrin‐dependent RhoA signaling and actin cytoskeleton dynamics induced by ECM mechanical stimulation.15 Decreased RhoA activity and disruptions to the actin cytoskeleton can be observed in vivo during hair cell loss induced by aminoglycoside antibiotics in the inner ear.48 The results from our experiments demonstrated that actin cytoskeleton polymerization regulated by RhoA could affect the proliferative capacity of IEPCs by transducing the mechanical cues from the external microenvironment, which is in agreement with studies in other systems.49, 50 Furthermore, we found that activation of RhoA and enhanced actin cytoskeleton polymerization were primarily located on the surface of spheroids formed from single IEPCs in the Matrigel‐encapsulated 3D culture system, and this was similar to what has been observed for colonies formed from human ESCs that displayed strong cell‐ECM interactions at the colony edge.51 Enhanced RhoA activity and actin cytoskeleton polymerization were also found in spheroid cells that were not in contact with the ECM, and this suggests that mechanical signals from the ECM might be transmitted among the cells within the IEPC spheroid and thus affect the expansion of the IEPCs in a similar manner to how cell‐cell contacts can remodel the actin cytoskeleton by regulating RhoA signaling to maintain cardiomyocyte identity.52
YAP has also been shown to be a sensor and mediator for mechanical signals in response to ECM cues, and the ECM mechanical cues that activate YAP require a mechanically stressed cytoskeleton.35, 53 Pharmacological inhibition of actin cytoskeleton polymerization reduced the nuclear localization of YAP, providing further evidence that the actin cytoskeleton is required for maintaining the activity of YAP in IEPCs. We found that attenuated LATS1 phosphorylation was accompanied by YAP activation in 3D‐encapsulated culture. We activated YAP signaling by using LPA, which binds to a family of G protein‐coupled receptors and regulates YAP activity via Ga12/13‐coupled receptors,35 and we found that LPA increased the proliferative potential of IEPCs. In addition, LPA simultaneously increased YAP activity and decreased LATS1 phosphorylation. These effects were all blocked by inhibition of RhoA.
These results indicated that mechanotransduction signaling might promote IEPC expansion in a LATS‐dependent manner in the encapsulated culture. In contrast to our results, a previous study showed that mechanical signals regulate YAP through a LATS‐independent manner in soft ECM hydrogels,54 while another study supports our results by showing that extracellular mechanical signals modulate YAP through LATS in low‐stiffness ECM.55 This contradiction might be due to the different cell culture modes and different cell‐cell interactions. LPA‐induced IEPC expansion was in accordance with the observation that LPA plays a positive role in maintaining the pluripotency of human ESCs and iPSCs by upregulating YAP activity.26 We also found that the combination of EGF, bFGF, and IGF could sustain the accumulation of YAP in the nucleus, which suggests that there might be cross‐talk between YAP signaling and other signaling pathways, such as the FGFs, and it has been reported that bFGF‐induced YAP nuclear translocation plays a crucial role in promoting the proliferation of lens epithelial cells.56
We inhibited YAP signaling using VP, and this significantly decreased the nuclear expression and downstream genes of YAP and inhibited the expansion of IEPCs. However, other studies have shown that the antiproliferative effects of VP are not dependent on YAP in endometrial cancer and colorectal cancer cells.57, 58 Interestingly, VP attenuated the interaction between YAP and TEAD and suppressed YAP‐dependent liver cancer.59 Moreover, VP has been shown to inhibit YAP nuclear translocation by increasing its phosphorylation at Ser7 and to activate MST1 to suppress the growth of C4‐2 cells.60 These results suggest that VP is not specific for its target, and it might have tissue differences as an inhibitor of YAP. To account for this, we used shRNA to knock down YAP and got the same results as VP, which further shows the importance of YAP for promoting the expansion of IEPCs. In other tissues, it has been reported that the activation of YAP signaling reprograms intestinal stem cells and induces the regeneration of the intestinal epithelium after exposure to ionizing radiation28 and that constitutively active YAP signaling upregulates embryonic and proliferation‐related genes and stimulates cardiac regeneration in the adult heart.61 Our results further demonstrate that YAP signaling plays a crucial role in promoting the expansion of IEPCs.
Because Wnt/β‐catenin signaling is another well‐established essential signaling pathway for the proliferation of Lgr5+ progenitor cells in the inner ear, and because the stabilization of β‐catenin results in cell‐cycle reentry followed by differentiation of IEPCs into hair cells,36, 62 we further investigated the interaction between canonical Wnt and YAP signaling during the expansion of IEPCs in our culture systems. The increased β‐catenin nuclear translocation and subsequent enhancement of IEPC proliferation induced by the YAP activator LPA could be prevented by adding a Wnt signaling inhibitor, while the reduced β‐catenin nuclear translocation and subsequent decrease in IEPC proliferation caused by the YAP inhibitor VP could be rescued by adding a Wnt signaling activator. Although the specific targets through which YAP regulates Wnt signaling during the expansion of IEPCs were not explored in our current study, our data still provide the first evidence that β‐catenin might act as a downstream effector of YAP during the proliferation of IEPCs. Indeed, the interaction between Wnt and YAP signaling has been verified in other cellular and biological contexts, and it has been reported that the activation of YAP enhances cardiomyocyte proliferation and promotes cardiac regeneration by activating β‐catenin,61, 63 while another study showed that activation of YAP reprograms intestinal stem cells and induces intestinal regeneration by transiently suppressing Wnt signaling.28
According to the comparison and analysis of whole gene sequencing between the IEPCs formed spheroids in 3D‐encapsulted culture in vitro and the fresh dissected cochlear epithelium, the source of IEPCs in vivo. We further confirmed that the ECM encapsulated IEPCs in 3D culture system could mimic the mechanotransduction signaling surrounded the IPECs in vivo, and the spheroids from encapsulated IEPCs partially resemble transcriptome signatures of cochlear epithelium in vivo. It has been reported that the biophysical simulation of nature environment in the cultured progenitors might be not sufficient to achieve the gene signatures of related tissue in vivo.41, 64 Multiple combinations of growth factors and compounds will be tested in our Matrigel encapsulated 3D culture system for achieving the self‐renewal of IEPCs as well as the controllable differentiation process65, 66
In this study, we provide the first demonstration that external mechanical signals from the ECM can be transduced into IEPCs through the RhoA‐YAP‐β‐catenin signaling axis and that this regulates the survival, proliferation, and differentiation of IEPCs. Thus, such interactions serve as an important modulating factor for the biological activities of IEPCs and provide potential therapeutic targets for activating the progenitor cells and for promoting hair cell regeneration in the inner ear by pharmacologically or genetically regulating the function of the RhoA‐YAP‐β‐catenin signaling axis in vitro or in vivo. In addition, the interacting targets among the whole RhoA‐YAP‐β‐catenin signaling axis should be further investigated for promoting hair cell regeneration and for restoring homeostasis in the cochlear epithelium.
5. CONCLUSION
In conclusion, we provide the first piece of evidence that RhoA‐mediated actin cytoskeletal contractility plays a critical role in regulating the response of IEPCs to mechanical cues in their microenvironment by comparing the survival, proliferation, and differentiation of IEPCs cultured in suspended or in Matrigel‐encapsulated 3D systems. We further identified YAP as a mediator of mechanotransduction signaling for promoting the expansion of IEPCs, partly through the regulation of β‐catenin activity. Thus, the RhoA‐YAP‐β‐catenin signaling axis senses and transmits mechanical cues from the ECM and plays crucial roles in promoting the expansion of IEPCs.
CONFLICT OF INTERESTS
The authors declare no potential conflict of interest.
AUTHOR CONTRIBUTIONS
M.X., W.L., H.L.: design; M.X., W.L., H.L.: manuscript writing; M.X., Y.C., Y.H.: experiments; M.X., W.L.: analysis; M.X., W.L., H.L., Y.C., Y.H.: manuscript commenting.
Supporting information
Data S1: Supporting Information
Supplementary Figure 1 Inhibition of RhoA attenuates the expansion of IEPCs and reduces YAP nuclear localization in IEPCs. (a) Luminescent cell viability assay comparing cell viability of suspension culture system cultured IEPCs in the presence of different concentrations of CT04 (n = 5). (b) Transmitted light microscopy images of spheroids from suspension and encapsulated cultured IEPCs treated with different concentrations of CT04. The scale bar of the Suspension group is 200 μm and the scale bar of the Encapsulated group is 500 μm. Quantification of the number of spheroids from (b) (n = 4). The data are presented as means ± SEM; ** P < 0.01 versus Control (one‐way ANOVA followed by Dunnett's multiple comparison test). (c) Confocal images showing YAP and F‐actin staining in IEPCs treated with vehicle or 0.5 μg/ml CT04. Scale bar, 15 μm. Quantification of the percentage of nuclear YAP+ cells per sphere from (c). n = 9 spheroids for each group. ** P < 0.01 (Student's t‐test).
Supplementary Figure 2 Activation of RhoA enhances the expansion of IEPCs and YAP nuclear localization in IEPCs. (a) Luminescent cell viability assay comparing cell viability of suspension culture system cultured IEPCs in the presence of different concentration of CN03 (n = 6). (b) Transmitted light microscopy images of spheroids from suspension and encapsulated cultured IEPCs treated with different concentration of CN03. The scale bar of the suspended group is 200 μm, and the scale bar of the encapsulated group is 500 μm. Quantification of the number of spheroids from (b) (n = 4). The data are presented as means ± SEM; * P < 0.05 and ** P < 0.01 versus Control (one‐way ANOVA followed by Dunnett's multiple comparison test). (c) Confocal images showing YAP and F‐actin staining in IEPCs treated with vehicle or 0.2 μg/ml CN03. Scale bar, 15 μm. Quantification of the percentage of nuclear YAP+ cells per sphere from (c). n = 10 spheroids for each group. ** P < 0.01 (Student's t‐test).
Supplementary Figure 3 Overexpression of β‐catenin enhances the expression of Lgr5 in vivo and the capacity of sphere formation of IEPCs in 3D‐encapsulated culture. (a) Confocal images of the organ of Corti showing Lgr5‐EGFP and β‐catenin expression from Lgr5EGFPcreERT2/+ and Lgr5EGFPcreERT2/+; β‐cateninflox(exon3) (β‐catenin OE) mice. Tamoxifen was given at P0, and tissues were harvested at P7. Scale bar, 15 μm. (b) Transmitted light microscopy images of 3D‐encapsulated cultured IEPCs from Lgr5EGFPcreERT2/+ and Lgr5EGFPcreERT2/+; β‐cateninflox(exon3) (β‐catenin OE) mice. Quantification of the number of spheroids from (b) (n = 5). ** P < 0.01 (Student's t‐test).
Supplementary Figure 4 Transcriptional Characterization of IEPCs in 3D‐encapsulated culture. (a) Confocal images showing Sox2 and E‐caderin staining in Encapsulated cultured IEPCs. Scale bar, 25 μm. (b) The volcano plot showing the overall gene expression. There are 1,432 differentially expressed genes (p‐adj < 0.05, |log2Foldchange| >1) detected between in vivo cochlear epithelium cells versus in vitro cultured IEPCs. (c) Heatmap of hair cell related genes in cultured IEPCs and cochlear epithelium tissue. (d) Heatmap of mechnotransduction related genes in cultured IEPCs and cochlear epithelium tissue. (e) Heatmap of apoptosis related genes in cultured IEPCs and Organ of cochlear epithelium tissue. (f) Heatmap of cell cycle related genes in cultured IEPCs and cochlear epithelium tissue. (g) Heatmap of Wnt related genes in cultured IEPCs and cochlear epithelium tissue. (h) Heatmap of inner ear progenitor cell related genes in cultured IEPCs and cochlear epithelium tissue.
ACKNOWLEDGMENTS
This work was supported by the National Key R&D Program of China (No. 2017YFA0103900), the National Science Foundation for outstanding young people (81922018), the National Natural Science Foundation of China (No. 81771011), the Development Fund for Shanghai Talents (grant number 2017046), and the Excellent Personnel Training Plan for the Shanghai Health System (grant number 2017Q003).
Xia M, Chen Y, He Y, Li H, Li W. Activation of the RhoA‐YAP‐β‐catenin signaling axis promotes the expansion of inner ear progenitor cells in 3D culture. Stem Cells. 2020;38:860–874. 10.1002/stem.3175
Funding information the Development Fund for Shanghai Talents, Grant/Award Number: 2017046; the Excellent Personnel Training Plan for the Shanghai Health System, Grant/Award Number: 2017Q003; the National Key R&D Program of China, Grant/Award Numbers: 2017YFA0103900, 2016YFC0905200; the National Natural Science Foundation of China, Grant/Award Number: 81771011; the National Science Fund for Excellent Young Scholars, Grant/Award Number: 81922018
Contributor Information
Huawei Li, Email: hwli@shmu.edu.cn.
Wenyan Li, Email: wenyan_li2000@126.com.
DATA AVAILABILITY STATEMENT
The data that support the findings of this study are accessible through accession number PRJNA608092 (NCBI SRA).
REFERENCES
- 1. Corwin JT, Cotanche DA. Regeneration of sensory hair cells after acoustic trauma. Science. 1988;240:1772‐1774. [DOI] [PubMed] [Google Scholar]
- 2. Oshima K, Grimm CM, Corrales CE, et al. Differential distribution of stem cells in the auditory and vestibular organs of the inner ear. J Assoc Res Otolaryngol. 2007;8:18‐31. [DOI] [PMC free article] [PubMed] [Google Scholar]
- 3. Ryals BM, Rubel EW. Hair cell regeneration after acoustic trauma in adult Coturnix quail. Science. 1988;240:1774‐1776. [DOI] [PubMed] [Google Scholar]
- 4. Warchol ME. Sensory regeneration in the vertebrate inner ear: differences at the levels of cells and species. Hearing Res. 2011;273:72‐79. [DOI] [PubMed] [Google Scholar]
- 5. Chai R, Kuo B, Wang T, et al. Wnt signaling induces proliferation of sensory precursors in the postnatal mouse cochlea. Proc Natl Acad Sci U S A. 2012;109:8167‐8172. [DOI] [PMC free article] [PubMed] [Google Scholar]
- 6. Huch M, Dorrell C, Boj SF, et al. In vitro expansion of single Lgr5+ liver stem cells induced by Wnt‐driven regeneration. Nature. 2013;494:247‐250. [DOI] [PMC free article] [PubMed] [Google Scholar]
- 7. Li W, Wu J, Yang J, et al. Notch inhibition induces mitotically generated hair cells in mammalian cochleae via activating the Wnt pathway. Proc Natl Acad Sci U S A. 2015;112:166‐171. [DOI] [PMC free article] [PubMed] [Google Scholar]
- 8. Cox BC, Chai R, Lenoir A, et al. Spontaneous hair cell regeneration in the neonatal mouse cochlea in vivo. Development. 2014;141:816‐829. [DOI] [PMC free article] [PubMed] [Google Scholar]
- 9. Lu X, Sun S, Qi J, et al. Bmi1 regulates the proliferation of cochlear supporting cells via the canonical Wnt signaling pathway. Mol Neurobiol. 2017;54:1326‐1339. [DOI] [PubMed] [Google Scholar]
- 10. Bramhall NF, Shi F, Arnold K, et al. Lgr5‐positive supporting cells generate new hair cells in the postnatal cochlea. Stem Cell Rep. 2014;2:311‐322. [DOI] [PMC free article] [PubMed] [Google Scholar]
- 11. McLean WJ, Yin X, Lu L, et al. Clonal expansion of Lgr5‐positive cells from mammalian cochlea and high‐purity generation of sensory hair cells. Cell Rep. 2017;18:1917‐1929. [DOI] [PMC free article] [PubMed] [Google Scholar]
- 12. Bao M, Xie J, Huck WTS. Recent advances in engineering the stem cell microniche in 3D. Adv Sci. 2018;5:1800448. [DOI] [PMC free article] [PubMed] [Google Scholar]
- 13. Jarvelainen H, Sainio A, Koulu M, et al. Extracellular matrix molecules: potential targets in pharmacotherapy. Pharmacol Rev. 2009;61:198‐223. [DOI] [PMC free article] [PubMed] [Google Scholar]
- 14. Guilak F, Cohen DM, Estes BT, et al. Control of stem cell fate by physical interactions with the extracellular matrix. Cell Stem Cell. 2009;5:17‐26. [DOI] [PMC free article] [PubMed] [Google Scholar]
- 15. Sun Z, Guo SS, Fassler R. Integrin‐mediated mechanotransduction. J Cell Biol. 2016;215:445‐456. [DOI] [PMC free article] [PubMed] [Google Scholar]
- 16. Case LB, Waterman CM. Integration of actin dynamics and cell adhesion by a three‐dimensional, mechanosensitive molecular clutch. Nat Cell Biol. 2015;17:955‐963. [DOI] [PMC free article] [PubMed] [Google Scholar]
- 17. Vogel V, Sheetz M. Local force and geometry sensing regulate cell functions. Nat Rev Mol Cell Biol. 2006;7:265‐275. [DOI] [PubMed] [Google Scholar]
- 18. Frith JE, Kusuma GD, Carthew J, et al. Mechanically‐sensitive miRNAs bias human mesenchymal stem cell fate via mTOR signalling. Nat Commun. 2018;9:257. [DOI] [PMC free article] [PubMed] [Google Scholar]
- 19. Liu M, Zhang Z, Sampson L, et al. RHOA GTPase controls YAP‐mediated EREG signaling in small intestinal stem cell maintenance. Stem Cell Rep. 2017;9:1961‐1975. [DOI] [PMC free article] [PubMed] [Google Scholar]
- 20. Keung AJ, de Juan‐Pardo EM, Schaffer DV, et al. Rho GTPases mediate the mechanosensitive lineage commitment of neural stem cells. Stem Cells. 2011;29:1886‐1897. [DOI] [PMC free article] [PubMed] [Google Scholar]
- 21. Ma S, Meng Z, Chen R, et al. The Hippo pathway: biology and pathophysiology. Annu Rev Biochem. 2019;88:577‐604. [DOI] [PubMed] [Google Scholar]
- 22. Totaro A, Panciera T, Piccolo S. YAP/TAZ upstream signals and downstream responses. Nat Cell Biol. 2018;20:888‐899. [DOI] [PMC free article] [PubMed] [Google Scholar]
- 23. Mo JS, Park HW, Guan KL. The Hippo signaling pathway in stem cell biology and cancer. EMBO Rep. 2014;15:642‐656. [DOI] [PMC free article] [PubMed] [Google Scholar]
- 24. Yu F‐X, Zhao B, Guan K‐L. Hippo pathway in organ size control, tissue homeostasis, and cancer. Cell. 2015;163:811‐828. [DOI] [PMC free article] [PubMed] [Google Scholar]
- 25. Piccolo S, Dupont S, Cordenonsi M. The biology of YAP/TAZ: hippo signaling and beyond. Physiol Rev. 2014;94:1287‐1312. [DOI] [PubMed] [Google Scholar]
- 26. Qin H, Hejna M, Liu Y, et al. YAP induces human naive pluripotency. Cell Rep. 2016;14:2301‐2312. [DOI] [PMC free article] [PubMed] [Google Scholar]
- 27. Panciera T, Azzolin L, Fujimura A, et al. Induction of expandable tissue‐specific stem/progenitor cells through transient expression of YAP/TAZ. Cell Stem Cell. 2016;19:725‐737. [DOI] [PMC free article] [PubMed] [Google Scholar]
- 28. Gregorieff A, Liu Y, Inanlou MR, et al. Yap‐dependent reprogramming of Lgr5(+) stem cells drives intestinal regeneration and cancer. Nature. 2015;526:715‐718. [DOI] [PubMed] [Google Scholar]
- 29. Yui S, Azzolin L, Maimets M, et al. YAP/TAZ‐dependent reprogramming of colonic epithelium links ECM remodeling to tissue regeneration. Cell Stem Cell. 2018;22:35‐49. e37. [DOI] [PMC free article] [PubMed] [Google Scholar]
- 30. Yosefzon Y, Soteriou D, Feldman A, et al. Caspase‐3 regulates YAP‐dependent cell proliferation and organ size. Mol Cell. 2018;70:573‐587. e574. [DOI] [PubMed] [Google Scholar]
- 31. Schiller HB, Fässler R. Mechanosensitivity and compositional dynamics of cell–matrix adhesions. EMBO Rep. 2013;14:509‐519. [DOI] [PMC free article] [PubMed] [Google Scholar]
- 32. Das A, Fischer RS, Pan D, et al. YAP nuclear localization in the absence of cell‐cell contact is mediated by a filamentous actin‐dependent, Myosin II‐ and Phospho‐YAP‐independent pathway during extracellular matrix mechanosensing. J Biol Chem. 2016;291:6096‐6110. [DOI] [PMC free article] [PubMed] [Google Scholar]
- 33. Kim M, Kim M, Lee S, et al. cAMP/PKA signalling reinforces the LATS‐YAP pathway to fully suppress YAP in response to actin cytoskeletal changes. EMBO J. 2013;32:1543‐1555. [DOI] [PMC free article] [PubMed] [Google Scholar]
- 34. Wada K, Itoga K, Okano T, et al. Hippo pathway regulation by cell morphology and stress fibers. Development. 2011;138:3907‐3914. [DOI] [PubMed] [Google Scholar]
- 35. Yu FX, Zhao B, Panupinthu N, et al. Regulation of the Hippo‐YAP pathway by G‐protein‐coupled receptor signaling. Cell. 2012;150:780‐791. [DOI] [PMC free article] [PubMed] [Google Scholar]
- 36. Ni W, Lin C, Guo L, et al. Extensive supporting cell proliferation and mitotic hair cell generation by in vivo genetic reprogramming in the neonatal mouse cochlea. J Neurosci. 2016;36:8734‐8745. [DOI] [PMC free article] [PubMed] [Google Scholar]
- 37. Yeh WH, Chiang H, Rees HA, et al. In vivo base editing of post‐mitotic sensory cells. Nat Commun. 2018;9:2184. [DOI] [PMC free article] [PubMed] [Google Scholar]
- 38. McLean WJ, McLean DT, Eatock RA, et al. Distinct capacity for differentiation to inner ear cell types by progenitor cells of the cochlea and vestibular organs. Development. 2016;143:4381‐4393. [DOI] [PMC free article] [PubMed] [Google Scholar]
- 39. Wang Z, Jiang H, Yan Y, et al. Characterization of proliferating cells from newborn mouse cochleae. Neuroreport. 2006;17:767‐771. [DOI] [PubMed] [Google Scholar]
- 40. Sun Y, Chen C, Fu J. Forcing stem cells to behave: a biophysical perspective of the cellular microenvironment. Annu Rev Biophys. 2012;41:519‐542. [DOI] [PMC free article] [PubMed] [Google Scholar]
- 41. Cruz‐Acuna R, Quiros M, Farkas AE, et al. Synthetic hydrogels for human intestinal organoid generation and colonic wound repair. Nat Cell Biol. 2017;19:1326‐1335. [DOI] [PMC free article] [PubMed] [Google Scholar]
- 42. Goetzke R, Sechi A, De Laporte L, et al. Why the impact of mechanical stimuli on stem cells remains a challenge. Cell Mol Life Sci. 2018;75:3297‐3312. [DOI] [PMC free article] [PubMed] [Google Scholar]
- 43. Gnedeva K, Jacobo A, Salvi JD, et al. Elastic force restricts growth of the murine utricle. Elife. 2017;6. https://doi.org/10.7554/eLife.25681. [DOI] [PMC free article] [PubMed] [Google Scholar]
- 44. Koehler KR, Nie J, Longworth‐Mills E, et al. Generation of inner ear organoids containing functional hair cells from human pluripotent stem cells. Nat Biotechnol. 2017;35:583‐589. [DOI] [PMC free article] [PubMed] [Google Scholar]
- 45. Alves‐Lopes JP, Soder O, Stukenborg JB. Testicular organoid generation by a novel in vitro three‐layer gradient system. Biomaterials. 2017;130:76‐89. [DOI] [PubMed] [Google Scholar]
- 46. Chen SS, Fitzgerald W, Zimmerberg J, et al. Cell‐cell and cell‐extracellular matrix interactions regulate embryonic stem cell differentiation. Stem Cells. 2007;25:553‐561. [DOI] [PubMed] [Google Scholar]
- 47. Gill BJ, West JL. Modeling the tumor extracellular matrix: tissue engineering tools repurposed towards new frontiers in cancer biology. J Biomech. 2014;47:1969‐1978. [DOI] [PubMed] [Google Scholar]
- 48. Jiang H, Sha SH, Schacht J. Rac/Rho pathway regulates actin depolymerization induced by aminoglycoside antibiotics. J Neurosci Res. 2006;83:1544‐1551. [DOI] [PMC free article] [PubMed] [Google Scholar]
- 49. Chen G, Hou Z, Gulbranson DR, et al. Actin‐myosin contractility is responsible for the reduced viability of dissociated human embryonic stem cells. Cell Stem Cell. 2010;7:240‐248. [DOI] [PMC free article] [PubMed] [Google Scholar]
- 50. Etienne‐Manneville S, Hall A. Rho GTPases in cell biology. Nature. 2002;420:629‐635. [DOI] [PubMed] [Google Scholar]
- 51. Rosowski KA, Mertz AF, Norcross S, et al. Edges of human embryonic stem cell colonies display distinct mechanical properties and differentiation potential. Sci Rep. 2015;5:14218. [DOI] [PMC free article] [PubMed] [Google Scholar]
- 52. Dorn T, Kornherr J, Parrotta EI, et al. Interplay of cell‐cell contacts and RhoA/MRTF‐A signaling regulates cardiomyocyte identity. EMBO J. 2018;37. https://doi.org/10.15252/embj.201798133. [DOI] [PMC free article] [PubMed] [Google Scholar]
- 53. Chakraborty S, Njah K, Pobbati AV, et al. Agrin as a mechanotransduction signal regulating YAP through the Hippo pathway. Cell Rep. 2017;18:2464‐2479. [DOI] [PubMed] [Google Scholar]
- 54. Dupont S, Morsut L, Aragona M, et al. Role of YAP/TAZ in mechanotransduction. Nature. 2011;474:179‐183. [DOI] [PubMed] [Google Scholar]
- 55. Meng Z, Qiu Y, Lin KC, et al. RAP2 mediates mechanoresponses of the Hippo pathway. Nature. 2018;560:655‐660. [DOI] [PMC free article] [PubMed] [Google Scholar]
- 56. Dawes LJ, Shelley EJ, McAvoy JW, et al. A role for Hippo/YAP‐signaling in FGF‐induced lens epithelial cell proliferation and fibre differentiation. Exp Eye Res. 2018;169:122‐133. [DOI] [PubMed] [Google Scholar]
- 57. Dasari VR, Mazack V, Feng W, et al. Verteporfin exhibits YAP‐independent anti‐proliferative and cytotoxic effects in endometrial cancer cells. Oncotarget. 2017;8:28628‐28640. [DOI] [PMC free article] [PubMed] [Google Scholar]
- 58. Zhang H, Ramakrishnan SK, Triner D, et al. Tumor‐selective proteotoxicity of verteporfin inhibits colon cancer progression independently of YAP1. Sci Signal. 2015;8:ra98. [DOI] [PMC free article] [PubMed] [Google Scholar]
- 59. Liu‐Chittenden Y, Huang B, Shim JS, et al. Genetic and pharmacological disruption of the TEAD‐YAP complex suppresses the oncogenic activity of YAP. Genes Dev. 2012;26:1300‐1305. [DOI] [PMC free article] [PubMed] [Google Scholar]
- 60. Kuser‐Abali G, Alptekin A, Lewis M, et al. YAP1 and AR interactions contribute to the switch from androgen‐dependent to castration‐resistant growth in prostate cancer. Nat Commun. 2015;6:8126. [DOI] [PMC free article] [PubMed] [Google Scholar]
- 61. Xin M, Kim Y, Sutherland LB, et al. Hippo pathway effector Yap promotes cardiac regeneration. Proc Natl Acad Sci U S A. 2013;110:13839‐13844. [DOI] [PMC free article] [PubMed] [Google Scholar]
- 62. Kuo BR, Baldwin EM, Layman WS, et al. In vivo cochlear hair cell generation and survival by coactivation of β‐Catenin and Atoh1. J Neurosci. 2015;35:10786‐10798. [DOI] [PMC free article] [PubMed] [Google Scholar]
- 63. Heallen T, Zhang M, Wang J, et al. Hippo pathway inhibits Wnt signaling to restrain cardiomyocyte proliferation and heart size. Science. 2011;332:458‐461. [DOI] [PMC free article] [PubMed] [Google Scholar]
- 64. Gjorevski N, Sachs N, Manfrin A, et al. Designer matrices for intestinal stem cell and organoid culture. Nature. 2016;539:560‐564. [DOI] [PubMed] [Google Scholar]
- 65. Nichane M, Javed A, Sivakamasundari V, et al. Isolation and 3D expansion of multipotent Sox9(+) mouse lung progenitors. Nat Methods. 2017;14:1205‐1212. [DOI] [PubMed] [Google Scholar]
- 66. Turco MY, Gardner L, Hughes J, et al. Long‐term, hormone‐responsive organoid cultures of human endometrium in a chemically defined medium. Nat Cell Biol. 2017;19:568‐577. [DOI] [PMC free article] [PubMed] [Google Scholar]
Associated Data
This section collects any data citations, data availability statements, or supplementary materials included in this article.
Supplementary Materials
Data S1: Supporting Information
Supplementary Figure 1 Inhibition of RhoA attenuates the expansion of IEPCs and reduces YAP nuclear localization in IEPCs. (a) Luminescent cell viability assay comparing cell viability of suspension culture system cultured IEPCs in the presence of different concentrations of CT04 (n = 5). (b) Transmitted light microscopy images of spheroids from suspension and encapsulated cultured IEPCs treated with different concentrations of CT04. The scale bar of the Suspension group is 200 μm and the scale bar of the Encapsulated group is 500 μm. Quantification of the number of spheroids from (b) (n = 4). The data are presented as means ± SEM; ** P < 0.01 versus Control (one‐way ANOVA followed by Dunnett's multiple comparison test). (c) Confocal images showing YAP and F‐actin staining in IEPCs treated with vehicle or 0.5 μg/ml CT04. Scale bar, 15 μm. Quantification of the percentage of nuclear YAP+ cells per sphere from (c). n = 9 spheroids for each group. ** P < 0.01 (Student's t‐test).
Supplementary Figure 2 Activation of RhoA enhances the expansion of IEPCs and YAP nuclear localization in IEPCs. (a) Luminescent cell viability assay comparing cell viability of suspension culture system cultured IEPCs in the presence of different concentration of CN03 (n = 6). (b) Transmitted light microscopy images of spheroids from suspension and encapsulated cultured IEPCs treated with different concentration of CN03. The scale bar of the suspended group is 200 μm, and the scale bar of the encapsulated group is 500 μm. Quantification of the number of spheroids from (b) (n = 4). The data are presented as means ± SEM; * P < 0.05 and ** P < 0.01 versus Control (one‐way ANOVA followed by Dunnett's multiple comparison test). (c) Confocal images showing YAP and F‐actin staining in IEPCs treated with vehicle or 0.2 μg/ml CN03. Scale bar, 15 μm. Quantification of the percentage of nuclear YAP+ cells per sphere from (c). n = 10 spheroids for each group. ** P < 0.01 (Student's t‐test).
Supplementary Figure 3 Overexpression of β‐catenin enhances the expression of Lgr5 in vivo and the capacity of sphere formation of IEPCs in 3D‐encapsulated culture. (a) Confocal images of the organ of Corti showing Lgr5‐EGFP and β‐catenin expression from Lgr5EGFPcreERT2/+ and Lgr5EGFPcreERT2/+; β‐cateninflox(exon3) (β‐catenin OE) mice. Tamoxifen was given at P0, and tissues were harvested at P7. Scale bar, 15 μm. (b) Transmitted light microscopy images of 3D‐encapsulated cultured IEPCs from Lgr5EGFPcreERT2/+ and Lgr5EGFPcreERT2/+; β‐cateninflox(exon3) (β‐catenin OE) mice. Quantification of the number of spheroids from (b) (n = 5). ** P < 0.01 (Student's t‐test).
Supplementary Figure 4 Transcriptional Characterization of IEPCs in 3D‐encapsulated culture. (a) Confocal images showing Sox2 and E‐caderin staining in Encapsulated cultured IEPCs. Scale bar, 25 μm. (b) The volcano plot showing the overall gene expression. There are 1,432 differentially expressed genes (p‐adj < 0.05, |log2Foldchange| >1) detected between in vivo cochlear epithelium cells versus in vitro cultured IEPCs. (c) Heatmap of hair cell related genes in cultured IEPCs and cochlear epithelium tissue. (d) Heatmap of mechnotransduction related genes in cultured IEPCs and cochlear epithelium tissue. (e) Heatmap of apoptosis related genes in cultured IEPCs and Organ of cochlear epithelium tissue. (f) Heatmap of cell cycle related genes in cultured IEPCs and cochlear epithelium tissue. (g) Heatmap of Wnt related genes in cultured IEPCs and cochlear epithelium tissue. (h) Heatmap of inner ear progenitor cell related genes in cultured IEPCs and cochlear epithelium tissue.
Data Availability Statement
The data that support the findings of this study are accessible through accession number PRJNA608092 (NCBI SRA).