

Abstract
A developmental validation was performed to demonstrate reliability, reproducibility, and robustness of the ANDE Rapid DNA Identification System for processing of crime scene and disaster victim identification (DVI) samples. A total of 1705 samples were evaluated, including blood, oral epithelial samples from drinking containers, samples on FTA and untreated paper, semen, bone, and soft tissues. This study was conducted to address the FBI’s Quality Assurance Standards on developmental validation and to accumulate data from a sufficient number of unique donors and sample types to meet NDIS submission requirements for acceptance of the ANDE Expert System for casework use. To date, no Expert System has been approved for such samples, but the results of this study demonstrated that the automated Expert System performs similarly to conventional laboratory data analysis. Furthermore, Rapid DNA analysis demonstrated accuracy, precision, resolution, concordance, and reproducibility that were comparable to conventional processing along with appropriate species specificity, limit of detection, performance in the presence of inhibitors. No lane‐to‐lane or run‐to‐run contamination was observed, and the system correctly identified the presence of mixtures. Taken together, the ANDE instrument, I‐Chip consumable, FlexPlex chemistry (a 27‐locus STR assay compatible with all widely used global loci, including the CODIS core 20 loci), and automated Expert System successfully processed and interpreted more than 1200 unique samples with over 99.99% concordant CODIS alleles. This extensive developmental validation data provides support for broad use of the system by agencies and accredited forensic laboratories in single‐source suspect‐evidence comparisons, local database searches, and DVI.
Keywords: Rapid DNA Identification, developmental validation, FlexPlex assay, Expert System, ANDE, I‐Chip, DNA analysis/testing, Quality Assurance Standards, short tandem repeat, disaster victim identification
Over the past several years, Rapid DNA Identification has begun to have significant impacts on a wide range of public safety applications. In law enforcement, the first NDIS approvals for Rapid DNA analysis of buccal swabs 1, 2 coincided with the passage of the Federal Rapid DNA Act 3, which authorized processing of arrestee buccal swabs using NDIS‐approved Rapid DNA systems. Rapid DNA has been utilized in Department of Homeland Security pilot studies to prevent human trafficking 4 and by the military and law enforcement agencies to combat crime in general and the rape epidemic in particular 3, 5. Finally, Rapid DNA Identification is changing the approach to DVI following dramatic successes in the 2018 California Wild Fire 6 and the 2019 Channel Island dive boat disasters 7.
Forensic DNA analysis is broadly divided into processing of two categories of biological evidence, namely reference samples and crime scene samples. Consistent with the FBI’s focus on introduction of Rapid DNA into the police booking station for arrestee testing 8, the FBI’s Scientific Working Group for DNA Analysis Methods (SWGDAM) developed a set of guidelines for the Rapid DNA analysis of buccal swab reference samples 9. In essence, the Rapid DNA guidelines for buccal swabs mirrored those for conventional DNA analysis with the additional inclusion of a requirement for an automated Expert System; these guidelines were followed and were the basis for the NDIS approval of two versions of the ANDE Rapid DNA Identification System 1, 2.
To date, SWGDAM has not developed guidelines for the Rapid DNA Analysis of casework or DVI samples for CODIS search and upload, although the FBI has formed a working group to explore these issues. In the interim, there is value in performing an extensive developmental validation study to inform accredited laboratories and agencies that are already using or planning to use Rapid DNA for these sample types. Accordingly, in the present work, we perform a developmental validation of the ANDE Rapid DNA Identification System that is based on related SWGDAM guidelines for the Rapid DNA analysis of reference samples. In particular, the work presented here demonstrates that the rapid processing and automated Expert System analysis of 1705 casework samples is comparable to conventional laboratory methodologies. Although the ANDE I‐Chip Expert System is quite similar to the A‐Chip Expert System, a conservative approach to developmental validation was taken based on treating the I‐Chip Expert System as brand new and performing analysis on samples from more than 1200 unique donors as required by the NDIS Operational Procedure Manual 10.
Overview of the ANDE Rapid DNA Identification System
The system consists of four components: the ANDE swab, the consumable chip, the ANDE 6C instrument, and the automated Expert System. There are two types of chips. The A‐Chip 11, 12 processes up to five buccal samples and, along with the ANDE instrument and Expert System, received NDIS approval 1, 2 for searching and uploading to CODIS following processing of buccal samples in accredited laboratories 8. The I‐Chip was designed for the processing of casework and DVI samples and is a single use, disposable consumable which includes all reagents, materials and waste containment required to perform fully‐automated STR analysis of up to four samples 13. DNA purification reagents, FlexPlex PCR reagents, buffers, and separation polymer are all preloaded on the chip and have been optimized for the microfluidic environment to ensure consistent, balanced, and precise results. The major difference between the A‐Chip and the I‐Chip is that the I‐Chip (Fig. 1) incorporates a sample concentration module positioned downstream of the purification module. As a result, DNA is concentrated prior to PCR amplification, resulting in a lower I‐Chip limit of detection.
Figure 1.
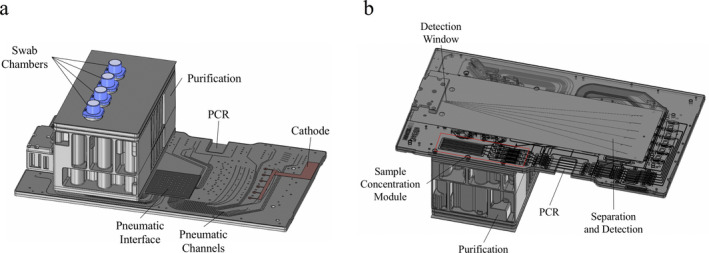
Schematic Diagram of the ANDE I‐Chip (dimensions: 295 mm × 165 mm × 93 mm). (a) Top View. (b) Bottom View, showing ultrafiltration modules. [Color figure can be viewed at wileyonlinelibrary.com]
The FlexPlex assay (Fig. 2) was developed to support compatibility with DNA databases around the world. FlexPlex contains 23 autosomal STR loci (D1S1656, D2S1338, D2S441, D3S1358, D5S818, D6S1043, D7S820, D8S1179, D10S1248, D12S391, D13S317, D16S539, D18S51, D19S433, D21S11, D22S1045, FGA, CSF1PO, Penta E, TH01, vWA, TPOX, and SE33), three Y‐chromosomal STR loci (DYS391, DYS570, and DYS576), and Amelogenin.
Figure 2.

Configuration of the FlexPlex STR assay. Flexplex is a 6‐Color assay (including an Internal Lane Standard) that interrogates 23 autosomal STR loci, three Y‐chromosomal, and Amelogenin. FlexPlex generates data compatible with databases around the world, including the CODIS core 20 loci, ENFSI/EDNAP Expanded European Standard Set, Australia’s National Criminal Investigation DNA Database, Canada’s National DNA Data Bank, China’s National DNA Database, Germany’s DNA‐Analyze‐Datei, New Zealand’s National DNA Profile Databank, and United Kingdom’s National DNA Database. Dye labels are: FAM (blue), JOE (green), TMR (yellow), CXR (red), TOM (purple), and WEN (orange). [Color figure can be viewed at wileyonlinelibrary.com]
The ANDE System includes several integrated software packages for instrument control, data collection, and Expert System interpretation of STR profiles. After the Chip containing the samples has been inserted into the instrument and the door closed, sample processing starts automatically. Following electrophoretic separation and laser‐based detection of amplified STR fragments, the Expert System software automatically analyzes and interprets the data and provides rapid feedback on the usability of the STR profiles for database enrollment and searching. The output files are available for optional review by a qualified DNA analyst. All output files are encrypted and can be exported and decrypted by FAIRS™, a multi‐function, multi‐tiered user privilege software package. FAIRS integrates database generation and management, search and match, and kinship determination functionalities.
Materials and Methods
Rapid DNA Sample Processing
All ANDE instruments were configured with System Software version 2.0.6 and Expert System Software version 2.0.5. I‐Chips were used for all Rapid DNA runs in this developmental validation. A wide range of mock casework and DVI samples were introduced via an ANDE swab into I‐Chips for Rapid DNA analysis. The swabs are stored in a desiccant‐containing protective tube until processing, and the swab cap contains an RFID for sample tracking. To perform a run, swabs are inserted into up to four swab chambers of the I‐Chip. (When fewer than four samples are processed, blank swabs are inserted into the unused chambers.) The I‐Chip is then inserted into the ANDE instrument. All processes are performed within the Chip and the instrument without human intervention (with the exception that preprocessing is required for bone, tooth, and blood on FTA samples). Finally, the Expert System software automatically processes the raw data, designates STR alleles, and employs a set of analytical rules to interpret the STR profiles. Automated processing and interpretation lead to STR profile generation in 106 min (with an additional 5‐20 min for preprocessing of bone, tooth, and blood on FTA).
Species Specificity Study
Duplicate ANDE swabs were spiked with 50 µL of purified genomic DNAs prepared in TE−4 (10 mM Tris‐HCl, 0.1 mM EDTA, pH 8) from 14 different species (for a total of 28 samples). The quantity of DNA spiked per swab was as follows: 1 ng each from S. aureus, S. pneumoniae, L. plantarum, and S. cerevisiae; 10 ng each from cow (Bos taurus), ferret (Mustela putorius furo), dog (Canis lupus familiaris), pig (Sus), cat (Felis catus); 5 ng each from orangutan (Pongo pygmaeus), gorilla (Gorilla gorilla), chimpanzee (Pan troglodytes), rhesus monkey (Macaca mulatta), and gibbon (Hylobatidae).
Sensitivity and Limit of Detection
Ten different blood donors were used, and white blood cell counts obtained using a Complete Blood Count instrument. Triplicate samples of 0.1, 0.5, 1, and 3 µL blood from each donor were spotted on ceramic tiles, allowed to dry at room temperature, and collected with an ANDE swab (as described in “Sample Collection, Blood on Tile” below). The 0.1 and 0.5 μL blood samples were prepared from 10‐fold and 2‐fold dilutions, respectively, of 1 μL samples in 1X PBS. Duplicate samples of 10 µL and 25 µL blood from each donor were also spotted on ceramic tiles, dried, and then collected with an ANDE swab (for a total of 160 samples).
Swab Stability
Ten oral epithelial samples were collected from drinking containers used by three individuals to generate a total of thirty samples. Ten 3 µL dried blood samples on ceramic tile were collected from three individuals to generate a second set of thirty samples. Following collection, each swab was inserted into its protective tube containing desiccant. Samples were stored at room temperature for 1, 3, 6, 9, and 12 months. Duplicate swabs were run from each donor per time‐point on ANDE I‐Chips (60 swabs total). ANDE swabs can also be refrigerated or frozen for later processing.
Inhibitors
Several potentially inhibitory substances (toothpaste, mouthwash, beer, tea, tobacco dip, cigarette, and coffee) that are likely to be found in the oral cavity were tested in duplicate. The potential inhibitors were consumed by the donor in a manner consistent with reasonable use prior to sample collection. Oral epithelial samples were then collected from the used cups and bottles as described in “Sample Collection” below. To test blood as a potential inhibitor, 5 and 10 µL aliquots of fingerstick blood from a first donor were dried on ceramic tile, and oral epithelial swabs from a second donor were utilized to collect the blood. A total of four donor pairs were tested. Humic acid (Sigma Cat#53680‐10G) prepared at 0.1, 0.2, 0.4, 0.8, 1.0, 1.5, and 3.0 μg/μL was spiked onto swabs containing 3 µL of dried blood and compared with similar samples without humic acid. The effect of indigo dye was evaluated by processing bloodstains from both new, unwashed dark blue denim and new, unwashed cotton fabrics. Fabric cuttings of the stains were processed as described in “Sample Collection, Blood on Fabric”). A total of 76 samples were included in the inhibitor study.
Reproducibility
A set of quadruplicate samples of 3 µL‐dried blood on ceramic tile from a unique donor and quadruplicate samples of saliva (two 3 mm punches from an FTA card) from a second unique donor were collected as described in “Sample Collection” below. Six sets were prepared and run on I‐Chips using six different ANDE instruments and two lots of I‐Chips; a total of 24 blood and 24 saliva samples were processed. Inter‐ and intra‐run reproducibility was assessed by comparing concordance, signal strength, and heterozygote peak height ratios (PHRs) for all replicates.
Mixtures
Two donors were selected (1 male and 1 female) that, based on their previous STR profile typing results, did not share alleles in most loci. Buccal swabs were collected from these two donors and purified using conventional tube‐based purification using essentially the purification protocol incorporated into the I‐Chip 13, 14. Purified DNAs were quantified using standard absorption spectroscopy. The purified DNAs were mixed in the ratios of 1:19 (5 ng:95 ng), 1:5 (16.7 ng:83.3 ng); 1:1 (50 ng:50 ng); 5:1 (83.3:16.7 ng); and 1:19 (95 ng:5 ng) in TE−4 with 100 ng of total DNA in a 50 µL volume. The 50 µL solutions were then deposited onto individual swabs and run on I‐Chips in quadruplicate (20 samples total). The 100 ng quantity of DNA was selected to attempt to generate detectable signal from the minor contributor in the 1:19 and 19:1 mixtures.
Accuracy and Concordance
Accuracy was evaluated by generating STR profiles for 1299 samples (obtained from unique donors) across 17 sample types: blood on ceramic tile, blood on FTA paper, blood on cotton fabric, blood on denim fabric, dried blood on knife, oral epithelial samples from drinking cups, saliva on non‐FTA paper, saliva on FTA paper, neat semen, semen on cotton fabric, chewing gum, and DVI samples (bone, brain, liver, lung, muscle, and tooth). A sample was conservatively defined as passing if it generated calls for 16 or more CODIS core loci in the FlexPlex27 assay. First pass and final success rates were calculated from all 1214 accuracy samples, all processed using the ANDE Expert System. Concordance was determined by comparing Rapid DNA results to those generated by conventional laboratory processing. Conventional processing utilized the PowerPlex Fusion6C and PowerPlex/PP21 assays; Fusion 6C does not include D6S1043. Accuracy samples were used to calculate peak heights (PH), PHR, incomplete nucleotide addition (iNTA), stutter, resolution, and precision.
Contamination Study
Runs were made with the following sample loading configurations: blank/blank/blank/blank (in duplicate), sample/blank/blank/blank (in duplicate), blank/blank/blank/sample (in duplicate), sample/blank/sample/blank (in quadruplicate), and blank/sample/blank/sample (in quadruplicate). Two 3 mm punches from Bode buccal collectors were used for samples, and two 3 mm punches from unused Bode collectors were used for the blank samples. The punches were directly loaded into the swab chamber (14 samples total); no sample preprocessing was performed (see Sample Collection methods below).
Sample Collection
A total of 1705 samples across 17 sample types were processed in this Developmental Validation study. Samples were collected as follows:
Dried Blood on Tile. Fresh whole blood samples collected in sodium heparin anticoagulant tubes were homogenized by completely inverting the tubes several times, spotting 3 µL on clean ceramic tiles, and drying overnight. For each dried bloodstain, one drop of sterile water (~15 µL) was added and allowed to stand for approximately one minute prior to collection with a prewetted ANDE swab. To prewet the swab, 2–3 drops of sterile water (~50 µL) were added to the tip of the swab head. The dried blood samples were processed on I‐Chips in the ANDE system. Samples from 501 unique donors were obtained for the accuracy and concordance study. The same methods for preparation and collection of dried bloodstains were also utilized for the sensitivity and limit of detection, swab stability, and reproducibility studies.
Blood on FTA Paper. 150 µL of homogenized blood (collected in sodium heparin anticoagulant tubes) was pipetted onto FTA paper (Whatman Cat#WB120211) and allowed to dry at room temperature overnight. For each sample, one 3 mm disk was prepared and placed in a sterile 2 mL microfuge tube. To the tube, 120 µL of TE−4 was added. Using a pipette tip, the disk was macerated by pressing it against the tube wall and incubated at 50°C for 15 min. Blood on FTA preprocessing required approximately 20 min. Samples from 201 unique donors were processed and analyzed for the accuracy and concordance study.
Oral Epithelial Samples from Drinking Containers. Mugs, water bottles, and cups that were used by donors were swabbed using a premoistened ANDE swab prepared as described above for dried blood on tile. Samples from 100 unique donors were processed and analyzed for the accuracy and concordance study.
Saliva on non‐FTA paper collected with Bode™ Buccal Collection Kit. Sample collection was performed following the manufacturer’s protocol. From the sample collector, two 3 mm disks were punched from the tip and directly loaded into a swab chamber. A blank (unused) ANDE swab was then inserted to seal each chamber. Samples from 150 unique donors were processed and analyzed for the accuracy and concordance study.
Saliva on FTA paper collected with EasicollectTM Buccal Collection Kit (WhatmanTM Cat#WB120237). Sample collection was performed following the manufacturer’s protocol. The paper turns from light pink to white with sample deposition. From the white area on the sample collector, two 3 mm disks were punched and loaded into the swab chamber. A blank ANDE swab was then inserted to seal each chamber. Samples from 103 unique donors were processed and analyzed for the accuracy and concordance study.
Semen (neat). In a 2 mL microtube, 20 µL of neat semen was diluted with 80µl of sterile water and mixed well. Next, 20 µL of 0.5 M TCEP (Catalog #64654, Sigma‐Aldrich, St. Louis, MO) was added and mixed. Sterile water was added instead of 1× PBS because TCEP is incompatible with phosphate buffers. TCEP is room temperature stable and is nonvolatile, but other reducing agents such as DTT may also be utilized. The entire mixture was pipetted on an ANDE swab for processing. Samples from 51 unique donors were processed and analyzed for the accuracy and concordance study.
Semen Stain on Fabric. Cotton fabric sections of approximately 2” x 2” were placed on a petri dish. A tube containing approximately 1 mL semen was mixed, and 100 µL was transferred onto the center of the fabric. The stain was allowed to dry overnight prior to collection with an ANDE swab. To the tip of the ANDE swab, 100 µL of 500 mM TCEP was added. Using sterile forceps to hold the stained fabric in place, the stain was swabbed for a total of four strokes while rotating the fabric to maximize the collection. Note that approximately ¼″ × ¼″ fabric cuttings may also be placed directly into the swab chambers (without maceration) following placement of 500 mM TCEP on the stain. Samples from 17 unique donors were processed and analyzed for the accuracy and concordance study.
Blood on Knife. Fingerstick blood (5 µL) was spotted on a stainless steel knife, allowed to dry overnight, and then collected with an ANDE swab as described above. Blood stain samples from 17 different donors were processed and analyzed for the accuracy and concordance study.
Blood on Fabric. Cotton and denim fabrics sections of approximately 2″ × 2″ were placed on a petri dish. 100 µL of fresh whole blood collected in sodium heparin anticoagulant was spotted on the fabric types and allowed to dry at overnight. An approximately ¼″ × ¼″ piece of stained fabric was cut using a sterile scalpel and transferred in a sterile 2 mL microtube. To this, 140 μL of TE−4 buffer was added. Using a pipette tip, the fabric was macerated by pressing it against the tube wall. An ANDE swab was placed into the microtube to collect the liquid for Rapid DNA processing. Note that approximately ¼″ × ¼″ fabric cuttings may also be placed directly into the swab chambers without maceration. For the accuracy and concordance study, a total of 18 samples were processed and analyzed from 10 different donors, with 8 samples on cotton and 10 samples on denim.
Chewing Gum. To prewet a swab, 2–3 drops of sterile water (~50 µL) were added to the tip of the swab head. The exterior of the gum was thoroughly swabbed. Gum samples from 40 different donors were processed and analyzed for the accuracy and concordance study.
Bone and other DVI Sample Types. A total of 101 samples across seven tissue types typically useful in DVI settings were processed for the accuracy and concordance study. The samples were all obtained from unique donors and consisted of: 18 bones (femur, humerus, and rib); 34 skeletal muscle; 24 liver; 3 molar tooth; 11 lung; 2 brain cortex; and 9 kidney. A fragment of soft tissue was excised (~5 mg for muscle, ~0.5 mg for lung, ~0.125 mg for liver, ~10–20 mg for brain, ~0.5 mg for kidney) and placed directly on an ANDE swab for analysis (no preprocessing was required). Bone and tooth roots were hammered into tiny fragments and into powder‐like consistency using a mortar and pestle. Approximately, 5–10 mg of pulverized bone/tooth was demineralized in 120 µL of ANDE™ Bone Solution (a commercially available demineralization solution) for 1 min at room temperature, and 15 µL of the solution was loaded onto ANDE swab for analysis 15. Bone and tooth preprocessing required approximately 5 min.
Conventional Laboratory Testing
Concordance between ANDE FlexPlex chemistry‐generated STR profiles and those generated by conventional laboratory methods was verified by submitting buccal swabs, bloodcards, or purified DNAs extracted from tissue samples to Bode Technology (Lorton, Virginia) for testing. Conventional STR profiles were created for all 27 FlexPlex loci by processing the samples using both PowerPlex® Fusion 6C and PowerPlex® 21 (Promega, Madison, WI; utilized to provide information on the D6S1043 locus). Separation and detection were conducted with an Applied Biosystems 3500 Genetic Analyzer following lab‐validated or manufacturer’s protocols. The conventional data were analyzed using GeneMapper® ID‐X, version 1.5 and interpreted by two qualified analysts and reviewed by a qualified technical reviewer. Additional techniques such as re‐injection, re‐extraction, quantification, and re‐amplification were employed for conventionally‐processed samples that did not initially pass technical specifications for reporting.
Results
Species Specificity
The species specificity of STR typing systems is essential to ensure that interpretation of STR profiles derived from human subjects is not complicated by other species’ cross‐reactivity with, in this case, the FlexPlex assay. The ANDE Expert System did not generate passing STR profiles for any of the species tested. No amplification peaks were called for S. aureus, S. pneumoniae, L. plantarum, and S. cerevisiae, cow, ferret, dog, pig, cat, or rhesus monkey. As expected, a small number of alleles were observed and labelled in red warning boxes for orangutan, gorilla, chimpanzee, and gibbon. Note that peaks indicated in red warning boxes in the.png electropherogram output display failed to pass the Expert System interpretation rules and were not included in the resulting .xml file or allele table.
Limit of Detection
Biological evidence samples contain variable quantities of DNA, and this inherent variability is exacerbated by jurisdictional‐to‐jurisdictional differences in collection protocols and individual‐to‐individual differences in collection techniques. The limit of detection of the ANDE System was evaluated to determine the robustness of the system when used to process dried blood samples with input volumes ranging from 0.1 to 25 µL. Full profiles were generated for all 30 blood samples with 1 and 3 µL and for all 20 samples with 10 and 25 µL. At 0.5 µL input blood, 21 samples generated full profiles. One sample had a microfluidic failure, and the remaining 8 generated partial profiles with a mean of 18.0 CODIS 20 loci and 23.5 FlexPlex loci called. At 0.1 µL input blood, three samples generated full profiles, one sample generated no called peaks, and the remaining 26 generated partial profiles with a mean of 18.2 CODIS 20 loci and 23.9 FlexPlex loci called. The ten donors utilized in this study had an average white blood cell concentration of 6.93 × 10³ cells/µL blood and ranging from 4.4 to 9.8 × 10³ cells/µL, well within the expected range. The average diameter of a 0.5 µL blood spatter stain is 1.5–2.0 mm and is a useful guide for instruction of evidence collectors. Generating uniform 0.1 and 0.5 µL spots were not possible, and dilutions in 1× PBS were required for consistency. Taken together, the effective lower limit of detection is a bloodstain with a volume of approximately 0.5 µL and the upper limit is over 100µl. The limit of detection is expected to vary based on the type of biological fluid, condition of the sample (including age and degradation), and the substrate (e.g. porous vs. nonporous, presence of inhibitors).
Stability
The ANDE system is designed to allow forensic samples to be analyzed soon after collection, whether in the laboratory or in the field. In some cases, it may not be possible or desirable to run samples immediately following collection, and, accordingly, stability testing was performed to examine the possible effects of long‐term storage of ANDE swab samples on system performance. In this study, the effect of storage of oral epithelial samples from drinking containers and dried blood samples on ceramic tile on ANDE desiccant swabs on system performance was evaluated. Table 1 shows the success of the samples stored at room temperature for 1, 3, 6, 9, and 12 months; full CODIS 20 and FlexPlex27 profiles were generated for most samples, regardless of time‐point. The data show that no decline in lane success was observed over the course of one year. In addition, Figure S1 shows that there was no meaningful change in average signal strength over the course of the study. Finally, we have previously demonstrated room temperature stability of chips with FlexPlex chemistry over at least six months 12.
Table 1.
Stability of ANDE desiccant swabs of oral epithelial samples from drinking containers and (3 µL‐dried blood samples on ceramic tiles as assessed by the number of (a) CODIS and (b) FlexPlex27 loci called following Rapid DNA analysis.
| a | |||||||
|---|---|---|---|---|---|---|---|
| Sample Type | Donor | Sample # | Time points | ||||
| 1 Month | 3 Months | 6 Months | 9 Months | 12 Months | |||
| No. of CODIS Loci Called | No. of CODIS Loci Called | No. of CODIS Loci Called | No. of CODIS Loci Called | No. of CODIS Loci Called | |||
| Oral epithelial | 1 | 1 | 20 | 20 | 20 | 20 | 16 |
| 2 | 20 | 20 | 20 | 20 | 20 | ||
| 2 | 1 | 20 | 20 | 11 | 20 | 20 | |
| 2 | 20 | 20 | 20 | 20 | 20 | ||
| 3 | 1 | 20 | 20 | 20 | 12 | 20 | |
| 2 | 20 | 20 | 20 | 20 | 19 | ||
| Blood | 4 | 1 | 20 | 14 | 20 | 20 | 20 |
| 2 | 20 | 20 | 20 | 20 | 20 | ||
| 5 | 1 | 20 | 20 | 20 | 20 | 20 | |
| 2 | 20 | 20 | 20 | 20 | 20 | ||
| 6 | 1 | 10 | 20 | 20 | * | 20 | |
| 2 | 20 | 20 | 20 | 20 | 20 | ||
| Average CODIS20 Loci | 19.17 | 19.50 | 19.25 | 19.27 | 19.58 | ||
| b | |||||||
|---|---|---|---|---|---|---|---|
| Sample Type | Donor | Sample # | Time Points | ||||
| 1 Month | 3 Months | 6 Months | 9 Months | 12 Months | |||
| No. of FlexPlex Loci Called | No. of FlexPlex Loci Called | No. of FlexPlex Loci Called | No. of FlexPlex Loci Called | No. of FlexPlex Loci Called | |||
| Oral Epithelial | 1 | 1 | 27 | 27 | 27 | 26 | 21 |
| 2 | 26 | 27 | 27 | 27 | 26 | ||
| 2 | 1 | 27 | 27 | 15 | 27 | 26 | |
| 2 | 27 | 27 | 27 | 27 | 27 | ||
| 3 | 1 | 24 | 23 | 24 | 12 | 24 | |
| 2 | 24 | 23 | 24 | 23 | 24 | ||
| Blood | 4 | 1 | 27 | 20 | 27 | 27 | 27 |
| 2 | 27 | 27 | 27 | 27 | 27 | ||
| 5 | 1 | 27 | 27 | 27 | 27 | 27 | |
| 2 | 27 | 27 | 27 | 27 | 27 | ||
| 6 | 1 | 13 | 27 | 27 | * | 27 | |
| 2 | 27 | 27 | 27 | 27 | 27 | ||
| Average FlexPlex27 Loci | 25.25 | 25.75 | 25.50 | 25.18 | 25.83 | ||
No profile generated. The I‐Chip did not fully process the sample; this occurs in approximately 2% of lanes.
Inhibitors
Casework samples are often exposed to substances that have the potential to inhibit PCR reactions, whether derived from sample donor (e.g., potential inhibitors such as alcohol or coffee) or from the environment (e.g., humic acid from soil). Full profiles were generated from all oral epithelial samples collected immediately following use of toothpaste, mouthwash, beer, tea, tobacco dip, cigarette, and coffee. Full profiles were also generated from bloodstain samples collected on denim (containing indigo dye and heme), and also on samples spiked with 0.1–1 µg/µL humic acid. Humic acid concentrations of 1.5 and 3 µg/µL inhibited amplification as expected 16, 17. Finally, full profiles were generated from all oral epithelial samples collected with dried blood (these profiles were present as mixtures, along with those from the blood donor). Taken together, the results demonstrate that the ANDE System is robust and reliable in the presence of tested potential inhibitors; in addition, no marker‐specific inhibitory effects were observed.
Reproducibility
Twenty‐four replicates each of dried blood and saliva collected on Easicollect Collection kits were run on I‐Chips using six ANDE instruments for a total of 48 samples. All samples generated full and concordant profiles. Representative profiles from the FAM (blue) channel for six of the 24 sample replicates are shown in Fig. 3 (from three of the six ANDE instruments). Analysis of inter‐ and intra‐ reproducibility runs also showed comparable signal strength/peak height (PH) across all loci (Figure S2a and b) and peak height ratios (PHR) for heterozygote loci (Figure S2c and d). The reproducibility of the STR profiles generated from the same single‐source blood and saliva mock casework samples instills confidence in the ability of the ANDE system to generate searchable profiles.
Figure 3.
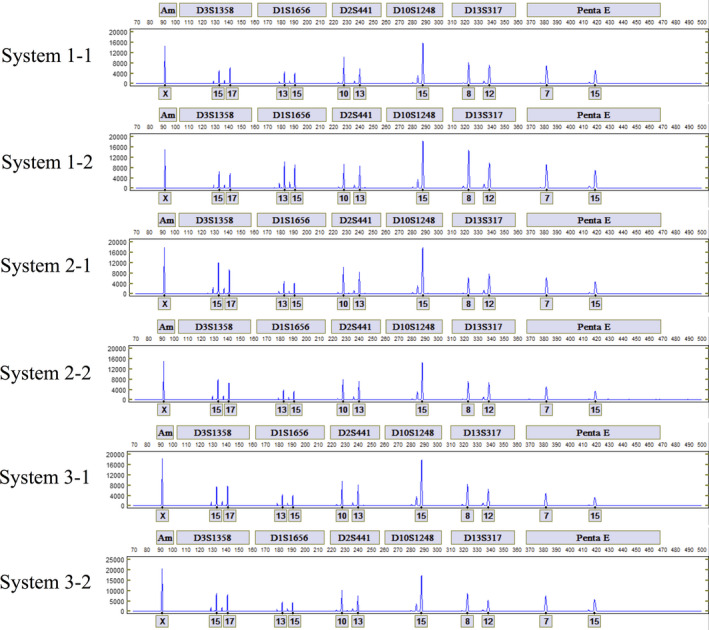
Comparison of the alleles in the Fluorescein (FAM) channel for duplicate samples of 2 × 3 mm Easicollect donor (−1 and −2) on each of three ANDE 6C instruments (Systems 1–3). [Color figure can be viewed at wileyonlinelibrary.com]
Mixtures
The ANDE 6C Expert System was designed to identify and flag profiles representing mixtures from two or more contributors. Profiles are flagged as a mixture for analyst review if either (i) at least two loci with three alleles or (ii) at least one locus with four or more alleles is present. In two‐person mixtures with a minor contributor of <20%, the system will call the major contributor. Results from the mixture study showed that only alleles from the major contributor (DNA input ratios of 19:1 (95 ng:5 ng) and 1:19 (5 ng:95 ng) were called as indicated in gray boxes, and all called alleles were concordant with conventional laboratory typing results. Mixed DNA samples with ratios 1:1 (50 ng:50 ng); 1:5 (16.7 ng:83.3 ng); and 5:1 (83.3 ng:16.7 ng) were flagged for analyst review. Representative profiles from 2‐person mixtures at varying contributor DNA ratios are shown in Fig. 4.
Figure 4.

Representative STR profiles from DNA mixtures with contributor ratios of 19:1 (a), 5:1 (b), 1:1 (c), 1:5 (d), and 1:19 (e). [Color figure can be viewed at wileyonlinelibrary.com]
Precision and Concordance
The fragment size deviation for each allele in the allelic ladder was calculated for all passing ladders in the accuracy study. Inter‐run precision is defined as the ability of the system to reproducibly size peaks from run‐to‐run and to accurately call alleles. Precision is defined as the standard deviation of fragment sizes of the alleles in the allelic ladder sample. For correct sizing, sample alleles must fall within a 0.5 base pair window (or bin) of the size of the corresponding allele on the allelic ladder. Confidence that a system is capable of correct sizing is demonstrated when the standard deviation in sizing is ≤0.5 bases at three standard deviations or a single standard deviation of ≤0.16 bases. Inter‐run precision was calculated for 783 runs across 11 instruments. The standard deviation in bases was calculated for each allele and ranged from 0.010 at D7S820 5 to 0.078 at Penta E 25. The variation at three standard deviations ranged from 0.03 to 0.23 bases and is well below the acceptable target value of 0.5 bases (Fig. 5).
Figure 5.

Sizing variation at a single standard deviation for each allele in the allelic ladder calculated for 783 runs on 11 ANDE instruments. [Color figure can be viewed at wileyonlinelibrary.com]
The accuracy of the ANDE system was evaluated by generating profiles for 1299 unique individuals across 17 sample classes. A sample was classified as passing if it generated calls for 16 or more CODIS core loci. First pass and final success rates were calculated from these samples, all processed using the ANDE Expert System. First pass success was defined as a sample that was successful on the first attempt and ranged from 82.4% (semen stain) to 100.0% (blood on cotton). When a sample failed on the first attempt, it was repeated using the same sample collection protocol (and preprocessing protocol as appropriate), and the final success was defined as the percentage of samples that passed on either the first or second attempt. Final success ranged from 85.0% (chewing gum) to 100.0% (blood on cotton and blood on denim). Across all sample types, first pass success was 90.8% CODIS and 92.5% FlexPlex27 and final success was 98.8% CODIS and 99.2% FlexPlex27. Sixteen samples (1.2%) required a third run: low signal, likely related to sample collection was observed in 13 samples, high signal in one sample, and chip‐related issues, typically a channel malformation introduced during the manufacturing process, in two samples. Note that the Lane Success Icons (discussed in “Expert System” above) provide guidance to the user for subsequent collections. Table 2 shows the results of the Accuracy and Concordance analyses.
Table 2.
Success rates for the 1299 samples processed by Rapid DNA in the Accuracy and Concordance Study.
| Sample Types | Samples Assessed | First Pass Success* (CODIS20) | Second Pass Success† (CODIS20) | First Pass Success* (FlexPlex27) | Second Pass Success† (FlexPlex27) | ||||
|---|---|---|---|---|---|---|---|---|---|
| # of Passing Samples | % Passing | # of Passing Samples | % Passing | # of Passing Samples | % Passing | # of Passing Samples | % Passing | ||
| Dried blood | 501 | 457 | 91.2% | 500 | 99.8% | 466 | 93.0% | 500 | 99.8% |
| Blood on FTA paper | 201 | 183 | 91.0% | 200 | 99.5% | 185 | 92.0% | 200 | 99.5% |
| Blood on cotton | 8 | 8 | 100.0% | 8 | 100.0% | 8 | 100.0% | 8 | 100.0% |
| Blood on denim | 10 | 9 | 90.0% | 10 | 100.0% | 9 | 90.0% | 10 | 100.0% |
| Blood on knife | 17 | 14 | 82.4% | 15 | 88.2% | 17 | 100.0% | 17 | 100.0% |
| Oral epithelial samples from drinking containers | 100 | 87 | 87.0% | 100 | 100.0% | 89 | 89.0% | 100 | 100.0% |
| Saliva on non‐FTA paper | 150 | 139 | 92.7% | 150 | 100.0% | 141 | 94.0% | 150 | 100.0% |
| Saliva on FTA paper | 103 | 94 | 91.3% | 100 | 97.1% | 97 | 94.2% | 101 | 98.1% |
| Chewing gum | 40 | 34 | 85.0% | 34 | 85.0% | 35 | 87.5% | 35 | 87.5% |
| Semen | 51 | 43 | 84.3% | 50 | 98.0% | 43 | 84.3% | 50 | 98.0% |
| Semen stains | 17 | 14 | 82.4% | 16 | 94.1% | 14 | 82.4% | 17 | 100.0% |
| DVI samples (bone, brain, liver, lung, muscle, and tooth) | 101 | 97 | 96.0% | 100 | 99.0% | 98 | 97.0% | 100 | 99.0% |
| Total | 1299 | 1179 | 90.8% | 1283 | 98.8% | 1202 | 92.5% | 1288 | 99.2% |
First Pass Success is defined as the percentage of samples that generated an STR profile with at least 16 CODIS loci or FlexPlex27 loci on the first run. Samples that generated less than 16 loci were run a second time.
Second Pass Success is defined as the percentage of samples that generated an STR profile with at least 16 CODIS or FlexPlex27 loci on the first or second run. Note that 16 samples (0.8%) did not generate passing profiles following two Rapid DNA runs.
Concordance was evaluated for all 1299 STR profiles generated in the accuracy set as compared to the corresponding profiles generated by conventional laboratory processing. Results of this analysis are shown in Table 3, with allelic concordance of 99.996% and 99.981% for the CODIS 20 and FlexPlex 27 loci, respectively. For the CODIS loci, one dropout (D10S1248 15) and one drop‐in (D12S391 19) were observed. For the FlexPlex loci, 11 dropouts (5 in Penta E, 3 in SE33, 2 in D6S1043, and one in D10S1248 as noted above) and one drop‐in (in D12S391 as noted above) were observed. Four samples with interesting profiles were observed: one with a tri‐allelic TPOX 9, 10, 11 and three with rare alleles at SE33 (6.2; two instances) and D6S1043 (13.3). Loci with tri‐alleles are labelled in red warning boxes and, as such, are excluded from the .xml and allele table outputs. Rare alleles are not labelled the first time they are observed. When they are detected, they are subjected to sequencing; once verified, a software upgrade allows the rare alleles to be called by the Expert System.
Table 3.
Summary of concordance analysis for 1299 samples in the Accuracy and Concordance Study.
| Metric | CODIS Core Loci | Flex Plex Loci | ||
|---|---|---|---|---|
| No. | % | No. | % | |
| Samples assessed for concordance | 1299 | 1299 | ||
| Concordant samples | 1297 | 99.85% | 1287 | 99.08% |
| Alleles assessed for concordance | 51,469 | 64,349 | ||
| Concordant alleles | 51,467 | 99.996% | 64,337 | 99.981% |
| Discordant alleles | ||||
| Drop‐in | 1 | 0.002% | 1 | 0.002% |
| Drop‐out | 1 | 0.002% | 11 | 0.017% |
Signal strength, peak height ratio, iNTA, and stutter were calculated for all 1299 samples in the accuracy study. Signal strength of autosomal loci was determined by summing the signal strengths for all called peaks in each locus and dividing by two. Signal strength of hemizygous loci was defined as the peak height of the called allele. The peak height analysis of all samples is shown in Fig. 6. The average peak heights range from 7175 ± 5586 RFU (average ± 1 SD, as presented in Figures for all calculations) at Penta E to 41,248 ± 60,560 RFU at TH01. The peak height ratio was calculated as the signal strength of the weaker peak divided by the signal strength of the stronger peak and the average per locus PHR results ranged from 0.653 ± 0.206 at SE33 to 0.844 ± 0.119 at Amelogenin (Fig. 7). Nontemplated nucleotide addition was calculated as the ratio of the peak heights of the minor peak (one base smaller than the called allele) divided by the peak height of the called allele. Minor peaks were required to have a peak height of 235 RFU or greater to be included in the calculation. No iNTA was observed at D10S1248, D13S317, Penta E, D2S1338, CSF1PO, D6S1043, D7S820, D5S818, or TPOX. For loci where iNTA was observed, the iNTA varied from 0.090 ± 0.025 at D2S441 to 0.262 ± 0.209 at Amelogenin (Fig. 8). The stutter at each locus was determined by calculating the ratio of the peak height of the minor stutter peak divided by the peak height of the called allele. Here, the minor stutter peak was identified as the peak three bases smaller than the called allele for trinucleotide loci, four bases smaller than the called allele for tetranucleotide loci, or five bases smaller than the called alleles for pentanucleotide loci. The stutter peaks were included if they had a peak height that was equal to or greater than the stochastic threshold (235 RFU). Average per locus stutter varied from 0.019 ± 0.018 at TH01 to 0.057 ± 0.029) at D22S1045 (Fig. 9). With a stochastic threshold of 235 RFU and highest detectable peak of over 200,000 RFU, the wide dynamic range of the system is well‐suited for processing of samples without quantitation. Taken together, the signal strength, PHR, iNTA, and stutter results demonstrate that both the FlexPlex assay and Expert System are appropriate for the automated generation and interpretation of STR profiles from a wide range of casework samples.
Figure 6.

Signal strength analysis. Signal strength of autosomal loci for all 1299 samples in the accuracy study was determined by summing the signal strengths for all called peaks in each locus and dividing by two. Mean peak height was 14,893 ± 20,391 RFU. Signal strength of hemizygous loci was defined as the peak height of the called allele. [Color figure can be viewed at wileyonlinelibrary.com]
Figure 7.

Heterozygous peak height ratio analysis. Average peak height ratio by locus, for autosomal loci for all 1299 samples in the accuracy study, with standard deviation. Mean PHR was 0.787 ± 0.155 (Mean ± SD). Samples with results at a minimum of the 20 CODIS core loci were included in the calculation. [Color figure can be viewed at wileyonlinelibrary.com]
Figure 8.

iNTA ratio analysis. Ratio of incomplete nontemplated nucleotide addition was calculated for all 1299 samples in the accuracy study as the ratio of the peak heights of the minor peak (one base smaller than the called allele) divided by the peak height of the called allele. No iNTA was observed at D10S1248, D13S317, Penta E, D2S1338, CSF1PO, D6S1043, D7S820, D5S818, or TPOX. Mean iNTA was 0.163 ± 0.125 (Mean ± SD). [Color figure can be viewed at wileyonlinelibrary.com]
Figure 9.

Stutter analysis. The stutter at each locus for all 1299 samples in the accuracy study was determined by calculating the ratio of the peak height of the minor stutter peak divided by the peak height of the called allele. The minor stutter peak was identified as the peak three bases smaller than the called alleles for trinucleotide loci, four bases smaller than the called allele for tetranucleotide loci, or five bases smaller than the called allele for pentanucleotide loci. Mean stutter was 0.036 ± 0.024. [Color figure can be viewed at wileyonlinelibrary.com]
Resolution
The ability to resolve two adjacent fragments across the STR sizing range was calculated for all 1299 samples in the accuracy study. Resolution was calculated as described in 18, with R (resolution) values ≥0.2 indicating single base pair resolution. Resolution calculated based on these samples shows that the system is capable of resolving single base differences in fragments across the entire separation range to >500 bases (Fig. 10).
Figure 10.

Resolution analysis. Resolution for all 1200 passing samples in the accuracy study was calculated, with R (resolution) values ≥0.2 indicating single base pair resolution. b = bases. [Color figure can be viewed at wileyonlinelibrary.com]
Contamination
All blanks generated ILS peaks without called alleles and also without alleles labelled in red warning boxes. There was no lane‐to‐lane and no run‐to‐run contamination observed in blank/blank/blank/blank, sample/blank/blank/blank, blank/blank/blank/sample, sample/blank/sample/blank, or blank/sample/blank/sample configurations. All the samples (saliva on non‐FTA paper) generated concordant profiles.
The ANDE Expert System
The ANDE I‐Chip Expert System is based on the NDIS‐approved Expert System for A‐Chips processing buccal swabs. The I‐Chip Expert System generates profiles by processing raw data by sequentially applying rules as shown in Fig. 11 and using the parameters of Table 4. These parameters (described below) were determined empirically based on the analysis of Rapid DNA processing of over 15,000 I‐Chip samples.
Peak Evaluation. The peak evaluation rules identify all peaks in the raw data by evaluating peak height and signal‐to‐noise for all peaks. Peaks that pass are subjected to further analysis using subsequent rules, while peaks that fail are not labelled and are not processed further.
ILS Evaluation. The ILS evaluation rules identify all peaks in the raw data of the WEN dye channel by evaluating heights of all peaks in the channel and searching for the presence of required ILS peaks. ILS that pass are used to size donor peaks and allelic ladder peaks using the Local Southern Method 19. If an ILS peak fails or is missing, the sample itself is failed and results in profiles with peaks that are either not labelled or labelled in red warning boxes. Samples with failed ILS are not subjected to further analysis.
Allelic Ladder Evaluation. The Allelic Ladder evaluation rules identify all peaks in the run Allelic Ladder sample by evaluating peak height, peak height ratio, and peak height balance. The peaks of the run Allelic Ladder are used to generate a set of bins for designating donor peaks. When the run Allelic Ladder fails, the ANDE Expert System automatically applies a preinstalled Allelic Ladder (PAL) to generate the bins. The PAL is an instrument‐specific ladder that is generated and installed on the system during the instrument manufacturing process and is constant for the life of the instrument.
Allele Assignment. Peaks are identified as alleles by comparing them to those in the ANDE Allele Table. Peaks that are present but are not listed in the ANDE Allele Table are not labelled. Relatively infrequently, alleles that have never been reported in the literature will be present in a sample processed in the ANDE system. ANDE performs periodic reviews of observed rare alleles, sequences them for confirmation, and updates the Allele Table.
Locus Evaluation. Each locus is identified as either heterozygous, homozygous, or hemizygous by evaluating peak height, peak height ratio, iNTA ratio, stutter ratio, and peak morphology. Loci that pass are processed further following subsequent rules. Loci that fail are labelled in red warning boxes and are not evaluated further. An example of a locus that fails is one in which two peaks greater than the stochastic threshold are present; however, the peak height ratio is below the heterozygote peak height ratio threshold.
Sample Evaluation. The Sample Evaluation rules evaluate the loci to determine if the low signal protection rules are to be applied, quantify the number of passing loci, and pass or fail the sample. Passing samples are ones that meet the threshold for the minimum number of loci called threshold (typically defined by the user to be CODIS 10–12 but conservatively set at CODIS 16 in this developmental validation study). Failing samples are characterized as either Low signal, High signal, Mixture, or Retake. A set of lane success icons associated with each of the failure modes is used to guide the user in subsequent collection and processing.
Figure 11.

Flow chart of operations performed by the I‐Chip Expert System and the set of rules applied for each step to generate an STR profile. [Color figure can be viewed at wileyonlinelibrary.com]
Table 4.
Parameters settings for the I‐Chip Expert System.
| Parameter | Threshold |
|---|---|
| Analytical threshold | 120 RFU |
| Stochastic threshold | 235 RFU |
| iNTA peak height ratio threshold | 0.14 |
| Stutter peak height ratio threshold | Range from 0.02 to 0.34 |
| Heterozygote peak height ratio | Locus‐dependent and nominally at 0.35 |
| Tri‐allele peak height ratio threshold | A third peak must have a peak height ratio that is at least higher than 0.37 to be considered an allele. |
| Mixture sample | Samples are classified as mixtures when there are at least two loci with three alleles, or at least one locus with four or more alleles. |
The Expert System generates the following outputs:
Allele table listing allele calls for all passing samples
.png file (electropherogram) for rapid output visualization
.xml file for upload to CODIS (only for passing samples)
.fsa file to permit review with conventional software packages
The data generated by the ANDE Expert System is encrypted by the software to the FIPS 197 Advanced Encryption Standard prior to the export and is decrypted using FAIRS software on a standalone computer. The data can be exported from the instrument to the FAIRS computer either using a USB stick or ethernet transfer. When connected by ethernet, the FAIRS software can automatically transfer data from the instrument. The FAIRS software can import and export DNA databases over a wide range of formats and can also perform advanced analysis including search and match, familial searching, and claimed relationship testing.
Additional features of the I‐Chip Expert System include:
Low signal protection algorithm. Samples with low DNA inputs are impacted by stochastic effects during PCR and have a higher likelihood of dropouts at heterozygous loci. The Expert System uses a variety of parameters (including signal strength) to characterize a sample as having low DNA input. When a sample is classified as a low DNA sample, homozygous loci with low signal strengths are labelled in red warning boxes (peaks indicated in red warning boxes in the.png electropherogram output display are not included in the resulting .xml file or allele table). This algorithm protects the profile against dropout.
Number of loci to pass a sample. In the NDIS‐approved A‐Chip Expert System, only samples that have allele calls in the 20 CODIS core loci are passed. In the I‐Chip Expert System, the class of locus (CODIS or Autosomal) and the number of loci that will result in a passing profile is configurable by the SuperAdmin user.
Lane success icons. The I‐Chip Expert System includes the presentation of lane success icons for low signal, high signal, mixtures, and retakes. The retake icon represents samples that have failed because of issues associated with the chip or instrument and not the sample. The lane success icons provide users with additional information to guide repeat sample collection.
Discussion
The goal of this extensive developmental validation study was to obtain, document, analyze, and assess the data from a wide variety of mock crime scene and DVI samples processed in an I‐Chip and generated by the ANDE System and its automated Expert System to determine if the system can reliably genotype in a manner compliant with the FBI’s Databasing Quality Assurance Standards (QAS) and the NDIS Operational Procedures. The results presented herein demonstrate that the ANDE System and Expert System are reliable, reproducible, robust, and suitable for automated processing and interpretation of crime scene and DVI samples. The study is notable in that it is the first to apply QAS databasing validation requirements to a Rapid DNA Expert System for interpretation of crime scene and DVI samples as well as to validate Rapid DNA processing of a broad range of casework and DVI samples.
Whether utilized by law enforcement or laboratory personnel, establishment of appropriate policies and training for sample collection is important. We have consistently trained to and advocated for A‐ and B‐swab collection approaches, wherein an A‐swab or swabs is/are first collected for processing by an accredited forensic laboratory and a B‐swab or swabs is/are then collected for Rapid DNA processing. This approach has recently been recommended by the FBI 20. The strength of this approach is that it empowers law enforcement personnel to focus and accelerate investigations while preserving the laboratories’ ability to perform conventional processing. In fact, this approach has allowed several agencies to solve cases and then use the Rapid DNA results to prioritize conventional sample processing from the same cases. It is possible that differences in biological fluid amounts and proportions and profiling results could potentially exist between the first and second swab; however, these potential differences are essentially the same as those that may occur when the laboratory conventionally tests multiple swabs.
Two issues regarding mixture interpretation impact Rapid DNA Identification. First, the ANDE Expert System identifies but does not resolve mixtures into their constituent components. When mixtures are detected by the automated Expert System, they can be interpreted in the conventional laboratory, just as is the case for laboratory‐derived mixtures. However, there appears to be a benefit of the ANDE system’s ability to identify a mixture quickly. Immediate feedback to evidence collection personnel offers the potential to improve and focus sample collection, a feedback mechanism lost when the samples are processed weeks or months later in the laboratory (when the crime scene is no longer under law enforcement control). Second, the ANDE Expert system ignores minor contributors (e.g. the 19:1 and 1:19 cases described above). In some cases, there is value in having such samples reviewed by forensic analysts as the minor contributor may have probative value.
The QAS requirements for casework samples include quantitation of human DNA. The ANDE system does not perform quantitation, but, taken together, the wide dynamic range of the system in tandem with training of evidence collection personnel led to an excellent first pass success rate of 90.8%. The NIST Organization of Scientific Area Committees for Forensic Science has identified the potential elimination of the human quantification requirement as a research and development need 21. The FBI’s recommendations for non‐CODIS Rapid DNA best practices for law enforcement suggest that agencies 20 “consider quantity, quality, potential mixtures, and sample consumption” but falls short of suggesting human DNA quantitation 20. Although it is possible to perform microfluidic, on‐chip quantitation, it is not clear that human specific quantification would be of practical value when Rapid DNA is utilized in field‐forward applications (e.g. DVI).
Although the ANDE Rapid DNA System has received NDIS approval for buccal swab processing, Rapid DNA systems are not authorized for use on crime scene samples for uploading and/or searching CODIS. The FBI is assessing the possibility of and requirements for Rapid DNA processing of crime scene samples for CODIS upload and search, but the outcome and timing of these deliberations are not certain (and the FBI has never approved an Expert System for casework analysis). In the interim, accredited forensic laboratories can validate Rapid DNA analysis of casework samples for suspect comparison and for searches against copies of SDIS databases and law enforcement agencies can utilize Rapid DNA for suspect comparison and for searching against local DNA databases.
Taken together, the ANDE instrument, I‐Chip consumable, FlexPlex chemistry, and automated Expert System successfully and automatically processed and interpreted 1705 mock crime scene and DVI samples. The extensive developmental validation reported herein supports the utilization of the ANDE Rapid DNA system in law enforcement and DVI applications as well as the validation of the system by accredited forensic laboratories for use in single‐source suspect‐evidence comparisons. Although an FBI pathway to approval of Rapid DNA for upload or search of CODIS is not yet available, this developmental validation data may provide valuable information as local, state, and federal Rapid DNA Identification policies develop and evolve over the coming years. Furthermore, the results support continued use of the ANDE Rapid DNA Identification System in mass casualty events and further expansion into other field‐forward applications 22.
Supporting information
Fig S1 . Plot of average signal strength (RFU) across different time‐points from swab stability study.
Fig S2 . Peak height analysis of inter‐ and intra‐ reproducibility runs for 3µl dried blood (a) and saliva on FTA paper (b). Peak height ratio analysis of inter‐ and intra‐ reproducibility runs for 3µl dried blood (c) and saliva on FTA paper (d).
Acknowledgments
We thank Dr. Ludmila Kaplun for invaluable help with data compilation and analysis, Dr. Ranjana Grover for insightful discussions, and Ann Yabandith, Anna Zolotova, Mark McSheehy, and Richard Gleason for expert technical assistance.
Authors Rosemary S. Turingan, Eugene Tan, Hua Jiang, Jessi Brown, Greice Krautz‐Peterson, and Richard F Selden are employees and shareholders of ANDE Corporation.
[Copyright corrected on 07 April 2020 after initial online publication.]
References
- 1. Carney C, Whitney S, Vaidyanathan J, Persick R, Noel F, Vallone PM, et al. Developmental validation of the ANDE™ Rapid DNA system with FlexPlex™ assay for arrestee and reference buccal swab processing and database searching. Forensic Sci Int Genet 2019;40:120–30. [DOI] [PubMed] [Google Scholar]
- 2. Della Manna A, Nye JV, Carney C, Hammons JS, Mann M, Al Shamali F, et al. Developmental validation of the DNAscan™ rapid DNA analysis™ instrument and expert system for reference sample processing. Forensic Sci Int: Genet 2016;25:145–56. [DOI] [PubMed] [Google Scholar]
- 3. Congress.gov . H.R.510 – Rapid DNA Act of 2017; 2017. https://www.congress.gov/bill/115th-congress/house-bill/510 (accessed December 31, 2019).
- 4. The Washington Post . Homeland Security to test DNA of families at border in cases of suspected fraud; 2019. https://www.washingtonpost.com/immigration/homeland-security-to-test-dna-of-families-at-border-in-cases-of-suspected-fraud/2019/05/01/8e8c042a-6c46-11e9-a66d-a82d3f3d96d5_story.html?utm_term=.b4611915101f (accessed May 1, 2019).
- 5. Kentucky State Police . Kentucky first in nation to adopt Rapid DNA for sexual assault investigations; 2019. https://kentuckystatepolice.org/hq-4-10-19/ (accessed April 10, 2019).
- 6. CBS News, 60 Minutes . Paradise lost: inside California’s campfire; 2018. https://www.cbsnews.com/news/paradise-lost-inside-california-camp-fire-60-minutes/ (accessed December 2, 2018).
- 7. The New York Post . Officials used ‘Rapid DNA’ tech to identify California boat fire victims; 2019. https://nypost.com/2019/09/05/officials-used-rapid-dna-tech-to-identify-california-boat-fire-victims/ (accessed September 5, 2019).
- 8. FBI.gov . General information, Rapid DNA; 2016. https://www.fbi.gov/services/laboratory/biometric-analysis/codis/rapid-dna-analysis (accessed October 14, 2016).
- 9. FBI.gov . Addendum to quality assurance standards for Rapid DNA; 2014. https://www.fbi.gov/file-repository/addendum-to-qas-for-rapid-dna.pdf/view (accessed December 1, 2014).
- 10. FBI.gov . National DNA Index System (NDIS) operational procedures manual; 2019. https://www.fbi.gov/file-repository/ndis-operational-procedures-manual.pdf/view (accessed May 1, 2019).
- 11. Tan E, Turingan RS, Hogan C, Vasantgadkar S, Palombo L, Schumm JW, et al. Fully integrated, fully automated generation of short tandem repeat profiles. Investig Genet 2013;4(1):16. [DOI] [PMC free article] [PubMed] [Google Scholar]
- 12. Grover R, Jiang H, Turingan RS, French JL, Tan E, Selden RF. FlexPlex27—highly multiplexed rapid DNA identification for law enforcement, kinship, and military applications. I Int J Legal Med 2017;131(6):1489–501. [DOI] [PMC free article] [PubMed] [Google Scholar]
- 13. Turingan RS, Vasantgadkar S, Palombo L, Hogan C, Jiang H, Tan E, et al. Rapid DNA analysis for automated processing and interpretation of low DNA content samples. Investig Genet 2016;7(1):2. [DOI] [PMC free article] [PubMed] [Google Scholar]
- 14. Boom R, Sol CJ, Salimans MM, Jansen CL, Wertheim‐van Dillen PM, van der Noordaa J. Rapid and simple method for purification of nucleic acids. J Clin Microbiol 1990;28(3):495–503. [DOI] [PMC free article] [PubMed] [Google Scholar]
- 15. Turingan RS, Brown J, Kaplun L, Smith J, Watson J, Boyd DA, et al. Identification of human remains using Rapid DNA analysis. Int J Legal Med 2019. 10.1007/s00414-019-02186-y [DOI] [PMC free article] [PubMed] [Google Scholar]
- 16. Sidstedt M, Steffen CR, Kiesler KM, Vallone PM, Rådström P, Hedman J. The impact of common PCR inhibitors on forensic MPS analysis. Forensic Sci Int Genet 2019;40:182–91. [DOI] [PubMed] [Google Scholar]
- 17. Hu Q, Liu Y, Yi S, Huang D. A comparison of four methods for PCR inhibitor removal. Forensic Sci Int Genet 2015;16:94–7. [DOI] [PubMed] [Google Scholar]
- 18. Luckey JA, Norris TB, Smith LM. Analysis of resolution in DNA sequencing by capillary gel electrophoresis. J Phys Chem 1993;97(12):3067–75. [Google Scholar]
- 19. Southern E. Measurement of DNA length by gel electrophoresis. Anal Biochem 1979;100(2):319–23. [DOI] [PubMed] [Google Scholar]
- 20. FBI.gov . Non‐CODIS Rapid DNA considerations and best practices for law enforcement use; 2019. https://www.fbi.gov/file-repository/non-codis-rapid-dna-best-practices-092419.pdf/view (accessed September 24, 2019).
- 21. NIST.gov . OSAC research needs assessment form; 2015. https://www.nist.gov/system/files/documents/forensics/osac/FRS-Research-Need-Assessment-of-Features.pdf (accessed October 29, 2015).
- 22. Washington Examiner . DNA tests reveal 30% of suspected fraudulent migrant families were unrelated; 2019. https://www.washingtonexaminer.com/policy/defense-national-security/dna-tests-reveal-30-of-suspected-fraudulent-migrant-families-were-unrelated (accessed October 5, 2019).
Associated Data
This section collects any data citations, data availability statements, or supplementary materials included in this article.
Supplementary Materials
Fig S1 . Plot of average signal strength (RFU) across different time‐points from swab stability study.
Fig S2 . Peak height analysis of inter‐ and intra‐ reproducibility runs for 3µl dried blood (a) and saliva on FTA paper (b). Peak height ratio analysis of inter‐ and intra‐ reproducibility runs for 3µl dried blood (c) and saliva on FTA paper (d).