Abstract
The amino‐terminal copper and nickel/N‐terminal site (ATCUN/NTS) present in proteins and bioactive peptides exhibits high affinity towards CuII ions and have been implicated in human copper physiology. Little is known, however, about the rate and exact mechanism of formation of such complexes. We used the stopped‐flow and microsecond freeze‐hyperquenching (MHQ) techniques supported by steady‐state spectroscopic and electrochemical data to demonstrate the formation of partially coordinated intermediate CuII complexes formed by glycyl–glycyl–histidine (GGH) peptide, the simplest ATCUN/NTS model. One of these novel intermediates, characterized by two‐nitrogen coordination, t 1/2≈100 ms at pH 6.0 and the ability to maintain the CuII/CuI redox pair is the best candidate for the long‐sought reactive species in extracellular copper transport.
Keywords: amino-terminal copper and nickel (ATCUN) motif, copper, electrochemistry, EPR spectroscopy, peptides
ATCUN/NTS motifs participate in physiological CuII exchange. Using kinetic methods, spectroscopy, and electrochemistry, it was demonstrated that CuII binding to GGH, an ATCUN/NTS representative, proceeds via partially coordinated species. The 2N‐coordinated complex with t 1/2≈100 ms (pH 6.0) and CuII/CuI redox activity is the long‐sought reactive intermediate for extracellular copper delivery.

Alterations of exchangeable CuII in blood have been implicated in a number of severe human diseases including diabetes, cancer, and Alzheimer's disease.1 Some human proteins involved in these processes contain the metal‐binding ATCUN/NTS motifs (amino‐terminal copper and nickel/N‐terminal site), tripeptide sequences containing a free amine at the N‐terminus, any amino acid residue in position 2, and a His residue in position 3. In addition to CuII ions, NiII, PdII, and AuIII can bind to ATCUN/NTS in a specific manner, forming square planar four‐nitrogen (4N) complexes with the terminal amine, two intervening peptide bond nitrogen atoms and the imidazole N3 nitrogen coordinated. These structures were documented by X‐ray crystallography,2, 3 EXAFS,3, 4, 5 NMR,6 and numerous spectroscopic studies, as reviewed recently.7 The Asp–Ala–His motif in human serum albumin (HSA) and analogous motifs in other albumins transport CuII in blood serum,8 and are thought to deliver it to another ATCUN/NTS motif present in the extracellular domain of Ctr1 cellular copper transporters of many species (Met–Asp–His in human Ctr1, hCtr1).9 Molecular aspects of this process remain to be elucidated. A direct non‐redox, but rather sluggish transfer (t 1/2≈16 min) was recently demonstrated in vitro using HSA and a 14‐peptide model of hCtr1 N‐terminus.5 On the other hand, the rates of such CuII transfers from 4N complexes to stronger ligands could be accelerated by weakly chelating agents, which did not participate significantly in the CuII equilibrium, for example, the CuII transfer from the CuIIAβ4‐16 complex to EDTA, accelerated by glutamate addition.10, 11 The 4N CuII complexes cannot be reduced electrochemically to the corresponding CuI species. They can be oxidized to CuIII only at high potentials around 1 V,3, 11, 12 but in an apparent contradiction with this fact, these 4N complexes were demonstrated recently to generate reactive oxygen species (ROS) under physiologically relevant conditions via an unidentified CuI species.13 These pieces of evidence, taken together, suggest the existence of distinct intermediate complex(es) responsible for kinetic and redox properties of nominally 4N ATCUN/NTS CuII complexes.
Gly–Gly–His (GGH) is the simplest ATCUN/NTS peptide, also used as CuII chelator in practical applications, for example, enhancing the efficacy of antimicrobial peptides,14 and copper sensing.15 Herein, we present the stopped‐flow and microsecond timescale freeze hyperquenching (MHQ)16 data combined with UV/Visible and EPR spectroscopic and electrochemical evidence for transient CuII/GGH complexes that have been unnoticed before. These results explain the reactivity of ATCUN/NTS complexes and their contribution to biological CuII transport.
We first studied the reaction of GGH with CuCl2 at pH 6.0 using a stopped‐flow system coupled with a diode‐array detector working in the 750–300 nm range. This pH value was chosen to assure complete formation of the 4N complex, limit the formation of poorly soluble Cu(OH)2, and allowed us to use a buffer that does not coordinate CuII ions.17 All these needs were fulfilled by using 2‐(N‐morpholino)ethanesulfonic acid (MES), with a pK a of 6.15.18 The obtained spectra (Figure 1) show the increase in time of the d–d band, λ max (ϵ)=525 nm (102 m −1 cm−1), characteristic of the 4N complex.7, 19, 20, 21, 22, 23 This effect is coupled by an isosbestic point at 620 nm to the depletion of the initial band, λ max (ϵ)=705 nm (48). The latter band was present at its maximum intensity already in the first recorded spectrum after circa 2 ms of the reaction initiation. The formation of the 525 nm band, which was identical to that of the 4N complex of GGH published recently,21 was completed within 1 s.
Figure 1.
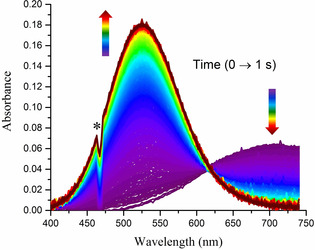
Typical diode‐array stopped‐flow experiment for 2 mm GGH peptide and 1.6 mm CuCl2 (final concentrations). *Spectrophotometer lamp artefact.
The 705 nm band at the start of the experiment, which was observed instead of the expected Cu2+ aqua ion band, λ max=816 nm, (Figure S1 in the Supporting Information) provides direct evidence for the rapid formation within the dead time of the stopped‐flow instrument of an intermediate CuII complex (IC), not reported previously. MES does not form CuII complexes17, 18 and is thus not responsible for the 705 nm band, as confirmed in Figure S1. The reference data for 1N, 2N, 3N, and 4N complexes of oligopeptides, collected in the Supporting Information Table S1, indicate that the 705 nm band could originate in a complex containing the CuII coordination to the Nim + NH2 donor set. Otherwise the participation of a deprotonated peptide nitrogen (N−) instead of either Nim or NH2 would blueshift the d–d band to around 650 nm. The same result is obtained using the empirical equation derived by Sigel and Martin [Eq. (S1)].22
Further insight into the character of IC was obtained from the pH dependence of CuII binding to GGH provided by previously published potentiometric titrations.21 The main 4N species present above pH 4 is described by stoichiometric formula CuH−1L and CuH−2L, depending on the carboxyl protonation state (pK a=4.68). The negative hydrogen ion index denotes the CuII‐assisted removal of Gly and His peptide nitrogen protons (see the Supporting Information Table S2 for the relationship between overall CuII/GGH complex stoichiometries and their coordination modes). The presence of partially coordinated CuII/GGH complexes in addition to the 4N complex has not been clarified by previous potentiometric studies,19, 20 but in a recent study the CuHL complex was identified at pH 3.5–5.0, and it was assigned to 2N coordination.21 The protonation stoichiometry of this complex supports the macro‐chelate structure involving the Nim + NH2 donor set (see Table S2 for details).
The participation of a 2N complex in the coordination equilibrium was verified by performing the UV/Vis spectroscopic pH titration of CuII/GGH at the CuII concentration of 4.5 mm, five times higher than was used in the previous study.21 A specific absorption band around 700 nm was now clearly observed at pH 4.2–4.7 (Figure 2 A). This range is consistent with the species distribution calculated using the published data, which has the peak of the 2N form at pH 4.3 (Figure S3 A).21 Next, the UV/Vis spectra were recorded at pH 4.5 for increasing concentrations of CuII/GGH (Figure 2 B). The obtained concentration dependence of a complex absorbing around 700 nm was in agreement with potentiometric results (Figure S3 B), thus verifying the participation of a 2N complex analogous to IC at equilibrium in weakly acidic solutions. The apparent d–d band redshift at lower concentrations was due to its overlap with the Cu2+ aqua ion band at 816 nm (compare Figure S1 and Figure S3 A).
Figure 2.
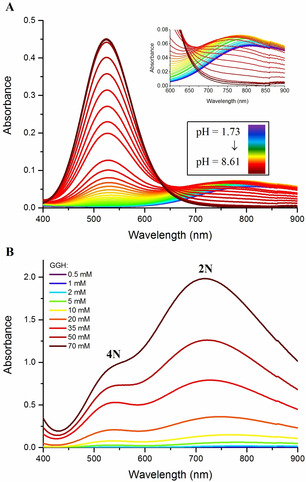
A) UV/Vis pH‐metric titration of 5 mm GGH in the presence of 4.5 mm CuCl2; the spectra are rainbow‐coded from purple (pH 1.73) to red (pH 8.61). The inset expands the 600 to 900 nm range. B) Concentration dependence of the UV/Vis spectra of CuII/GGH complexes at pH 4.5. The GGH concentrations are given on the plot, the GGH/CuII ratio was 1:0.9.
Although the timescale for the 2N IC was determined directly, its formation from the Cu2+ aqua ion occurred within the 2 ms dead time of stopped‐flow experiments. In order to gain qualitative insight into the early phase of reaction we resorted to the MHQ technique. The reactions, performed using the final concentrations of 2.0 mm GGH and 1.6 mm CuII, were quenched at different reaction times between 100 μs and 1 s, (including freezing time) followed by the determination of the composition of rapidly frozen samples by EPR spectroscopy. The selected spectra are presented in Figure 3 (all spectra are given in Figure S7) Four different CuII species were readily detected, the Cu2+ aqua ion at the beginning of the reaction and up to 800 μs, and three different peptide‐bound species. The first, early complex (EC) was present already at 100 and 200 μs and had disappeared by 2 ms; the second transient CuII complex species (IC) was best seen at 2 ms; the third, appearing first at 50 ms was fully dominant at 1 s. The EPR spectral parameters of these complexes are provided in Table S3. The latter two species can be readily identified as 2N and 4N complexes observed by stopped‐flow, respectively, with full agreement of their times of appearance, and further confirmed by control EPR spectra of equilibrium samples at pH 4.5 and 6.0 (Figure S8). The EC can be tentatively assigned a 1 N coordination based on its parameters. The course of the reaction is given in Scheme 1.
Figure 3.
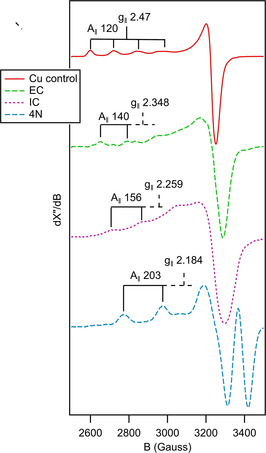
Representative spectra of the different species observed during the MHQ experiment, normalized for maximal signal amplitude. EPR conditions: microwave frequency, 9.405 GHz; 2 mW; modulation frequency, 100 kHz; modulation amplitude, 2.0 mT; temperature, 40 K.
Scheme 1.

The proposed mechanism of CuII reaction with GGH yielding the 4N complex and definitions of accompanying rate constants.
To verify this model, we performed further stopped‐flow experiments at pH 6.0, varying the CuII/GGH ratio from 0.3 to 0.9. The obtained time‐resolved spectra were analyzed using singular value decomposition (SVD). The formation of the 4N complex from IC was observed between 2 ms and 1 s, with k on3=6.674±0.003 s−1 for the CuII/GGH ratio of 0.9, increasing linearly by circa 2 s−1 up to the ratio of 0.3 (Figure S2 B). To find the reason for this dependence on the CuII concentration, we carefully investigated the obtained spectra. The molar fraction of CuII bound in 2N species at the beginning of observation was less than 1 (Figure S4) in the whole CuII concentration range, as determined from spectral intensities at 705 nm. This finding contributes to the explanation of the observed reaction slowdown at low GGH excess. The reaction endpoint was the complete formation of the 4N complex, in accordance with the equilibrium experiments (Figure S3). Therefore, some CuII/EC, present at the beginning of observation, ought to form the IC and then 4N during the observation period. The overall reaction of IC formation includes the 2nd order step, which is the EC formation. It will be thus accelerated by GGH excess, as observed through the 4N complex formation rate.
The value of k off3 could not be determined from kinetic experiments, but instead, it can be estimated from the equilibrium condition at pH 6, in which the concentration ratio of 4N to 2N complexes ([CuH−1L] + [CuH−2L])/[CuHL] is circa 2600 (see Figure S3A). This yields the k off3 value of 2.6×10⁻³ s−1 for the CuII/GGH ratio of 0.9. The reconstructed spectra of individual complexes obtained from the SVD analysis agree well with the spectra of 2N and 4N complexes obtained directly at the beginning and the end of reaction with the maxima at 703±2 nm and 527±2 nm, respectively (see Figure S2 A).
As discussed above, both the IC observed transiently at pH 6.0 and the CuHL complex contributing to equilibrium at lower pH values have the (Nim + NH2) 2N coordination. These two groups can, however, be arranged around the CuII ion in two general configurations, 2 N‐cis and 2 N‐trans. A cis/trans equilibrium was demonstrated in temperature‐dependent studies of the 2N Cu(Gly)2 complex.24 In the discussed complex two cis conformers are possible, with the peptide chain around or away from the CuII (2 N‐cis(endo) and cis(exo) in Scheme 2). All three proposed 2N isomers should be easily formed from the EC (assumed to be 1N), but only the 2 N‐cis(endo) conformer appears to be sterically suited for the concerted attack of the CuII ion on the peptide nitrogens, to yield the thermodynamically stable 4N complex. Other conformers can also be formed, for example, involving a CuII−Nπ bond.
Scheme 2.
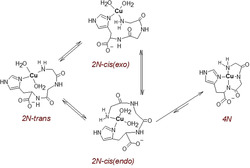
Proposed structures of three putative 2N Cu(GGH) isomers and the pathway towards the 4N Cu(GGH) complex.
As a proof of concept for the cis/trans equilibrium we investigated the temperature dependence of absorption spectra for 20 mm GGH and 18 mm CuII at pH 4.5 (Figure S6). Between 5 °C and 45 °C, we observed the increase of intensity of the 4N complex, present as a minor species, probably due to a shift of 2N/4N equilibrium. More importantly, however, the other band, initially at 743 nm at 5 °C increased and redshifted systematically by up to circa 8 nm at 45 °C. A simple shift of Cu2+/2N equilibrium would cause either a band increase and blueshift (more 2N) or a band decrease and redshift (more free Cu2+). Hence, the band increase and redshift was likely caused by a change of the 2N chromophore akin to that observed in Cu(Gly)2, indicating a cis/trans equilibrium in the 2N Cu(GGH) complex.
The nitrogen ligand rearrangements between the hypothetical 2N species proposed in Scheme 2 require breaking and re‐forming of Cu−N bonds, posing high activation energy barriers between them. The 2 N‐cis(endo) conformer yielding the 4N complex is particularly sterically crowded, and hence likely to be the least stable, least populated local minimum in the energy landscape for CuII binding to GGH. We propose that this feature is responsible for the kinetic stability of IC.
Further evidence for the above mechanism can be obtained from preliminary stopped‐flow experiments ran at higher pH values. The kinetic traces at 525 and 704 nm obtained in HEPES at pH 7.0, 7.4 and 8.0 are compared with the reaction at pH 6.0 in MES in Figure S5. The rearrangement of 2N IC into 4N is only slightly accelerated with the increased pH. In the only previous study of dissociation kinetics of CuII/GGH, the formation of a hypothetical 3N rather than 2N species was proposed as rate‐limiting, with the protonation of the amide nitrogen as key event.25 We have directly identified the conversion of the 2N to 4N complex as rate limiting. The data in Figure S5 show that the protonation of amide nitrogen atoms has only a secondary contribution to the observed rates because the 2N complex decay and 4N complex formation rates increase merely about two‐fold vs. the 100‐fold [H+] decrease over the tested pH range. This observation is compatible with the rearrangement of the 2N species as rate limiting, as this process (Scheme 2) has no net proton dependence. Otherwise, a very strong quadratic rate dependence on pH would be expected.
Figure 4 presents a cyclic voltammogram (CV) for CuII/GGH recorded at pH 5, exhibiting a quasi‐reversible CuI/CuII redox couple with the reduction peak at −0.034±0.003 V and the oxidation peak at 0.056±0.002 V. The 2N form of CuII/GGH could be electrochemically determined only in a carefully selected range of potentials and under excess of peptide over CuII ions. This is due to the fact that even a small amount of non‐complexed Cu2+ ions present in solution strongly interferes with the electrochemical response of CuII/GGH complexes, by generating a typical adsorption peak of two‐electron Cu2+ reduction and Cu0 deposition on the electrode surface (Figure S9). The CuI/CuII redox couple was not identified on a CV curve registered at pH 7.4, while sweeping the potential in the negative direction (from the initial value, E in=0.5 V). As expected, an irreversible oxidation peak attributed to a reactive CuIII species was detected at 0.774±0.004 V (pH 5.0) and 0.798±0.002 V (pH 7.4) (Figure S10).7, 12, 26 The irreversibility of the CuII/CuIII redox process can be explained by rapid oxygen‐induced decarboxylation followed by hydroxylation at the carboxyl end of CuII‐complexed GGH, occuring via a CuIII intermediate.27 The electrochemical behavior of CuII/GGH at pH 7.4 confirms the predominance of the 4N complex indicated by equilibrium species distribution.
Figure 4.
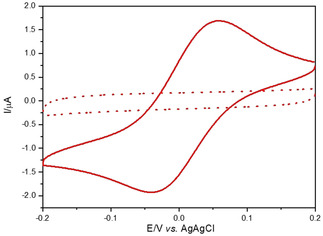
Solid line: the CuI/CuII electrochemical couple generated by the 2N CuII(GGH) complex, recorded for 0.45 mm CuII, 1 mm GGH, in 100 mm KNO3/HNO3, pH 5.0. Dashed line: 1 mm GGH alone under the same conditions.
The electrochemical competence of the 2N complex is in a perfect match with the recent mass spectrometry study which proposed the Nim + NH2 coordination for the CuI ion bound to the ATCUN/NTS motif.28 DFT calculations indicated the 2N‐trans structure for the CuI complex. Therefore, it is plausible to suggest that the temperature‐dependent cis/trans equilibration in the CuII complex might be responsible for the observed properties of the electrochemical process. A similar phenomenon was recently demonstrated for the ROS generating CuI/CuII redox couple of Alzheimer's Aβ1‐16 model peptide.29 Indeed, the detection of the CuI/CuII redox activity in the GGH complex explains the recently reported inhibition of slow ascorbate‐induced ROS production by 4N CuII complexes of DAHK, KGHK, and FRHD‐NH2 peptides specifically by CuI chelators.13 More generally, it explains how some ATCUN/NTS complexes are redox active towards mild electron donors/acceptors, such as ascorbate/H2O2, despite the electrochemical studies reporting only the (often irreversible) CuII/CuIII process at potentials around 0.8 V vs. Ag/AgCl, possibly too high to be physiologically relevant.12, 26 The ROS generation may be enabled by even minute amounts of the redox‐active complex still present at physiological pH, as reported for example, for Cu2+ aqua ion.30 Therefore, the relative abundance of the 2N and 4N species under given conditions emerges as key factor in the redox activity of ATCUN/NTS complexes.
The discovery of a long‐lived 2N kinetic intermediate (IC) in the interaction of CuII ions with GGH, a prototypical ATCUN/NTS motif, together with the demonstration of its ability to maintain the redox activity of copper, is a game‐changer in the understanding of the ATCUN/NTS reactivity, and further, of molecular mechanisms of biological copper transport. The time scale of hundreds of milliseconds is sufficient for 2N complexes to engage in interactions with other partners, such as receptors, membrane transporters, enzymes, carrier proteins, and small molecules. This study paves way to studies of kinetic and redox properties of ATCUN/NTS motifs of HSA and hCtr1, aimed at explaining the mechanism of copper delivery to cells.
Conflict of interest
The authors declare no conflict of interest.
Supporting information
As a service to our authors and readers, this journal provides supporting information supplied by the authors. Such materials are peer reviewed and may be re‐organized for online delivery, but are not copy‐edited or typeset. Technical support issues arising from supporting information (other than missing files) should be addressed to the authors.
Supplementary
Acknowledgements
This research was financed by National Science Centre of Poland (NCN) grants no. 2018/29/B/ST4/01634 to W.B. and 2018/31/N/ST5/02556 to R.K. and by Warsaw University of Technology statutory funds. The equipment used at IBB PAS was sponsored, in part, by the Centre for Preclinical Research and Technology (CePT), a project co‐sponsored by the European Regional Development Fund and Innovative Economy, The National Cohesion Strategy of Poland. PLH acknowledges financial support from grant NWO‐CW 711.014.006 from the Council for Chemical Sciences of The Netherlands Organization for Scientific Research.
R. Kotuniak, M. J. F. Strampraad, K. Bossak-Ahmad, U. E. Wawrzyniak, I. Ufnalska, P.-L. Hagedoorn, W. Bal, Angew. Chem. Int. Ed. 2020, 59, 11234.
References
- 1.
- 1a. Squitti R., J. Trace Elem. Med. Biol. 2014, 28, 482; [DOI] [PubMed] [Google Scholar]
- 1b. Lowe J., Taveira-da-Silva R., Hilário-Souza E., IUBMB Life 2017, 69, 255; [DOI] [PubMed] [Google Scholar]
- 1c. Ranjbary A. G., Mehrzad M., Dehghani H., Abdollahi A., Hosseinkhani S., Biol. Trace Elem. Res. 2020, 194, 66. [DOI] [PubMed] [Google Scholar]
- 2.
- 2a. Camerman N., Camerman A., Sarkar B., Can. J. Chem. 1976, 54, 1309; [Google Scholar]
- 2b. Bal W., Djuran M. I., Margerum D. W., Gray E. T., Mazid M. A., Tom R. T., Nieboer E., Sadler P. J., J. Chem. Soc. Chem. Commun. 1994, 113, 1889; [Google Scholar]
- 2c. Best S. L., Chattopadhyay T. K., Djuran M. I., Palmer R. A., Sadler P. J., Sóvágó I., Varnagy K., J. Chem. Soc. Dalton Trans. 1997, 2587. [Google Scholar]
- 3. Hureau C., Eury H., Guillot R., Bijani C., Sayen S., Solari P.-L., Guillon E., Faller P., Dorlet P., Chem. Eur. J. 2011, 17, 10151. [DOI] [PubMed] [Google Scholar]
- 4. Streltsov V. A., Ekanayake R. S. K., Drew S. C., Chantler C. T., Best S. P., Inorg. Chem. 2018, 57, 11422. [DOI] [PubMed] [Google Scholar]
- 5. Stefaniak E., Płonka D., Drew S. C., Bossak-Ahmad K., Haas K. L., Pushie M. J., Faller P., Wezynfeld N. E., Bal W., Metallomics 2018, 10, 1723. [DOI] [PubMed] [Google Scholar]
- 6. Bal W., Chmurny G. N., Hilton B. D., Sadler P. J., Tucker A., J. Am. Chem. Soc. 1996, 118, 4727. [Google Scholar]
- 7. Gonzalez P., Bossak K., Stefaniak E., Hureau C., Raibaut L., Bal W., Faller P., Chem. Eur. J. 2018, 24, 8029. [DOI] [PMC free article] [PubMed] [Google Scholar]
- 8.
- 8a. Peters T. in Advances in Protein Chemistry, Elsevier, 1985, pp. 161–245; [DOI] [PubMed] [Google Scholar]
- 8b. Bal W., Sokołowska M., Kurowska E., Faller P., Biochim. Biophys. Acta Gen. Subj. 2013, 1830, 5444. [DOI] [PubMed] [Google Scholar]
- 9. Haas K. L., Putterman A. B., White D. R., Thiele D. J., Franz K. J., J. Am. Chem. Soc. 2011, 133, 4427. [DOI] [PMC free article] [PubMed] [Google Scholar]
- 10. Santoro A., Wezynfeld N. E., Stefaniak E., Pomorski A., Płonka D., Krężel A., Bal W., Faller P., Chem. Commun. 2018, 54, 12634. [DOI] [PubMed] [Google Scholar]
- 11. Stefaniak E., Bal W., Inorg. Chem. 2019, 58, 13561. [DOI] [PubMed] [Google Scholar]
- 12. Wiloch M. Z., Wawrzyniak U. E., Ufnalska I., Bonna A., Bal W., Drew S. C., Wróblewski W., J. Electrochem. Soc. 2016, 163, G196–G199. [Google Scholar]
- 13. Santoro A., Walke G., Vileno B., Kulkarni P. P., Raibaut L., Faller P., Chem. Commun. 2018, 54, 11945. [DOI] [PubMed] [Google Scholar]
- 14.
- 14a. Libardo M. D. J., Nagella S., Lugo A., Pierce S., Angeles-Boza A. M., Biochem. Biophys. Res. Commun. 2015, 456, 446; [DOI] [PubMed] [Google Scholar]
- 14b. Libardo M. D. J., Gorbatyuk V. Y., Angeles-Boza A. M., ACS Infect. Dis. 2016, 2, 71; [DOI] [PubMed] [Google Scholar]
- 14c. Libardo M. D. J., Bahar A. A., Ma B., Fu R., McCormick L. E., Zhao J., McCallum S. A., Nussinov R., Ren D., Angeles-Boza A. M., et al., FEBS J. 2017, 284, 3662. [DOI] [PMC free article] [PubMed] [Google Scholar]
- 15.
- 15a. Nguyen T. T. K., Tran H. V., Vu T. T., Reisberg S., Noël V., Mattana G., Pham M. C., Piro B., Biosens. Bioelectron. 2019, 127, 118; [DOI] [PubMed] [Google Scholar]
- 15b. Synhaivska O., Mermoud Y., Baghernejad M., Alshanski I., Hurevich M., Yitzchaik S., Wipf M., Calame M., Sensors 2019, 19, 4022. [DOI] [PMC free article] [PubMed] [Google Scholar]
- 16.
- 16a. Wiertz F. G. M., Richter O.-M. H., Cherepanov A. V., MacMillan F., Ludwig B., de Vries S., FEBS Lett. 2004, 575, 127; [DOI] [PubMed] [Google Scholar]
- 16b. Srour B., Strampraad M. J. F., Hagen W. R., Hagedoorn P.-L., J. Inorg. Biochem. 2018, 184, 42. [DOI] [PubMed] [Google Scholar]
- 17. Mash H. E., Chin Y.-P., Sigg L., Hari R., Xue H., Anal. Chem. 2003, 75, 671. [DOI] [PubMed] [Google Scholar]
- 18. Good N. E., Winget G. D., Winter W., Connolly T. N., Izawa S., Singh R. M., Biochemistry 1966, 5, 467. [DOI] [PubMed] [Google Scholar]
- 19. Hay R. W., Hassan M. M., You-Quan C., J. Inorg. Biochem. 1993, 52, 17. [DOI] [PubMed] [Google Scholar]
- 20. Farkas E., Sóvágó I., Kiss T., Gergely A., J. Chem. Soc. Dalton Trans. 1984, 611. [Google Scholar]
- 21. Bossak-Ahmad K., Frączyk T., Bal W., Drew S. C., ChemBioChem 2020, 21, 331. [DOI] [PubMed] [Google Scholar]
- 22. Sigel H., Martin R. B., Chem. Rev. 1982, 82, 385. [Google Scholar]
- 23. Kozłowski H., Bal W., Dyba M., Kowalik-Jankowska T., Coord. Chem. Rev. 1999, 184, 319. [Google Scholar]
- 24. Biswas R., Koley M., World J. Chem. Educ. 2017, 5, 185. [Google Scholar]
- 25. Wong L. F., Cooper J. C., Margerum D. W., J. Am. Chem. Soc. 1976, 98, 7268. [DOI] [PubMed] [Google Scholar]
- 26. Mital M., Wezynfeld N. E., Frączyk T., Wiloch M. Z., Wawrzyniak U. E., Bonna A., Tumpach C., Barnham K. J., Haigh C. L., Bal W., et al., Angew. Chem. Int. Ed. 2015, 54, 10460; [DOI] [PubMed] [Google Scholar]; Angew. Chem. 2015, 127, 10606. [Google Scholar]
- 27. de Meester P., Hodgson D. J., Inorg. Chem. 2002, 41, 440.11800639 [Google Scholar]
- 28. Carlotto S., Bonna A., Bossak-Ahmad K., Bal W., Porchia M., Casarin M., Tisato F., Metallomics 2019, 11, 1800. [DOI] [PubMed] [Google Scholar]
- 29. Cheignon C., Jones M., Atrián-Blasco E., Kieffer I., Faller P., Collin F., Hureau C., Chem. Sci. 2017, 8, 5107. [DOI] [PMC free article] [PubMed] [Google Scholar]
- 30. Mital M., Zawisza I. A., Wiloch M. Z., Wawrzyniak U. E., Kenche V., Wróblewski W., Bal W., Drew S. C., Inorg. Chem. 2016, 55, 7317. [DOI] [PubMed] [Google Scholar]
Associated Data
This section collects any data citations, data availability statements, or supplementary materials included in this article.
Supplementary Materials
As a service to our authors and readers, this journal provides supporting information supplied by the authors. Such materials are peer reviewed and may be re‐organized for online delivery, but are not copy‐edited or typeset. Technical support issues arising from supporting information (other than missing files) should be addressed to the authors.
Supplementary


