

Abstract
Adipose tissue dysregulation in obesity strongly influences systemic metabolic homeostasis and is often linked to insulin resistance (IR). However, the molecular mechanisms underlying adipose tissue dysfunction in obesity are not fully understood. Herein, a proteomic analysis of subcutaneous (SC) and omental (OM) fat from lean subjects and obese individuals with different degrees of insulin sensitivity was performed to identify adipose tissue biomarkers related to obesity‐associated metabolic disease. Our results suggest that dysregulation of both adipose tissue extracellular matrix (ECM) organization and intracellular trafficking processes may be associated with IR in obesity. Thus, abnormal accumulation of the small leucine‐rich proteoglycan, lumican, as observed in SC fat of IR obese individuals, modifies collagen I organization, impairs adipogenesis and activates stress processes [endoplasmic reticulum and oxidative stress] in adipocytes. In OM fat, IR is associated with increased levels of the negative regulator of the Rab family of small GTPases, GDI2, which alters lipid storage in adipocytes by inhibiting insulin‐stimulated binding of the Rab protein, Rab18, to lipid droplets. Together, these results indicate that lumican and GDI2 might play depot‐dependent, pathogenic roles in obesity‐associated IR. Our findings provide novel insights into the differential maladaptive responses of SC and OM adipose tissue linking obesity to IR.
Keywords: 3D culture, adipocytes, extracellular matrix, lipid droplets
Abbreviations
- COL‐I
collagen I
- DCF‐DA
2,7′‐dichlorofluorescein diacetate
- ECM
extracellular matrix
- ER
endoplasmic reticulum
- GDI2
GDP‐dissociation inhibitor 2
- GSS
glutathione synthetase
- HGHI
high concentrations of glucose and high concentrations of insulin
- HFD
high‐fat diet
- IFG
impaired fasting glucose
- ILK
integrin‐linked kinase
- ITB1
integrin beta‐1
- IR
insulin resistance
- LD
lipid droplet
- LDH
lactate dehydrogenase
- NAFLD
nonalcoholic fatty liver disease
- NASH
nonalcoholic steatohepatitis
- NG
normoglycemia
- OM
omental
- PG
proteoglycan
- PLIN
perilipin
- ROS
reactive oxygen species
- SC
subcutaneous
- SLRP
small leucine‐rich proteoglycan
1. INTRODUCTION
Adipose tissue expansion during weight gain requires a well‐balanced adaptive response of both its cellular and extracellular compartments to accommodate calorie excess and to prevent ectopic lipid deposition and lipotoxicity. 1 , 2 Adipose tissue pathological expansion in obesity increases the risk for developing obesity‐associated alterations, including insulin resistance (IR), 3 , 4 yet, our understanding on the pathophysiological processes contributing to the onset and/or progression of IR in obese individuals is still incomplete.
Among the processes affecting the extracellular environment, increased collagen deposition in the extracellular matrix (ECM) and fibrosis are major hallmarks of adipose tissue dysregulation that contribute to obesity‐related metabolic complications. 5 , 6 , 7 , 8 , 9 Collagen distribution and spatial organization are also important determinants of unhealthy adipose tissue expansion. 6 , 7 , 8 Notably, the composition and behavior of the adipose ECM differ between fat depots. 7 , 8 It has also become increasingly apparent that pathogenic fibrosis results from the abnormal accumulation not only of fibrous collagens, but also of nonfibrillar ECM constituents, such as proteoglycans (PGs). 10 , 11 , 12 The largest subfamily of PGs, the small leucine rich proteoglycans (SLRPs), help organize ECM structure by regulating collagen fibril assembly 13 , 14 and have been proposed as potential biomarkers and therapeutic targets in nonalcoholic fatty liver disease (NAFLD) and certain types of cancer. 13 , 14 , 15 Abnormal deposition of various PGs/SRLPs has been demonstrated in the adipose tissue of obese mice and human. 16 , 17 , 18 , 19 In fact, a recent study using transgenic mice over‐expressing or silenced for lumican, a classical SLRP, supported a role for this protein in systemic glucose homeostasis and the development of metabolic complications associated with obesity. 19 However, it is still unknown how lumican may alter ECM organization and adipocyte biology under conditions of increased fat mass.
Another important point of control for preventing lipid spill‐over from the adipose tissue resides in the capacity of adipocytes to store lipids into lipid droplets (LDs), which are nowadays considered as highly regulated, metabolically active organelles. 20 However, little is known about adipocyte LD biology in obese individuals and whether abnormalities in LD function may contribute to metabolic disease. It is accepted that LD dynamics are governed by a myriad of proteins that bind, directly or indirectly, to the LD phospholipid coat. 20 The LD protein coat comprises, among others, proteins related to membrane trafficking and inter‐organelle communication, including members of the Rab family of small GTPases. 20 , 21 The best‐characterized LD‐associated Rab protein, Rab18, binds to adipocyte LDs in response to insulin and β‐adrenergic agonists and regulates tryglyceride accumulation (lipogenesis) and hydrolysis (lipolysis). 22 We have previously shown that Rab18 expression is upregulated in human subcutaneous (SC) and omental (OM) fat in obesity, supporting its participation in the adaptive response of adipocytes to increased fat mass. 22 However, it is still unknown whether binding of Rab18 to LDs is disturbed in the obese adipocyte.
By means of a comparative proteomic study of human adipose tissue, herein, we have identified two proteins, lumican, and the Rab protein regulator, GDI2, with depot‐specific amplified expression in the adipose tissue of IR obese individuals. Molecular and cellular characterization of these proteins demonstrates that they alter normal adipocyte metabolism by inducing cell stress from outside (lumican) or inside (GDI2).
2. MATERIALS AND METHODS
2.1. Subjects and study design
Paired samples of SC and OM adipose tissue were obtained from lean and morbidly obese individuals (BMI > 45 kg/m2) recruited at the Endocrinology and Nutrition Unit of the Hospital Clínico Virgen de la Victoria (Málaga, Spain) and the Lipids and Atherosclerosis Unit of the Reina Sofia University Hospital (Córdoba, Spain).
Medical history, physical examination, and co‐morbidity evaluation was assessed for all subjects (Table 1). Biochemical and hormonal assays were carried out as described. 23 , 24 Obese subjects were stratified into two groups based on the criteria determined by ADA [Normoglycemia (NG): Fasting plasma glucose (FPG) < 100 mg/dL, HbA1c < 5.7%; and impaired fasting glucose (IFG) = 100‐126 mg/dL, HbA1c: 5.7%‐6.4%)]. 25 IFG will be referred to as IR subjects as previously described. 24 The experimental design was approved by the Hospitals Ethical Committees and the informed consent from all volunteers was obtained.
TABLE 1.
Anthropometrical and analytical characteristics of subjects
| Lean (n = 15) | NG (n = 23) | IR (n = 27) | P value ANOVA | |
|---|---|---|---|---|
| Sex (men/women) | 8/7 | 12/11 | 12/15 | |
| Age (years) | 51 ± 3.4 | 38.1 ± 1.7aaa | 42.7 ± 2.1 | <.01 |
| Weight (kg) | 67.8 ± 2.4 | 147.2 ± 6.2aaa | 145.3 ± 4.2aaa | <.001 |
| BMI (kg/m2) | 24.7 ± 0.8 | 52.5 ± 1.7aaa | 51.9 ± 1.3aaa | <.001 |
| Waist circumference (cm) | 89.0 ± 2.3 | 146.4 ± 6.2aaa | 149.4 ± 3.6aaa | <.001 |
| Systolic pressure (mm Hg) | 133.9 ± 5.8 | 124.2 ± 2.8 | 128.0 ± 2.3 | ns |
| Diastolic pressure (mm Hg) | 82.9 ± 4.0 | 75.5 ± 4.2 | 77.2 ± 2.6 | ns |
| Cholesterol (mg/dL) | 207.6 ± 9.8 | 181.1 ± 8.7 | 200.1 ± 8.0 | ns |
| LDL (mg/dL) | 127.0 ± 6.8 | 121.4 ± 8.1 | 126.1 ± 6.3 | ns |
| HDL (mg/dL) | 54.73 ± 3.2 | 38.2 ± 1.7aaa | 39.5 ± 1.8aaa | <.001 |
| Triglycerides (mg/dL) | 104.7 ± 9.2 | 109.6 ± 7.9 | 155.1 ± 14.6a | <.05 |
| Glucose (mg/dL) | 94.0 ± 2.1 | 89.6 ± 1.8 | 110.3 ± 3.3aaa, bbb | <.001 |
| Insulin (mU/L) | 10.4 ± 1.5 | 15.1 ± 1.1 | 24.8 ± 1.7aaa, bbb | <.001 |
| HbA1c (% [mmoL/moL]) | 5.5 (37.1) ± 0.1 (2.1) | 5.6 (37.6) ± 0.1 (0.8) | 6.2 (43.7) ± 0.1(2.2)aa, bb | <.001 |
| HOMA‐IR | 2.5 ± 0.4 | 3.3 ± 0.3 | 6.8 ± 0.5aaa, bbb | <.001 |
Data represent the mean ± SEM P value was analyzed using one‐way analysis of variance (ANOVA) and Tukey’s post hoc test. a P < .05, aa P < .01, aaa P < .001 vs lean subjects; b P < .05, bb P < .01, bbb P < .001 vs NG obese subjects.
Abbreviations: BMI, body mass index; HbA1c, glycated hemoglobin; HDL, high‐density lipoprotein; HOMA‐IR, homeostasis model assessment of insulin resistance; LDL, low‐density lipoprotein.
2.2. 2D culture of 3T3‐L1 adipocytes and experimental treatments
3T3‐L1 cells [American Type Culture Collection (Manassas, VA, USA)] were differentiated into adipocytes as previously described. 22 , 26 Briefly, 3T3‐L1 cells were cultured onto 6‐ or 12‐well plates (3 × 10³ cells/cm2) or glass coverslips (2 × 10³ cells/cm2) in Dulbecco's Modified Eagle Medium (DMEM) supplemented with 10% of newborn calf serum, 4 mM of glutamine, and 1% of antibiotic‐antimycotic solution. At 100% confluence (day 0; D0), cells were incubated in DMEM containing 10% of fetal bovine serum (FBS), 0.5 mM of isobutylmethylxanthine, 0.25 mM of dexamethasone, and 10 μg/mL insulin for 72 hours (D3). Thereafter, the culture medium was replaced by DMEM with 10% of FBS and 10 mg/mL insulin for 72 hours (D6), and then, exchanged by DMEM without insulin. For differentiation studies, cells were collected at D0, D3, D6, and D9.
Differentiated 3T3‐L1 adipocytes (D10) were exposed to insulin (100 nmol/L) for 2 hours and processed for analysis of intracellular GDI2 distribution (see below). For proteomic studies of LDs, differentiated 3T3‐L1 cells were exposed to insulin (100 nmol/L) 4 hours prior to LD isolation by subcellular fractionation (see below).
In another set of experiments, differentiated 3T3‐L1 cells (D9) were exposed to a combination of high glucose (4.5 gr/L) and high insulin (100 nmol/L) concentrations (HGHI) for 24 hours. This in vitro model of hyperglycemia/hyperinsulinemia has been previously shown by us to induce IR in 3T3‐L1 adipocytes. 24 After treatments, cells were processed for confocal microscopy, immunoblotting, and ELISA studies as described below.
For overexpression studies, 3T3‐L1 adipocytes (D6) on 150‐mm Petri dishes were electroporated using either a DsRed or CFP empty vectors or containing the coding sequence of the GDP dissociation inhibitor of Rab proteins, GDI2 (NM_001494; Origene, Madrid, Spain) (DsRed‐GDI2) (50 µg), following our established procedures. 22 , 26 Thereafter, cells were cultured for 48 hours, and then, processed for confocal microscopy and functional studies (see below).
2.3. 3D culture of 3T3‐L1 adipocytes
Undifferentiated 3T3‐L1 cells (105 cells/mL) were mixed with Collagen type I (COL‐I) (Cultrex 3D Culture Matrix Rat Collagen I, Trevigen, Gaithersburg MD, USA) previously neutralized with DMEM containing HEPES (0.24 g/L) to reach a final concentration of 3.6 mg/mL. Cells in the hydrogels were seeded onto 24‐well plates or glass coverslips. The mixture was allowed to gel (2 hours, 37ºC) and differentiation was carried out as indicated for 2D cultures of 3T3‐L1 cells, in the absence (control) or presence of lumican (R&D System, Minneapolis, MN, USA), at 10 or 30 ng/mL. Lumican concentrations were selected based on preliminary experiments and published data on lumican secretion in other cell types. 27 Medium was renewed every three days until day 10, when cells were processed for analysis.
2.4. 2D‐DIGE/MALDI‐TOF‐MS analysis of human adipose tissue samples
Paired OM and SC adipose tissue biopsies 50 mg obtained from men (n = 4 per group and fat depot) were processed for quantitative 2D‐DIGE/MALDI‐TOF‐MS analysis as previously described. 24 , 28 Differentially expressed proteins identified in OM and SC adipose tissue samples from the different groups of subjects were analyzed using the PANTHER database (http://www.pantherdb.org/) for protein classification and analysis of biological processes.
2.5. Subcellular fractionation studies
Isolation of LDs from differentiated 3T3‐L1 adipocytes, exposed to insulin (100 nmol/L, 4 hours) or medium alone, was carried out using sucrose gradients according to previously validated protocols. 22 LD‐containing fractions were processed for qualitative LC‐MS proteomic studies.
Subcellular fractionation was also employed for separation of cytosolic and crude membrane fractions of differentiated 3T3‐L1 adipocytes to evaluate GDI2 intracellular distribution upon exposure to insulin (100 nmol/L, 2 hours). 22 Protein distribution of GDI2, the membrane marker, GM130, and actin were analyzed by immunoblotting using 50 µg of protein from each fraction.
2.6. LC‐MS analysis of LDs isolated from 3T3‐L1 adipocytes
In order to identify the protein repertoire of the LD‐protein coat in adipocytes, a qualitative LC‐MS analysis of LDs isolated from 3T3‐L1 adipocytes, exposed or not to insulin (100 nmol/L, 4 hours), was employed. To be more specific, LD‐enriched extracts were processed for lipid removal using acetone precipitation and digested with trypsin using standard protocols. Proteomic analysis of LDs was performed using a Dionex UltiMate 3000 Nano‐LC system, connected to a linear quadrupole ion trap Orbitrap (LTQ Orbitrap XL) mass spectrometer equipped with a nanoelectrospray ion source (Thermo Fisher Scientific; Sunnyvale, CA, USA). Acquired data were analyzed with Proteome Discoverer 1.4 software (Sequest HT algorithm, Thermo Fisher Scientific). Digestion and LC‐MS/MS analyses were carried out at the Proteomics facility of the University of Córdoba (Spain).
2.7. RNA extraction and Real‐time PCR
Total RNA was isolated from OM and SC adipose tissue samples using the Trizol RNA isolation method (Invitrogen, Carlsbad, CA) and purified with the RNeasy Lipid kit (QIAGEN, Valencia, CA). RNA isolation and purification from 3T3‐L1 cells were performed as described. 22 Real‐time PCR was carried out as previously described 22 , 23 using the primers listed in Supplementary Table 1 (human and mouse genes). Specific signals were normalized by constitutively expressed cyclophilin (human adipose tissue samples), and Hprt and Gapdh (3T3‐L1 cells). All samples were run in duplicate and the average values were calculated.
2.8. Immunoblotting studies
Protein extracts were obtained from additional OM and SC adipose tissue biopsies obtained from men and women, different to those employed for 2D‐DIGE analyses, using our standard protocols. 24 An additional set of adipose tissue samples were employed for isolation of the stromal vascular fraction (SVF) and mature adipocytes following our standard procedures. 24 After extraction, 30 µg of protein/sample were loaded onto 4%‐20% precast sodium dodecyl sulfate polyacrylamide gel electrophoresis gels and transferred to nitrocellulose membranes (Trans‐Blot Turbo Transfer System; Bio‐Rad Laboratories, Hercules, CA, USA). Primary antibodies (Supplementary Table 2) were dispensed overnight (4ºC) and peroxidase‐conjugated secondary antibodies were administered for 1 hours. Immunoreaction was visualized using ECL (Bio‐Rad). Band intensities were evaluated with Fiji software (ImageJ, https://imagej.nih.gov/ij/). Ponceau staining was employed as a loading control.
For immunoblotting studies of 3D cultures, cells were recovered from the COL‐I hydrogels by exposure to collagenase‐I (0.1 mg/mL) (Sigma‐Aldrich, Madrid, Spain) for 1 hours at 37ºC. After centrifugation (13 500 rpm, 10 minutes), the cells were processed using our standard protocols. 24 Proteins in the culture media (500 μL) were extracted by acetone‐methanol precipitation and resuspended in Cell lysis buffer.
Protein content in the samples was quantified by the Bradford method. Samples were processed for immunoblotting as described previously 24 using the antibodies listed in Supplementary Table 2. Immunoblotting was also employed for analysis of subcellular fractions isolated from 3T3‐L1 adipocytes and protein extracts from 3T3‐L1 adipocytes exposed to HGHI.
2.9. Histological studies
These studies were restricted to the obese groups due to the limitations imposed by the size and number of samples that can be obtained from lean individuals. Fresh OM and SC samples from obese subjects were washed in PBS, fixed in 10% of paraformaldehyde (24 hours) and embedded in paraffin as described previously. 29 Sections were stained using Picrosirius red to visualize collagen, and total and pericellular collagen and adipocyte area were measured. 16 , 30 Images were obtained using a DC500 camera coupled to a DM5000B Leica microscopy. Fiji software was used to quantify collagen content (a.u.) and adipocyte area (µm2). Forty‐sixty cells/sample were included in the analysis of four‐six individuals per group.
Histological sections were also processed for detection of lumican by the immunoperoxidase method using a mouse polyclonal antibody (Supplementary Table 2), Vector Elite ABC peroxidase kit (Vector Laboratories), and Nickel‐3,3′‐Diaminobenzidine (Ni‐DAB)/DAB staining as described previously. 26 Quantification of lumican immunostaining was carried out on five random fields/sample from four subjects/group using Fiji software. Negative control slides without primary antibody were included to assess nonspecific staining.
2.10. Fibrillogenesis assays
COL‐I fibril formation was measured as described 31 using protein extracts from OM and SC samples from obese subjects. Briefly, protein extracts (1 mg/mL) were incubated with COL‐I (1 mg/mL) (1:1), deposited in 96‐well plates and allowed to gel (2 hours, 37ºC). The turbidity of the mixture was measured as absorbance at 340 nm (37ºC, 1 hours) in a spectrophotometer (FlexStation3, Molecular Devices, Sunnyvale, CA, USA).
COL‐I fibril formation was also assessed in the absence or presence of lumican. COL‐I solutions (3.6 mg/mL) containing or not lumican (10 and 30 ng/mL) were prepared as described above and turbidity was monitored over 60 minutes.
2.11. ELISA assay
Lumican content in culture media and cell extracts was measured in differentiating 3T3‐L1 cells, and after exposure of 3T3‐L1 adipocytes to HGHI using an ELISA kit (Abcam, Cambridge, UK) according to the manufacturer’s instructions.
2.12. Analysis of the mechanical properties of COL‐I hydrogels
To determine the effect of lumican on the mechanical properties of 3D matrices, the response of the hydrogels to compressive strength was assessed using a twin column Zwick/Roell PrssoLine Z005 testing device (Roell, Germany) fitted with a 10‐N load cell. Total separation at start position was 9 mm and test speed was 10 mm/min. A total of six gels/condition from two independent experiments were examined.
2.13. Scanning electron microscopy studies
Differentiated 3T3‐L1 adipocytes in COL‐I matrices containing or not lumican were processed for scanning electron microscopy to analyze the organization of COL‐I fibrils. Briefly, cultures were fixed with 2% of glutaraldehyde (48 hours, 4ºC), dehydrated, and sputter coated with gold before analysis using a JEOL JSM‐7800 scanning microscope (Electron Microscopy facility, University of Córdoba). Electron micrographs were analyzed with Fiji software using DiameterJ plugin to evaluate fiber thickness and pore size of the 3D gels. Measurements were carried out on 40 micrographs per experimental group that were obtained from two independent experiments.
2.14. Confocal microscopy studies
3T3‐L1 adipocytes in 3D matrices were stained for neutral lipids using Nile Red. Briefly, cells in the coverslips were fixed with 4% of paraformaldehyde, and incubated with Nile Red solution (Sigma‐Aldrich) for 15 minutes. Samples were counterstained with DAPI (Sigma‐Aldrich), and mounted with mounting medium (Dako).
For the analysis of the intracellular distribution of endogenous GDI2, differentiated 3T3‐L1 adipocytes in 2D cultures were exposed to insulin (100 nmol/L, 2 hours) and processed as described 26 , 32 using a mouse anti‐GDI2 antibody (Supplementary Table 2).
To analyze the effect of GDI2 on the distribution of the LD‐associated protein, Rab18, mock‐transfected and DsRed‐GDI2‐expressing 3T3‐L1 adipocytes were fixed (4% of paraformaldehyde, 15 minutes), and double immunostained using an anti‐Rab18 antibody and a mouse polyclonal antibody against the LD constitutive marker, perilipin 1 (PLIN) (Supplementary Table 2). 22 Double immunolabelling for Rab18 and PLIN was also employed to analyze Rab18 association with LDs in adipocytes exposed to HGHI conditions.
Cell preparations were visualized under a LSM710 confocal laser‐scanning microscope (Carl Zeiss, Jena, Germany; Microscopy facility, IMIBIC). Confocal images were processed using the Huygens Essential software package (version 2.4.4; SVI, Hilversum, The Netherlands). For studies in 3D cultures, 30 cells/experimental condition were randomly selected and the average number and size of LDs per cell were quantified using Fiji software. The degree of colocalization in double‐labelling experiments was estimated by determining an overlapping pixel map of different fluorescent channels using the Colocalization Finder plugin for ImageJ and Manders’ coefficient using Imaris software (Bitplane, Zurich, Switzerland).
2.15. Functional studies in 3T3‐L1 adipocytes
Intracellular ROS levels were examined in 3D cultures and in 3T3‐L1 adipocytes expressing DsRed‐GDI2 or DsRed alone using the 2,7′‐dichlorofluorescein diacetate (DCF‐DA) dye (Sigma‐Aldrich). After removal of the culture medium, cells were homogenized using PLB (Promega). The lysates were centrifuged (12 000 g; 5 minutes, 4°C), and supernatants were collected. Protein concentration in the supernatants was evaluated by the bicinchoninic acid technique (BCA protein assay kit, Pierce Biotechnology, Rockford, IL). Supernatants (50 µg) were mixed with 25 µmol/L DCF‐DA and incubated in the dark (37°C, 30 minutes). Fluorescence at 485/535 was measured using a FlexStation3 spectrophotometer. Cell samples from three independent experiments were used for measurement of ROS generation.
Intracellular triacylglycerols and glycerol in culture media as markers of lipogenesis and lipolysis, respectively, were determined in mock‐ and DsRed‐GDI2‐expressing adipocytes as previously described. 22 , 26 An additional set of differentiated 3T3‐L1 adipocytes expressing mock‐ or CFP‐GDI2‐expression vectors were exposed to insulin (100 nmol/L, 5 minutes) for analysis of Akt activation (ie, pAkt/Akt ratio) by immunoblotting.
Cell viability in 3D cell cultures was assessed by the AlamarBlue (Invitrogen) assay according to the manufacturer’s instructions. Cell cytotoxicity was measured as lactate dehydrogenase (LDH) activity (Abcam) according to the manufacturer’s instructions.
2.16. Statistical analysis
Statistical analyses were performed using GraphPad Prism7 (La Jolla, CA, USA). Data are expressed as mean ± SEM Statistical differences for single comparisons were determined using unpaired Student’s t test for parametric data or Mann‐Whitney U test for nonparametric data. For multiple comparisons, we employed one‐way or two‐way ANOVA and Tukey’s post hoc test for parametric data, or Kruskal‐Wallis and Dunn’s post hoc test for nonparametric data. Values were considered significant at P < .05.
3. RESULTS
3.1. Characteristics of the subjects
The two obese groups, NG and IR, were matched by weight, BMI, and waist circumference (Table 1). These parameters were higher in obese vs lean subjects. Age and plasma HDL were lower in obese than in lean individuals. Fasting glucose, insulin, HbA1c, and HOMA were significantly higher in IR as compared to obese NG and lean subjects, while no significant differences were detected between obese NG and lean subjects. Triglycerides were higher in obese IR vs lean and NG obese subjects, being only significantly different as compared to lean subjects.
3.2. Proteomic analysis of human adipose tissue
2D‐DIGE was used to analyze differentially expressed proteins in paired samples of OM and SC adipose tissue from lean vs obese men (NG or IR) as well as between the two groups of obese individuals (Figure 1A,B and Supplementary Figure 1A,B). Proteome profiling of OM and SC fat revealed 1597 and 1237 protein spots, among which 45 and 33 spots with different expression levels (P < .05), respectively, were identified by MALDI‐TOF (Supplementary Tables 3 and 4). Downregulated and upregulated proteins among the groups of subjects per fat depot are indicated in Figure 1A,B and Supplementary Figure 1B.
FIGURE 1.
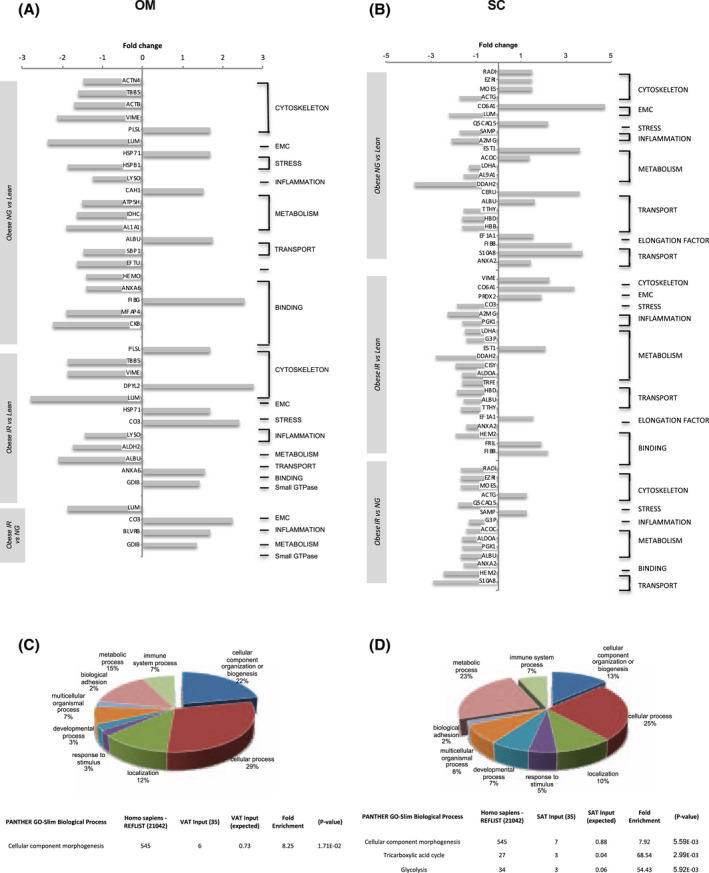
Comparative proteomic analysis of omental (OM) and subcutaneous (SC) adipose tissue from lean individuals and obese individuals with normoglycemia (NG) or insulin resistance (IR). Functional protein prolife of OM (A) and SC (B) adipose tissue illustrating downregulated and upregulated proteins identified by comparative 2D‐DIGE analysis. Relevant biological processes were categorized using GO PANTHER classification system (http://www.pantherdb.org/). Pie chart representing the GO classification for biological process of differentially expressed proteins (upper panel) and significantly over‐represented Biological Process (P ≤ .05 Bonferroni test; lower panel) in OM (C) and SC (D) adipose tissue from lean and NG or IR obese individuals. Data are expressed as the percent of protein hit against total # Process hits
All the differentially expressed proteins between the three groups of individuals per fat depot were analyzed using PANTHER GO‐slim for Biological Processes. This analysis showed an over‐representation of the differentially expressed proteins in cellular processes such as morphogenesis, including ECM (lumican) and cytoskeletal proteins (Figure 1C,D and Supplementary Tables 3 and 4). Immunoblotting on additional fat samples to those employed for 2D‐DIGE confirmed that proteins such as vimentin, showed opposite expression profiles between fat depots (Supplemenatry Figure 1C). Panther analysis also revealed an enrichment of differentially expressed proteins of the tricarboxylic acid cycle and glycolysis in SC fat (Figure 1D and Supplementary Tables 3 and 4). Among the proteins modified in OM fat, lumican was downregulated in obese (NG or IR) vs lean subjects, as well as between IR and NG obese subjects, and GDI2 was upregulated in IR obese subjects (Figure 1A and Supplementary Table 3).
In order to get further insights on the proteins with differential expression levels between groups in SC and OM fat, we further explored extracellular (lumican) and intracellular proteins (GDI2) related to obesity and IR as representatives of each fat depot.
3.3. Fibrosis and adipose tissue expansion in obesity and IR
Our proteomic analysis revealed changes in COL6A1, which increased in obese (NG and IR) vs lean individuals in SC, but not OM fat (Supplementary Tables 3 and 4). To extend these data, other collagens regulated in the obese adipose tissue 30 , 33 , 34 , 35 were analyzed. These studies showed higher COL3A1 mRNA levels in OM samples in obese IR than in NG and lean groups, while COL6A3 mRNA content in SC fat was higher in obese NG vs lean individuals (Figure 2A,B).
FIGURE 2.
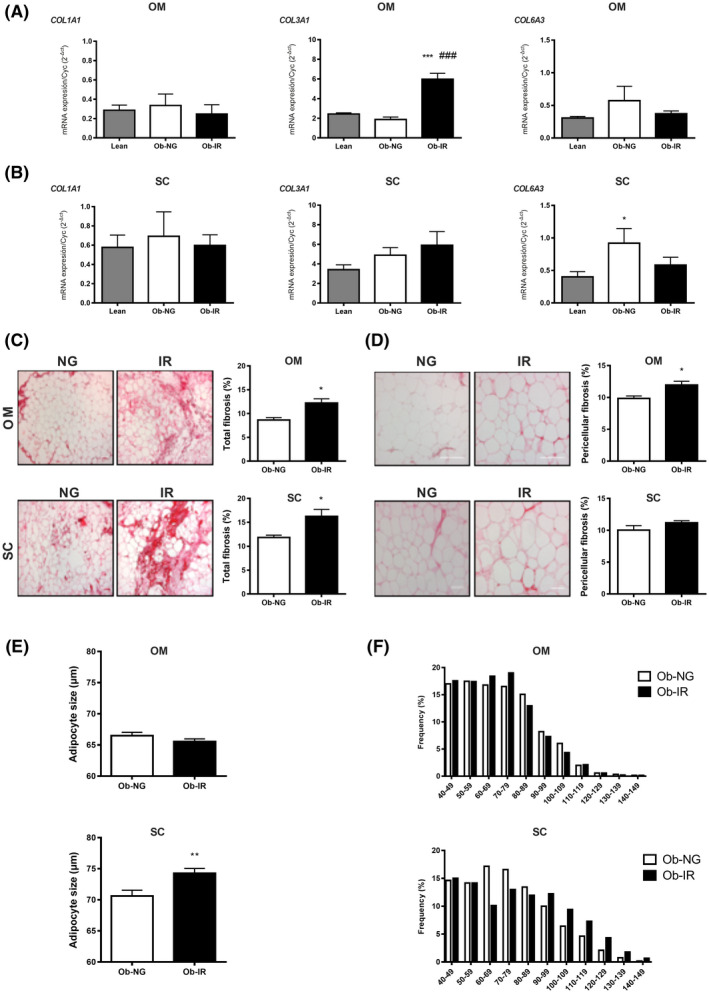
Fibrosis, collagen accumulation and adipocyte size in obesity‐associated insulin resistance. Collagen (COL1A1, COL3A1, and COL6A3) mRNA expression in OM (A) and SC (B) from lean individuals (grey bar), and NG (white bar) or IR (black bar) obese subjects. Data represent the mean ± SEM (n = 4‐8 individuals/group). *P < .05 vs lean; # P < .05 vs NG using One‐way ANOVA or Kruskal‐Wallis’s test as post hoc comparisons. Total (C) and pericellular (D) fibrosis in OM and SC adipose tissue from NG (Ob‐NG) and IR (Ob‐IR) obese subjects. Right panels show representative images of OM and SC histological sections stained for collagen using Picrosirius Red (100× and 200× magnification in C and D); left panels show the quantification of total and pericellular fibrosis in OM and SC histological sections. Data show the fibrotic area (Picrosirius Red stain) as a percentage of the total area from 4 to 6 individuals/group (5 microscopic fields/individual/group). Adipocyte size (E) and histograms showing the frequency distribution of adipocyte sizes (F) in OM and SC adipose tissue from NG and IR obese subjects. Adipocyte parameters were determined from 4 to 6 individuals/group (200 cells/group). Data are expressed as the mean ± SEM. Data were analyzed for significance using Student’s t test for parametric data, or Mann‐Whitney U test for nonparametric data. *P < .05 and **P < .01 vs NG
Collagen content and distribution was evaluated in Picrosirius red‐stained histological sections of paired samples of SC and OM fat from obese subjects. IR obese subjects accumulated more total collagen than NG obese individuals in both fat depots (Figure 2C). However, pericellular fibrosis only reached significantly higher levels in IR vs NG obese subjects in OM fat (Figure 2D). In contrast, SC adipocytes were larger in IR than in NG obese subjects while no differences were observed for OM adipocytes (Figure 2E,F).
3.4. Collagen fibril organization in relation to obesity and IR
Fibrilar COL‐I assembly is regulated by SRLPs such as lumican, 36 whose expression was found differentially regulated by 2D‐DIGE (Supplementary Tables 3 and 4). We further examined lumican in adipose tissue by immunohistochemistry (Figure 3A,B). Total lumican immunosignal localized to the periphery of mature adipocytes and also stained ECM collagen bundles. This distribution was more clearly observed in SC fat from IR obese individuals and, though with less intensity, also in OM fat from NG obese individuals (Figure 3A). In line with the proteomic data, both total and pericellular lumican immunoreactive contents were numerically, yet, not significantly, lower in IR than in NG obese subjects in OM fat (Figure 3A,B). However, SC fat from IR obese individuals exhibited significantly higher lumican levels, both total and pericellular, that NG obese individuals (Figure 3A,B), while this difference was not detected in the proteomic study. Immunoblotting analysis of protein extracts from additional SC and OM adipose tissue revealed similar trends to those observed in the histochemical study, when NG and IR obese individuals were subclassified by sex, yet, no significant differences were found because of the low number of individuals (Supplementary Figure 3A,B).
FIGURE 3.
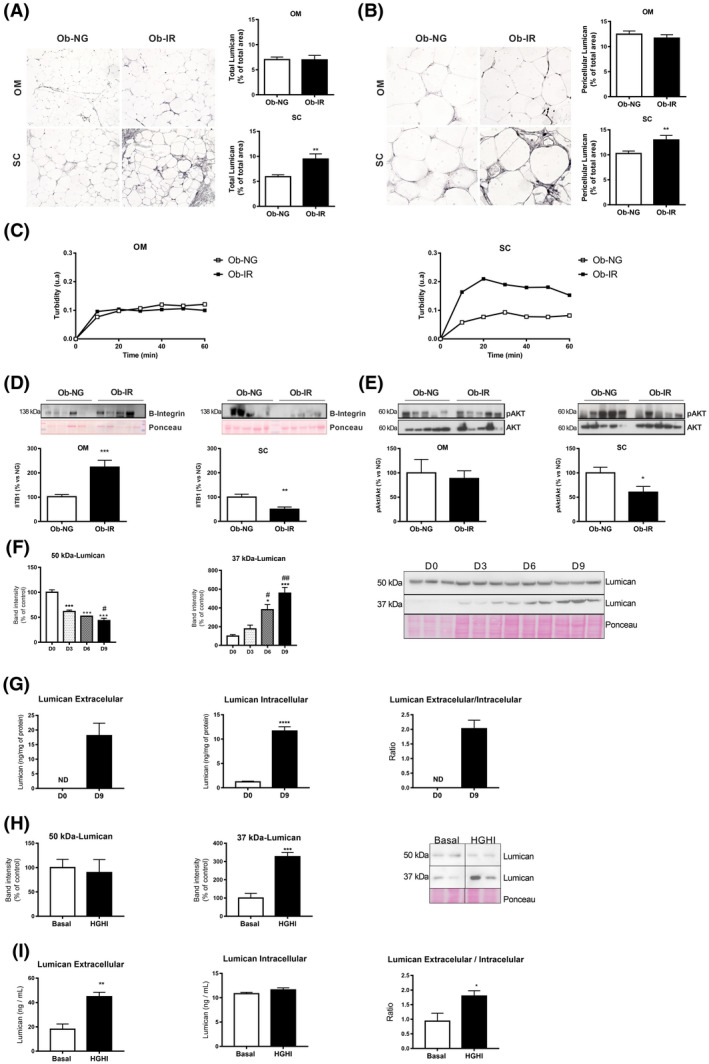
Fibrillogenesis and lumican in obesity‐associated insulin resistance. Immunohistochemical analysis of total (A) and pericellular (B) lumican in OM and SC adipose tissue sections from NG (Ob‐NG) and IR (Ob‐IR) obese subjects. Representative images of histological sections of OM and SC fat immunostained for lumican using an anti‐lumican antibody (100× and 200× magnification in A and B). Quantification of total (right panels) and pericellular (left panels) lumican immunostaining in NG (white bars) and IR (black bars) obese individuals. Data show the percentage of the total area (A) and pericellular (B) covered by lumican immunostaining. C, Effects of OM and SC adipose tissue extracts on collagen fibrillogenesis. Protein extracts from adipose tissue samples of NG (Ob‐NG) and IR (Ob‐IR) obese subjects were incubated with COL‐I (1 mg/mL), allowed to gel (2 hours, 37ºC), and the turbidity of the mixture was measured as absorbance at 340 nm during 1 hours. D, Representative immunoblots of β1‐integrin (ITB1) and pAkt/Akt ratio (E) (upper panels) and quantification of protein levels (lower panels) normalized using Ponceau staining in OM and SC adipose samples from lean and NG and IR obese subjects. All the gels have been run under the same experimental conditions. Data represent the mean ± SEM (n = 5 individuals/group). *P < .05, **P < .01, and ***P < .01 vs lean subjects using Student t test for parametric data, or Mann‐Whitney U test for nonparametric data. F, Representative immunoblots showing lumican immunoreactive bands, corresponding to the protein core (37 kDa) and glycated lumican (50 kDa), in extracts from 3T3‐L1 cells during adipogenesis (D0‐D9); for quantification, protein levels were normalized using Ponceau staining. Data represent the mean ± SEM (n = 3 replicates/differentiation day). *P < .05, and ***P < .001 vs day 0 (D0) and # P < .05 vs D3 using One‐way ANOVA for parametric data, or Kruskal‐Wallis test, for nonparametric data, as post hoc comparisons. G, Lumican content in culture media (extracellular lumican), and in 3T3‐L1 adipocytes at D0 (white bars) and D10 (black bars) of differentiation. Lumican was measured by ELISA and lumican extracellular/intracellular ratio was calculated as a measure of lumican secretion. Data represent the mean ± SEM (n = 3‐4 replicates/group). Data were analyzed for significance using Student`s t test. ***P < .001 vs D0. H, I, Representative immunoblots of lumican (37 kDa and 50 kDa) (H), and extracellular and intracellular content of lumican in 3T3‐L1 adipocytes (I) exposed to basal conditions (Basal; white bars) or a combination of high glucose (4.5 gr/L) and high insulin (100 nmol/L) for 24 h (HGHI; black bars). The blot shown in Figure 3G is cropped from one gel (indicated by vertical lines). Data represent the mean ± SEM (n = 6 replicates/group). Data were analyzed for significance using Student’s t test. *P < .05, **P < .01, and ***P < .001 vs basal conditions
We explored the ability of OM and SC samples from NG and IR obese subjects to induce collagen fibrillogenesis in vitro. Both the slope (0.006 ± 0.003 vs 0.028 ± 0.01, P < .05) and the maximum turbidity value (0.097 ± 0.003 vs 0.223 ± 0.05, P < .05) were higher, when COL‐I was co‐incubated with SC protein extracts from IR as compared to NG obese subjects, while no differences were observed for OM samples (Figure 3B).
Both collagens and lumican are ligands of integrin receptors, such as integrin α1β1 and α2β1. 36 , 37 β1‐integrins (ITB1) regulate cell function through the reorganization of the cortical actin cytoskeleton and the activation of specific signaling cascades including Akt. 38 Quantitative immunoblotting revealed that ITB1 content increased in OM while it decreased in SC fat in IR vs NG obese individuals (Figure 3D). The pAkt/Akt ratio was significantly lower and actin was higher in SC fat from IR than from NG obese individuals while no differences were observed for OM samples (Figure 3E and Supplementary Figure 2A).
To complement our histological results, we analyzed the presence of lumican in the cellular components of the adipose tissue. This revealed the presence of a 150 kDa immunoreactive band, corresponding to the long PG form of lumican, in both the SVF and mature adipocytes (Supplementary Figure 3E). Next, we tested capacity of preadipocytes and adipocytes to produce this PG as a means to identify the cellular source of this PG. In accordance with previous studies in other cell types, 36 , 37 immunoblotting studies revealed two immunoreactive bands, corresponding to both the core protein (37 kDa) and glycated (50 kDa) lumican, in extracts from 3T3‐L1 cells at different stages of differentiation (Figure 3F). However, the intracellular content of 37 kDa‐lumican increased while 50 kDa‐lumican decreased from preadipocytes to differentiated adipocytes. In parallel with these changes, ELISA studies showed that 3T3‐L1 adipocytes contained and secreted higher amounts of lumican than preadipocytes (Figure 3G).
To get insights into the regulation of lumican in adipocytes, we analyzed the effects of a hyperglycemic/hyperinsulinemic environment, as that occurring in our group of IR obese individuals, on the production of this PG. To this end, differentiated 3T3‐L1 adipocytes were exposed to high concentrations of glucose and insulin (HGHI) for 24 hours, which induce IR in these cells. 24 Exposure to HGHI increased the intracellular content of 37 kDa‐lumican, without changing that of 50 kDa‐lumican (Figure 3H). Data from ELISA studies revealed a slight yet not significant increase in intracellular lumican content in 3T3‐L1 adipocytes in response to HGHI, while these conditions greatly enhanced lumican release to the medium (Figure 3I).
3.5. Response of adipocytes to changes in ECM components
To elucidate the role of lumican in the adipose tissue, we analyzed the effects of this PG on both COL‐I fibril organization and adipocyte biology. Specifically, undifferentiated 3T3‐L1 cells were embedded in COL‐I hydrogels alone or in combination with lumican (10 or 30 ng/mL) and differentiated into adipocytes.
Microscopic observations showed that 3T3‐L1 cells in control 3D cultures (COL‐I alone) differentiated normally into mature adipocytes, that is, accumulated LDs and acquired a round morphology (Figure 4A), in a manner similar to that observed for 2D cultures (Supplementary Figure 4A). The presence of lumican in COL‐I hydrogels impaired adipogenesis in a dose‐dependent manner (Figure 4A). No changes were observed in cell viability or cytotoxicity under any of the conditions tested (Figure 4B,C).
FIGURE 4.
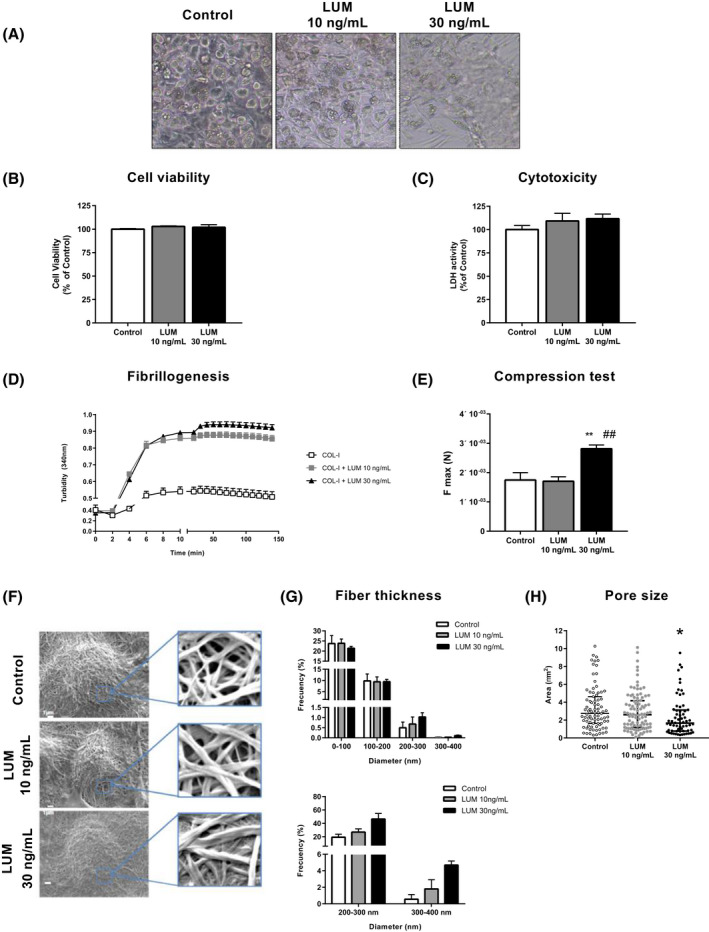
Three‐Dimensional (3D) culture of 3T3‐L1 adipocytes. Effects of lumican on COL‐I fibrillogenesis and mechanical properties of COL‐I matrices. A, Microscopic images of 3T3‐L1 adipocytes at day 10 of differentiation in COL‐I gels (3.6 mg/mL), alone (Control) or combined with lumican (LUM) (10 or 30 ng/mL). B, Cell viability using MTT assay and C, cytotoxicity measured as LDH activity in 3T3‐L1 adipocytes (day 10) differentiated in COL‐I matrices in the absence (white bars) or presence of lumican at 10 ng/mL (grey bars) or 30 ng/mL (black bars). D, Effects of lumican on collagen fibrillogenesis. COL‐I (1 mg/mL) was incubated in the absence (empty squares) or presence of lumican at 10 ng/mL (solid squares) or 30 ng/mL (solid triangles) and turbidity of the gels was measured as absorbance at 340 nm. E, Compression test of COL‐I gels containing (10 or 30 ng/mL) or not (Control) lumican. F, Scanning electron microscopy micrographs from COL‐I matrices, alone or containing 10 or 30 ng/mL lumican and quantitative analyses of collagen fiber thickness (G) and pore size (H) in the 3D matrices. Data represent the mean ± SEM (n = 4‐6 replicates/group). Data were analyzed for significance using One‐way ANOVA for parametric data, or Kruskal‐Wallis test, for nonparametric data. For electron microscopy studies, 40 cells per experimental group from two independent experiments were analyzed and Two‐way ANOVA test was used for data analysis. *P < .05, and **P < .01 vs Control; ## P < .01 vs 10 ng/mL lumican
We then explored the properties of 3D COL‐I matrices, alone or combined with lumican. As shown in Figure 4D, lumican modified the kinetics of COL‐I fibril formation at both low and high concentrations. COL‐I hydrogels containing 30 ng/mL lumican were more resistant to deformation than control 3D cultures or containing 10 ng/mL lumican (Figure 4E).
To further characterize the effects of lumican, we examined the 3D COL‐I cultures by scanning electron microscopy. These studies showed that COL‐I assembled into cross‐striated fibrils that formed a dense network embedding 3T3‐L1 adipocytes (Figure 4F). Morphometric analysis of COL‐I fibrils revealed significant changes in collagen organization in response to lumican. Specifically, lumican increased the percentage of COL‐I fibrils with diameters above 200 nm as compared to control 3D cultures, an effect that was more noticeable at the highest concentration tested (Figure 4G). This effect was accompanied by a progressive decrease in the area of interfibrillar regions (2.75, 2.6, and 1.67 µm2 for 0, 10, and 30 ng/mL lumican, respectively) (Figure 4H).
Confocal microscopy studies of 3T3‐L1 adipocytes stained with Nile Red (Figure 5A and Supplementary Figure 4B) revealed that cells grown in COL‐I hydrogels containing lumican exhibited similar numbers of LDs but of smaller size than those grown in COL‐I alone, which resulted in a significant reduction in the total lipid content per adipocyte (Figure 5B). In relation with these results, we observed that the adipocytes in COL‐I hydrogels containing lumican expressed lower amounts of the adipogenic transcription factors C/EBPα and PPARγ (Figure 5C). Furthermore, the mRNA or protein levels of three insulin signaling mediators, insulin receptor (IR), Akt, and the glucose transporter, GLUT4, were also diminished in adipocytes in 3D cultures exposed to lumican (Figure 5D).
FIGURE 5.
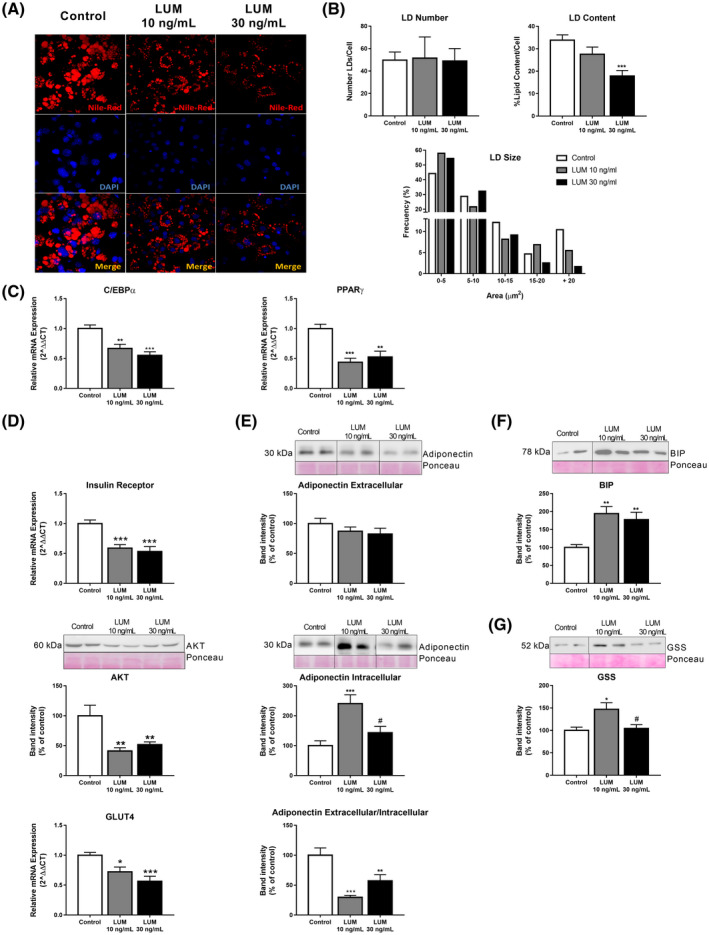
Three‐Dimensional (3D) culture of 3T3‐L1 adipocytes. Effects of lumican on adipocyte biology. A, Confocal microscopy of 3T3‐L1 adipocytes differentiated in COL‐I gels (3.6 mg/mL), alone (Control; white bars) or combined with lumican (LUM) at 10 ng/mL (grey bars) or 30 ng/mL (black bars). Lipid droplets (LDs) were visualized using Nile Red staining and nuclei were stained with DAPI. Confocal micrographs were employed for quantification of LD number, LD size, and total LD content (B) in 3T3‐L1 adipocytes differentiated in COL‐I gels in COL‐I gels in the absence (Basal; white bars) or presence of lumican (LUM) at 10 ng/mL (grey bars) or 30 ng/mL (black bars) (n = 15 cells/group from three independent experiments). mRNA expression levels of (C) C/EBPα, PPARγ and (D) Insulin receptor, GLUT4 and representative immunoblots of AKT in adipocytes in control 3D cultures (white bars) or containing 10 ng/mL (grey bars) or 30 ng/mL (black bars) lumican as determined by RT‐qPCR. Data represent the mean ± SEM (n = 12 replicates/group). E, Representative immunoblots and protein content of adiponectin in culture media (extracellular adiponectin), and in 3T3‐L1 adipocytes (intracellular adiponectin) differentiated in COL‐I gels. Adiponectin extracellular/intracellular ratio was calculated as a measure of adiponectin secretion. Protein levels were normalized using Ponceau staining. F,G, Representative immunoblots and protein levels of the ER stress marker, BIP (F), and glutathione synthase (GSS) (G). The blots used in Figure 5D‐F are cropped from one gel for the corresponding marker (indicated by vertical lines). The gels have been run under the same experimental conditions. Data represent the mean ± SEM (n = 4‐6 replicates/group). Data are expressed as a percentage of values in control cultures (100%). Data were analyzed for significance using One‐way ANOVA for parametric data, or Kruskal‐Wallis test, for nonparametric data, as post hoc comparisons. *P < .05; **P < .01; ***P < .001; vs Control; # P < .05 vs 10 ng/mL lumican
Lumican also altered the secretory profile of 3T3‐L1 adipocytes (Figure 5E). Thus, it increased adiponectin intracellular content, especially at a low dose, without changing adiponectin content in the culture medium, indicating that adiponectin release is inhibited under these conditions.
Regarding cellular stress processes, lumican consistently upregulated the protein content of the endoplasmic reticulum (ER) stress marker, BiP (Figure 5F). Lumican at 10 ng/mL, but not at 30 ng/mL, increased the levels of glutathione synthetase (GSS) (Figure 5G). ROS content tended to increase, yet, not significantly, in response to increasing doses of lumican (Supplementary Figure 4C).
3.6. Fat depot‐specific dysregulation of GDI2 in obesity and IR
Both 2D‐DIGE experiments (Figure 1A,B) and quantitative immunoblotting of additional samples of OM and SC fat (Figure 6A) showed the OM‐specific upregulation of GDI2 in IR obesity. Similar trends were observed, when samples were classified by sex (Supplementary Figure 3C,D). Specifically, two GDI2‐immunoreactive bands of 51 and 46 kDa, corresponding to GDI2 isoforms (https://www.uniprot.org/), were detected in human adipose tissue samples. GDI2 was also detected in protein extracts from mature adipocytes isolated from OM fat (Supplementary Figure 3F).
FIGURE 6.
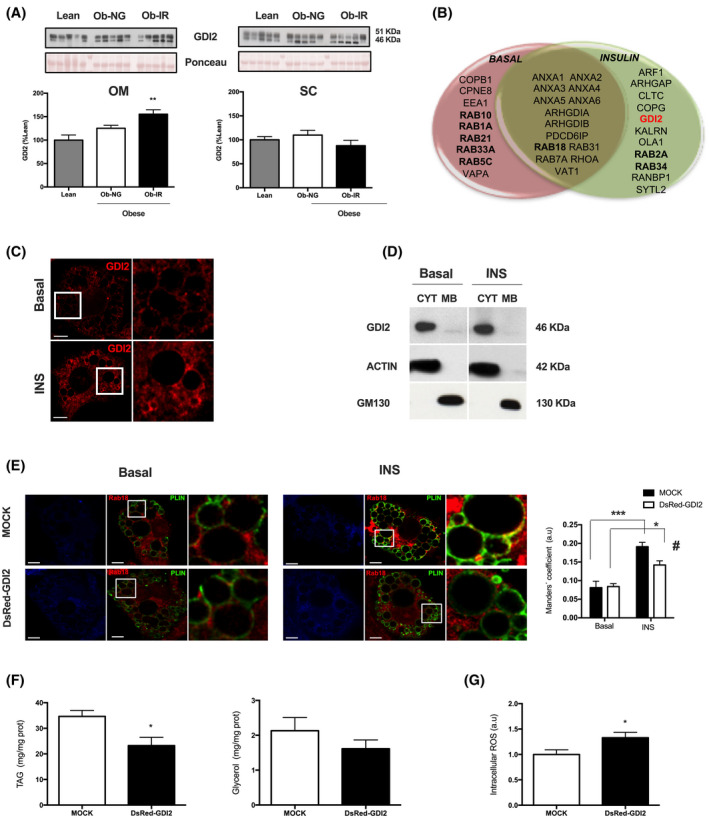
GDI2 expression in SC and OM adipose tissue and characterization in adipocytes. A, Representative immunoblots and quantification of GDI2 protein content in OM and SC adipose tissue samples from lean individuals (grey bars) and NG (white bars) and IR (black bars) obese subjects. B, Venn diagram showing protein identifications in isolated LDs from 3T3‐L1 adipocytes under basal or insulin‐stimulated conditions (100 nmol/L, 2 hours) related to intracellular traffic. C, Confocal micrographs of differentiated 3T3‐L1 adipocytes immunostained for GDI2 after 2 hours of exposure to medium alone (Basal) or insulin (INS) (100 nmol/L, 2 hours). D, Distribution of endogenous GDI2 in cytosolic (CYT) and membrane (MB) fractions obtained by subcellular fractionation from 3T3‐L1 adipocytes under control conditions (Basal) or treated with insulin (100 nmol/L, 2 hours) (INS). The blots shown are cropped from one gel (indicated by vertical lines). E, Colocalization studies of Rab18 (red) and the LD marker, perilipin 1 (PLIN) (green) in 3T3‐L1 adipocytes expressing DsRed empty vector (Mock) or DsRed‐GDI2 expression vector (DsRed‐GDI2) (blue). The degree of colocalization between Rab18 and PLIN was quantified as Manders’ coefficient (right panel). The Golgi protein, GM130, and actin were employed as markers of membrane and cytosolic fractions, respectively. F, Intracellular triglycerides (TAG; left panel) and glycerol in the culture media (right panel), and G, Reactive oxygen species (ROS) content in 3T3‐L1 adipocytes expressing DsRed empty vector (Mock) or DsRed‐GDI2 expression vector (DsRed‐GDI2). H, pAkt/Akt ratio in adipocytes overexpressing GDI2 in response to insulin stimulation (100 nmol/L, 5 minutes) compared to mock‐transfected cells. Data represent the mean ± SEM. Data from human studies were analyzed using One‐way ANOVA and Kruskal‐Wallis test as post hoc comparisons (n = 4‐6 individuals/group). For confocal microscopy studies, at least 10 cells per experimental group were analyzed and Two‐way ANOVA test was used for data analysis. For immunoblot and functional analysis, six replicates/group were used. **P < .01 vs lean individuals; *P < .05, and ***P < .001 vs basal conditions; # P < .05 vs Mock transfected cells exposed to insulin
To explore the presence of GDI2 and Rab proteins in LDs, we carried out a qualitative proteomic study of LDs isolated from basal and insulin‐stimulated 3T3‐L1 adipocytes (Supplementary Figure 5). A complete list of the LD proteins identified by LC‐MS/MS is shown in Supplementary Table 5. Among the proteins related to intracellular traffic, we identified GDI2 and 10 different Rab GTPases (Figure 6B). Specifically, GDI2 was identified as a LD component in insulin‐treated adipocytes. Confocal microscopy studies revealed that GDI2 immunosignal distributed diffusely in the cytosol in unstimulated 3T3‐L1 cells, whereas it concentrated around LDs in insulin‐treated cells (Figure 6C). Subcellular fractionation studies revealed that GDI2 located to the cytosol under either basal or insulin‐stimulated conditions, indicating that it behaves as a LD peripheral protein (Figure 6D).
To investigate the effect of GDI2 on LD dynamics, we chose one LD‐associated Rab protein regulated by insulin, Rab18, 22 and examined its role as a potential GDI2 target. Thus, we first investigated whether GDI2 could prevent Rab18 binding to LDs upon insulin exposure by overexpressing a GDI2‐expression vector in 3T3‐L1 adipocytes immunostained for the LD coat protein, perilipin 1 (PLIN), as compared to mock‐transfected cells. Insulin‐stimulated association of Rab18 with LDs was significantly lower in cells overexpressing DsRed‐GDI2 than DsRed empty vector (Figure 6E). Additionally, DsRed‐GDI2 overexpression significantly decreased lipogenesis, measured as triglyceride content, and tended to diminished lipolysis, measured as glycerol output (Figure 6F). GDI2 overexpression increased ROS accumulation in adipocytes (Figure 6G). A decrease in Akt activation (ie, pAkt/Akt ratio) was observed in adipocytes overexpressing GDI2 in response to insulin stimulation (100 nmol/L, 5 minutes) compared to mock‐transfected cells (Figure 6H).
Finally, exposure of 3T3‐L1 adipocytes to HGHI increased GDI2 content while no changes were observed in Rab18 levels (Figure 7A), yet, these cells exhibited significantly less LD‐bound Rab18 than control adipocytes (Figure 7B).
FIGURE 7.
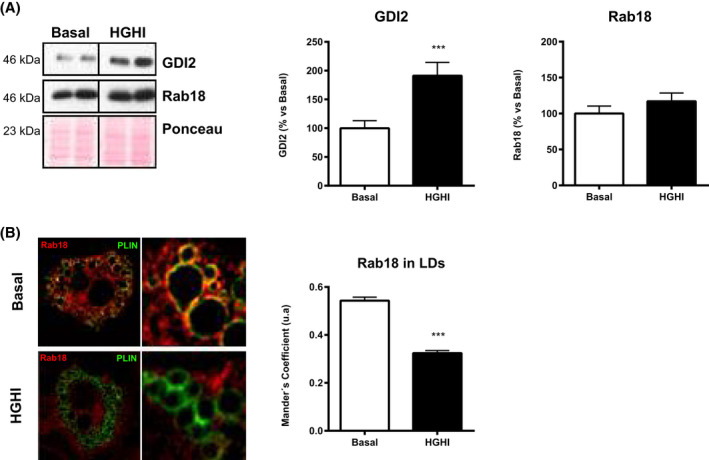
Regulation of GDI2 and Rab18 in 3T3‐L1 adipocytes under insulin resistance conditions. A, Representative immunoblots and quantification of GDI2 and Rab18 content in 3T3‐L1 adipocytes exposed to basal conditions (Basal; white bars) or a combination of high glucose (4.5 gr/L) and high insulin (100 nmol/L) concentrations for 24 hours (HGHI; black bars). Levels were normalized using actin. Data represent the mean ± SEM, calculated as percentage of values normalyzed to basal conditions (100%). (n = 4 replicates/group). The blots are cropped from one gel for GDI2 and Rab18 (indicated by vertical lines). B, Confocal microscope images of 3T3‐L1 adipocytes under basal conditions or exposed to HGHI and co‐immunostained for Rab18 (red) and PLIN (green). Colocalization of the two immunosignals is shown in the right panels (yellow). Manders´ coefficients were calculated for each experimental condition and represented as the mean ± SEM of 10‐16 cells (300‐500 LDs) per experimental group. Differences between groups were analyzed by two‐way ANOVA and Tukey’s post hoc test. ***P < .001 vs basal conditions
4. DISCUSSION
We have identified two proteins, lumican, and GDI2, with potential fat depot‐dependent, pathogenic roles in obesity‐associated metabolic disease. Our results indicate that dysregulated production of lumican and GDI2 may alter ECM and LD dynamics in SC and OM adipose tissue, respectively, and thus, contribute to the development of IR in obese individuals.
Our histological studies revealed the presence of thick collagen bundles in SC and OM adipose tissue from obese individuals, yet, the transition from NG to IR in obesity was associated with enhanced collagen deposition. Previous histological studies have reported either increased total collagen content in obese vs lean OM fat, 30 decreased collagen deposition in both fat depots of type 2 diabetes (T2D) obese patients as compared with nondiabetic obese patients, 39 or even no changes in collagen content between metabolically healthy and unhealthy obese patients. 40 Notably, we detected occasional differences regarding the protein content of some of the study proteins depending of the technique employed for analysis (proteomics vs histology). These conflicting data may be accounted for by the anatomic heterogeneity of collagen, a limitation that appears particularly relevant, when interpreting datasets obtained from adipose tissue samples of reduced size.
In fact, not only total collagen content, but also collagen distribution and organization, which are depot‐specific, may be also important in the pathogenesis of fibrosis. 6 , 7 , 8 In this vein, we observed that IR obese individuals exhibited increased pericellular fibrosis in OM adipocytes as compared to NG obesity, while maintaining adipocyte size constant, suggesting that enhanced pericellular collagen accumulation might constrain adipocyte growth in OM fat. It has been proposed that OM fibrosis preserves adipocyte health by restricting cell hypertrophy. 39 , 40 In contrast to this proposal are our previous studies showing that OM mature adipocytes from IR obese individuals display features of enhanced oxidative stress, ER stress, and inflammation as compared to NG obese individuals. 24 It is plausible that OM adipocytes in IR obese individuals are submitted to increased microenvironmental stiffness. This is supported by our observations showing higher β1‐integrin levels in IR obese OM fat, and our previous data 24 demonstrating an enrichment in IR obese OM adipocytes of the integrin adhesome component, integrin‐linked kinase, which couples intracellular mechanical forces with ECM stiffness. 41 Together, our findings suggest that integrin functions, that is, adipocyte anchoring to the ECM and ECM‐to‐cell mechanotransduction, are altered in IR obese OM fat, suggesting a role for disturbed ECM‐integrin interactions in obesity‐related metabolic complications. A similar, yet, opposite, situation may occur in SC fat of IR obese individuals, which showed diminished β1‐integrin levels compared to NG. β1‐integrin downregulation evokes IR in skeletal muscle of obese mice by impairing insulin‐stimulated Akt phosphorylation at Ser473. 42 These observations are consistent with the decreased pAkt (Ser473)/Akt ratio observed in IR obese SC fat. The changes observed in the cytoskeleton (actin, vimentin) would also stand for the deregulation of mechanotransduction pathways in IR obese individuals.
Lipid accumulation and adipocyte expansion (in SC fat) might be as deleterious as adipocyte growth restraint (in OM fat), inasmuch as SC adipocytes from IR obese individuals are larger (the present study) and exhibit higher levels of inflammatory, oxidative stress, and ER stress markers than those from NG obese individuals. 24 A plausible explanation for these findings is that the ECM architecture also influences adipocyte fate. This proposal is supported by our results on lumican, which regulates collagen fibrillogenesis. 36 Lumican upregulation has been previously reported in SC fat from obese individuals with metabolic syndrome vs lean individuals, 17 and in gonadal fat of high‐fat diet (HFD)‐induced obese mice. 19 Lumican expression may be differentially regulated in a species‐ and depot‐specific manner inasmuch as lumican content decreased in human OM fat in response to obesity.
Our electron microscopy observations of 3D cultures mimicking the SC microenvironment, demonstrated that lumican enhanced COL‐I fibril size and packing, which also resulted in an increased resistance of the collagen hydrogels to compression forces. These extracellular conditions had an important negative impact on adipogenesis and adipocyte biology. It has been recently shown that increased expression of lumican by adenoviral delivery in mice gonadal adipose tissue induced a moderate fat mass gain in response to HFD while improving peripheral insulin sensitivity. 19 This is in contrast to our observations in human SC adipose tissue, which are indicative of a pathogenic role for lumican, when expressed above normal (ie, healthy) levels. This discrepancy could be explained by species‐specific and/or inter‐depot differences, including differences in relative lumican content. Actually, Wolff et al 19 also showed that lumican knockdown preferentially affected SC fat, rather than gonadal fat, and this occurred in a gender‐specific manner. It is worthy to note that in the study by Wolff and coworkers, 19 lumican was overexpressed not only in gonadal fat, but also in the liver, wherein no changes in fat accumulation were detected, yet, lumican has been related to the development of human liver fibrosis 43 and, in fact, this PG is overexpressed in hepatic tissues from patients with NAFLD and nonalcoholic steatohepatitis (NASH). 15 Further research is needed to establish to what extent lumican is released under (patho)physiological conditions to exert its effects on the ECM. In this scenario, the observation that 3T3‐L1 adipocytes release lumican in response to hyperglycemic/hyperinsulinemic conditions provides novel information on the mechanisms underlying the abnormal accumulation of this SLRP in SC fat in IR obesity. The observation that IR OM fat did not show increased lumican levels as compared to NG OM fat, but a trend to decrease, suggests that there might be cell‐autonomous mechanisms dictating the response to the hyperglycemic/hyperinsulinemic environment.
As a matter of fact, GDI2 behave just the opposite to lumican, that is, increased in IR obese OM fat, but not in IR vs NG SC obese fat, with GDI2 levels being upregulated in 3T3‐L1 adipocytes upon HGHI exposure. As already mentioned, GDI2 constitutes a Rab GDP dissociation inhibitor. 44 Rab proteins exert their functions upon binding to effectors (kinases, phosphatases, cytoskeleton, etc) at specific target membranes. 44 Rab proteins cycle between a GDP‐bound inactive state, that is normally cytosolic, and a membrane‐associated GTP‐bound, active conformation. 45 It has been proposed that GDIs retrieve membrane‐bound Rab GTPases to form inactive cytosolic complexes, thus, preventing the dissociation of GDP and subsequent activation of Rab proteins, or their interaction with effector membranes. 46 , 47
The Rab family consists of over 60 members, 48 among which we identified 10 in the LD adipocyte proteome. To our knowledge, this is the first proteomic study using LDs isolated from insulin‐stimulated adipocytes, and the first report demonstrating the presence of Rab10, Rab33A, and Rab34 in the adipocyte LD proteome. Our proteomic study also confirmed that Rab18 is an essential component of LDs, which complement our previous studies demonstrating increased Rab18 binding to LDs in response to insulin and the involvement of this GTPase in the regulation of lipogenesis in adipocytes. 22 Rab18 also regulates the lipolytic activity of adipocytes by an as yet unknown mechanism. 22 , 49 In this scenario, we investigated whether GDI2 could regulate LD‐bound Rab18 and the functional consequences of this potential interaction. Our results, together with the localization of GDI2 to the cytosol surrounding LDs, indicated that Rab18 may be sequestered by this inhibitor and retained inactive in the cytosol. Under these conditions, a reduction in Rab18‐related functions, that is, lipogenesis and/or lipolysis, in adipocytes overexpressing GDI2 could be expected, as we demonstrated to be the case. Notably, blockade of Rab18 association with LDs by GDI2 overexpression evoked the same effects on lipid metabolism than Rab18 silencing by siRNA, 22 indicating that GDI2 may regulate adipocyte metabolic function by preventing Rab18 association with LDs. As suggested by our overexpression studies, this may be related to the potential effect of GDI2 on insulin signaling which, as we have previously demonstrated, regulates Rab18 binding to LDs. 22 We cannot exclude the possibility that the metabolic effects (or the increased ROS levels) observed in cells overexpressing GDI2 are due to the actions of this Rab inhibitor on other Rab proteins that bind to LDs or to other organelles involved in lipid metabolism, such as the ER, mitochondria or peroxisomes. 50 In any event, irrespective of the specific Rab target(s), it is likely that abnormally increased intracellular levels of GDI2, as occurs in OM fat of IR obese subjects, impair normal adipocyte function due, at least in part, to its inhibitory action on LD‐associated Rab proteins, such as Rab18. We hence propose that, besides ER stress and oxidative stress, adipocytes in IR obese OM fat are submitted to an additional stress mechanism related to LD malfunction, or “LD stress,” due to GDI2‐mediated inhibition of LD‐associated Rab proteins.
Our study presents some limitations. First, it is limited by the absence of data from GTT analyses that could help exclude unequivocally the potential presence of obese individuals with isolated impaired glucose tolerance in the NG group. 51 However, the subjects in either NG or IR obese groups were well matched for ADA criteria regarding IFG and A1C. 25 Another limitation is that, due to the limited size of the samples available, especially in the case of lean individuals, our proteomic studies were performed using whole adipose tissue, which prevented the identification of the specific cellular source of the proteins with differential expression. Nevertheless, by using different cellular and molecular approaches in 3T3 cells, we demonstrate that adipocytes represent an important source of lumican, which is released by these cells in a regulated manner, while GDI2, by acting intracellularly, regulates lipid metabolism in these cells. Further studies in primary adipocytes will be required to confirm the relevance of these findings to human obesity and IR.
In sum, our results demonstrate the depot‐specific dysregulation and potential contribution of lumican and GDI2 to obesity‐related IR. This, together with the observation that these proteins are regulated in adipocytes in response to hyperglycemia/hyperinsulinemia, shed light on the etiology of obesity‐associated metabolic disturbances that may be helpful to design novel therapeutic strategies. Our findings indicate that these strategies should be specifically designed to target each fat depot.
CONFLICT OF INTEREST
The authors declare no competing interest.
AUTHOR CONTRIBUTIONS
R. Guzmán‐Ruiz and M. Malagón designed research; A. Pandit participated in the design of 3D studies; R. Guzmán‐Ruiz, C. Tercero‐Alcázar, Y. Rabanal‐Ruiz, MC Navarro‐Ruiz, L. Molero, A. Diaz‐Ruiz, and R. El Bekay performed research; R. Guzmán‐Ruiz, C. Tercero‐Alcázar, and Y. Rabanal‐Ruiz analyzed data; A. Membrives, JF Ruiz‐Rabelo, O. Rangel‐Zuñiga, F. J. Tinahones, and J. López‐Miranda selected the patients; A. Membrives, J. F. Ruiz‐Rabelo, O. Rangel‐Zuñiga, F. J. Tinahones, and J. López‐Miranda reviewed/edited the manuscript; R. Guzmán‐Ruiz, C. Tercero‐Alcázar, Y. Rabanal‐Ruiz, and M. M. Malagón wrote the manuscript.
Supporting information
Fig S1‐S5
Table S1‐2
Table S3
Table S4
Table S5
ACKNOWLEDGMENTS
This work was supported by Ministerio de Ciencia, Innovación y Universidades/FEDER (BFU2013‐44229‐R; BFU2016‐76711‐R; BFU2017‐90578‐REDT to MMM); Consejería de Salud y Bienestar Social/Junta de Andalucía/FEDER (PI‐0200/2013 to MMM; PI‐0159‐2016 to RG‐R.); Instituto de Salud Carlos III (ISCIII)/FEDER (PIE14/00005 to JL‐M. and MMM; Co‐funded by European Regional Development Fund/European Social Fund “Investing in your future”); Science Foundation Ireland (SFI) and the European Regional Development Fund (Grant Number 13/RC/2073 to AP). CIBEROBN is an initiative of ISCIII, Spain. RE‐B is under a “Nicolas Monarde” contract (C‐0030‐2016) (Servicio Andaluz de Salud, J. Andalucía, Spain). We dedicate this work to the bright memory of our colleague and friend Dr Rafael Vázquez‐Martínez. We thank Dr N. Moreno‐Castellano and G. García‐Jurado (IMIBIC, Córdoba, Spain) for their technical assistance, and Dr JR Peinado (Universidad Castilla‐La Mancha, Spain) for his help with proteomic data analysis. The authors are greatful to the Proteomics Facilities of the IMIBIC/University of Córdoba‐SCAI (Córdoba, Spain) and the Andalusian Bioinformatics Platform (PAB) center located at the University of Malaga (Spain) for their help with mass spectrometry studies.
Guzmán‐Ruiz R, Tercero‐Alcázar C, Rabanal‐Ruiz Y, et al. Adipose tissue depot‐specific intracellular and extracellular cues contributing to insulin resistance in obese individuals. The FASEB Journal. 2020;34:7520–7539. 10.1096/fj.201902703R
Rocío Guzmán‐Ruiz, Carmen Tercero‐Alcázar and Yoana Rabanal‐Ruiz are contributed equally to this work.
Contributor Information
Rocío Guzmán‐Ruiz, Email: bc2gurur@uco.es.
María M. Malagón, Email: bc1mapom@uco.es.
REFERENCES
- 1. Carobbio S, Pellegrinelli V, Vidal‐Puig A. Adipose tissue function and expandability as determinants of lipotoxicity and the metabolic syndrome. Adv Exp Med Biol. 2017;960:161‐196. [DOI] [PubMed] [Google Scholar]
- 2. Chouchani E, Kajimura S. Metabolic adaptation and maladaptation in adipose tissue. Nature Metab. 2019;1:189‐200. [DOI] [PMC free article] [PubMed] [Google Scholar]
- 3. Rodriguez A, Ezquerro S, Mendez‐Gimenez L, Becerril S, Fruhbeck G. Revisiting the adipocyte: a model for integration of cytokine signaling in the regulation of energy metabolism. Am J Physiol Endocrinol Metab. 2015;3098:E691‐E714. [DOI] [PubMed] [Google Scholar]
- 4. Friesen M, Cowan CA. Adipocyte metabolism and insulin signaling perturbations: insights from genetics. Trends Endocrinol Metab. 2019;306:396‐406. [DOI] [PubMed] [Google Scholar]
- 5. Sun K, Tordjman J, Clement K, Scherer PE. Fibrosis and adipose tissue dysfunction. Cell Metab. 2013;184:470‐477. [DOI] [PMC free article] [PubMed] [Google Scholar]
- 6. Wernstedt Asterholm I, Scherer PE. Fibrosis‐streaks and splatters: some things are not always what they seem to be. Obesity (Silver Spring). 2016;243:552‐553. [DOI] [PMC free article] [PubMed] [Google Scholar]
- 7. Datta R, Podolsky MJ, Atabai K. Fat fibrosis: friend or foe? JCI Insight. 2018;3:e122289. [DOI] [PMC free article] [PubMed] [Google Scholar]
- 8. Crewe C, An YA, Scherer PE. The ominous triad of adipose tissue dysfunction: inflammation, fibrosis, and impaired angiogenesis. J Clin Invest. 2017;1271:74‐82. [DOI] [PMC free article] [PubMed] [Google Scholar]
- 9. Guglielmi V, Cardellini M, Cinti F, et al. Omental adipose tissue fibrosis and insulin resistance in severe obesity. Nutr Diabetes. 2015;5:e175. [DOI] [PMC free article] [PubMed] [Google Scholar]
- 10. Heindryckx F, Li JP. Role of proteoglycans in neuro‐inflammation and central nervous system fibrosis. Matrix Biol. 2018;68(69):589‐601. [DOI] [PubMed] [Google Scholar]
- 11. Christensen G, Herum KM, Lunde IG. Sweet, yet underappreciated: proteoglycans and extracellular matrix remodeling in heart disease. Matrix Biol. 2019;75(76):286‐299. [DOI] [PubMed] [Google Scholar]
- 12. Theocharis AD, Karamanos NK. Proteoglycans remodeling in cancer: underlying molecular mechanisms. Matrix Biol. 2019;75(76):220‐259. [DOI] [PubMed] [Google Scholar]
- 13. Hultgardh‐Nilsson A, Boren J, Chakravarti S. The small leucine‐rich repeat proteoglycans in tissue repair and atherosclerosis. J Intern Med. 2015;2785:447‐461. [DOI] [PMC free article] [PubMed] [Google Scholar]
- 14. Theocharis AD, Manou D, Karamanos NK. The extracellular matrix as a multitasking player in disease. FEBS J. 2019;286(15):2830‐2869. [DOI] [PubMed] [Google Scholar]
- 15. Decaris ML, Li KW, Emson CL, et al. Identifying nonalcoholic fatty liver disease patients with active fibrosis by measuring extracellular matrix remodeling rates in tissue and blood. Hepatology. 2017;651:78‐88. [DOI] [PMC free article] [PubMed] [Google Scholar]
- 16. Henegar C, Tordjman J, Achard V, et al. Adipose tissue transcriptomic signature highlights the pathological relevance of extracellular matrix in human obesity. Genome Biol. 2008;91:R14. [DOI] [PMC free article] [PubMed] [Google Scholar]
- 17. Vila IK, Badin PM, Marques MA, et al. Immune cell toll‐like receptor 4 mediates the development of obesity‐ and endotoxemia‐associated adipose tissue fibrosis. Cell Rep. 2014;74:1116‐1129. [DOI] [PubMed] [Google Scholar]
- 18. Yamashita Y, Nakada S, Yoshihara T, et al. Perlecan, a heparan sulfate proteoglycan, regulates systemic metabolism with dynamic changes in adipose tissue and skeletal muscle. Sci Rep. 2018;81:7766. [DOI] [PMC free article] [PubMed] [Google Scholar]
- 19. Wolff G, Taranko AE, Meln I, et al. Diet‐dependent function of the extracellular matrix proteoglycan Lumican in obesity and glucose homeostasis. Mol Metab. 2019;19:97‐106. [DOI] [PMC free article] [PubMed] [Google Scholar]
- 20. Xu S, Zhang X, Liu P. Lipid droplet proteins and metabolic diseases. Biochim Biophys Acta Mol Basis Dis. 2018;18645Pt:B:1968‐1983. [DOI] [PubMed] [Google Scholar]
- 21. Konige M, Wang H, Sztalryd C. Role of adipose specific lipid droplet proteins in maintaining whole body energy homeostasis. Biochim Biophys Acta. 2014;18423:393‐401. [DOI] [PMC free article] [PubMed] [Google Scholar]
- 22. Pulido MR, Diaz‐Ruiz A, Jimenez‐Gomez Y, et al. Rab18 dynamics in adipocytes in relation to lipogenesis, lipolysis and obesity. PLoS ONE. 2011;67:e22931. [DOI] [PMC free article] [PubMed] [Google Scholar]
- 23. Tinahones FJ, Coin‐Araguez L, Mayas MD, et al. Obesity‐associated insulin resistance is correlated to adipose tissue vascular endothelial growth factors and metalloproteinase levels. BMC Physiol. 2012;12:4. [DOI] [PMC free article] [PubMed] [Google Scholar]
- 24. Diaz‐Ruiz A, Guzman‐Ruiz R, Moreno NR, et al. Proteasome dysfunction associated to oxidative stress and proteotoxicity in adipocytes compromises insulin sensitivity in human obesity. Antioxid Redox Signal. 2015;237:597‐612. [DOI] [PMC free article] [PubMed] [Google Scholar]
- 25. American Diabetes A . 2. Classification and diagnosis of diabetes: standards of medical care in diabetes‐2019. Diabetes Care. 2019;42(Suppl 1):S13‐S28. [DOI] [PubMed] [Google Scholar]
- 26. Moreno‐Castellanos N, Rodriguez A, Rabanal‐Ruiz Y, et al. The cytoskeletal protein septin 11 is associated with human obesity and is involved in adipocyte lipid storage and metabolism. Diabetologia. 2017;602:324‐335. [DOI] [PubMed] [Google Scholar]
- 27. Yamamoto T, Matsuda Y, Kawahara K, Ishiwata T, Naito Z. Secreted 70kDa lumican stimulates growth and inhibits invasion of human pancreatic cancer. Cancer Lett. 2012;3201:31‐39. [DOI] [PubMed] [Google Scholar]
- 28. Moreno‐Castellanos N, Guzman‐Ruiz R, Cano DA, et al. The effects of bariatric surgery‐induced weight loss on adipose tissue in morbidly obese women depends on the initial metabolic status. Obes Surg. 2016;268:1757‐1767. [DOI] [PubMed] [Google Scholar]
- 29. Rodriguez A, Gomez‐Ambrosi J, Catalan V, et al. The ghrelin O‐acyltransferase‐ghrelin system reduces TNF‐alpha‐induced apoptosis and autophagy in human visceral adipocytes. Diabetologia. 2012;5511:3038‐3050. [DOI] [PubMed] [Google Scholar]
- 30. Divoux A, Tordjman J, Lacasa D, et al. Fibrosis in human adipose tissue: composition, distribution, and link with lipid metabolism and fat mass loss. Diabetes. 2010;5911:2817‐2825. [DOI] [PMC free article] [PubMed] [Google Scholar]
- 31. Lakra R, Kiran MS, Sai KP. Fabrication of homobifunctional crosslinker stabilized collagen for biomedical application. Biomed Mater. 2015;106:065015. [DOI] [PubMed] [Google Scholar]
- 32. Guzman‐Ruiz R, Ortega F, Rodriguez A, et al. Alarmin high‐mobility group B1 (HMGB1) is regulated in human adipocytes in insulin resistance and influences insulin secretion in beta‐cells. Int J Obes (Lond). 2014;3812:1545‐1554. [DOI] [PubMed] [Google Scholar]
- 33. Khan T, Muise ES, Iyengar P, et al. Metabolic dysregulation and adipose tissue fibrosis: role of collagen VI. Mol Cell Biol. 2009;296:1575‐1591. [DOI] [PMC free article] [PubMed] [Google Scholar]
- 34. Pasarica M, Gowronska‐Kozak B, Burk D, et al. Adipose tissue collagen VI in obesity. J Clin Endocrinol Metab. 2009;9412:5155‐5162. [DOI] [PMC free article] [PubMed] [Google Scholar]
- 35. Dankel SN, Svard J, Mattha S, et al. COL6A3 expression in adipocytes associates with insulin resistance and depends on PPARgamma and adipocyte size. Obesity (Silver Spring). 2014;228:1807‐1813. [DOI] [PubMed] [Google Scholar]
- 36. Brezillon S, Pietraszek K, Maquart FX, Wegrowski Y. Lumican effects in the control of tumour progression and their links with metalloproteinases and integrins. FEBS J. 2013;28010:2369‐2381. [DOI] [PubMed] [Google Scholar]
- 37. Zeltz C, Gullberg D. The integrin‐collagen connection–a glue for tissue repair? J Cell Sci. 2016;1294:653‐664. [DOI] [PubMed] [Google Scholar]
- 38. Williams AS, Kang L, Wasserman DH. The extracellular matrix and insulin resistance. Trends Endocrinol Metab. 2015;267:357‐366. [DOI] [PMC free article] [PubMed] [Google Scholar]
- 39. Muir LA, Neeley CK, Meyer KA, et al. Adipose tissue fibrosis, hypertrophy, and hyperplasia: correlations with diabetes in human obesity. Obesity (Silver Spring). 2016;243:597‐605. [DOI] [PMC free article] [PubMed] [Google Scholar]
- 40. Lackey DE, Burk DH, Ali MR, et al. Contributions of adipose tissue architectural and tensile properties toward defining healthy and unhealthy obesity. Am J Physiol Endocrinol Metab. 2014;3063:E233‐E246. [DOI] [PMC free article] [PubMed] [Google Scholar]
- 41. Vakaloglou KM, Chrysanthis G, Rapsomaniki MA, Lygerou Z, Zervas CG. IPP complex reinforces adhesion by relaying tension‐dependent signals to inhibit integrin turnover. Cell Rep. 2016;1411:2668‐2682. [DOI] [PubMed] [Google Scholar]
- 42. Zong H, Bastie CC, Xu J, et al. Insulin resistance in striated muscle‐specific integrin receptor beta1‐deficient mice. J Biol Chem. 2009;2847:4679‐4688. [DOI] [PMC free article] [PubMed] [Google Scholar]
- 43. Krishnan A, Li X, Kao WY, et al. Lumican, an extracellular matrix proteoglycan, is a novel requisite for hepatic fibrosis. Lab Invest. 2012;9212:1712‐1725. [DOI] [PMC free article] [PubMed] [Google Scholar]
- 44. Muller MP, Goody RS. Molecular control of Rab activity by GEFs, GAPs and GDI. Small GTPases. 2018;91(2):5‐21. [DOI] [PMC free article] [PubMed] [Google Scholar]
- 45. Lamber EP, Siedenburg AC, Barr FA. Rab regulation by GEFs and GAPs during membrane traffic. Curr Opin Cell Biol. 2019;59:34‐39. [DOI] [PubMed] [Google Scholar]
- 46. Gavriljuk K, Itzen A, Goody RS, Gerwert K, Kotting C. Membrane extraction of Rab proteins by GDP dissociation inhibitor characterized using attenuated total reflection infrared spectroscopy. Proc Natl Acad Sci USA. 2013;11033:13380‐13385. [DOI] [PMC free article] [PubMed] [Google Scholar]
- 47. Gray JL, von Delft F, Brennan P. Targeting the small GTPase superfamily through their regulatory proteins. Angew Chem Int Ed Engl. 2019;59:6342‐6366. [DOI] [PMC free article] [PubMed] [Google Scholar]
- 48. Zhen Y, Stenmark H. Cellular functions of Rab GTPases at a glance. J Cell Sci. 2015;12817:3171‐3176. [DOI] [PubMed] [Google Scholar]
- 49. Dejgaard SY, Presley JF. New method for quantitation of lipid droplet volume from light microscopic images with an application to determination of PAT protein density on the droplet surface. J Histochem Cytochem. 2018;666:447‐465. [DOI] [PMC free article] [PubMed] [Google Scholar]
- 50. Sugiura A, McLelland GL, Fon EA, McBride HM. A new pathway for mitochondrial quality control: mitochondrial‐derived vesicles. EMBO J. 2014;3319:2142‐2156. [DOI] [PMC free article] [PubMed] [Google Scholar]
- 51. Faerch K, Vaag A, Holst JJ, Glumer C, Pedersen O, Borch‐Johnsen K. Impaired fasting glycaemia vs impaired glucose tolerance: similar impairment of pancreatic alpha and beta cell function but differential roles of incretin hormones and insulin action. Diabetologia. 2008;515:853‐861. [DOI] [PubMed] [Google Scholar]
Associated Data
This section collects any data citations, data availability statements, or supplementary materials included in this article.
Supplementary Materials
Fig S1‐S5
Table S1‐2
Table S3
Table S4
Table S5