

Abstract
Objective
Different studies have demonstrated that neutrophil extracellular traps (NETs) may be involved in the pathophysiology of both antineutrophil cytoplasmic antibody (ANCA)–associated vasculitis (AAV) and systemic lupus erythematosus (SLE). AAV and SLE are clinically and pathologically divergent autoimmune diseases with different autoantibodies. However, the respective autoantigens recognized in AAV and SLE have been shown to be an intricate part of NETs. This study aimed to examine whether the mechanisms of NET formation and the composition of NETs are distinct between AAV and SLE.
Methods
To investigate this hypothesis, healthy neutrophils were stimulated with serum from patients with AAV (n = 80) and patients with SLE (n = 59), and the mechanisms of NET formation and NET composition were compared.
Results
Both patients with AAV and patients with SLE had excessive NET formation, which correlated with the extent of disease activity (in AAV r = 0.5, P < 0.0001; in SLE r = 0.35, P < 0.01). Lytic NET formation over several hours was observed in patients with AAV, as compared to rapid (within minutes), non‐lytic NET formation coinciding with clustering of neutrophils in patients with SLE. AAV‐induced NET formation was triggered independent of IgG ANCAs, whereas SLE immune complexes (ICx) induced NET formation through Fcγ receptor signaling. AAV‐induced NET formation was dependent on reactive oxygen species and peptidyl arginine deaminases, and AAV‐induced NETs were enriched for citrullinated histones (mean ± SEM 23 ± 2%). In contrast, SLE‐induced NETs had immunogenic properties, including binding with high mobility group box chromosomal protein 1 (mean ± SEM 30 ± 3%) and enrichment for oxidized mitochondrial DNA, and were involved in ICx formation.
Conclusion
The morphologic features, kinetics, induction pathways, and composition of excessive NET formation are all intrinsically distinct in AAV compared to SLE. Recognizing the diversity of NET formation between AAV and SLE provides a better understanding of the pathophysiologic role of NETs in these different autoimmune diseases.
Introduction
Antineutrophil cytoplasmic antibody (ANCA)–associated vasculitis (AAV). and systemic lupus erythematosus (SLE) are both life‐threatening systemic autoimmune diseases. These patients are distinguished by their clinical phenotypes, histopathology, and autoantibody profiles. Patients with AAV display ANCAs against myeloperoxidase (MPO) or proteinase 3 (PR3), whereas patients with SLE develop diverse autoantibodies against nuclear autoantigens (ANAs) 1, 2. Typically, renal involvement in AAV manifests as a pauci‐immune, crescentic glomerulonephritis (GN), while in SLE, a “full house” proliferative GN is seen.
A growing body of evidence indicates that neutrophil extracellular traps (NETs) may have an important role in the pathogenesis of both AAV and SLE 3, 4, 5, 6, 7, 8, 9, 10, 11, 12, 13. NETs are immunogenic 5 and toxic 13, 14 extracellular DNA structures released by neutrophils that contain a pool of autoantigens relevant for both AAV and SLE 15, 16. NET‐derived DNA complexed with danger‐associated molecular patterns, such as LL‐37 4, 5 or high mobility group box chromosomal protein 1 (HMGB‐1) 4, converts the NET DNA to potent immunogenic structures 4. Indeed, NETs were demonstrated to activate plasmacytoid dendritic cells 4 and autoreactive B cells in vitro 17, which resulted in the production of interferon‐α (IFNα) and autoantibodies, respectively. Furthermore, NETs also have direct cytotoxic effects on (glomerular) endothelial cells 18, mediated by histones 13, 18 and MPO 14, which, in a murine model, was found to lead to severe, crescentic GN 19. In addition, murine plasmacytoid dendritic cells loaded with NET‐derived DNA led to the production of both ANAs and ANCAs 11. Taken together, these findings provide ample evidence to indicate that NETs have the capability of inducing autoimmunity related to both AAV and SLE.
In clinical studies, we and others have demonstrated that excessive NET formation or impaired NET degradation is present both in patients with active AAV 3, 7, 20, 21 and in patients with severe SLE 4, 5, 8, 12, 17, 22, 23, and this is correlated with the severity of disease activity. Thus, preclinical and clinical studies have demonstrated an important role for NETs in the pathogenesis of both AAV and SLE. However, as both diseases are divergent clinical and histologic entities, we hypothesized that excessive NET formation should have a different pathophysiologic role in each disease. The present study addressed this hypothesis by characterizing the quantitative, qualitative, and immunologic properties of NET formation in a direct comparison of AAV and SLE patients.
Patients and Methods
Study population
Serum samples were collected from 80 patients with ANCA‐positive AAV who met the classification criteria for vasculitis according to the Chapel Hill Consensus Conference definitions 24, and 59 patients with ANA‐positive SLE who met the American College of Rheumatology 1997 updated classification criteria for SLE 25. The patients were followed up at the Lupus‐, Vasculitis‐, and Complement‐mediated Systemic Autoimmune Diseases outpatient clinic (LuVaCs) at Leiden University Medical Center (LUMC). All patients consented to participate in the LUMC biobank. Clinical data were extracted from the patients’ electronic records at the time of the collection of the serum sample. The control group consisted of 29 healthy subjects who consented to participate in the LUMC healthy donor biobank. Both biobanking studies were approved by the local ethics committee at LUMC. The characteristics of the patients and healthy controls are summarized in Supplementary Table 1, and an extended methods section is provided in Supplementary Patients and Methods (available on the Arthritis & Rheumatology web site at http://onlinelibrary.wiley.com/doi/10.1002/art.41047/abstract).
Preparation of neutrophils
Ficoll‐amidotrizoaat (LUMC) was used to isolate neutrophils from 20 ml of whole blood obtained from a healthy donor and collected in EDTA‐coated tubes. Cell isolation was carried out using density gradient centrifugation followed by erythrocyte lysis with sterilized water at 4°C. The neutrophils were then labeled with 2 μM PKH (Sigma‐Aldrich) for all NET quantification experiments or 2.5 μM MitoSox Red (Thermo‐Fisher Scientific) for immunofluorescence microscopy experiments. Thereafter, the neutrophils were stimulated for 4 hours (or as otherwise indicated) with 10% serum, IgG‐depleted serum, 250 μg/ml or 25 μg/ml isolated IgG from healthy controls or patients with AAV or SLE, or IgG derived from intravenous immunoglobulin (Sanquin) in phenol red–free RPMI 1640 medium–2% fetal calf serum (FCS) (Life Technologies), to induce NET formation. Details on the methods used for IgG depletion and separation are provided in Supplementary Patients and Methods (http://onlinelibrary.wiley.com/doi/10.1002/art.41047/abstract). When immobilized IgG was used, 10 μg/ml IgG was coated overnight at 4°C in a 96‐well Falcon plate, after which the neutrophils were incubated in the wells.
Quantification of ex vivo NET formation
NET formation was quantified using an approach previously described by our group 26, 27. Briefly, PKH‐labeled neutrophils were plated in a 96‐well culture plate (Falcon) at 37,500 cells per well in phenol red–free RPMI 1640 medium (Life Technologies) supplemented with 2% heat‐inactivated FCS. After 3.75 hours of stimulation, 1 μM Sytox green, an impermeable DNA dye (Thermo‐Fisher Scientific), was added for 15 minutes, and the neutrophils were then fixed with 4% paraformaldehyde (Added Pharma).
NETs were then visualized and quantified by confocal laser scanning microscopy using an automated BD Biosciences Pathway 855 apparatus, as described previously by our group, or an Image Xpress Micro confocal microscopy device (Molecular Devices). Further details on the NET quantification, live‐cell imaging, and inhibition experiments are described in Supplementary Patients and Methods (http://onlinelibrary.wiley.com/doi/10.1002/art.41047/abstract). Per well, the total amount of NET formation was quantified as the cumulative area of Sytox green staining corrected for the number of neutrophils (as reflected by the mean area of PKH26‐labeled cells). In addition, the mean NET size per image and mean size of the PKH‐labeled cell area, as a reflection of clustering of neutrophils, were each analyzed and quantified. For comparison of values between different experiments, the fold increase in NET area as compared to the mean NET area per imaged neutrophil from 3 normal human serum control samples was calculated for each sample in each experiment.
Immunofluorescence staining of NETs
Healthy neutrophils were seeded onto chambered coverslips (ibiTreat; Ibidi), and NET formation was induced as described previously. For each staining, at least 3 different SLE and AAV serum samples were used. Slides were stained with antibodies to detect NET‐related proteins and immunoglobulins. Details are described in Supplementary Patients and Methods (http://onlinelibrary.wiley.com/doi/10.1002/art.41047/abstract). The area of colocalization of NET‐related proteins and DNA was quantified with ImageJ software, through a colocalization macro in which the colocalization area of the NET‐related protein (stained with Alexa Fluor 488) and DNA (stained with Hoechst dye) was measured. The percentage colocalization per NET marker was calculated as the colocalization area divided by the total area of DNA.
Statistical analysis
Data on NET formation are expressed as the median (interquartile range [IQR]) area of NET formation per imaged neutrophil or as the fold induction relative to the mean value from 3 normal human serum control samples per experiment. NET formation ratios are expressed as the mean ± SEM. Colocalization data are expressed as the mean ± SEM. Statistically significant differences between 2 groups were determined with the Mann‐Whitney U test, and Wilcoxon's matched pairs test was used for paired serum samples. Pearson's r was used for statistical correlation tests. All statistical analyses were performed with GraphPad software.
Results
Lytic NET formation in AAV versus non‐lytic NET formation in SLE
We have previously demonstrated that serum from both AAV patients and SLE patients can induce excessive NET formation in healthy neutrophils 20, 22, 26. We therefore performed a side‐by‐side quantitative comparison of 2 large cohorts of patients with ANCA‐positive AAV (n = 80) and patients with ANA‐positive SLE (n = 59). We observed that both AAV and SLE patient sera induced excessive NET formation as compared to that in the serum from healthy controls (each P < 0.0001) (Figure 1A). Furthermore, excessive NET formation was significantly higher in patients with AAV compared to patients with SLE (median NET area per neutrophil 1.29 [IQR 0.58–3.38] versus 0.77 [IQR 0.33–1.50]; P = 0.02).
Figure 1.

Lytic neutrophil extracellular trap (NET) formation in patients with antineutrophil cytoplasmic antibody–associated vasculitis (AAV) compared to non‐lytic NET formation in patients with systemic lupus erythematosus (SLE). A, Ex vivo NET formation was measured in the serum of 80 patients with AAV, 59 patients with SLE, and 29 healthy controls (HCs), using a highly sensitive NET quantification assay (see ref. 26). Symbols represent the NET area per imaged neutrophil in each sample; horizontal lines show the median. B, Representative confocal microscopy images show the results of the NET quantification assay in PKH‐labeled and Sytox green–stained neutrophils. Original magnification × 10; bar = 20 μm. C, Live‐cell imaging shows representative examples of AAV‐ and SLE‐induced NET formation over time (for full movies, see Supplementary Movies 1, 2, and 3 [http://onlinelibrary.wiley.com/doi/10.1002/art.41047/abstract]). Original magnification × 20; bar = 20 μm. D and E, In patients with AAV, the correlation of NET formation with disease activity as measured by the Birmingham Vasculitis Activity Score (BVAS) was assessed (D), and NET formation was compared between AAV patients with a BVAS of 0 and those with a BVAS of >0 (E). F and G, In patients with SLE, the correlation of NET formation with disease activity as measured by the SLE Disease Activity Index (SLEDAI) was assessed (F), and NET formation was compared between SLE patients with a SLEDAI score of <4 and those with a SLEDAI score of ≥4 (G). Symbols represent individual samples; horizontal lines show the median. Statistical correlations were assessed using Pearson's r test. * = P < 0.05; **** = P < 0.0001 by Mann‐Whitney U test.
The quantitative difference between AAV‐induced NET formation and SLE‐induced NET formation was associated with a differing morphologic appearance. In AAV, large areas of DNA with interconnected DNA stretches were observed, whereas in SLE, small clusters of “NET‐ting” neutrophils were typically seen around extracellular DNA (Figure 1B).
To further investigate the observed morphologic differences between AAV‐induced and SLE‐induced NETs, we performed live‐cell imaging to assess the morphologic features over time (Figure 1C and Supplementary Movies[Link], [Link], [Link], available on the Arthritis & Rheumatology web site at http://onlinelibrary.wiley.com/doi/10.1002/art.41047/abstract). We observed that AAV‐induced NETs were characterized by a lytic expulsion of extracellular DNA strands, which occurred from 1–2 hours onward (see Movie 1). In contrast, SLE‐induced NET formation was characterized by clustering of neutrophils within minutes, and the neutrophils released NETs without visible neutrophil lysis and with maintenance of their motility (see Movie 2).
To quantify the different features of AAV‐induced NET formation compared to SLE‐induced NET formation, NETs were quantified at various time points. The results confirmed the delayed kinetics of AAV‐induced NET formation as compared to the fast kinetics of SLE‐induced NET formation (see Supplementary Figure 1, available on the Arthritis & Rheumatology web site at http://onlinelibrary.wiley.com/doi/10.1002/art.41047/abstract).
In addition, the morphologic appearance of AAV‐induced NET formation was compared to that of SLE‐induced NET formation in a subset of patient's sera. The size of individual AAV‐induced NETs (median 1.1 × 106 pixels [IQR 0.8 × 10⁶–1.2 × 10⁶]) was significantly larger than that of individual SLE‐induced NETs (median 0.7 × 106 pixels [IQR 0.5 × 10⁶–0.9 × 10⁶]; P < 0.0001) (see Supplementary Figure 2A, available on the Arthritis & Rheumatology web site at http://onlinelibrary.wiley.com/doi/10.1002/art.41047/abstract). Furthermore, the size of the neutrophil (PKH) area was significantly larger for SLE‐induced NETs (see Supplementary Figure 2B [http://onlinelibrary.wiley.com/doi/10.1002/art.41047/abstract]), reflecting the typical phenomenon of neutrophil clustering in SLE.
In patients with AAV, NET formation correlated moderately with the extent of disease activity measured by the Birmingham Vasculitis Activity Score (BVAS) (r = 0.5, P < 0.0001) (Figure 1D). Of interest, NET formation in AAV patients with active disease (BVAS >0) was significantly higher compared to AAV patients without active disease (BVAS 0) (median NET area per neutrophil 2.5 [IQR 0.9–8.4] versus 1.2 [IQR 0.5–3.2]; P = 0.02) (Figure 1E). In patients with SLE, NET formation correlated weakly with the extent of disease activity measured by the SLE Disease Activity Index (SLEDAI) (r = 0.35, P < 0.01) (Figure 1F). Of interest, NET formation was significantly higher in SLE patients with high disease activity (SLEDAI score >4) compared to SLE patients with low disease activity (SLEDAI score ≤4) (median NET area per neutrophil 1.2 [IQR 0.5–1.9] versus 0.5 [IQR 0.3–1.0]; P = 0.02) (Figure 1G).
Triggering of NET formation by SLE immune complexes (ICx) in an Fcγ receptor (FcγR)–dependent manner, but lack of effect of IgG ANCAs in AAV serum
Recently, our group demonstrated that AAV‐induced NET formation occurred in a manner independent of IgG ANCAs 20, whereas SLE‐specific autoantibodies were reported to induce NET formation 4. We therefore further corroborated the involvement of autoantibodies in a direct comparison of AAV‐induced and SLE‐induced NET formation. Detailed information on the selected patient serum samples are included in Supplementary Patients and Methods (http://onlinelibrary.wiley.com/doi/10.1002/art.41047/abstract). Complete depletion of IgG did not lead to a reduction in NET formation in cultures with AAV patient serum (mean ± SEM ratio 1.29 ± 0.33; P = 0.74). In contrast, upon IgG depletion, a significant reduction in SLE‐induced NET formation was observed (mean ± SEM ratio 0.53 ± 0.19; P = 0.049) (Figures 2A and B).
Figure 2.

NET formation is triggered by SLE immune complexes (ICx) in an Fcγ receptor (FcγR)–dependent manner, but not by antineutrophil cytoplasmic antibody (ANCA IgG). A, IgG levels were compared before and after depletion of IgG from the serum of patients with ANCA‐positive AAV (n = 14) and patients with antinuclear antibody–positive SLE (n = 10). IgG was depleted by protein G–agarose beads. B, Ex vivo NET formation in IgG‐depleted patient serum was measured. Results are the mean ± SEM ratio compared to NET formation in the whole serum (broken horizontal line). C, Ex vivo NET formation in the presence of isolated soluble IgG from patient serum was measured. Results are the mean ± SEM fold increase relative to NET formation in the presence of soluble IgG from HC serum (n = 6) (broken horizontal line). D, Ex vivo NET formation in the presence of immobilized IgG from patient serum or intravenous immunoglobulin (IVIG) was measured. Results are the mean ± SEM fold increase compared to NET formation in the presence of immobilized IgG from HC serum (n = 6) (broken horizontal line). E, Ex vivo NET formation was measured after FcγR signaling blockade by the Syk inhibitor R406. Results are the mean ± SEM ratio compared to untreated neutrophils stimulated with the same serum sample (broken horizontal line); representative data from 3 experiments are shown. * = P < 0.05; ** = P < 0.01 by Mann‐Whitney U test. med = medium (see Figure 1 for other definitions).
Surprisingly, NET formation could not be restored with the addition of soluble IgG isolated from either AAV or SLE patient serum (Figure 2C). However, immobilized IgG, mimicking ICx, significantly restored NET formation in cultures with SLE patient serum (mean ± SEM fold induction 8.77 ± 1.99; P < 0.001 versus healthy controls), but not in cultures with IgG derived from AAV patient serum (mean ± SEM fold induction 2.73 ± 1.03; P = 0.1 versus healthy controls) (Figure 2D).
To further study the signaling cascade of ICx‐induced NET formation, the spleen tyrosine kinase (Syk) inhibitor R406, an inhibitor of IgG‐mediated activation of FcγR signaling 28, was employed. After inhibition of Syk, only NET formation induced by SLE patient serum was diminished (mean ± SEM ratio 0.53 ± 0.17; P = 0.04), whereas NET formation induced by AAV patient serum was unaffected by the Syk inhibitor (mean ± SEM ratio 1.30 ± 0.18; P = 0.09) (Figure 2E). Taken together, these data demonstrate that SLE ICx induce excessive NET formation through, at least partially, FcγR signaling, whereas AAV‐induced NET formation occurs independent of IgG ANCAs.
Enrichment of citrullinated histone 3 (CitH3) on AAV‐induced NETs and exclusive presence of HMGB‐1 on SLE‐induced NETs
Because the morphologic features, kinetics, and triggers of NET formation were different between AAV and SLE, we next compared the composition of NETs, by investigating the presence of NET‐associated proteins. AAV‐induced NETs were significantly enriched for CitH3 29 (P < 0.0001) (Figures 3A and F). In contrast, SLE‐induced NETs were significantly enriched for neutrophil elastase (P < 0.0001) (Figures 3B and F) and exclusively contained HMGB‐1 (P < 0.0001) (Figures 3C and F). On unstimulated neutrophils, CitH3, neutrophil elastase, and HMGB‐1 were absent (Figures 3A–C), whereas MPO and PR3 were present (Figures 3D and E).
Figure 3.
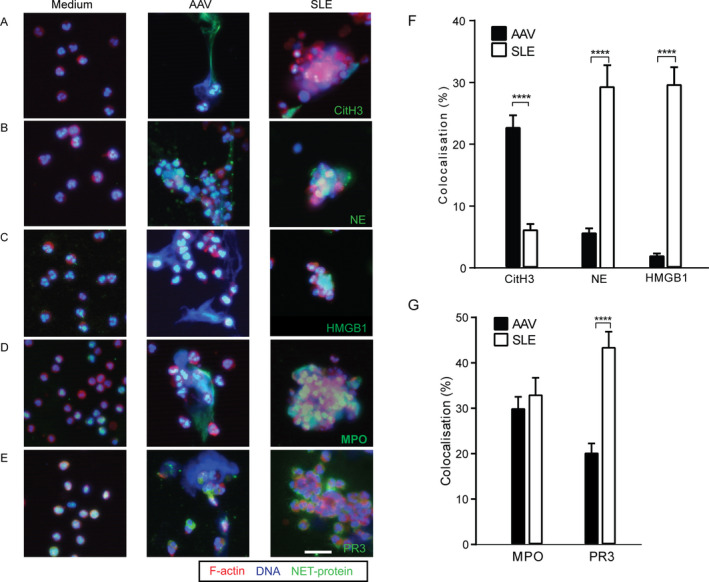
Citrullinated histone 3 (CitH3) is enriched on AAV‐induced NETs, whereas high mobility group box chromosomal protein 1 (HMGB‐1) is exclusively present on SLE‐induced NETs. A–E, Immunofluorescence staining was used to assess NET‐related proteins on AAV‐induced and SLE‐induced NETs. Representative overlay images show the presence of CitH3 (A), neutrophil elastase (NE) (B), HMGB‐1 (C), myeloperoxidase (MPO) (D), and proteinase 3 (PR3) (E) on unstimulated neutrophils (Medium) compared to AAV‐induced and SLE‐induced NETs. Cells were stained for F‐actin (phalloidin red), DNA (Hoechst blue), and different NET‐related proteins (green). Original magnification × 20; bar = 20 μm. F and G, The percentage colocalization of CitH3, neutrophil elastase, and HMGB‐1 (F) and MPO and PR3 (G) was determined on DNA from AAV‐induced and SLE‐induced NETs. Results are the mean ± SEM. **** = P < 0.0001 by Mann‐Whitney U test. See Figure 1 for other definitions.
MPO was found both on AAV‐induced NETs and on SLE‐induced NETs, whereas PR3 was localized on the cell membrane of SLE NET‐ting neutrophils (Figures 3D, E, and G). Taken together, these data demonstrate that NET‐related proteins are different on AAV‐induced NETs compared to SLE‐induced NETs.
Binding of immunoglobulins to SLE‐induced NETs, implicating NETs as a substrate for ICx
Because many of the above‐mentioned NET‐related proteins are potential sources of autoantigens for disease‐relevant autoantibodies, we next investigated whether NETs are substrates for ICx. We therefore investigated the presence of AAV and SLE autoantibodies on AAV‐ and SLE‐induced NETs (Figures 4A and B). On AAV‐induced NETs, colocalization of IgG was a mean ± SEM 2.4 ± 0.63%, whereas colocalization of IgM was 9.9 ± 2.5% and IgA was 0 ± 0% (Figures 4A and C). In comparison, on SLE‐induced NETs, the colocalization of IgG (mean ± SEM 33.3 ± 3.6%; P < 0.0001), IgM (26 ± 3.3%; P < 0.0001), and IgA (6.7 ± 1.4%; P < 0.0001) was significantly higher (Figures 4B and C). These data provide evidence of the binding of SLE‐related autoantibodies to NETs, suggesting that SLE‐induced NETs are capable of formation of ICx. In contrast, in AAV‐induced NETs, there was a paucity of immunoglobulin binding to NETs.
Figure 4.

Immunoglobulins bind to SLE‐induced NETs, implicating NETs as a substrate for immune complexes. The potential binding of serum autoantibodies from patients with AAV (n = 4) and patients with SLE (n = 3) to AAV‐ and SLE‐induced NETs was studied by immunofluorescence staining of IgG, IgM, or IgA. A and B, Representative images show IgG, IgM, and IgA autoantibody binding on AAV‐induced NETs (A) and SLE‐induced NETs (B). Original magnification × 20; bars = 20 μm. C, The percentage colocalization of IgG, IgM, and IgA on AAV‐induced and SLE‐induced NETs was determined. Results are the mean ± SEM percentage of total DNA area. **** = P < 0.0001 by Mann‐Whitney U test. < = not detectable (see Figure 1 for other definitions).
Enrichment of oxidized mitochondrial DNA (mtDNA) in SLE‐induced NETs
Oxidized mtDNA has previously been shown to enhance IFN responses in SLE through the cyclic GMP‐AMP synthase/stimulator of IFN genes (cGAS/STING) pathway, supporting a critical role of mtDNA in the pathogenesis of autoimmunity in SLE 10. We therefore assessed the presence of mtDNA in AAV‐ and SLE‐induced NETs by quantifying the colocalization of TOMM20 (a marker of the mitochondrial outer membrane protein) and MitoSOX Red (a red fluorescent indicator of specific binding to mitochondria after oxidation) as markers of (oxidized) mtDNA (Figure 5A). TOMM20 colocalization was significantly lower on AAV‐induced NETs (mean ± SEM 1.7 ± 1.5%) compared to SLE‐induced NETs (7.0 ± 1.3%; P < 0.001) (Figure 5B). Similarly, MitoSOX colocalization was significantly lower on AAV‐induced NETs compared to SLE‐induced NETs (mean ± SEM 0.8 ± 0.2% versus 4.2 ± 0.8%; P < 0.001) (Figure 5C). Thus, TOMM20 and MitoSOX were both significantly enriched on SLE‐induced NETs but were virtually absent on AAV‐induced NETs, thereby confirming that SLE‐induced NETs are enriched for oxidized mtDNA.
Figure 5.

Oxidized mitochondrial DNA is enriched in SLE‐induced NETs compared to AAV‐induced NETs. A, Immunofluorescence microscopy analysis of unstimulated neutrophils (Medium), AAV‐induced NETs, and SLE‐induced NETs was carried out with MitoSOX Red labeling of the neutrophils after staining for TOMM20 (green) and DNA (Hoechst blue). Representative images are shown. Original magnification × 20; bar = 20 μm. B and C, The percentage colocalization of TOMM20 (B) and MitoSOX Red (C) was determined on NETs. Results are the mean ± SEM percentage of total DNA area per image. *** = P < 0.001 by Mann‐Whitney U test. < = not detectable (see Figure 1 for other definitions).
Differing molecular pathways of NET formation in AAV and SLE
To get further insight into the mechanisms of AAV‐ and SLE‐induced NET formation, different canonical pathways of NET formation were studied. AAV‐induced NET formation was significantly decreased by chloramidine, an inhibitor of peptidyl arginine deaminase (PAD) enzymes (mean ± SEM ratio 0.63 ± 0.09; P = 0.03), whereas SLE‐induced NET formation remained unaffected by this PAD inhibitor (mean ± SEM ratio 1.4 ± 0.39; P = 0.58) (Figure 6A). As a consequence of PAD inhibition, the presence of CitH3 became undetectable on both AAV‐ and SLE‐induced NETs (Figure 6B).
Figure 6.

The regulators of NET formation differ between AAV and SLE. A, AAV‐induced and SLE‐induced NET formation was quantified after peptidyl arginine deaminase (PAD) inhibition with 200 μM chloramidine (Cl‐amidine), a pan‐PAD inhibitor. Results are the mean ± SEM ratio of NET formation before and after PAD inhibition in serum from patients with AAV (n = 6) and patients with SLE (n = 8) as compared to its paired control serum sample (broken horizontal line). B, Representative immunofluorescence images show PKH‐labeled neutrophils (red), DNA (Hoechst blue), and citrullinated histone 3 (CitH3) colocalization (green) on AAV‐ and SLE‐induced NETs with and without PAD inhibition by Cl‐amidine. Original magnification × 20; bar = 20 μm. C, AAV‐induced and SLE‐induced NET formation was quantified after NADPH oxidase inhibition with 1 μM diphenyleneiodonium (DPI). Results are the mean ± SEM ratio of NET formation before and after NAPDH oxidase inhibition in serum from patients with AAV (n = 10) and patients with SLE (n = 9) as compared to its paired control serum sample (broken horizontal line). * = P < 0.05; ** = P < 0.01 by Wilcoxon's matched pairs test. See Figure 1 for other definitions.
AAV‐induced NET formation was also significantly decreased after inhibition of NADPH oxidase by diphenyleneiodonium (DPI) (mean ± SEM ratio 0.29 ± 0.08; P = 0.002), whereas SLE‐induced NET formation remained unaffected by this DPI inhibitor (mean ± SEM ratio 0.86 ± 0.19; P = 0.5) (Figure 6C). Therefore, taken together, these findings indicate that excessive NET formation in AAV, but not in SLE, is dependent on PAD enzymes and NADPH oxidase.
Discussion
In separate studies, NETs have been reported to play a role in the pathophysiology of both AAV and SLE, although each is a clinically distinct systemic autoimmune disease 3, 4. The present study is the first to directly compare the characteristics of ex vivo NET formation induced by serum from patients with AAV to that induced by serum from patients with SLE. We were able to confirm that both patients with AAV and patients with SLE displayed excessive NET formation, and that this was correlated with the extent of disease activity. Most importantly, we demonstrated that AAV and SLE induce 2 distinct forms of NET formation, based on morphology, kinetics, triggers, and pathways. In AAV, an IgG‐independent lytic expulsion of NETs containing citrullinated histones, and involving PAD enzymes and NADPH oxidase, was observed. In contrast, in SLE, a non‐lytic, ICx‐induced NET formation was observed, with concomitant clustering of neutrophils independent of PAD enzymes and NADPH oxidase. In addition, SLE‐induced NETs had immunogenic properties, including enrichment for HMGB‐1 and oxidized mtDNA, and the ability to form ICx, all of which were not observed in AAV‐induced NETs. Taken together, our findings show that the differences in ex vivo NET formation between AAV and SLE, reflecting lytic versus non‐lytic NET formation, respectively, and the distinct characteristics of NETs in each disease are indicative of the versatile role of NETs in the pathophysiology of AAV and SLE.
Mainly 2 processes of NET formation have recently been described, lytic and non‐lytic NET formation, which is also referred to as “suicidal” and “vital” NET formation, respectively, and primarily depends on the type of stimulus used 6, 30. Typically, lytic NET formation depends on NADPH oxidase, takes a few hours, and involves recruitment of pore‐forming units to disrupt the plasma membrane 31. It can be induced by phorbol 12‐myristate 13‐acetate (PMA) (a robust chemical compound) 32, specific microorganisms 33, and crystals 34. In contrast, non‐lytic NET formation is typically induced within minutes, and can be triggered by lipopolysaccharide (LPS) 33, specific bacterial products 35, Toll‐like receptor 4 (TLR‐4)–activated platelets 33, or complement proteins together with TLR‐2 ligands 36 and SLE‐specific ICx. Non‐lytic NET formation can be independent of NADPH oxidase 30, 33, 35, 37, but some studies have shown that NADPH oxidase can be involved 10, 36. Importantly, the plasma membrane is not disrupted and NETs are released via vesicular transport while remaining viable, and typically contain oxidized mtDNA 10, 35, 36.
These pivotal features of lytic and non‐lytic NET formation corresponded to the properties of NET formation respectively observed on AAV‐ and SLE‐induced NETs 6. AAV‐induced NET formation is accompanied by neutrophil lysis after more than 1 hour, and depends on NADPH oxidase, indicative of a lytic form of NET formation 30. Even though we demonstrated that AAV‐induced NET formation was independent of IgG ANCAs, the exact factors in AAV serum that trigger NET formation remain unknown. In a previous study, our group showed that neither IgA depletion nor C5 blockade affected AAV‐induced NET formation, and there was no correlation with the serum levels of tumor necrosis factor (TNF), interleukin‐8, or C‐reactive protein 20. Interestingly, the necroptosis pathway was recently demonstrated to be involved in ANCA‐mediated NET formation 13. Necroptosis can be induced by various triggers, including TNF, LPS, TLRs 1/2, 3, 4, and 7/8, and different chemical, toxic, and viral factors 38. In addition, Heeringa et al suggested that other complement factors, such as C3a, could contribute to NET formation in AAV 39, which points toward the notion that there may be multifactorial triggers for lytic NET formation in the serum of AAV patients.
In comparison, SLE‐induced NETs display features of non‐lytic NET formation, referring to the rapid extrusion of NETs enriched with oxidized mtDNA within minutes, independent of NADPH oxidase. Of note, the involvement of NADPH oxidase in non‐lytic NET formation is still under debate 10, 36. A cumulating number of studies have suggested that the trigger to induce NET formation in SLE deserves important considerations. Highly purified ICx generated from isolated anti‐RNP autoantibodies mixed with its substrate, snRNP (small nuclear RNP), can induce NETs in a manner that is dependent on NADPH oxidase 10. The characteristics of these “pure” RNP ICx, which are distinct from the heterogenous autoantibodies and ICx derived from SLE patient serum investigated in the present study, likely explain the discrepancy with regard to whether or not NADPH oxidase is involved. Indeed, our finding of NADPH oxidase–independent formation of NETs in SLE was recently confirmed by others in studies that utilized a novel method for discriminating between NADPH oxidase–dependent and –independent NET formation 37.
Importantly, the viability of the neutrophils stimulated with SLE patient serum in our study could be confirmed by our observations of their persistent motility, leading to neutrophil clustering, and the lack of observable plasma membrane lysis 35, 40. Taken together, the results of the present study directly comparing NET formation between AAV and SLE provide further evidence that AAV‐ and SLE‐induced NETs have important and distinct immunologic characteristics.
Previous studies have shown that certain features of NETs play a pathogenic role in AAV and SLE. Studies in murine models revealed that NET‐derived histones can cause crescentic GN. Crescentic GN is typically seen in AAV 3, 19, emphasizing the relevance of the currently reported observation that citrullinated histones are predominantly found on AAV‐induced NETs, implicating their contribution to the renal pathophysiology of AAV 13, 41. Another relevant feature was the detection of HMGB‐1 on SLE‐induced NETs. HMGB‐1 facilitates the endosomal uptake of self DNA via the receptor for advanced glycation end products/TLR‐9 pathway 42, which is an important premise for the formation of anti‐DNA autoantibodies, as demonstrated in nonautoimmune mice, in which HMGB‐1–nucleosome complexes induced anti–double‐stranded DNA responses in a TLR‐2–dependent manner 43. Therefore, the presence of HMGB‐1 on SLE‐induced NETs indicated the ability of SLE‐specific NET–derived extracellular DNA to be taken up, intracellularly processed, and presented as a relevant autoantigen in SLE 11. Moreover, previous studies have demonstrated that NET‐bound SLE autoantibodies and C1q resulted in activation of the classical and lectin complement pathways 12, while AAV‐induced NETs activated the alternative pathway of the complement system 13, 41.
Furthermore, SLE‐induced NETs were also enriched for oxidized mtDNA, which augment their potential to induce a proinflammatory type I IFN response via the cGAS/STING pathway 10. Importantly, SLE NETs are enriched for mtDNA, but do not solely consist of mtDNA. This was supported by the finding that “NET‐ting” neutrophils containing LL37–DNA complexes, implying that they were chromosomal NETs, could activate autoreactive B cells in lupus 17. SLE‐induced NETs were demonstrated to contribute to ICx formation and, as such, can be implicated in the renal pathology of SLE. Indeed, the typical histopathologic finding in lupus nephritis is that of a “full house” GN detected by immunofluorescence, indicating that deposition of ICx and complement activation have occurred.
The direct comparison of ex vivo NET formation between AAV and SLE in the present study reveals several interesting observations. First, the clustering of neutrophils observed in SLE‐induced NET formation is not new to the field. The SLE serum–induced clustering of neutrophils was demonstrated as far back as 1990, and this was found to be dependent on C1q‐containing ICx and correlated with SLE disease activity, which preceded the discovery of NETs in 2004 44, 45. Interestingly, we demonstrated that in both AAV patients and SLE patients, excessive NET formation was associated with active disease. However, in AAV and SLE patients during times of disease remission, the levels of NET formation were heterogeneous. It is possible that excessive NET formation in these patients who were without active disease could be an indication of the potential for a future disease relapse.
Second, citrullination appeared to be not essential for NET formation in both patients with AAV and patients with SLE, which is consistent with previous observations that confirmed the independence of PAD4, i.e., citrullination, for the formation of NETs in humans 46, 47. These observations are in contrast to those in studies that demonstrated the involvement of PAD enzymes in murine lupus 48, 49, 50. It is noteworthy that in those studies, NET formation was induced with calcium ionophores 48, PMA 49, 50, or imiquimod 48, and NET quantification was based on CitH3 positivity. Importantly, PMA‐induced NET formation is truly independent of PAD enzymes, while calcium ionophore–induced NET formation is completely dependent on PAD enzymes 47. Furthermore, it needs to be taken into account that PAD inhibition will prevent histone citrullination of NETs, resulting in CitH3‐negative NETs 46, 47. Conversely, in a murine model of lupus in MRL.Faslpr mice, lupus and proliferative nephritis were not affected by PAD4 inhibition 51.
Third, we confirmed that CitH3, generally reported as a key marker of NETs 14, 29, is a highly specific NET marker, since it was absent on healthy and necrotic neutrophils (data not shown). However, CitH3 was not a sensitive marker, as illustrated by the high load of NET‐derived DNA that did not colocalize with CitH3. Similarly, the sensitivity of MPO, but not its specificity, as a NET marker was demonstrated in our study. Taken together, these data indicate that careful considerations should be made when identifying neutrophil‐derived extracellular DNA as NETs, which cannot be easily disentangled from necrosis 52.
Moreover, we noted the paucity of immunoglobulin binding on AAV‐induced NETs, while several AAV‐ and SLE‐relevant autoantigens, as detected by immunohistochemistry using monoclonal antibodies, were present on NETs (Figure 3). These data do not prove that the presence of these autoantigens on NETs is actually relevant, because it is well‐known that in vivo autoantibodies detected in AAV and SLE patients are heterogenous and polyclonal. Indeed, previous studies have investigated anti‐NET antibodies in AAV, although it remains uncertain as to whether these anti‐NET antibodies were the same as ANCAs 3, 7. Of note, it is important to realize that these studies reported on antibodies reacting with PMA‐induced NETs, which might be unrelated to either in vivo or ex vivo NET formation in humans. Previously, it was demonstrated that neutrophil‐derived MPO and NETs were prominently deposited in the glomerular, periglomerular, and tubulointerstitial regions of kidney biopsy tissue from patients with MPO‐specific AAV 14. On the other hand, it is known that ANCA‐associated GN is typically a crescentic, pauci‐immune GN, implying that there are no deposits of autoantibodies or complement in the kidney. Thus, despite the abundant presence of MPO, anti‐MPO ANCAs were not abundantly detected, which does support our findings. Alternatively, we speculate that the paucity of immunoglobulins on AAV‐induced NETs could be related to the serum concentration of ANCAs as compared to the concentrations of the monoclonal antibodies used for immunohistochemistry. Unfortunately, we were unable to investigate whether epitope variation could also explain this observation.
There are some limitations to our study that need to be acknowledged. First, we used a relatively novel method to quantify NET formation, which has an intrinsically high interassay variability due to the use of freshly isolated neutrophils from healthy subjects each time 20, but simultaneously has several advantages compared to currently reported assays 20, 26, 52. To minimize variability in the present study, AAV and SLE sera were tested simultaneously within the same experiments.
Another potential limitation of this assay is the use of neutrophils from healthy donors instead of neutrophils from AAV or SLE patients. However, we have demonstrated previously that spontaneous NET release by AAV‐derived neutrophils was not significantly different from spontaneous NET release by healthy neutrophils. More importantly, AAV‐induced NET formation by neutrophils derived from healthy donors was also not significantly different from NET formation by neutrophils derived from AAV patients 20. Similar results were obtained for neutrophils derived from SLE patients (data not shown).
Second, regarding the results of our immunohistochemical studies of NET‐associated proteins, we were unable to dissect whether the colocalization of NET‐associated proteins either originated from the serum or were derived from the neutrophils.
In conclusion, this study provides compelling support for the observation that NET formation in AAV and SLE are disease‐specific processes, with each encompassing their own unique properties and implications for the distinct pathophysiology of AAV and SLE. These excessively formed NETs in AAV and SLE have distinct features and depend on intrinsically distinct processes, thereby implicating a unique role for NETs in each separate autoimmune disease. Thus, the recognition of the diversity of NET formation in systemic autoimmune diseases has important implications when evaluating NET as a potential therapeutic target.
Author Contributions
All authors were involved in drafting the article or revising it critically for important intellectual content, and all authors approved the final version to be published. Dr. Teng had full access to all of the data in the study and takes responsibility for the integrity of the data and the accuracy of the data analysis.
Study conception and design
van Dam, Kraaij, Bakker, Scherer, Rabelink, van Kooten, Teng.
Acquisition of data
van Dam, Kraaij, Kamerling.
Analysis and interpretation of data
van Dam, Kraaij, Scherer, van Kooten, Teng.
Supporting information
Acknowledgments
We thank our consortium collaborators, Prof. D. Isenberg and Prof. R. E. Voll, for giving valuable feedback on the manuscript. We would like to acknowledge the support of Prof. C. Pusey (Renal and Vascular Inflammation Section, Department of Medicine, Imperial College, London, UK) during the preparatory work leading to this study and for providing us with R406. We thank Drs. C. van Alem (Nephrology, LUMC Leiden, The Netherlands) for her expertise on ImageJ analysis. We thank Dr. A. Ioan‐Facsinay (Rheumatology, LUMC, Leiden, The Netherlands) for providing access to the healthy donor biobank.
Supported by a FOREUM research grant, grants from the Dutch Kidney Foundation (KJPB12.028 and 17OKG04), and a Clinical Fellowship from the Netherlands Organization for Scientific Research (90713460).
Drs. van Dam and Kraaij contributed equally to this work.
No potential conflicts of interest relevant to this article were reported.
References
- 1. Jennette JC, Wilkman AS, Falk RJ. Anti‐neutrophil cytoplasmic autoantibody‐associated glomerulonephritis and vasculitis. Am J Pathol 1989;135:921–30. [PMC free article] [PubMed] [Google Scholar]
- 2. D'Cruz DP, Khamashta MA, Hughes GR. Systemic lupus erythematosus. Lancet 2007;369:587–96. [DOI] [PubMed] [Google Scholar]
- 3. Kessenbrock K, Krumbholz M, Schönermarck U, Back W, Gross WL, Werb Z, et al. Netting neutrophils in autoimmune small‐vessel vasculitis. Nat Med 2009;15:623–5. [DOI] [PMC free article] [PubMed] [Google Scholar]
- 4. Garcia‐Romo GS, Caielli S, Vega B, Connolly J, Allantaz F, Xu Z, et al. Netting neutrophils are major inducers of type I IFN production in pediatric systemic lupus erythematosus. Sci Transl Med 2011;3:73ra20. [DOI] [PMC free article] [PubMed] [Google Scholar]
- 5. Lande R, Ganguly D, Facchinetti V, Frasca L, Conrad C, Gregorio J, et al. Neutrophils activate plasmacytoid dendritic cells by releasing self‐DNA‐peptide complexes in systemic lupus erythematosus. Sci Transl Med 2011;3:73ra19. [DOI] [PMC free article] [PubMed] [Google Scholar]
- 6. Jorch SK, Kubes P. An emerging role for neutrophil extracellular traps in noninfectious disease. Nat Med 2017;23:279–87. [DOI] [PubMed] [Google Scholar]
- 7. Nakazawa D, Shida H, Tomaru U, Yoshida M, Nishio S, Atsumi T, et al. Enhanced formation and disordered regulation of NETs in myeloperoxidase‐ANCA‐associated microscopic polyangiitis. J Am Soc Nephrol 2014;25:990–7. [DOI] [PMC free article] [PubMed] [Google Scholar]
- 8. Hakkim A, Fürnrohr BG, Amann K, Laube B, Abed UA, Brinkmann V, et al. Impairment of neutrophil extracellular trap degradation is associated with lupus nephritis. Proc Natl Acad Sci U S A 2010;107:9813–8. [DOI] [PMC free article] [PubMed] [Google Scholar]
- 9. Söderberg D, Kurz T, Motamedi A, Hellmark T, Eriksson P, Segelmark M. Increased levels of neutrophil extracellular trap remnants in the circulation of patients with small vessel vasculitis, but an inverse correlation to anti‐neutrophil cytoplasmic antibodies during remission. Rheumatology (Oxford) 2015;54:2085–94. [DOI] [PubMed] [Google Scholar]
- 10. Lood C, Blanco LP, Purmalek MM, Carmona‐Rivera C, De Ravin SS, Smith CK, et al. Neutrophil extracellular traps enriched in oxidized mitochondrial DNA are interferogenic and contribute to lupus‐like disease. Nat Med 2016;22:146–53. [DOI] [PMC free article] [PubMed] [Google Scholar]
- 11. Sangaletti S, Tripodo C, Chiodoni C, Guarnotta C, Cappetti B, Casalini P, et al. Neutrophil extracellular traps mediate transfer of cytoplasmic neutrophil antigens to myeloid dendritic cells toward ANCA induction and associated autoimmunity. Blood 2012;120:3007–18. [DOI] [PubMed] [Google Scholar]
- 12. Leffler J, Martin M, Gullstrand B, Tydén H, Lood C, Truedsson L, et al. Neutrophil extracellular traps that are not degraded in systemic lupus erythematosus activate complement exacerbating the disease. J Immunol 2012;188:3522–31. [DOI] [PubMed] [Google Scholar]
- 13. Schreiber A, Rousselle A, Becker JU, von Mässenhausen A, Linkermann A, Kettritz R. Necroptosis controls NET generation and mediates complement activation, endothelial damage, and autoimmune vasculitis. Proc Natl Acad Sci U S A 2017;114:E9618–25. [DOI] [PMC free article] [PubMed] [Google Scholar]
- 14. O'Sullivan KM, Lo CY, Summers SA, Elgass KD, McMillan PJ, Longano A, et al. Renal participation of myeloperoxidase in antineutrophil cytoplasmic antibody (ANCA)‐associated glomerulonephritis. Kidney Int 2015;88:1030–46. [DOI] [PubMed] [Google Scholar]
- 15. Yaniv G, Twig G, Shor DB, Furer A, Sherer Y, Mozes O, et al. A volcanic explosion of autoantibodies in systemic lupus erythematosus: a diversity of 180 different antibodies found in SLE patients. Autoimmun Rev 2015;14:75–9. [DOI] [PubMed] [Google Scholar]
- 16. Urban CF, Ermert D, Schmid M, Abu‐Abed U, Goosmann C, Nacken W, et al. Neutrophil extracellular traps contain calprotectin, a cytosolic protein complex involved in host defense against Candida albicans. PLoS Pathog 2009;5:e1000639. [DOI] [PMC free article] [PubMed] [Google Scholar]
- 17. Gestermann N, Di Domizio J, Lande R, Demaria O, Frasca L, Feldmeyer L, et al. Netting neutrophils activate autoreactive B cells in lupus. J Immunol 2018;200:3364–71. [DOI] [PubMed] [Google Scholar]
- 18. Saffarzadeh M, Juenemann C, Queisser MA, Lochnit G, Barreto G, Galuska SP, et al. Neutrophil extracellular traps directly induce epithelial and endothelial cell death: a predominant role of histones. PLoS One 2012;7:e32366. [DOI] [PMC free article] [PubMed] [Google Scholar]
- 19. Kumar SV, Kulkarni OP, Mulay SR, Darisipudi MN, Romoli S, Thomasova D, et al. Neutrophil extracellular trap‐related extracellular histones cause vascular necrosis in severe GN. J Am Soc Nephrol 2015;26:2399–413. [DOI] [PMC free article] [PubMed] [Google Scholar]
- 20. Kraaij T, Kamerling SW, van Dam LS, Bakker JA, Bajema IM, Page T, et al. Excessive neutrophil extracellular trap formation in ANCA‐associated vasculitis is independent of ANCA. Kidney Int 2018;94:139–49. [DOI] [PubMed] [Google Scholar]
- 21. Yoshida M, Sasaki M, Sugisaki K, Yamaguchi Y, Yamada M. Neutrophil extracellular trap components in fibrinoid necrosis of the kidney with myeloperoxidase‐ANCA‐associated vasculitis. Clin Kidney J 2013;6:308–12. [DOI] [PMC free article] [PubMed] [Google Scholar]
- 22. Kraaij T, Kamerling SW, de Rooij EN, van Daele PL, Bredewold OW, Bakker JA, et al. The NET‐effect of combining rituximab with belimumab in severe systemic lupus erythematosus. J Autoimmun 2018;91:45–54. [DOI] [PubMed] [Google Scholar]
- 23. Van der Linden M, van den Hoogen LL, Westerlaken GH, Fritsch‐Stork RD, van Roon JA, Radstake TR, et al. Neutrophil extracellular trap release is associated with antinuclear antibodies in systemic lupus erythematosus and anti‐phospholipid syndrome. Rheumatology (Oxford) 2018. E‐pub ahead of print. [DOI] [PubMed] [Google Scholar]
- 24. Jennette JC, Falk RJ, Andrassy K, Bacon PA, Churg J, Gross WL, et al. Nomenclature of systemic vasculitides: proposal of an international consensus conference. Arthritis Rheum 1994;37:187–92. [DOI] [PubMed] [Google Scholar]
- 25. Hochberg MC, for the Diagnostic and Therapeutic Criteria Committee of the American College of Rheumatology . Updating the American College of Rheumatology revised criteria for the classification of systemic lupus erythematosus [letter]. Arthritis Rheum 1997;40:1725. [DOI] [PubMed] [Google Scholar]
- 26. Kraaij T, Tengström FC, Kamerling SW, Pusey CD, Scherer HU, Toes RE, et al. A novel method for high‐throughput detection and quantification of neutrophil extracellular traps reveals ROS‐independent NET release with immune complexes. Autoimmun Rev 2016;15:577–84. [DOI] [PubMed] [Google Scholar]
- 27. Arends EJ, van Dam LS, Kraaij T, Kamerling SW, Rabelink TJ, van Kooten C, et al. A high‐throughput assay to assess and quantify neutrophil extracellular trap formation. J Vis Exp 2019;e59150. [DOI] [PubMed] [Google Scholar]
- 28. Braselmann S, Taylor V, Zhao H, Wang S, Sylvain C, Baluom M, et al. R406, an orally available spleen tyrosine kinase inhibitor blocks Fc receptor signaling and reduces immune complex‐mediated inflammation. J Pharmacol Exp Ther 2006;319:998–1008. [DOI] [PubMed] [Google Scholar]
- 29. Wang Y, Li M, Stadler S, Correll S, Li P, Wang D, et al. Histone hypercitrullination mediates chromatin decondensation and neutrophil extracellular trap formation. J Cell Biol 2009;184:205–13. [DOI] [PMC free article] [PubMed] [Google Scholar]
- 30. Yipp BG, Kubes P. NETosis: how vital is it? Blood 2013;122:2784–94. [DOI] [PubMed] [Google Scholar]
- 31. Fuchs TA, Abed U, Goosmann C, Hurwitz R, Schulze I, Wahn V, et al. Novel cell death program leads to neutrophil extracellular traps. J Cell Biol 2007;176:231–41. [DOI] [PMC free article] [PubMed] [Google Scholar]
- 32. Brinkmann V, Reichard U, Goosmann C, Fauler B, Uhlemann Y, Weiss DS, et al. Neutrophil extracellular traps kill bacteria. Science 2004;303:1532–5. [DOI] [PubMed] [Google Scholar]
- 33. Pieterse E, Rother N, Yanginlar C, Hilbrands LB, van der Vlag J. Neutrophils discriminate between lipopolysaccharides of different bacterial sources and selectively release neutrophil extracellular traps. Front Immunol 2016;7:484. [DOI] [PMC free article] [PubMed] [Google Scholar]
- 34. Desai J, Kumar SV, Mulay SR, Konrad L, Romoli S, Schauer C, et al. PMA and crystal‐induced neutrophil extracellular trap formation involves RIPK1‐RIPK3‐MLKL signaling. Eur J Immunol 2016;46:223–9. [DOI] [PubMed] [Google Scholar]
- 35. Pilsczek FH, Salina D, Poon KK, Fahey C, Yipp BG, Sibley CD, et al. A novel mechanism of rapid nuclear neutrophil extracellular trap formation in response to Staphylococcus aureus. J Immunol 2010;185:7413–25. [DOI] [PubMed] [Google Scholar]
- 36. Yousefi S, Mihalache C, Kozlowski E, Schmid I, Simon HU. Viable neutrophils release mitochondrial DNA to form neutrophil extracellular traps. Cell Death Differ 2009;16:1438–44. [DOI] [PubMed] [Google Scholar]
- 37. Pieterse E, Rother N, Yanginlar C, Gerretsen J, Boeltz S, Munoz LE, et al. Cleaved N‐terminal histone tails distinguish between NADPH oxidase (NOX)‐dependent and NOX‐independent pathways of neutrophil extracellular trap formation. Ann Rheum Dis 2018;77:1790–8. [DOI] [PubMed] [Google Scholar]
- 38. Vanden Berghe T, Hassannia B, Vandenabeele P. An outline of necrosome triggers. Cell Mol Life Sci 2016;73:2137–52. [DOI] [PMC free article] [PubMed] [Google Scholar]
- 39. Heeringa P, Rutgers A, Kallenberg CG. The net effect of ANCA on neutrophil extracellular trap formation. Kidney Int 2018;94:14–6. [DOI] [PubMed] [Google Scholar]
- 40. Yipp BG, Petri B, Salina D, Jenne CN, Scott BN, Zbytnuik LD, et al. Infection‐induced NETosis is a dynamic process involving neutrophil multitasking in vivo. Nat Med 2012;18:1386–93. [DOI] [PMC free article] [PubMed] [Google Scholar]
- 41. Wang H, Wang C, Zhao MH, Chen M. Neutrophil extracellular traps can activate alternative complement pathways. Clin Exp Immunol 2015;181:518–27. [DOI] [PMC free article] [PubMed] [Google Scholar]
- 42. Tian J, Avalos AM, Mao SY, Chen B, Senthil K, Wu H, et al. Toll‐like receptor 9‐dependent activation by DNA‐containing immune complexes is mediated by HMGB1 and RAGE. Nat Immunol 2007;8:487–96. [DOI] [PubMed] [Google Scholar]
- 43. Urbonaviciute V, Fürnrohr BG, Meister S, Munoz L, Heyder P, De Marchis F, et al. Induction of inflammatory and immune responses by HMGB1‐nucleosome complexes: implications for the pathogenesis of SLE. J Exp Med 2008;205:3007–18. [DOI] [PMC free article] [PubMed] [Google Scholar]
- 44. Sturfelt G, Jonsson H, Hellmer G, Sjöholm AG. Clustering of neutrophil leucocytes in serum: possible role of C1q‐containing immune complexes. Clin Exp Immunol 1993;93:237–41. [DOI] [PMC free article] [PubMed] [Google Scholar]
- 45. Jonsson H, Sturfelt G. A novel assay for neutrophil clustering activity of human sera: relation to disease activity and neutropenia in systemic lupus erythematosus. Ann Rheum Dis 1990;49:46–50. [DOI] [PMC free article] [PubMed] [Google Scholar]
- 46. Konig MF, Andrade F. A critical reappraisal of neutrophil extracellular traps and NETosis mimics based on differential requirements for protein citrullination. Front Immunol 2016;7:461. [DOI] [PMC free article] [PubMed] [Google Scholar]
- 47. Kenny EF, Herzig A, Krüger R, Muth A, Mondal S, Thompson PR, et al. Diverse stimuli engage different neutrophil extracellular trap pathways. eLife 2017;6:e24437. [DOI] [PMC free article] [PubMed] [Google Scholar]
- 48. Liu Y, Lightfoot YL, Seto N, Carmona‐Rivera C, Moore E, Goel R, et al. Peptidylarginine deiminases 2 and 4 modulate innate and adaptive immune responses in TLR‐7‐dependent lupus. JCI Insight 2018;3:124729. [DOI] [PMC free article] [PubMed] [Google Scholar]
- 49. Knight JS, Subramanian V, O'Dell AA, Yalavarthi S, Zhao W, Smith CK, et al. Peptidylarginine deiminase inhibition disrupts NET formation and protects against kidney, skin and vascular disease in lupus‐prone MRL/lpr mice. Ann Rheum Dis 2015;74:2199–206. [DOI] [PMC free article] [PubMed] [Google Scholar]
- 50. Knight JS, Zhao W, Luo W, Subramanian V, O'Dell AA, Yalavarthi S, et al. Peptidylarginine deiminase inhibition is immunomodulatory and vasculoprotective in murine lupus. J Clin Invest 2013;123:2981–93. [DOI] [PMC free article] [PubMed] [Google Scholar]
- 51. Gordon RA, Herter JM, Rosetti F, Campbell AM, Nishi H, Kashgarian M, et al. Lupus and proliferative nephritis are PAD4 independent in murine models. JCI Insight 2017;2:92926. [DOI] [PMC free article] [PubMed] [Google Scholar]
- 52. Masuda S, Nakazawa D, Shida H, Miyoshi A, Kusunoki Y, Tomaru U, et al. NETosis markers: quest for specific, objective, and quantitative markers. Clinica Chim Acta 2016;459:89–93. [DOI] [PubMed] [Google Scholar]
Associated Data
This section collects any data citations, data availability statements, or supplementary materials included in this article.
Supplementary Materials