

Abstract
Progress in the systemic control of osteosarcoma has been limited over the past decades thus indicating the urgent clinical need for the development of novel treatment strategies. Therefore, we have recently developed new preclinical models to study promising novel agents for the treatment of pediatric osteosarcoma. The checkpoint kinase (chk) inhibitor prexasertib (LY2606368) and its salt form (LSN2940930) have recently been shown to be active in adult and pediatric malignancies, including sarcoma. We have now tested the potency of prexasertib in clonogenic survival assays in two new lines of primary patient‐derived osteosarcoma cells and in two established osteosarcoma cell lines as a single agent and in combination with cisplatin and the poly ADP‐ribose polymerase (PARP) inhibitor talazoparib. Prexasertib alone results in strongly reduced clonogenic survival at low nanomolar concentrations and acts by affecting cell cycle progression, induction of apoptosis and induction of double‐stranded DNA breakage at concentrations that are well below clinically tolerable and safe plasma concentrations. In combination with cisplatin and talazoparib, prexasertib acts in a synergistic fashion. Chk1 inhibition by prexasertib and its combination with the DNA damaging agent cisplatin and the PARP‐inhibitor talazoparib thus emerges as a potential new treatment option for pediatric osteosarcoma which will now have to be tested in preclinical primary patient derived in vivo models and clinical studies.
Keywords: prexasertib, chk1 inhibitor, checkpoint kinase 1, osteosarcoma, apoptosis
Short abstract
What's new?
Treatment options and outcomes for osteosarcoma have changed very little in decades. New treatment strategies are thus urgently needed. In this study, the authors found that the checkpoint inhibitor ‘prexasertib’ increased apoptosis and DNA damage in patient‐derived osteosarcoma cells, at very low concentrations. In addition, when combined with cisplatin and talazoparib, prexasertib acted in a synergistic fashion. This drug thus represents a promising therapeutic candidate for further preclinical and clinical development in osteosarcoma.
Abbreviations
- ATCC
American Type Culture Collection
- BRCA1
breast cancer 1
- BRCA2
breast cancer 2
- Chk1
checkpoint kinase 1
- Chk2
checkpoint kinase 2
- DDR
DNA damage response
- DMSO
dimethylsulfoxid
- DSB
double‐stranded DNA breakage
- FCS
fetal calf serum
- IC50
half‐maximal inhibitory concentration
- NEAA
nonessential amino acid
- OS
osteosarcoma
- PARP
poly ADP‐ribose polymerase
- PBS
phosphate‐buffered saline
- DAPI
4′,6‐diamidin‐2‐phenylindol
- PE
plating efficiency
- RIPA
radioimmunoprecipitation assay
- SCLC
small cell lung cancer
- SD
standard deviation
- SF
survival fraction
Introduction
Osteosarcoma is the most common primary malignant bone tumor in children, adolescents and young adults. The current standard therapy includes neoadjuvant and adjuvant chemotherapy combined with surgical removal of the primary tumor and clinically evident metastases.1
The outcome of patients with osteosarcoma has increased from about 10%, with surgical tumor resection alone, to 60–75% with the introduction of chemotherapy in the 1970s.2 Unfortunately, there has been almost no further improvement of patient survival rates over the last decades.1, 3, 4 As patients with metastatic disease remain to have a particularly poor outcome,5, 6 there is an urgent clinical need to discover and develop new potent and effective systemic agents for the treatment of osteosarcoma.
Recently, a subtype of osteosarcoma has been defined by its BRCA‐like signature of gene expression indicating that agents that target the DNA damage response (DDR) represent promising compounds.7, 8
Chk1 is a serine/threonine kinase that plays a vital role in regulating the DDR and the cell cycle progression of cells.9 Therefore, agents that target the DDR represent promising compounds for osteosarcoma treatment.
Activation of Chk1, a key regulator of intra‐S and G2‐M checkpoints, prevents cells with damaged DNA from proceeding through the cell cycle and entering mitosis by activating DNA damage checkpoints and/or leading to cell death.10
Tumor cells with increased levels of Chk1 gain the ability to tolerate higher levels of DNA damage, which may be leading to resistance to DNA damaging agents.11 By inhibiting Chk1, cancer cells become unable to repair damaged DNA and undergo increased replicative stress leading to double stranded DNA breakage, rendering them more sensitive to chemotherapeutic agents and leading to increased cell death.12
Inhibition of Chk1 therefore does not only cause increased DNA damage but allows the damaged cells to proceed from S to G2/M phase and finally prematurely into mitosis, despite DNA damage, leading to cell death.10, 13
Therefore, Chk1 inhibitors have been a focus in the search for novel agents for the treatment of various malignancies including sarcomas.12, 14, 15
In this work, we have focused on prexasertib (LY2606368) a small molecule Chk1 inhibitor, which has recently been reported to be active in neuroblastoma,16 ovarian cancer,17 head and neck squamous cell carcinoma18 and B‐ and T‐cell lymphoblastic leukemia.19
In preclinical models, prexasertib has been described to promote extensive DNA damage in adult carcinoma and leukemia cell lines, leading to early mitosis and cell death through induction of replication catastrophe.13, 20
However, it is unknown if prexasertib is active in primary patient‐derived osteosarcoma cells.
Prexasertib induced Chk1 inhibition has been reported to effectively potentiate the activity of cisplatin.20
Furthermore, osteosarcomas7 have been shown to carry mutation profiles and expression patterns similar to breast and ovarian cancers with mutations of BRCA.7 Such “BRCAness” sensitizes cancer cells to poly ADP‐ribose polymerase (PARP) inhibition21 and also Chk1 inhibitors,8 possibly in a synergistic fashion.14 In this project, we leveraged on our previously established primary tumor cell lines that we had generated from primary tumors through orthotopic xenotransplantation in immunodeficient mice22 and assessed the activity of Chk1 inhibition by prexasertib alone or in combination with cisplatin and the PARP‐inhibitor talozoparib.
Materials and Methods
Cells and cell culture
The osteosarcoma cell lines KHOS‐240S (ATCC® CRL‐1545™; RRID:CVCL_2544) and SAOS‐2 (ATCC® HTB‐85™; RRID:CVCL_0548) were obtained through American Type Culture Collection (ATCC). We have previously established the primary patient‐derived osteosarcoma cell lines OSRH‐2011/5 and OSKG through orthotopic xenotransplantation in immunodeficient mice of original tumor tissue obtained from a 17‐year‐old female and a 12‐year‐old male patient with osteosarcoma, respectively.22 Molecular profiling of these lines confirmed the almost complete genetic identity of these lines with the primary tumors.22 All human cell lines have been authenticated using STR or SNP profiling. 3T3 fibroblasts were used as feeder‐cells for the primary cell line OSKG. Both of the primary cell lines OSRH‐2011/5 and OSKG as well as the KHOS‐240S were cultivated in DMEM medium (Biochrom GmbH, Berlin, Germany) supplemented with 10% fetal calf serum (FCS; Biochrom, Cambridge, UK), 1% Penicillin/Streptomycin (Gibco® by Life Technologies™, Carlsbad, CA) and 1% nonessential amino acids (NEAA; Gibco®). The SAOS‐2 cell line was cultivated in McCoy's 5A medium (Gibco®) supplemented with 15% FCS (Biochrom) and 1% Penicillin/Streptomycin (Gibco®). The 3 T3 cell line was cultivated in DMEM medium supplemented with 10% FCS (Biochrom) and 1% Penicillin/Streptomycin. All experiments were performed with mycoplasma‐free cells. All cell lines were cultivated in tissue‐culture flasks under sterile conditions and kept in a humidified incubator at 37°C and 6% CO2.
Chemotherapy agents
Prexasertib (LY2606368) mesylate monohydrate (LSN2940930; hereafter referred to as “prexasertib”) was obtained from Eli Lilly and Company (Indianapolis, IN) or from BioVision, Inc. (Milpitas, CA) and dissolved in DMSO at a stock concentration of 10 mM and stored at −20°C until usage.
Cisplatin (Accord Healthcare GmbH, Freilassing, Germany) was dissolved at a concentration of 1 mg/ml in 0.9% sodium chloride and was kept refrigerated for a maximum of 7 days. It was protected from light while being stored.
Talazoparib (BMN 673) was obtained from Selleckchem (Munich, Germany), dissolved in DMSO at a stock concentration of 10 mM and stored at −80°C.
All agents were diluted to the required concentrations in cell culture medium before being used.
Clonogenic survival assay
Clonogenic survival assays enabled us to simultaneously analyze the proliferation of cells and the ability of single cells to produce progeny (forming a colony ≥50 cells).23, 24 The details of the method have been described previously.23, 24
In brief, we plated 200 (KHOS‐240S), 400 (OSRH‐2011/5), 600 (OSKG) and 1,000 (SAOS‐2) cells and allowed these to fully attach before being treated with different concentrations of prexasertib mesylate monohydrate (LSN2940930). For assessing the effect of combination treatment with cisplatin or talazoparib, we plated the cells and allowed them to fully attach before being treated with the prexasertib IC50 (2 nM for OSRH‐2011/5 and 6.5 nM for OSKG) and different concentrations of cisplatin or talazoparib (BMN 673).
For each experiment, three biological replicates were used. In all clonogenic survival assays, DMSO‐treated cells were used as negative controls. In experiments performed with the primary patient‐derived cell line OSKG, 3T3 Fibroblasts were irradiated with a total dose of 60 Gy with a biological irradiator (X‐RAD 320, Precision X‐RAY INC. N. Branford, CT) and 2 × 10⁴ cells were added as feeder‐cell‐layer to support colony formation. Cells were allowed to grow until approximately 50–100 colonies of ≥50 cells had formed in the DMSO‐treated control. This took about 8 (KHOS‐240S), 9 (OSKG), 10 (OSRH‐2011/5) to 14 days (SAOS‐2). Colonies were fixed with acetic acid–methanol solution (1:4) and stained using 0.1% crystal violet solution at RT for 10 min. Afterward, excess dye was removed by gentle washing with water and flasks were then dried for about 2–3 days. Once fully dried, colonies were counted manually with the aid of a microscope. Plating efficiencies were calculated by the following formula: PE = [mean number of colonies counted/number of cells plated] × 100.
The surviving fraction of treated cells was calculated by setting the PE of treated cells in relation to the PE of untreated DMSO‐control cells. Each point of the survival curve represents the mean surviving fraction from three independent experiments ± SD. GraphPad Prism 7 was used to create the clonogenic survival curve.
To determine whether the drug interaction between prexasertib and cisplatin or talazoparib was additive, synergistic or antagonistic the combination index (CI) was evaluated and calculated using the Compusyn Software.25, 26 A CI value of <1 indicated a likely synergistic interaction whereas CI = 1 and CI > 1 indicated either additive or antagonistic effects between the combination partners, respectively.
Differences of survival fractions between monotherapy of prexasertib, cisplatin or talazoparib and the according combination therapy were statistically analyzed by paired Student's t‐test.
Cell‐cycle analysis and detection of apoptotic events by caspase‐3 activity
We determined cell‐cycle distribution and the induction of apoptosis by analyzing caspase‐3 activity by flow cytometry.
Equal numbers of cells were plated and incubated at 37°C and 6% CO2 for 2 hr until cells had fully attached. Cells were then treated with four different concentrations of prexasertib; including the IC50 as determined in clonogenic survival assays and a concentration nearing the average plasma level (C avg at 24 hr postinfusion) of 46.9 ng/ml reported in a phase I study of prexasertib27 of adults who were undergoing infusion treatment with prexasertib at a dose of 105 mg/m2.
At 24 and 48 hr after treatment initiation, both attached and detached cells were collected with EDTA/Trypsin (Biochrom GmbH), fixed in 4% paraformaldehyde solution (Merck KGaA) and permeabilized in ice‐cold 70% ethanol (Roth GmbH). Cells were stained with 4′,6‐diamidin‐2‐phenylindol (DAPI) solution.
For determining caspase‐3 activity, cells were incubated with a fluorescence‐coupled antibody against activated caspase‐3 (1:20, BD Pharmingen, Heidelberg, Germany) for 1 hr at room temperature and then stored on ice under protection of light until testing.
Flow cytometry was carried out on a BD LSR II Flow Cytometer (BD Biosciences, San Jose, CA), recording 10,000 events for each experimental condition. Data were analyzed with FlowJo 7.6.5 software (FlowJo LLC, Ashland, OR). The unpaired t‐test was used to evaluate differences between DMSO‐treated controls and various concentrations of prexasertib.
Analysis of DNA double‐strand breakage
We determined double‐stranded DNA breakage by seeding the primary osteosarcoma cell lines OSRH 2011/5 and OSKG and treating with prexasertib as indicated above. Both, 24 and 48 hr after treatment, cells were harvested by trypsinization, washed with PBS and then incubated with a monoclonal mouse antibody against γH2A.X (Alexa Fluor® 488 anti‐H2A.X Phospho (Ser139) Antibody—BioLegend, Inc, San Diego, CA) for 1 hr at room temperature and stored on ice. Quantification of γH2A.X was then performed by FACS analysis.
Western blot analysis
Both cell lines were plated in six‐well plates at 500,000 cells/1 ml and treated with the same four different concentrations for 24 and 48 hr, once cells had reached 70% of confluence. At the end of the treatment, cells were washed with ice‐cold PBS and lysed with RIPA buffer. The protein concentration of cell lysates was measured using a BCA Protein Assay Kit (Thermo Scientific, Waltham, MA). Proteins were separated using SDS‐PAGE gels and transferred onto nitrocellulose membranes (Millipore, Billerica, MA). Primary antibodies were incubated with the membranes overnight at 4°C with gentle shaking and secondary antibodies coupled to horseradish peroxidase (HRP) were incubated with the membranes for 2 hr at room temperature.
A primary antibody from Cell Signaling Technology was used at a manufacturer‐recommended dilution to evaluate PARP and cleaved‐PARP (#9532) expression. An anti‐β‐actin antibody (Sigma‐Aldrich, St. Louis, MO; #A1978) was included as a loading control.
Illumina sequencing
Whole exome sequencing was performed using the Illumina HiSeq platform after short insert libraries were constructed, flow cells prepared and clusters generated. Prior to sequencing, genomic regions covering human exome were enriched by bait capture (Agilent SureSelect kit version 4) and short‐insert libraries were sequenced to the average depth of 210X (IQR 35.25).
Variant detection and filtering
Raw sequencing reads were quality‐filtered (fast‐qc version 0.11.7), adapter‐trimmed, duplicate‐removed (Picard tools version 2.9) and mapped onto the hs37d5 version of the human genome (BWA mem algorithm, version 0.7). The GATK pipeline (version 3.8) was used to perform base‐quality score recalibration and variant calling. Concretely, we used the GATK haplotype caller algorithm with standard settings followed by specific filtering of variant calls to meet the following criteria: QD < 10.0, MQ > 40.0, FS < 30.0, SOR < 3.0, MQRankSum > −12.5, ReadPosRankSUm > −8.0. The resulting variants were annotated using 2018 version of ANNOVAR databases. Somatic single‐nucleotide variants were inferred from filtered unpaired variant calls using the probabilistic algorithm of Sun et al.28
Mutation spectra and mutation signatures
For each tumor, frequencies of putative somatic single‐nucleotide variants were calculated and normalized according to the 3‐mer frequencies in the reference exome (Agilent SureSelect version 4). Somatic mutation signatures were deconvoluted from mutation spectra using the Mutalisk‐implemented MLE algorithm which is based on a linear regression model.29
Copy‐number calling and “genomic scar” algorithms
Nexus Copy Number Discovery software (version 9.0) was used to identify copy‐number alterations (CNAs) from mapped sequencing data. Genomic signatures indicative of defective homologous recombination repair (HRR) were determined by two complementary CNA methods and further validated by the signature analysis of somatic single‐nucleotide somatic variants. The algorithmic specifics of CNA‐based methods are described by Popova et al.30 and Birkbak et al.31 and both analyses have been performed with standard settings.
Results
Prexasertib decreases clonogenic survival in primary patient‐derived osteosarcoma cells
We first tested the effect of prexasertib alone on clonogenic survival of established and patient‐derived osteosarcoma cell lines.
Treatment with prexasertib led to a concentration‐dependent reduction of clonogenic growth. In the established cell lines KHOS‐240S and SAOS‐2 a concentration of 1.7 nM (KHOS‐240S) and 3 nM (SAOS‐2) led to an inhibition of clonogenic survival by 50% (IC50) in comparison to DMSO‐treated control cells (Fig. 1 a). Total inhibition of colony formation (IC100) was achieved at prexasertib concentrations of 7 nM (KHOS‐240S) and 10 nM (SAOS‐2).
Figure 1.

Prexasertib reduces clonogenic survival in established and primary patient‐derived osteosarcoma cell lines. Clonogenic survival assays of the established osteosarcoma cell lines KHOS‐240S and SaOS‐2 (a) and the primary patient‐derived cell lines OSRH‐2011/5 and OSKG (b). Cells were treated with prexasertib at the indicated concentrations until approximately 50–100 colonies had formed in the DMSO‐treated control. Each point of the curve represents the mean surviving fraction compared to the DMSO‐treated negative control from three independent experiments ± SD.
The primary patient‐derived cell line OSRH‐2011/5 showed a similar response to prexasertib with an IC50 of 2 nM and complete inhibition of colony formation at 7 nM (Fig. 1 b).
In contrast, the second primary line OSKG showed a higher IC50 of 6.5 nM and an IC100 of 20 nM (Fig. 1 b). In sum, all osteosarcoma cell lines displayed exquisite sensitivity to prexasertib at low nanomolar concentrations which were well below the reported average plasma concentration of approximately 100 nM 24 hr postinfusion, which was reported to be safe and tolerable in a phase I trial of prexasertib in adult carcinoma patients.27
Prexasertib causes cell‐cycle shift in primary osteosarcoma cells
As it has been reported that prexasertib alters the cell cycle distribution in various cancer cells, such as B‐/T‐ALL and HNSCC cell lines,18, 19 we evaluated prexasertib in our primary osteosarcoma cell lines. We analyzed cell cycle by flow cytometry after treatment with prexasertib for 24 and 48 hr at various concentrations including the IC50 derived from the results of clonogenic survival assays up to a clinically achievable concentration of 100 nM.27
Both primary patient‐derived osteosarcoma cell lines showed a significant and concentration‐dependent decrease in cells in G1 after 24 and 48 hr in comparison with the DMSO‐treated control (Figs. 2 a and 2 b).
Figure 2.

Prexasertib causes shift in cell cycle distribution in primary patient‐derived osteosarcoma cells. Cell cycle distribution of primary patient‐derived osteosarcoma cell lines OSRH‐2011/5 (a) and OSKG (b) after 24 and 48 hr of treatment with the indicated concentrations of prexasertib. *p < 0.05; **p < 0.01; ***p < 0.001 in comparison to DMSO‐treated control.
In OSRH‐2011/5, there was a significant concentration‐dependent increase in cells in S‐phase after 24 hr which is known to be the phase of the cell cycle during which most DNA damage occurs13 (5 nM: p ≤ 0.028, 10 nM: p ≤ 0.008, 100 nM: p ≤ 0.0019; Fig. 2 a).
After 48 hr, the percentage of cells in S‐phase increased further in OSRH‐2011/5 cells that were treated with the highest concentration (100 nM: p ≤ 0.002). Lower concentrations (5 and 10 nM) showed a decrease of cells in S‐phase from 24 to 48 hr while cells in G2/M‐phase significantly increased, especially at 10 nM (5 nM ≤ 0.014, 10 nM ≤ 0.0002), indicating that cells progressed further through the cell cycle. OSRH‐2011/5 cells being treated with the highest concentration showed a significant decrease of G2/M‐phase at 48 hr (p ≤ 0.007).
In OSKG, after both 24 and 48 hr, we observed a significant concentration‐dependent decrease of cells in G1 across all concentrations in comparison to DMSO‐treated control cells (Fig. 2 b). For 6.5, 15 and 30 nM, we saw a significant increase of S‐phase after 24 hr (6.5 nM: p ≤ 0.02, 15 nM: p ≤ 0.003, 30 nM: p ≤ 0.049), followed by a decrease of cells in this phase from 24 to 48 hr and a significant concentration‐dependent increase of cells in the G2/M phase at these concentrations.
While at 100 nM, there was no significant difference to the DMSO‐treated control in S‐phase, we observed a significant increase in G2/M already after only 24 hr. While OSKG cells treated with lower concentrations did not show an increase in G2/M after 24 hr, there was a significant increase after 48 hr for this cell phase (6.5 nM: p ≤ 0.005, 30 nM: p ≤ 0.007, 100 nM: p ≤ 0.018) paired with a decrease of cells in the S‐phase.
These concentration‐dependent differences of the likely mechanism of inducing cell death is consistent with previous reports,18 suggesting that prexasertib may either lead to replication or to mitotic catastrophe as mechanisms of cell death. In sum, these data show that prexasertib exerts profound albeit variable effects on the cell cycle in primary osteosarcoma cells.
Prexasertib causes apoptosis in primary patient‐derived osteosarcoma cells
As it has been reported that prexasertib can increase apoptosis in cancer cell lines,13, 16, 18, 19 we tested the effect of this drug in our primary patient‐derived osteosarcoma cell lines OSRH‐2011/5 and OSKG. Both cell lines were treated with the same concentrations used during cell cycle analysis (Fig. 2).
In OSRH‐2011/5, we measured caspase‐3 activity after 24 and 48 hr of treatment at prexasertib concentrations of 2, 5, 10 and 100 nM in parallel to measurement of the sub‐G1 fraction. At these concentrations, the rate of apoptosis increased in a dose and time‐dependent manner showing significant increases in caspase‐3 expression after 24 (5 nM: p ≤ 0.000698, 10 nM: p ≤ 0.017, 100 nM: p ≤ 0.0394) and 48 hr (5 nM: p ≤ 0.00029, 10 nM: p ≤ 0.01, 100 nM: p ≤ 0.0024; Fig. 3 a).
Figure 3.

Prexasertib induces apoptosis and double‐stranded DNA breaks in primary patient‐derived osteosarcoma cell lines. Apoptosis induction 24 and 48 hr after initiation of treatment with prexasertib compared to DMSO, measured by percentage of cells in sub‐G1 phase (left diagram) and percentage of active caspase‐3 positive cells (right diagram), in primary patient‐derived cell lines OSRH‐2011/5 (a) and OSKG (b). Double‐stranded DNA breakage in different phases of the cell cycle as measured by γH2AX‐expression, induced by treatment with prexasertib after 24 and 48 hr in primary patient‐derived cell lines OSRH‐2011/5 (c) and OSKG (d). *p < 0.05; **p < 0.01; ***p < 0.001 compared to DMSO.
In addition to increased percentages of caspase‐3 expressing cells we observed an increase of cells in sub‐G1 fraction, representing cells that have undergone apoptosis and contain fractional degraded DNA (Fig. 3 a). In OSRH‐2011/5 24 hr of treatment with prexasertib led to a concentration‐dependent increase of the sub‐G1 fraction in 5, 10 and 100 nM in comparison to DMSO‐treated cells (p‐value: 10 nM ≤ 0.02, 100 nM ≤ 0.041). After 48 hr of treatment with prexasertib, we observed a further and higher increase of the percentage of cells in this fraction for these concentrations. Cells treated with the highest concentration of 100 nM showed a particulary strong and highly significant increase up to almost 20% of cells (p‐value: 5 nM ≤ 0.00089, 10 nM ≤ 0.045, 100 nM ≤ 0.00039).
In OSKG, we observed significant increases of caspase‐3 after 24 hr at all tested concentrations (6.5 nM: p ≤ 0.013, 15 nM: p ≤ 0.0014, 30 nM: p ≤ 0.00004, 100 nM: p ≤ 0.00002; Fig. 3 b). After 48 hr, caspase‐3 expression increased even further at all tested concentrations (6.5 nM: p ≤ 0.019, 15 nM: p ≤ 0.003, 100 nM: p ≤ 0.0008). However, in these cells, the induction of apoptosis was not as clearly paralleled by an increase of cells in sub G1 (Fig. 3 b ). The sub‐G1 fraction merely showed a small concentration‐dependent increase for all tested concentrations, being significant for 15 and 100 nM (p‐value: 15 nM ≤ 0.044, 100 nM ≤ 0.009). The treatment over 48 hr led to a small further concentration‐dependent increase of this fraction (p‐value: 100 nM ≤ 0.0109).
These results show that both primary patient‐derived osteosarcoma cell lines respond to treatment with prexasertib with a concentration and time‐dependent induction of apoptosis even when the effect on the cell cycle is variable, which indicates that the effect of prexasertib on apoptosis is independent from its effect on the cell cycle.
We validated the data showing caspase‐3 activation by immunoblotting for the apoptotic marker PARP‐cleavage in both of our primary osteosarcoma cell lines (Fig. 4). The treatment with prexasertib led to an increased abundance of cleaved PARP in both primary osteosarcoma cell lines indicating an activation of the apoptotic cascade and confirming our previous data of caspase‐3 expression. In OSRH‐2011/5, we observed a concentration‐ and time‐dependent increase of cleaved PARP after 24 and 48 hr (Fig. 4 a). In OSKG we observed a similar response, although consistent with the generally more treatment‐resistant phenotype of these cells, PARP cleavage was not as strongly induced as in OSRH‐2011/5 (Fig. 4 b).
Figure 4.

Prexasertib activates PARP cleavage in primary patient‐derived osteosarcoma cells. PARP cleavage was analyzed by Western blotting in OSRH‐2011/5 (a) and OSKG (b) cells at the indicated concentrations of prexasertib after 24 and 48 hr of treatment. Loading of gels was controlled by β‐actin.
Prexasertib causes double‐stranded DNA breakage in primary patient‐derived osteosarcoma cells
In other malignancies double‐stranded DNA breakage (DSB), leading to replication catastrophe, has been reported to be the main damage mechanism induced by prexasertib.13 We therefore measured the phosphorylation of H2AX (γH2AX), a well‐established marker of DNA double‐strand breaks, after 24 and 48 hr in our primary osteosarcoma lines treated with prexasertib.
After 24 hr, there was an increase in γH2AX‐expression in OSRH‐2011/5 at all concentrations predominantly occurring in S‐phase, being significant for the IC50 (2 nM p ≤ 0.03) and 5 nM (p ≤ 0.000039; Fig. 3 c). In G2/M, we observed an increase in DSB at all concentrations. Although cells in G2/M had been diminished at 100 nM there was also a significant increase of DSB during this phase.
The observed increases of γH2AX remained detectable up to 48 hr at the higher concentrations of 10 (p ≤ 0.014) and 100 nM (p ≤ 0.0019) whereas at lower concentrations γH2AX did not significantly differ from DMSO‐treated controls.
In the primary line OSKG, we observed significant concentration‐dependent increases of γH2AX among all tested concentrations in S‐phase at both 24 (6.5 nM: p ≤ 0.00048, 15 nM: p ≤ 0.00006, 30 nM: p ≤ 0.0054, 100 nM: p ≤ 0.004) and 48 hr (6.5 nM: p ≤ 0.009, 15 nM: p ≤ 0.0169, 30 nM: p ≤ 0.000329, 100 nM: p ≤ 0.000046) after treatment initiation with prexasertib (Fig. 3 d).
This significant concentration‐dependent increase of γH2AX could also be seen in G2/M at all tested concentrations at both 24 (6.5 nM: p ≤ 0.0013, 15 nM: p ≤ 0.0002, 30 nM: p ≤ 0.005, 100 nM: p ≤ 0.000059) and 48 hr (6.5 nM: p ≤ 0.0135, 15 nM: p ≤ 0.019, 30 nM: p ≤ 0.0097, 100 nM: p ≤ 0.00072) of treatment with prexasertib.
In sum, in both primary patient‐derived cell lines, γH2AX‐expression increased significantly in a time and concentration‐dependent manner. These results highlight the concentration‐dependent induction of DNA damage by prexasertib. It is notable that the variability of the clonogenic survival between these cells lines is reflected by the degree of induction of both apoptosis and induction of γH2AX.
Combination of prexasertib with cisplatin shows synergistic effects in clonogenic survival assays
The overall outcome of osteosarcoma patients improved greatly with the introduction of treatment with multimodal chemotherapy2 and treatment with the DNA intercalating agent cisplatin has been a well‐established standard of care in the treatment of osteosarcoma for decades. Therefore, we analyzed whether the effect of cisplatin on clonogenic survival could be increased in combination with prexasertib. Both of our primary cell lines showed a concentration‐dependent reduction of clonogenic survival after treatment with cisplatin (Fig. 5 a). As we had observed with prexasertib (Fig. 1), in OSKG higher concentrations of cisplatin (100–300 nM) were necessary to achieve similar effects of cisplatin as a single agent in comparison to OSRH‐2011/5 (30–150 nM).
Figure 5.
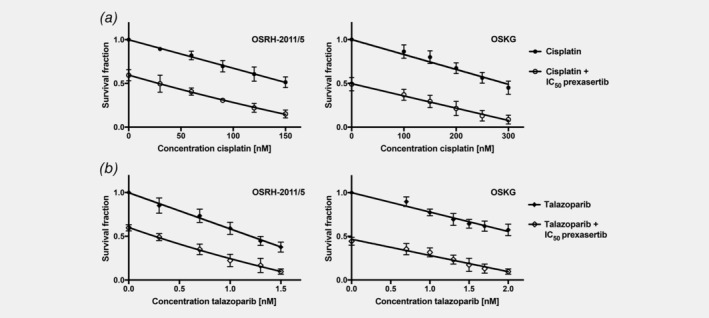
Combination therapy of prexasertib and cisplatin or talazoparib synergistically reduces clonogenic survival in primary patient‐derived osteosarcoma cell lines. Clonogenic survival assays for the primary patient‐derived cell lines OSRH‐2011/5 and OSKG treated with a combination therapy of the indicated cisplatin (a) or talazoparib (b) concentrations and the IC50 concentration of prexasertib of the respective cell lines. Cells were incubated until approximately 50–100 colonies had formed in the DMSO‐treated control. Each point of the curve represents the mean surviving fraction compared to the DMSO‐treated negative control from three independent experiments ± SD.
Combination treatment with the IC50 of prexasertib (Fig. 1) led to a further decrease in clonogenic survival in both primary osteosarcoma cell lines (Fig. 5 a). A possible synergistic interaction was evaluated by calculation of the combination indexes.
In OSRH‐2011/5, we calculated CI values of <1.0 (CI30 nM = 0.95, CI60 nM = 0.86, CI90 nM = 0.72), for higher concentrations even <0.7 (CI120 nM = 0.58, CI150 nM = 0.45) indicating a synergistic interaction between these agents.
In OSKG, we obtained CI values <1.0 at higher therapeutically relevant concentrations (CI250 nM = 0.84, CI300 nM = 0.76), close to the IC50 of cisplatin, also indicating a synergistic interaction in this cell line. Lower concentrations did show CI values around 1 (CI100 nM = 1.1, CI150 nM = 1.07, CI200 nM = 0.98).
Differences of survival fractions between the monotherapy of prexasertib or cisplatin and the respective combinations were statistically analyzed by paired Student's t‐test showing significant differences in both primary osteosarcoma cell lines.
Combination of prexasertib with talazoparib shows synergistic effects in clonogenic survival assays
Considering that osteosarcoma frequently show BRCAness, we reasoned that prexasertib may synergize with talazoparib (talazoparib has previously been reported to show promising potency in osteosarcoma cell lines21). We therefore treated the primary cell lines with increasing concentrations of the PARP‐inhibitor talazoparib alone or in combination with prexasertib at its IC50.
When analyzing the effect of talazoparib as a single agent on clonogenic survival and in combination with the IC50 of prexasertib, we discovered that across different concentrations of talazoparib there was a further significant decrease in clonogenic survival in both primary patient‐derived cell lines that went beyond an additive effect (Fig. 5 b). As was observed with single agent prexasertib or cisplatin, OSRH‐2011/5 cells were more sensitive to single agent talazoparib than OSKG cells. When combined with prexasertib, talazoparib showed a synergistic effect on clonogenic survival, evaluated by calculation of combination indexes.
For the combination treatment of prexasertib (IC50) and talazoparib in OSRH‐2011/5, the CI values were <1 (CI0.3 nM = 0.98, CI0.7 nM = 0.86), for higher concentrations <0.7 (CI1 nM = 0.67, CI1.3 nM = 0.59, CI1.5 nM = 0.38), indicating a synergistic interaction for this combination. In OSKG, the CI values at higher therapeutically relevant concentrations of talazoparib were <1 (CI1.5 nM = 0.86, CI1.7 nM = 0.79, CI2 nM = 0.73) also indicating synergistic drug interaction in this cell line. Lower concentrations showed CI values slightly above 1 (CI0.7 nM = 1.09, CI1.0 nM = 1.12, CI1.3 nM = 1.02).
Differences of survival fractions between monotherapy of prexasertib or talazoparib and the respective combinations were statistically analyzed by paired Student's t‐test showing significant differences in both primary osteosarcoma cell lines.
Whole exome sequencing data reveals higher chromosomal instability in OSRH‐2011/5
We generated whole exome sequencing data from both cell lines (in duplicates) and tumors from which the cell lines were originally derived. Sequencing data were processed to identify single‐nucleotide variants and copy‐number alterations (CNAs) which were subsequently used for testing of homologous recombination repair (HRR) deficiency.
HRR deficiency normally presents by the abundance of large‐scale copy‐number changes (termed as large‐scale state transitions, LSTs) and frequent amplifications within the subtelomeric regions (termed as telomere‐allelic imbalances, TAI). In addition, these genomics traits are frequently accompanied by specific enrichment of somatic single‐nucleotide changes C>A, C>G and C>T across all 32 possible DNA triplets—which is collectively referred to as the COSMIC signature AC3.
In comparison to OSKG, the cell line OSRH‐2011/5 had a substantially higher degree of chromosomal instability with frequent amplifications of subtelomeric regions and thus achieved a higher score for large‐scale state transitions (LST; LST: 12, threshold 15; Fig. 6 a). The genomic landscape of the cell line OSKG was generally flat with occasional losses of the whole chromosomes (LST: 6, threshold 15; Fig. 6 b).
Figure 6.

Copy number profiles and single‐nucleotide mutation signatures. Copy number profiles and single‐nucleotide mutation signatures of cell line OSRH‐2011/5 (a) and OSKG (b) generated from exome sequencing data. [Color figure can be viewed at wileyonlinelibrary.com]
In contrast, we did neither detect signs of deficient homologous recombination repair (HRR)‐specific DNA damage nor pathogenic mutations in BRCA1/2 genes which are characteristic for BRCAness in either of the cell lines.
Discussion
Overall and relapse free survival in osteosarcoma have not substantially changed for decades,5, 6 which is mostly caused by failing advances of systemic therapy. Therefore, there is an urgent clinical need to discover and develop new potent and effective systemic agents for the treatment of osteosarcoma. Furthermore, in addition to survival, it is fundamental to limit long‐term effects potentially by combination treatment enabling a dose reduction of conventional chemotherapy.
The first important and novel finding reported here is that prexasertib, an inhibitor of Chk1/2, leads to persistent DNA damage and increased apoptotic cell death in primary patient‐derived osteosarcoma cells that we have previously shown to have largely preserved the genetic profile of the primary tumors.22 These primary cells show a prexasertib IC50 in the low nanomolar range well below the average plasma concentrations which are safe and tolerable in patients,27 suggesting that effective concentrations for the treatment of osteosarcoma may be achievable clinically.
The inhibition of Chk1 by prexasertib increases exposure of single‐stranded DNA to cleavage by endonucleases32 caused by stalled replication forks. This leads to double‐stranded DNA breakage (DSB). Simultaneously, Chk1‐inhibition removes the protection of the DNA damage checkpoints (intra‐S and G2/M) rendering cancer cells unable to repair damaged DNA, further increasing replicative stress and forcing cells to prematurely progress in spite of damaged DNA into replication and mitosis, resulting in apoptosis.10, 13, 33, 34 This mechanism has been reported to be the main damage mechanism induced by prexasertib in various other malignancies.13, 16, 18, 19
Considering the likely mechanism of action in osteosarcoma, we found that treatment of our primary patient‐derived cells with prexasertib resulted in an accumulation of cells in S‐phase after 24 hr, which is known to be the phase of the cell cycle in which most DNA damage occurs.13 Furthermore, prexasertib increased persistent double‐strand DNA breaks, as indicated by γH2AX expression. These data indicate that the induction of replication stress and accumulated unresolvable DNA damage may lead to the observed concentration‐dependent increase in apoptosis.
This is in agreement with reports from recent studies of prexasertib in other tumor cells showing that inhibition of Chk1 increased exposure of single strand DNA to cleavage by endonucleases, leading to the observed double‐stranded DNA breakage and replication catastrophe,13, 16, 18, 19, 32 the likely mechanism of apoptosis.13
While we saw a decrease in OSRH‐2011/5 cell number in G1‐phase across all tested concentrations, we also saw a difference in the S and G2/M‐phase distribution after 48 hr.
When the more sensitive OSRH‐2011/5 was treated with a prexasertib concentration of 100 nM (representing the reported average plasma concentration in a clinical phase I study27) these cells exhibited an even further increase of cells in S‐phase, while the proportion in G2/M remained diminished. This finding was paralleled by the highest increase of γH2AX levels, that were about three times higher than at a concentration of 10 nM, indicating that cells at 100 nM (ca. 50‐fold > IC50) had undergone extensive DNA damage leading to inability to further progress to G2/M‐phase, in comparison to cells treated with lower concentrations, thus undergoing apoptosis through replication catastrophe. This interpretation is further supported by the observation that at this concentration the cells exhibited the highest increase of the apoptotic sub‐G1 fraction (p = 0.00039), resembling cells with fractional degraded DNA, and the highest increase of caspase‐3 expressing apoptotic cells (p = 0.0024). In contrast, in OSKG for which 100 nM is only ca. 15‐fold higher than the IC50, treatment with this concentration of prexasertib did not lead to such an extensive increase of cells in S‐phase and a preserved ability to progress to G2/M and to enter potentially enter apoptosis through mitotic catastrophe. As expected, under these conditions the proportion of apoptotic cells, of cells in sub‐G1 fraction and those expressing γH2AX was lower in comparison to OSRH‐2011/5.
Overall, these results indicate that inhibition of the intra S and G2/M DNA damage checkpoints induced premature mitosis resulting in apoptotic cell death due to unresolved DNA damage. This interpretation is supported by the concentration and time‐dependent increases of γH2AX‐levels and apoptosis not only in S‐phase but also in G2/M‐phase. Such a mechanism is consistent with that previously reported in other cancer cells.13 These concentration‐dependent differences in the mechanism of cell death have also been proposed by others,18 suggesting that prexasertib may either lead to replication or mitotic catastrophe and is in agreement with prexasertib's known mechanism of action.
In OSRH‐2011/5, a concentration of 100 nM led to extensive DNA damage, resulting in the inabilitiy of most treated cells to successfully complete replication and progressing to G2/M‐phase due to the unresolvable double‐stranded DNA breakage and therefore leading to the observed S‐phase arrest and highest observed rates of apoptosis. At lower concentrations, OSRH‐2011/5 cells were able to resolve some of the DNA damage resulting in more cells being able to further progress to G2/M‐phase after replication leading to the observed decrease of cells in S‐phase from 24 to 48 hr. This could also be observed in OSKG cells. The increased proportion of cells in G2/M indicates that cells were still unable to successfully complete mitosis due to increased replication stress through previous double‐stranded DNA damage. This is underlined by γH2AX‐expression in this phase, leading to increased apoptosis as observed in both cell lines.
A large subset of osteosarcoma share BRCAness as a specific genetic signature with BRCA1/2‐deficient tumors.7 As BRCA is an important component of the DNA repair machinery and checkpoint activation,35, 36 we hypothesized that BRCA‐deficient cells may be particularly susceptible to a combination of DNA damaging agents and PARP inhibitors.8, 14, 21, 36
Although whole exome sequencing did not reveal a typical BRCAness signature in our primary osteosarcoma cells, we detected differences in overall chromosomal stability and structural/genomic variability which we suggest to explain the different sensitivity of the two cell lines.
These data are consistent with the real‐world genomic variability of cancer in general and of osteosarcoma in particular, which likely explains the variable response to treatment although a differential mutational status of the BRCA genes or the BRCAness signature could not be identified.
Overall, both primary osteosarcoma cell lines showed a significant sensitivity to low nanomolar concentrations of prexasertib. Additionally, prexasertib strongly induced apoptosis rates and double‐stranded DNA breakage in both of our cell lines.
These concentrations are well under the reported average plasma concentration of a phase I study of prexasertib which was safe and tolerable in patients.27 These data suggest that effective concentrations of prexasertib in the treatment of osteosarcoma may be achievable clinically.
Importantly, the combination treatment of prexasertib with cisplatin, a well‐established standard of care agent in the treatment of osteosarcoma, led to a synergistic interaction further highlighting the potential clinical relevance in the future treatment of osteosarcoma. A combination therapy with the PARP‐inhibitor talazoparib showed a similar synergistic response. PARP‐inhibitors have recently been reported to be effective in osteosarcoma21 thus conceptualizing further preclinial and clinical development of this combination. In sum, prexasertib emerges as a potential new option for the treatment of osteosarcoma, which will now have to be tested in preclinical in vivo models and in clinical studies.
Acknowledgements
The authors thank Mrs. Thuy Trinh and Jasmin Keck for their excellent technical assistance. We also thank Dr. Lou Stancato, Dr. Aimee Bence Lin and Dr Caitlin Lowery (Eli Lilly Corp.) for excellent advice and for providing prexasertib mesylate monohydrate.
Conflict of interest: All authors declare to have no conflict of interest.
Data availability
Sequencing data has been uploaded to the European Genome‐phenome Archive (EGA) under following Study ID: EGAS00001003923 and will be made freely available upon a reasonable request.
References
- 1. Isakoff MS, Bielack SS, Meltzer P, et al. Osteosarcoma: current treatment and a collaborative pathway to success. J Clin Oncol 2015;33:3029–35. [DOI] [PMC free article] [PubMed] [Google Scholar]
- 2. Jaffe N, Puri A, Gelderblom H. Osteosarcoma: evolution of treatment paradigms sarcoma. Sarcoma 2013;2013:203531. [DOI] [PMC free article] [PubMed] [Google Scholar]
- 3. Bielack SS, Hecker‐Nolting S, Blattmann C, et al. Advances in the management of osteosarcoma. F1000Res 2016;5:2767. [DOI] [PMC free article] [PubMed] [Google Scholar]
- 4. Luetke A, Meyers PA, Lewis I, et al. Osteosarcoma treatment—where do we stand? A state of the art review. Cancer Treat Rev 2014;40:523–32. [DOI] [PubMed] [Google Scholar]
- 5. Bielack SS, Kempf‐Bielack B, Delling G, et al. Prognostic factors in high‐grade osteosarcoma of the extremities or trunk: an analysis of 1,702 patients treated on neoadjuvant cooperative osteosarcoma study group protocols. J Clin Oncol 2002;20:776–90. [DOI] [PubMed] [Google Scholar]
- 6. Kempf‐Bielack B, Bielack SS, Jürgens H, et al. Osteosarcoma relapse after combined modality therapy: an analysis of unselected patients in the cooperative osteosarcoma study group (COSS). J Clin Oncol 2005;23:559–68. [DOI] [PubMed] [Google Scholar]
- 7. Kovac M, Blattmann C, Ribi S, et al. Exome sequencing of osteosarcoma reveals mutation signatures reminiscent of BRCA deficiency. Nat Commun 2015;6:8940. [DOI] [PMC free article] [PubMed] [Google Scholar]
- 8. Paculová H, Kramara J, Šimečková Š, et al. BRCA1 or CDK12 loss sensitizes cells to CHK1 inhibitors. Tumor Biol 2017;39:101042831772747. [DOI] [PubMed] [Google Scholar]
- 9. Rundle S, Bradbury A, Drew Y, et al. Targeting the ATR‐CHK1 axis in cancer therapy cancers, vol. 9 Basel, Switzerland: Multidisciplinary Digital Publishing Institute, 2017. 41. [DOI] [PMC free article] [PubMed] [Google Scholar]
- 10. Patil M, Pabla N, Dong Z. Checkpoint kinase 1 in DNA damage response and cell cycle regulation. 2014;70:4009–21. [DOI] [PMC free article] [PubMed] [Google Scholar]
- 11. Liang Y, Lin S‐Y, Brunicardi FC, et al. DNA damage response pathways in tumor suppression and cancer treatment. World J Surg 2009;33:661–6. [DOI] [PubMed] [Google Scholar]
- 12. Toledo LI, Murga M, Fernandez‐Capetillo O. Targeting ATR and Chk1 kinases for cancer treatment: a new model for new (and old) drugs molecular oncology, vol. 5 Hoboken, NJ: Wiley‐Blackwell, 2011. 368–73. [DOI] [PMC free article] [PubMed] [Google Scholar]
- 13. King C, Diaz HB, McNeely S, et al. LY2606368 causes replication catastrophe and antitumor effects through CHK1‐dependent mechanisms. Mol Cancer Ther 2015;14:2004–13. [DOI] [PubMed] [Google Scholar]
- 14. Babiker HM, McBride A, Cooke LS, et al. Therapeutic potential of investigational CHK‐1 inhibitors for the treatment of solid tumors expert opinion on investigational drugs. Expert Opin Investig Drugs 2017;26:1063–72. [DOI] [PubMed] [Google Scholar]
- 15. McNeely S, Beckmann R, Bence Lin AK. CHEK again: revisiting the development of CHK1 inhibitors for cancer therapy. Pharmacol Ther 2014;142:1–10. [DOI] [PubMed] [Google Scholar]
- 16. Lowery CD, VanWye AB, Dowless M, et al. The checkpoint kinase 1 inhibitor prexasertib induces regression of preclinical models of human neuroblastoma. Clin Cancer Res 2017;23:4354–63. [DOI] [PubMed] [Google Scholar]
- 17. Brill E, Yokoyama T, Nair J, et al. Prexasertib, a cell cycle checkpoint kinases 1 and 2 inhibitor, increases in vitro toxicity of PARP inhibition by preventing Rad51 foci formation in BRCA wild type high‐grade serous ovarian cancer. Oncotarget 2017;8:111026–40. [DOI] [PMC free article] [PubMed] [Google Scholar]
- 18. Zeng L, Beggs RR, Cooper TS, et al. Combining Chk1/2 inhibition with Cetuximab and radiation enhances in vitro and in vivo cytotoxicity in head and neck squamous cell carcinoma. Mol Cancer Ther 2017;16:591–600. [DOI] [PMC free article] [PubMed] [Google Scholar]
- 19. Di Rorà AGL, Iacobucci I, Imbrogno E, et al. Prexasertib, a Chk1/Chk2 inhibitor, increases the effectiveness of conventional therapy in B−/T‐ cell progenitor acute lymphoblastic leukemia. Oncotarget 2016;7:53377–91. [DOI] [PMC free article] [PubMed] [Google Scholar]
- 20. Sen T, Tong P, Stewart CA, et al. CHK1 inhibition in small‐cell lung cancer produces single‐agent activity in biomarker‐defined disease subsets and combination activity with cisplatin or olaparib. Cancer Res 2017;77:3870–84. [DOI] [PMC free article] [PubMed] [Google Scholar]
- 21. Engert F, Kovac M, Baumhoer D, et al. Osteosarcoma cells with genetic signatures of BRCAness are susceptible to the PARP inhibitor talazoparib alone or in combination with chemotherapeutics. Oncotarget 2017;8:48794–806. [DOI] [PMC free article] [PubMed] [Google Scholar]
- 22. Blattmann C, Thiemann M, Stenzinger A, et al. Establishment of a patient‐derived orthotopic osteosarcoma mouse model. J Transl Med 2015;13:136. [DOI] [PMC free article] [PubMed] [Google Scholar]
- 23. Franken NA, Rodermond HM, Stap J, et al. Clonogenic assay of cells in vitro. Nat Protoc 2006;1:2315–9. [DOI] [PubMed] [Google Scholar]
- 24. Munshi A, Hobbs M, Meyn RE. Clonogenic cell survival assay. Methods Mol Med 2005;110:21–8. [DOI] [PubMed] [Google Scholar]
- 25. Chou TC. Theoretical basis, experimental design, and computerized simulation of synergism and antagonism in drug combination studies. Pharmacol Rev 2006;58:621–81. [DOI] [PubMed] [Google Scholar]
- 26. Chou TC. Drug combination studies and their synergy quantification using the Chou‐Talalay method. Cancer Res 2010;70:440–6. [DOI] [PubMed] [Google Scholar]
- 27. Hong D, Infante J, Janku F, et al. Phase I study of LY2606368, a checkpoint kinase 1 inhibitor, in patients with advanced cancer. J Clin Oncol 2016;34:1764–71. [DOI] [PMC free article] [PubMed] [Google Scholar]
- 28. Sun JX, He Y, Sanford E, A computational approach to distinguish somatic vs germline origin of genomic alterations from deep sequencing of cancer specimens without a matched normal PLoS Comput Biol 2018;14: e1005965. [DOI] [PMC free article] [PubMed] [Google Scholar]
- 29. Lee J, Lee AJ, Lee JK, et al. Mutalisk: a web‐based somatic MUTation AnaLyIS toolKit for genomic, transcriptional and epigenomic signatures. Nucleic Acids Res 2018;46:W102–8. [DOI] [PMC free article] [PubMed] [Google Scholar]
- 30. Popova T, Manie E, Rieunier G, et al. Ploidy and large‐scale genomic instability consistently identify basal‐like breast carcinomas with BRCA1/2 inactivation. Cancer Res 2012;72:5454–62. [DOI] [PubMed] [Google Scholar]
- 31. Birkbak NJ, Wang ZC, Kim JY, et al. Telomeric allelic imbalance indicates defective DNA repair and sensitivity to DNA‐damaging agents. Cancer Discov 2012;2:366–75. [DOI] [PMC free article] [PubMed] [Google Scholar]
- 32. Thompson R, Montano R, Eastman A. The Mre11 nuclease is critical for the sensitivity of cells to Chk1 inhibition. PLoS One 2012;7:e44021. [DOI] [PMC free article] [PubMed] [Google Scholar]
- 33. Thompson R, Eastman A. The cancer therapeutic potential of Chk1 inhibitors: how mechanistic studies impact on clinical trial design. Br J Clin Pharmacol 2013;76:358–69. [DOI] [PMC free article] [PubMed] [Google Scholar]
- 34. Garrett MD, Collins I. Anticancer therapy with checkpoint inhibitors: what, where and when? Trends Pharmacol Sci 2011;32:308–16. [DOI] [PubMed] [Google Scholar]
- 35. Boulton SJ. Cellular functions of the BRCA tumour‐suppressor proteins. Biochem Soc Trans 2006;34:633–45. [DOI] [PubMed] [Google Scholar]
- 36. Takaoka M, Miki Y. BRCA1 gene: function and deficiency. Int J Clin Oncol 2018;23:36–44. [DOI] [PubMed] [Google Scholar]
Associated Data
This section collects any data citations, data availability statements, or supplementary materials included in this article.
Data Availability Statement
Sequencing data has been uploaded to the European Genome‐phenome Archive (EGA) under following Study ID: EGAS00001003923 and will be made freely available upon a reasonable request.