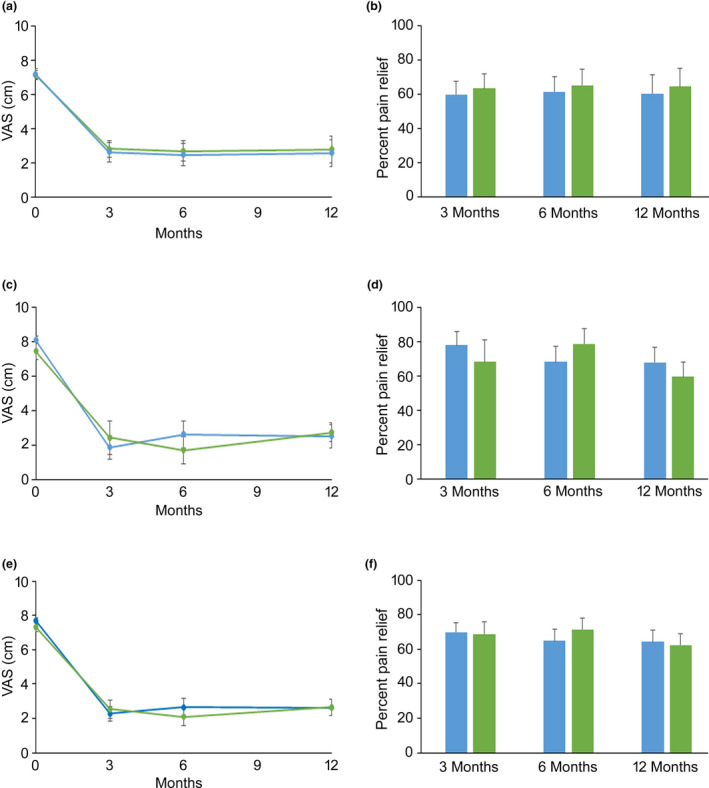
Figure 2.

Back and leg pain intensity VAS (a, c, e) and pain relief (b, d, f) for the SENZA‐RCT sub‐group (top row) for the SENZA‐EU sub‐group (middle row) for the combined cohort (bottom row) at 3 months, 6 months and 12 months following implantation of the 10 kHz spinal cord stimulation system. Data are mean with error bars showing SEM. Back pain (blue) and leg pain (green).
