
Figure 5.
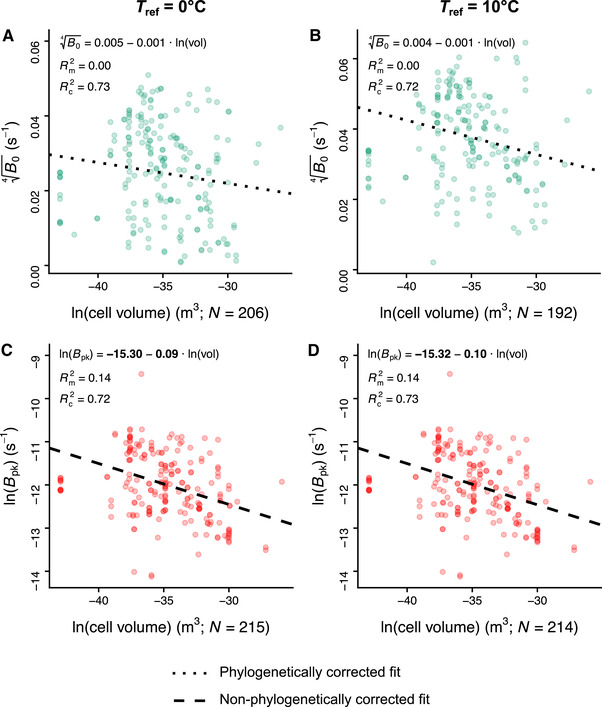
The relationships of cell volume with B 0 (panels A and B) and (panels C and D) with set to 0 or 10°C, according to the best‐fitting model (e.g., with or without a phylogenetic correction) in terms of DIC in each case (see Table S20). Coefficients shown in bold had 95% HPD intervals that did not include zero. The sample sizes of B 0 and estimates shown here are higher than those reported in Figs. S4 and S5, as we included estimates from species with unknown isolation locations. Note that we used different statistical transformations for B 0 and so that their estimates would be nearly normally distributed (see also Supporting Information Section S6.2).