

Abstract
Objectives
In a coronary bifurcation bench model, to determine the effects of side branch (SB) wire crossing position and balloon position on the stent scaffolding after the final proximal optimization technique (POT).
Background
POT performed as a final step after SB dilatation or kissing balloon inflation (KBI) has been widely advocated despite limited evidence.
Methods
Thirty‐one stent implantations in bifurcation phantoms were performed using a one‐stent provisional technique with (KBI) (n = 13), with POT‐side‐POT technique (n = 12) or with the two‐stent culotte technique (n = 6). SB wiring was performed through either a proximal or a distal stent cell and confirmed by optical coherence tomography. Final POT was performed with the balloon positioned either across or proximal to the SB takeoff. The area of the opened stent cell in front of the SB was assessed by 3D reconstructed microcomputation tomography scans performed before and after Final POT.
Results
In cases with metallic carina, final POT across the SB takeoff caused SB rejailing. Regardless of stent technique and wire position, a Final POT across the SB takeoff reduced the SB cell opening area by 43% [32%;58%] (n = 15). The largest reduction (54–70%) was found after the POT‐side‐POT technique in procedures with a proximal wiring. Final POT performed proximal to the SB takeoff caused limited or no SB cell opening area reduction (4% [0.6%;6%] [n = 16]).
Conclusion
Final POT with balloon positioned across the SB takeoff in a narrow angle bifurcation reduces largest stent cell area in front of the SB ostium and may cause SB rejailing in cases with metallic carina.
Keywords: coronary artery disease, percutaneous coronary intervention, STEC—stenting technique
1. INTRODUCTION
Postdilatation of the proximal main vessel (MV) segment in coronary bifurcation stenting is known as the proximal optimization technique (POT).1 Routine POT, performed immediately after stent implantation, is recommend by the European Bifurcation Club,2 as it may adequately expand the stent proximal to the side branch (SB) takeoff, facilitate SB rewiring, and reduce the risk of accidental abluminal rewiring.3, 4, 5 Additional POT, performed as a final step after SB dilatation or kissing balloon inflation (KBI), is termed “Final POT” and has been widely advocated despite limited clinical evidence.1, 2, 3
Balloon position during conventional Final POT is shown in published reviews and consensus papers to lie cross the SB takeoff.2, 6, 7, 8 Clinical observations by optical coherence tomography (OCT) have indicated that a final MV inflation across the SB takeoff may distort stent deployment gains achieved by KBI.5, 9 In this bench study, we aimed to evaluated whether a balloon expanded across the SB during Final POT causes reduction of ostial SB area and rejailing of the SB ostium, especially in presence of a metallic carina.
2. MATERIALS AND METHODS
2.1. Phantom model
The bifurcation phantom used in the study was a nontransparent 3D‐printed, axially symmetric, and bifurcating cylinder. The reference lumen dimensions were; proximal MV diameter: 3.7 mm, distal MV diameter: 3.0 mm, SB diameter: 2.8 mm at carina. The B angle was 30° to mimic Y‐shaped, narrow angle bifurcations that may be particular prone to SB rejailing.10
2.2. Study procedure
Effects by Final POT were evaluated for three different stent technique strategies; (a) provisional one‐stent technique with KBI and Final POT, (b) provisional one‐stent technique with POT‐side‐POT (rePOT technique),7 and (c) the two‐stent Culotte technique (Figure 1).
Figure 1.
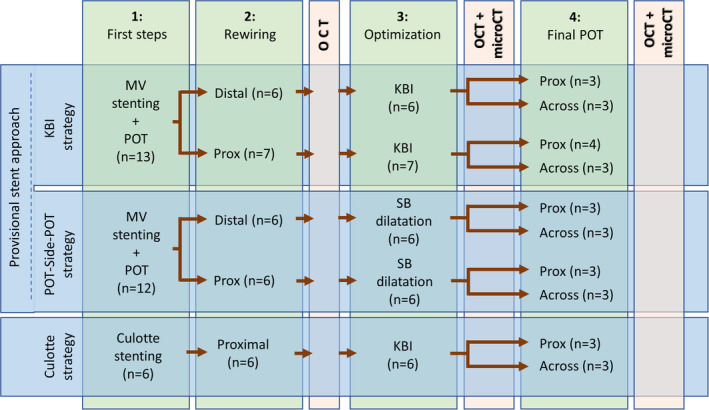
Evaluated bifurcation stenting strategies. This investigation plan summarizes the three deployment strategies: the wire crossing site (proximal or distal), the side‐branch dilatation strategy, and balloon position during Final POT (across or proximal to the SB). With the culotte strategy, a metallic carina was induced by crossing in a position opposite to the carina in main vessel rewiring and through a proximal cell in side branch rewiring. KBI, kissing balloon inflation; OCT, optical coherence tomography; POT, proximal optimization technique; SB, side branch
The study stent was the sirolimus‐eluting Orsiro drug‐eluting stent (DES) (Biotronik, Switzerland). Implantations were made under fluoroscopic control. Stents were sized according to the distal reference diameter and deployed at nominal pressure.
2.3. One stent provisional stenting with kissing balloon inflation (KBI strategy)
A 3.0 × 18 mm Orsiro DES was deployed in the MV across the SB followed by the first POT balloon inflation with a 3.75 mm noncompliant (NC) balloon to 20 atm. The balloon was positioned under fluoroscopic control with the distal marker at the carina point. A guide wire was advanced into the SB through either a distal cell (n = 6) or a proximal cell (n = 6) with the position confirmed by OCT. For KBI, a NC balloon sized to the SB and another sized to the distal MV were advanced and sequentially dilated at a high pressure (22 atm). Low pressure KBI (10 atm) was then performed followed by simultaneous deflation.
2.4. One‐stent provisional stenting with POT‐side‐POT technique (rePOT strategy)
A 3.0 × 18 mm Orsiro DES was deployed in the MV across the SB followed by the first POT balloon inflation with a 3.75 mm NC balloon to 20 atm. The balloon was positioned under fluoroscopic control with the distal marker at the carina point. A guide wire was advanced into the SB through either a distal cell (n = 6) or a proximal cell (n = 6), then a NC balloon sized according to the SB reference was advanced into the SB and inflated to 20 atm.
2.5. Two‐stent culotte strategy
A 2.5 × 18 mm Orsiro stent was deployed in the proximal SB protruding into the MV. The first POT balloon dilation was performed by inflating a 3.75 mm NC balloon to 20 atm. The distal MV was rewired through the side of the stent in a position opposite the carina to induce a metallic carina. The wire position was confirmed by OCT. After MV stenting with a 3.0 × 18 mm stent, a wire was passed from the MV to the SB by recrossing a proximal stent cell with the wire position confirmed by OCT. Two NC‐balloons sized according to the distal branches were inflated sequentially at high pressure (22 atm), then for KBI simultaneously at low pressure (10 atm) followed by simultaneous deflation.
2.6. Final POT
Final POT was performed in all cases. The POT balloon was sized according to the proximal MV reference (nominal diameter: 3.75 mm) and positioned either across the SB takeoff (n = 3 for each substrategy) or proximal to the SB takeoff (n = 3 for each substrategy) (Figure 1).
2.7. OCT and microcomputation tomography acquisition
Intermediate steps were evaluated by low‐speed OCT using the clinical Abbott ILUMIEN™ OCT image system and a C7 Dragonfly™ imaging catheter (Abbott Vascular). Microcomputation tomography (microCT) was performed before and after Final POT using the Skyscan 1172 and/or 1272 Bruker systems at a resolution of 17.00 μm/pixel. Images were reconstructed in 3D using the CTAn software (Burker microCT) and in 2D by DataViewer (2004–11 SkyScan, 2012–2017 Burker microCT).
2.8. MicroCT analysis
The largest SB cell opening before and after Final POT was quantified as projected from the distal SB perpendicular to the SB upper axis (Figure 2b,c). The reference area of the SB ostium was measured at the original carina level in a plane perpendicular to the SB axis. The SB opening area was measured as the largest area free of struts11 using dedicated image processing software (ImageJ 1.52a) (Figure 2C1,C2). The difference in opening area from before Final POT to after Final POT was calculated as a change in ratio (opening area/reference area) (Figure 3). For the provisional stent strategies, the stent expansion distance was measured at four different positions at the SB ostium (1: at the SB takeoff, 2: in between point 1 and 3, 3: in the mid position of the SB takeoff and the SB carina, 4: in between point 3 and the SB carina) (Figures 2d and Figure 5a, green box). All measurements were compared to a reference distance measured proximal to the implanted stent and the ratio was calculated.
Figure 2.
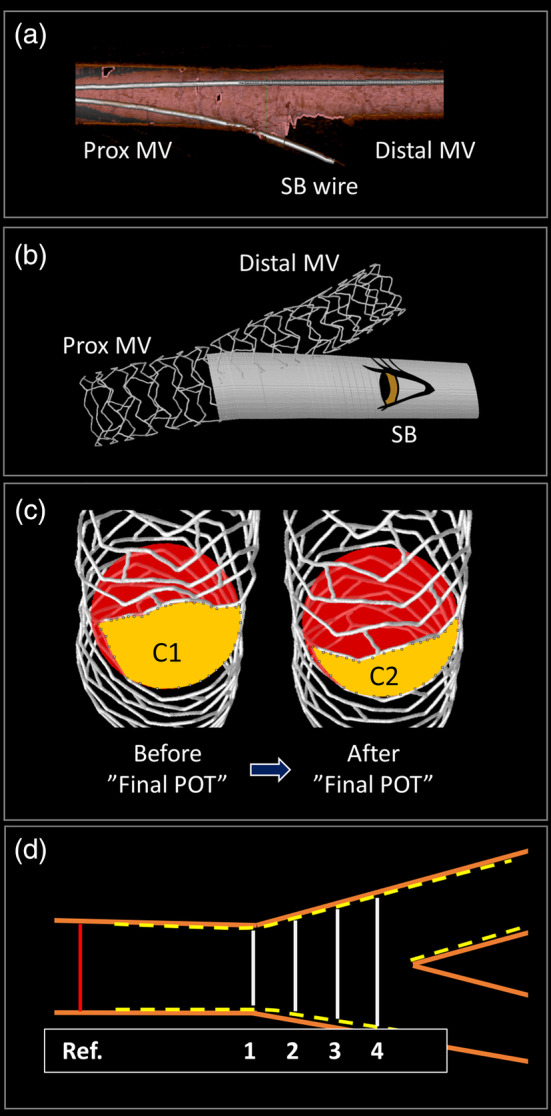
Bench and analysis methods. (a) 3D OCT was used to evaluate the site of the wire crossing to the SB. In this instance, the position is proximal relative to the SB. (b) 3D microCT image with a stent in the main vessel and point of view for SB area measurements. (c) SB opening assessed by microCT. The largest cell opening area (yellow) and the reference area measured at origin of the carina (red), (c) shows the area before “Final POT” (C1) and after “Final POT” where the largest cell opening area has been reduced by Final POT across the SB (C2) as seen from the SB. (d) Pictogram, illustration the four different distance ratios at the SB ostium. For example, SBostium‐ratio1 = (White distance 1/Red distance). microCT, microcomputation tomography; OCT, optical coherence tomography; POT, proximal optimization technique; SB, side branch
Figure 3.
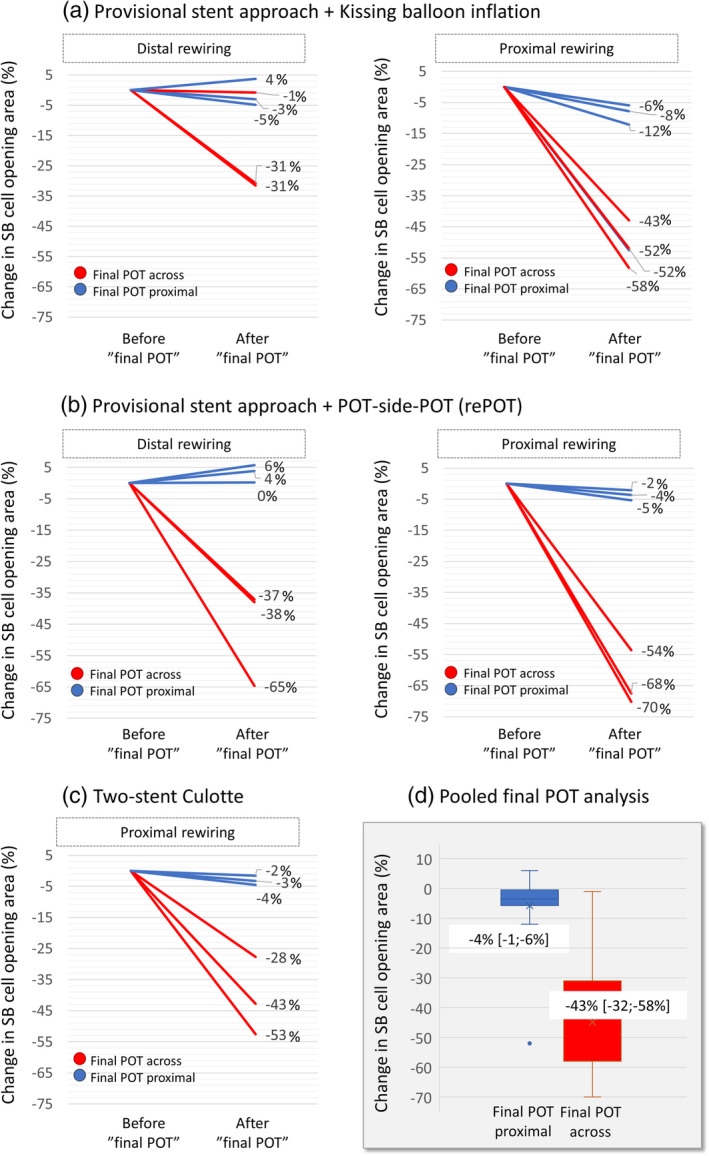
Change in side branch cell opening area. Reduction in SB cell opening area (%) by Final POT is shown on the vertical axis for different bifurcation stenting strategies. Final POT across the SB is represented in blue and Final POT proximal to the SB in red. (a) One‐stent provisional strategy with kissing balloon inflation; (b) One‐stent provisional strategy with POT‐side‐POT technique; (c) Two‐stent culotte technique; (d) Pooled result. Final POT across the SB ostium causes a marked reduction in SB ostial area (red) in contrast to Final POT performed proximal to the SB ostium (blue). POT, proximal optimization technique; SB, side branch
2.9. Quantitative OCT analysis
For provisional stent strategies, quantitative cross‐sectional OCT analysis was performed at 0.5 mm intervals using off‐line semiautomated analysis software (QCU‐CMS Research, Leiden, The Netherlands). Minimal stent area in the proximal stent segment was measured before and after Final POT for the following parameters: maximal stent diameter (D max), minimum stent diameter (D min), and mean stent diameter (D mean). The stent deformation index for ellipticity (EI) was calculated as the ratio of the maximal‐to‐minimal stent diameter (Index = D max/D min) both before and after Final POT.
3. RESULTS
Pooling all tested deployment strategies, performing a Final POT with the balloon across the SB takeoff caused a reduction in SB opening area by 43% [32%;58%] (n = 15) (Figure 3d, boxplot and Figure 4a). The largest reduction was seen in procedures with a proximal rewiring (53% [43%;58%] [n = 9]); whereas after distal wire recrossing with no induced metallic carina, POT across caused a smaller reduction in SB cell area of 34% [31%;38%] (n = 6). In POT‐side‐POT (rePOT) procedures with distal wire crossing, the part of the MV stent overlying the SB ostium or covering the proximal lateral wall of the SB was dragged toward the MV lumen by Final POT across effectively rejailing the SB (Figure 6a). In contrast, Final POT performed with the balloon proximal to the SB takeoff for all techniques and wire positions showed a minimal reduction in SB opening area of 4% [−1: −6%] (Figure 3d).
Figure 4.
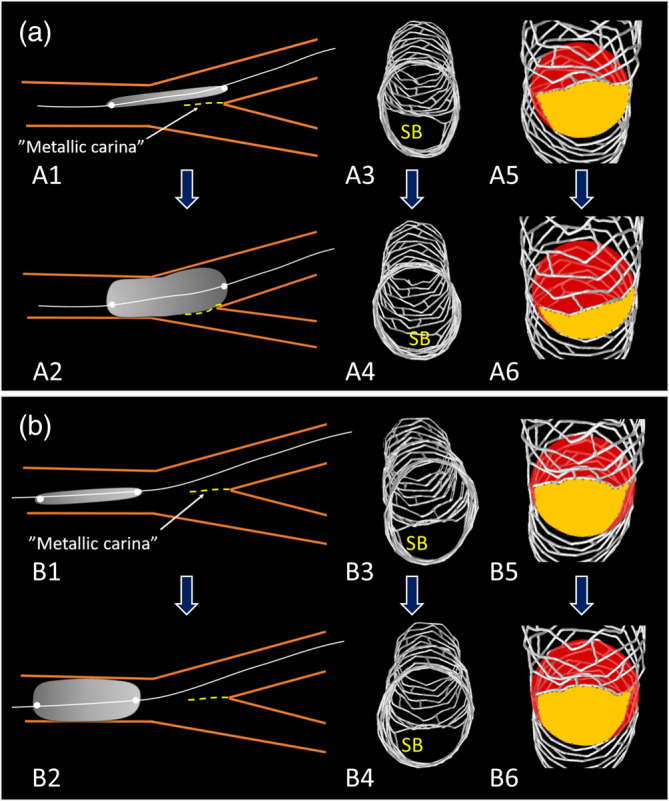
Depicted are balloon positions during Final POT. Shown in (a) is Final POT with the balloon positioned across the SB origin and in (b) Final POT positioned proximal to the SB after single stent deployment and kissing balloon inflation. In A2, the metallic carina (yellow broken line) is pushed so that the SB is rejailed. microCT images viewed from the SB, show largest opening cell area in yellow and the reference area measured at origin carina in red. Final POT across the SB origin (A1 and A2) reduces SB ostial size (A3–A6) whereas Final POT proximal to the SB ostium (B1 and B2) does not move the metallic carina and has little of no effect on SB ostial size (B3–B6). microCT, microcomputation tomography; POT, proximal optimization technique; SB, side branch
The implantation strategy with distal rewiring, KBI, and proximal Final POT (Figure 5a marked with a green box) was used as the standard procedure to which all other one‐stent implantation results pre ‐ and post‐Final POT were compared (Figures 5 and 6 and Table 1). The standard procedure maintained the ostial opening area, good stent expansion, and absence of eccentricity proximally. Figures 5 and 6 also show the difference in coronal stent diameter ratio at four positions in the bifurcation core segment. In procedures with distal SB wiring, a Final POT across dragged the rings extending farthest into the SB toward the MV lumen, resulting in both a small SB opening (Figure 3a,b) and a reduction in stent expansion ratio (KBI: −0.16 and rePOT: −0.11) (Figures 5a and 6a, position 4 and Table 1). Procedures with proximal rewiring showed the largest differences (Figures 5b and 6b and Table 1). Ellipticity index results are also shown in Figures 5 and 6 for the one‐stent provisional stenting strategies. For the two‐stent culotte strategy, the difference in ellipticity index was similar when compared to the reference strategy: before Final POT proximal: −0.00, after Final POT proximal: −0.01, before Final POT across: 0.00, after Final POT across it was 0.02.
Figure 5.
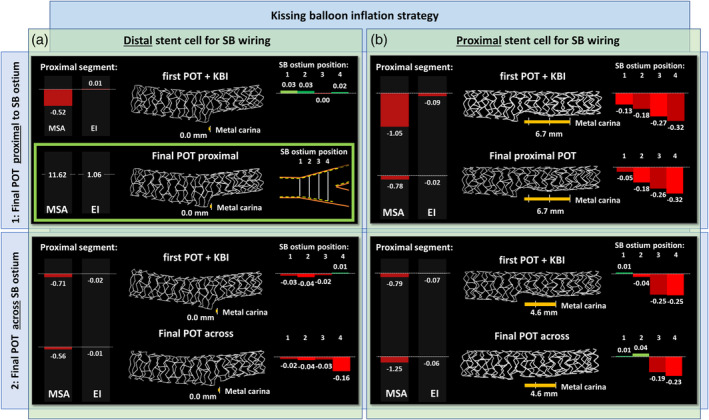
Results of MSA, EI, and stent expansion before and after Final POT in one‐stent provisional stenting strategies with kissing balloon inflation. Results after either distal (a) or proximal (b) side branch wire crossings are shown. a1/Green box: The reference strategy with POT‐Kissing‐POT, distal cell SB wiring, and proximal Final POT. Results for all other techniques (including strategies on Figure 6) are in comparison to this strategy. Red bar charts indicate smaller measurements when compared to the reference. Green bar charts indicate larger measurements compared to the reference. Bar chart to the left: Results of OCT‐analyzes of the proximal stent segment. For the stent width in the bifurcation core segment (bar chart to the right), measurements were compared as ratio calculations at four positions (indicated with 1, 2, 3, and 4) (as described in Figure 2d). EI, ellipticity index; MSA, minimal stent area (mm2); OCT, optical coherence tomography; POT, proximal optimization technique; SB, side branch
Figure 6.
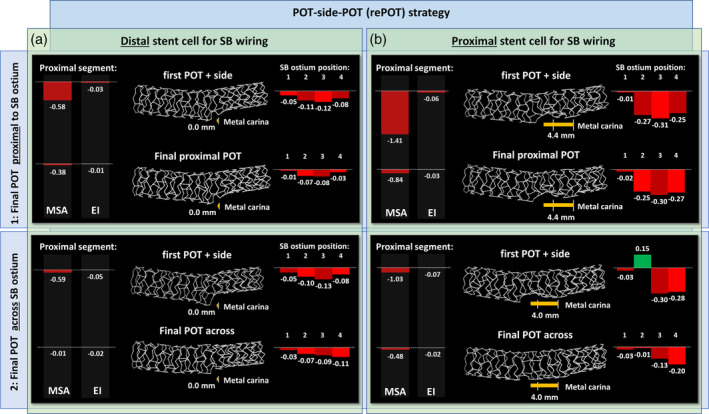
Results of MSA, EI, and stent expansion before and after Final POT in one‐stent provisional stenting strategies with re‐POT. (a) Results after distal wire crossing. (b) Results after proximal wire crossings. Results are delta values for the comparison to the reference strategy marked with green in Figure 5 (POT‐Kissing‐POT, distal cell SB wiring, and proximal Final POT). Red bar charts indicate smaller measurements. Green bar charts indicate larger measurements. Bar chart to the left: Results of OCT‐analyzes of the proximal stent segment. For the stent width in the bifurcation core segment (bar chart to the right), measurements were compared as ratio calculations at four positions (indicated with 1, 2, 3, and 4) (as described in Figure 2d). EI, ellipticity index; MSA, minimal stent area (mm2); OCT, optical coherence tomography; POT, proximal optimization technique; SB, side branch
Table 1.
Minimal stent area (MSA) and ellipticity index (EI) for the one‐stent provisional strategies
| Minimal stent area (MSA) | Ellipticity index (EI) | |||||||
|---|---|---|---|---|---|---|---|---|
| Before Final POT | After Final POT | Before Final POT | After Final POT | |||||
| Final POT proximal | Final POT across | Final POT proximal | Final POT across | Final POT proximal | Final POT across | Final POT proximal | Final POT across | |
| Kissing balloon inflation (KBI) | ||||||||
| Distal stent cell for SB wiring | 11.10 mm2 | 10.91 mm2 | 11.62 mm 2 | 11.05 mm2 | 1.06 | 1.09 | 1.06 | 1.08 |
| Proximal stent cell for SB wiring | 10.57 mm2 | 10.82 mm2 | 10.84 mm2 | 10.37 mm2 | 1.16 | 1.13 | 1.08 | 1.13 |
| Side branch dilatation (re‐POT strategy) | ||||||||
| Distal stent cell for SB wiring | 11.03 mm2 | 11.03 mm2 | 11.23 mm2 | 11.61 mm2 | 1.10 | 1.11 | 1.08 | 1.08 |
| Proximal stent cell for SB wiring | 10.21 mm2 | 10.59 mm2 | 10.78 mm2 | 11.14 mm2 | 1.12 | 1.13 | 1.09 | 1.08 |
Note: The italic terms correspond to green box in Figure 5a (the reference strategy: distal SB wiring, KBI, and Final POT with the balloon positioned proximal to the SB takeoff).
4. DISCUSSION
The main findings of this bench evaluation of bifurcation stenting strategies in a phantom with a narrow B angle were: (a) in presence of a metallic carina, Final POT across the SB takeoff caused a shift of the metallic carina toward the SB ostium thereby rejailing the SB, (b) finalizing a bifurcation stenting by Final POT with the balloon positioned across the SB takeoff reduced the largest SB cell opening area. Area reduction was seen regardless of position for wire recrossing before KBI, but the largest reduction was seen after proximal rewiring, (c) procedures with distal SB wiring, KBI, and Final POT with the balloon positioned proximal to the SB takeoff apparently performed well by the selected measures. (d) The rePOT strategy requires Final POT across the SB takeoff to alleviate stent malapposition opposite the SB takeoff but this in turn caused renarrowing of the largest cell area in front of the SB ostium.
4.1. Proximal optimization technique
The advantages of POT relate to the known fractal nature of the coronary tree and the step down in branch reference sizes at the SB takeoff.12, 13 Performing early POT after MV stenting aims to conform the stent to the proximal MV reference, thereby ideally correcting any proximal stent under‐expansion and malapposition.1, 2, 14 In addition, minimizing proximal malapposition reduces the risk of accidental abluminal rewiring. Furthermore, the conformational change at the SB takeoff may facilitate access for subsequent SB rewiring.15
4.2. Final POT
In 2011, a bench study concluded that POT should rather be the last step in bifurcation stenting.3 The authors argued that Final POT corrects proximal malapposition and asymmetric stent expansion seen after KBI. However, no POT was performed immediately after stent implantation, limiting a conclusion about adding Final POT to procedures where the now recommended early POT had already been performed. Multiple studies highlighted that KBI induced elliptical stent deformation, thereby increasing wall strain proximal to the SB and possibly damaging the stent polymer coating.16, 17, 18 However, no robust clinical data have yet correlated increased ellipticity in otherwise well‐expanded proximal vessels to worse clinical outcome. An in vivo OCT study found a correlation with stent thrombosis19 though event rates were very small and it cannot be ruled out that increased ellipticity was merely a marker of more severe disease, that is, calcifications limiting uniform expansion. A more recent IVUS study found no association between asymmetry index and excess neointimal tissue formation.20 Despite the lack of robust clinical data supporting the Final POT approach, the technique has been widely advocated, including by the European Bifurcation Club (EBC).2 Our bench results indicate that Final POT requires very careful execution to avoid potentially negative effects, and we only show minimal if any positive effects of this additional treatment step.
4.3. Balloon position during Final POT
Several published papers on optimal bifurcation stenting have illustrated the Final POT balloon in a distal position across the SB takeoff.1, 2, 18, 21 The risk of pushing a metallic carina toward the SB with Final POT performed across the SB takeoff was predicted in an editorial and illustrated in a case report.5, 9 Our findings confirm this risk and the reduction in area of the largest stent cell in front of the SB. Irrespective of best efforts, placing a balloon precisely within few millimeters is difficult as has been shown in comparisons of intended and actual landing zones.22 Despite aiming for a proximal position of the POT balloon, in one case, the balloon reached the metal carina and pushed the carina toward the SB (Figure 3a, blue line 52% reduction). Currently available balloons are manufactured with differences in cone angle and position of the shoulders in relation to the markers.23 It is therefore of outmost importance that operators are familiar with the specific balloon design to ensure that they are not accidentally inflating the Final POT balloon at the SB takeoff.
4.4. Wire position
In SB dilatation, including with KBI, an optimal wire crossing position into the SB is crucial. Rewiring through a proximal stent cell and subsequent balloon dilatation resulted in less scaffolding of the proximal part of the SB takeoff and the formation of a “metal carina” (Figures 5b and 6b).15, 24 This is particularly pronounced with Y‐shaped bifurcations (narrow B angle) compared to T‐shaped.25 Several techniques have been proposed to increase the chance of achieving a distal wire position, for example, bending the wire tip to form a loop, advancing this to the MV followed by a pullback toward the SB. However, studies have shown that angiography is a poor guide to wire crossing site, and it may be anticipated that proximal wire positions frequently occur unknowingly during bifurcation stenting.24 Furthermore, formation of a metallic carina is inherent with the T And small Protrusion (TAP)‐technique.26 When that occurs, a Final POT with the balloon across the SB take‐off may lead to rejailing and a reduction in ostial SB opening and scaffolding.
4.5. The re‐POT technique
In vitro studies and clinical data have suggested that the POT‐side‐POT (rePOT) technique can be performed as an alternative to MV stenting with KBI.4, 7, 27 It was previously shown that opening the SB with the recommended distal rewiring caused malapposition of the MV stent opposite the SB takeoff.3, 18, 28 We saw that this malapposition was corrected only by Final POT performed across the SB takeoff and not if the Final POT was performed in a position proximal to the SB. This indicates that a “distal” Final POT is required with the re‐POT technique. In this bench test, the “distal” Final POT in the rePOT technique caused rejailing of the SB in cases with metallic carina and caused a reduction in the ostial SB cell area (Figure 3). A clinical, prospective study concluded that the rePOT technique significantly reduced global malapposition and SB obstruction.7 This finding was based on OCT scans performed immediately after stent implantation and at the end of the procedure. No OCT scan was performed immediately after early POT, and it cannot be concluded that the Final POT contributed any further positive effect on malapposition except in correcting the induced malapposition across the SB takeoff.7 Also, in that study, no OCT was performed after SB dilatation, so the effect of final POT on SB opening could not be determined. Last, the SB obstruction parameter in that study7 was based on 2D measurements from MV OCT pullbacks, a method previously shown to provide imprecise measurements of the SB ostium.29 Due to the limited clinical outcome data after use of the rePOT technique, it is unknown if the described limitations are reflected in clinical outcomes, but the simplicity of the technique is an advantage. We predict that the potential limitations of rePOT may have limited negative effect in treatment of nontrue bifurcations where jailing has repeatedly been proven safe. The indication for SB opening in these cases is in any case controversial.30 With tight ostial SB lesions requiring intervention, the risk by leaving the ostium cell with suboptimal expansion or with rejailing of the ostium could be of negative clinical significance.
4.6. Two‐stent techniques
With the two‐stent culotte technique, we found the same negative effects of performing Final POT across the SB takeoff as we demonstrated for provisional stenting; the ostial SB area was reduced, and presence of a metallic carina caused rejailing of the SB. A bench study investigated the impact of Final POT on coronary flow conditions for four different two‐stent techniques and found that the culotte technique was most negatively affected by Final POT.31 Culotte stenting had the highest increase in Reynolds number, vorticity magnitude, stream function, strain rate, wall shear, and skin friction coefficient. Stent under‐expansion in the SB ostium is an established predictor of restenosis and leaving a SB jailed in two‐stent techniques is associated with increased mortality.32, 33, 34 We did not investigate other two‐stent techniques but the described negative effects of Final POT could be even more pronounced in techniques where a metallic carina is deliberately induced such as with the TAP technique.26
4.7. Limitations
In vitro models provide valuable insights into stent behavior in human coronary arteries but are limited by a number of approximations. The phantoms were manufactured to have elastic properties mimicking human arteries, but these properties were not characterized. All implantations were made in similar phantoms with only one type of angulation between the distal branches. The inner surface of the phantom was slightly granulated, which averted proper evaluation of malapposition. Only a single stent type was used, and it cannot be excluded that other platforms would have yielded slightly different numbers. Still, we performed a limited pilot series performing both one‐stent and two‐stent techniques with the Synergy platform (Boston Scientific) that indicated similar conformational changes.
5. CONCLUSIONS
Finalizing bifurcation stenting by Final POT with the balloon positioned across the SB takeoff causes reduction in SB cell area and causes rejailing of the SB in cases with a metallic carina. Final POT with the balloon positioned proximal to the SB takeoff was not associated with these potentially negative effects.
CONFLICT OF INTEREST
The authors declare no conflicts of interest.
ACKNOWLEDGMENT
We wish to thank Dane Gerneke from Auckland Bioengineering Institute, Auckland University, for performing all microCT scans, and Jouke Djikstra, Division of Image Processing, Leiden University Medical Centre, The Netherlands, for providing the OCT analysis software.
Andreasen LN, Holm NR, Webber B, Ormiston JA. Critical aspects of balloon position during final proximal optimization technique (POT) in coronary bifurcation stenting. Catheter Cardiovasc Interv. 2020;96:31–39. 10.1002/ccd.28801
EDITORIAL COMMENT: Expert Article Analysis for: Intervention in coronary bifurcation lesions: Staying on top of the proximal optimization technique (POT)
REFERENCES
- 1. Hoye A. The proximal optimisation technique for intervention of coronary bifurcations. Interv Cardiol. 2017;12:110‐115. [DOI] [PMC free article] [PubMed] [Google Scholar]
- 2. Lassen JF, Burzotta F, Banning AP, et al. Percutaneous coronary intervention for the left main stem and other bifurcation lesions: 12th consensus document from the European Bifurcation Club. EuroIntervention. 2018;13:1540‐1553. [DOI] [PubMed] [Google Scholar]
- 3. Foin N, Secco GG, Ghilencea L, Krams R, Di Mario C. Final proximal post‐dilatation is necessary after kissing balloon in bifurcation stenting. EuroIntervention. 2011;7:597‐604. [DOI] [PubMed] [Google Scholar]
- 4. Finet G, Derimay F, Motreff P, et al. Comparative analysis of sequential proximal optimizing technique versus kissing balloon inflation technique in provisional bifurcation stenting: fractal coronary bifurcation bench test. JACC Cardiovasc Interv. 2015;8:1308‐1317. [DOI] [PubMed] [Google Scholar]
- 5. Murasato Y, Mori T, Okamura T, Shite J. Influence of the sequence of proximal optimisation technique and side branch dilation for the opening of jailed struts after coronary bifurcation stenting. EuroIntervention. 2018;13:e1812‐e1813. [DOI] [PubMed] [Google Scholar]
- 6. Rab T, Sheiban I, Louvard Y, Sawaya FJ, Zhang JJ, Chen SL. Current interventions for the left main bifurcation. JACC Cardiovasc Interv. 2017;10:849‐865. [DOI] [PubMed] [Google Scholar]
- 7. Derimay F, Finet G, Souteyrand G, et al. Benefit of a new provisional stenting strategy, the re‐proximal optimisation technique: the rePOT clinical study. EuroIntervention. 2018;14:e325‐e332. [DOI] [PubMed] [Google Scholar]
- 8. Gwon HC. Understanding the coronary bifurcation stenting. Korean Circ J. 2018;48:481‐491. [DOI] [PMC free article] [PubMed] [Google Scholar]
- 9. Holm NR, Andreasen LN, Christiansen EH. Keep bifurcation stenting simple and cheap or controlled and optimised? EuroIntervention. 2018;13:e1741‐e1743. [DOI] [PubMed] [Google Scholar]
- 10. Louvard Y, Thomas M, Dzavik V, et al. Classification of coronary artery bifurcation lesions and treatments: time for a consensus! Catheter Cardiovasc Interv. 2008;71:175‐183. [DOI] [PubMed] [Google Scholar]
- 11. Ormiston JA, Webster MW, Webber B, Stewart JT, Ruygrok PN, Hatrick RI. The "crush" technique for coronary artery bifurcation stenting: insights from micro‐computed tomographic imaging of bench deployments. JACC Cardiovasc Interv. 2008;1:351‐357. [DOI] [PubMed] [Google Scholar]
- 12. Murray CD. The physiological principle of minimum work: I. the vascular system and the cost of blood volume. Proc Natl Acad Sci U S A. 1926;12:207‐214. [DOI] [PMC free article] [PubMed] [Google Scholar]
- 13. Finet G, Gilard M, Perrenot B, et al. Fractal geometry of arterial coronary bifurcations: a quantitative coronary angiography and intravascular ultrasound analysis. EuroIntervention. 2008;3:490‐498. [DOI] [PubMed] [Google Scholar]
- 14. Hakim D, Chatterjee A, Alli O, et al. Role of proximal optimization technique guided by intravascular ultrasound on stent expansion, stent symmetry index, and side‐branch hemodynamics in patients with coronary bifurcation lesions. Circ Cardiovasc Interv. 2017;10:e005535. [DOI] [PubMed] [Google Scholar]
- 15. Foin N, Torii R, Alegria E, et al. Location of side branch access critically affects results in bifurcation stenting: insights from bench modeling and computational flow simulation. Int J Cardiol. 2013;168:3623‐3628. [DOI] [PubMed] [Google Scholar]
- 16. Guerin P, Pilet P, Finet G, et al. Drug‐eluting stents in bifurcations: bench study of strut deformation and coating lesions. Circ Cardiovasc Interv. 2010;3:120‐126. [DOI] [PubMed] [Google Scholar]
- 17. Mortier P, Hikichi Y, Foin N, et al. Provisional stenting of coronary bifurcations: insights into final kissing balloon post‐dilation and stent design by computational modeling. JACC Cardiovasc Interv. 2014;7:325‐333. [DOI] [PubMed] [Google Scholar]
- 18. Foin N, Torii R, Mortier P, et al. Kissing balloon or sequential dilation of the side branch and main vessel for provisional stenting of bifurcations: lessons from micro‐computed tomography and computational simulations. JACC Cardiovasc Interv. 2012;5:47‐56. [DOI] [PubMed] [Google Scholar]
- 19. Otake H, Shite J, Ako J, et al. Local determinants of thrombus formation following sirolimus‐eluting stent implantation assessed by optical coherence tomography. JACC Cardiovasc Interv. 2009;2:459‐466. [DOI] [PubMed] [Google Scholar]
- 20. Hoffmann R, Mintz GS, Dussaillant GR, et al. Patterns and mechanisms of in‐stent restenosis. A serial intravascular ultrasound study. Circulation. 1996;94:1247‐1254. [DOI] [PubMed] [Google Scholar]
- 21. Darremont O, Leymarie JL, Lefevre T, Albiero R, Mortier P, Louvard Y. Technical aspects of the provisional side branch stenting strategy. EuroIntervention. 2015;11(suppl V):V86‐V90. [DOI] [PubMed] [Google Scholar]
- 22. Hebsgaard L, Nielsen TM, Tu S, et al. Co‐registration of optical coherence tomography and X‐ray angiography in percutaneous coronary intervention. The Does Optical Coherence Tomography Optimize Revascularization (DOCTOR) fusion study. Int J Cardiol. 2015;182:272‐278. [DOI] [PubMed] [Google Scholar]
- 23. Murasato Y, Finet G, Foin N. Final kissing balloon inflation: the whole story. EuroIntervention. 2015;11(suppl V):V81‐V85. [DOI] [PubMed] [Google Scholar]
- 24. Alegria‐Barrero E, Foin N, Chan PH, et al. Optical coherence tomography for guidance of distal cell recrossing in bifurcation stenting: choosing the right cell matters. EuroIntervention. 2012;8:205‐213. [DOI] [PubMed] [Google Scholar]
- 25. Okamura T, Nagoshi R, Fujimura T, et al. Impact of guidewire recrossing point into stent jailed side branch for optimal kissing balloon dilatation: core lab 3D optical coherence tomography analysis. EuroIntervention. 2018;13:e1785‐e1793. [DOI] [PubMed] [Google Scholar]
- 26. Burzotta F, Dzavik V, Ferenc M, Trani C, Stankovic G. Technical aspects of the T and small protrusion (TAP) technique. EuroIntervention. 2015;11(suppl V):V91‐V95. [DOI] [PubMed] [Google Scholar]
- 27. Derimay F, Souteyrand G, Motreff P, Rioufol G, Finet G. Influence of platform design of six different drug‐eluting stents in provisional coronary bifurcation stenting by rePOT sequence: a comparative bench analysis. EuroIntervention. 2017;13:e1092‐e1095. [DOI] [PubMed] [Google Scholar]
- 28. Ormiston JA, Webster MW, Ruygrok PN, Stewart JT, White HD, Scott DS. Stent deformation following simulated side‐branch dilatation: a comparison of five stent designs. Catheter Cardiovasc Interv. 1999;47:258‐264. [DOI] [PubMed] [Google Scholar]
- 29. Karanasos A, Tu S, van Ditzhuijzen NS, et al. A novel method to assess coronary artery bifurcations by OCT: cut‐plane analysis for side‐branch ostial assessment from a main‐vessel pullback. Eur Heart J Cardiovasc Imaging. 2015;16:177‐189. [DOI] [PubMed] [Google Scholar]
- 30. Niemela M, Kervinen K, Erglis A, et al. Randomized comparison of final kissing balloon dilatation versus no final kissing balloon dilatation in patients with coronary bifurcation lesions treated with main vessel stenting: the Nordic‐Baltic Bifurcation Study III. Circulation. 2011;123:79‐86. [DOI] [PubMed] [Google Scholar]
- 31. Rigatelli G, Zuin M, Dell'Avvocata F, et al. Evaluation of coronary flow conditions in complex coronary artery bifurcations stenting using computational fluid dynamics: impact of final proximal optimization technique on different double‐stent techniques. Cardiovasc Revasc Med. 2017;18:233‐240. [DOI] [PubMed] [Google Scholar]
- 32. Behan MW, Holm NR, de Belder AJ, et al. Coronary bifurcation lesions treated with simple or complex stenting: 5‐year survival from patient‐level pooled analysis of the Nordic Bifurcation Study and the British Bifurcation Coronary Study. Eur Heart J. 2016;37:1923‐1928. [DOI] [PubMed] [Google Scholar]
- 33. Hong MK, Mintz GS, Lee CW, et al. Intravascular ultrasound predictors of angiographic restenosis after sirolimus‐eluting stent implantation. Eur Heart J. 2006;27:1305‐1310. [DOI] [PubMed] [Google Scholar]
- 34. Sonoda S, Morino Y, Ako J, et al. Impact of final stent dimensions on long‐term results following sirolimus‐eluting stent implantation: serial intravascular ultrasound analysis from the sirius trial. J Am Coll Cardiol. 2004;43:1959‐1963. [DOI] [PubMed] [Google Scholar]